Embed Size (px)
Citation preview
April 2018
AQUACULTURE SUB-SECTOR SKILLS PLAN
2018-2019
Prepared on behalf of the Sector by AgriSETA
ABBREVIATION/ACRONYM DESCRIPTION
AASA Aquaculture Association of South Africa
ADEP Aquaculture Development and Enhancement Programme
AFASA Abalone Farmers Association of South Africa
AFASA African Farmers Association of South Africa
AGOA African Growth and Opportunity Act
AGRISETA Agricultural Sector Education and Training Authority
APAP Agricultural Policy Action Plan
ATR Annual Training Report
BSASA Bivalve Shellfish Farmers Association of South Africa
BMI Business Monitor International
CASP Comprehensive Agriculture Support Programme
CoS Centres of Specialization
DAFF Department of Agriculture, Fisheries and Forestry
DHET Department of Higher Education and Training
DRDLR Department of Rural Development and Land Reform
DTI Department of Trade and Industry
FETMIS Further Education and Training Management Information System
GDP Gross Domestic Product
HEMIS Higher Education Management Information System
HSRC Human Sciences Research Council
HTFV Hard To Fill Vacancies
IGDP Integrated Growth Development Plan
IDP Integrated Development Plan
IPAP Industrial Policy Action Plan
IRR Institute of Race relations
KZN KwaZulu-Natal
ABBREVIATIONS AND ACRONYMS
ii
MAFISA Micro Agricultural Financial Institution of South Africa
MFFASA Marine Finfish Farmers Association of South Africa
MTF Mpumalanga Trout Forum
NAFU National African Farmers Union
NAMC National Agricultural Marketing Council
NDP National Development Plan
NERPO National Emergent Red Meat Producers Organization
NGP New Growth Path
NEETS Not in Employment, Education or Training
NSDS III National Skills Development Strategy III
NSFAS National Students Financial Aid Scheme
QLFS Quarterly Labour Force Survey
QCTO Quality Council for Trade and Occupations
RPL Recognition of Prior Learning
SAAA South African Aquaculture Association
SACAU Southern African Confederation of African Unions
SADC Southern African Development Community
SAIVCET South African Institute for Vocational Continuing Education and
Training
SAQA South African Qualifications Authority
SARS South African Revenue Service
SDA Skills Development Act
SIC Standard Integrated Project
SIP Standard Industrial Classification
SSC Sub-sector Committee
SSP Sector Skills Plan
SIZA Sustainability Initiative of South Africa
STATSSA Statistics South Africa
TAUSA Transvaal Agricultural Union South Africa
TLUSA Farmers Union
TVET Technical Vocational Education and Training

iii
WAVMA World Aquatic Veterinary Medical Association
WCTA Western Cape Trout Association
WSP Workplace Skills Plan
WTO World Trade Organization
WWF World Wildlife Foundation

ABBREVIATIONS AND ACRONYMS ..................................................................................................................................................... i
TABLE OF CONTENTS ....................................................................................................................................................................... iv
EXECUTIVE SUMMARY ..................................................................................................................................................................... vi
CHAPTER 1: SECTOR PROFILE ............................................................................................................................................................ 1
1. INTRODUCTION .................................................................................................................................................................. 1
1.1 SCOPE OF COVERAGE .................................................................................................................................................... 1
1.2 KEY ROLE-PLAYERS ........................................................................................................................................................ 3
1.3 ECONOMIC PERFORMANCE........................................................................................................................................... 6
1.4 EMPLOYER PROFILE ....................................................................................................................................................... 7
1.5 LABOUR MARKET PROFILE ............................................................................................................................................. 9
1.6 CONCLUSION ............................................................................................................................................................... 12
CHAPTER 2: KEY SKILLS ISSUES ........................................................................................................................................................ 14
2.1 INTRODUCTION ........................................................................................................................................................... 14
2.2 ALIGNMENT OF SKILLS PLANNING TO NATIONAL STRATEGIES AND PLANS ................................................................ 14
2.3 PESTEL ......................................................................................................................................................................... 15
2.4 CHANGE DRIVERS ........................................................................................................................................................ 16
2.5 IMPLICATIONS FOR SKILLS PLANNING ......................................................................................................................... 17
2.6 CONCLUSIONS ............................................................................................................................................................. 18
CHAPTER 3: OCCUPATIONAL SHORTAGES AND SKILLS GAPS MISMATCHES ................................................................................... 19
3.1 INTRODUCTION ........................................................................................................................................................... 19
3.2 EXTENT AND NATURE OF SKILLS DEMAND .................................................................................................................. 20
3.3 SCARCE AND TOP UP SKILLS ........................................................................................................................................ 21
3.4 EXTENT AND NATURE OF SUPPLY ................................................................................................................................ 22
3.5 PIVOTAL LIST ................................................................................................................................................................ 24
3.6 CONCLUSIONS ............................................................................................................................................................. 26
CHAPTER 4: SECTOR PARTNERSHIPS ............................................................................................................................................... 27
4.1 INTRODUCTION ........................................................................................................................................................... 27
4.2 PARTNERSHIPS............................................................................................................................................................. 27
4.3 CONCLUSIONS ............................................................................................................................................................. 29
CHAPTER 5: SKILLS PRIORITY ACTIONS ........................................................................................................................................... 30
5.1 INTRODUCTION ........................................................................................................................................................... 30
5.2 KEY FINDINGS FROM PREVIOUS CHAPTERS ................................................................................................................. 30
5.3 CONCLUSIONS AND RECOMMENDED ACTIONS .......................................................................................................... 31
BIBLIOGRAPHY ................................................................................................................................................................................ 33
TABLE OF CONTENTS
v
FIGURES
Figure 1: DISTRIBUTION OF AGRICULTURAL ENTITIES BY SUBSECTOR ......................................................... 3
Figure 2: PROVINCIAL DISTRIBUTION OF AQUACULTURE ENTITIES ............................................................. 7
Figure 3: RELATIVE SIZE DISTRIBUTION OF AQUACULTURE ENTERPRISES ................................................... 8
Figure 4: DISTRIBUTION OF THE AQUACULTURE WORKFORCE BY PROVINCE ............................................. 9
Figure 5: COMPOSITION OF THE AQUACULTURE WORKFORCE ................................................................. 10
Figure 6: EDUCATIONAL DISTRIBUTION OF EMPLOYEES ............................................................................ 11
TABLES
Table 1: RESEARCH PROCESS AND METHODS ............................................................................................ vii
Table 2: ACTIVITIES WITHIN THE AQUACULTURE SUBSECTOR BY SIC CODE ................................................ 2
Table 3: KEY AGRICULTURAL ROLE-PLAYERS ................................................................................................ 4
Table 4: KEY AQUACULTURE ROLE-PLAYERS................................................................................................. 5
Table 5: UNIQUE OCCUPATIONS IN THE AQUACULTURE INDUSTRY .......................................................... 12
Table 6: PESTEL FOR THE AQUACULTURE INDUSTRY ................................................................................. 15
Table 7: SWOT ANALYSIS ............................................................................................................................ 20
Table 8: HTFV IN THE AQUACULTURE INDUSTRY ....................................................................................... 20
Table 9: FURTHER AND HIGHER EDUCATION PROVISION IN AQUACULTURE ............................................ 22
Table 10: SCARCE AND CRITICAL SKILLS AND PIVOTAL PROGRAMMES ..................................................... 25
Table 11: EXISTING PARTNERSHIPS ............................................................................................................. 27
Table 12: EMERGING PARTNERSHIPS ......................................................................................................... 28
vi
EXECUTIVE SUMMARY
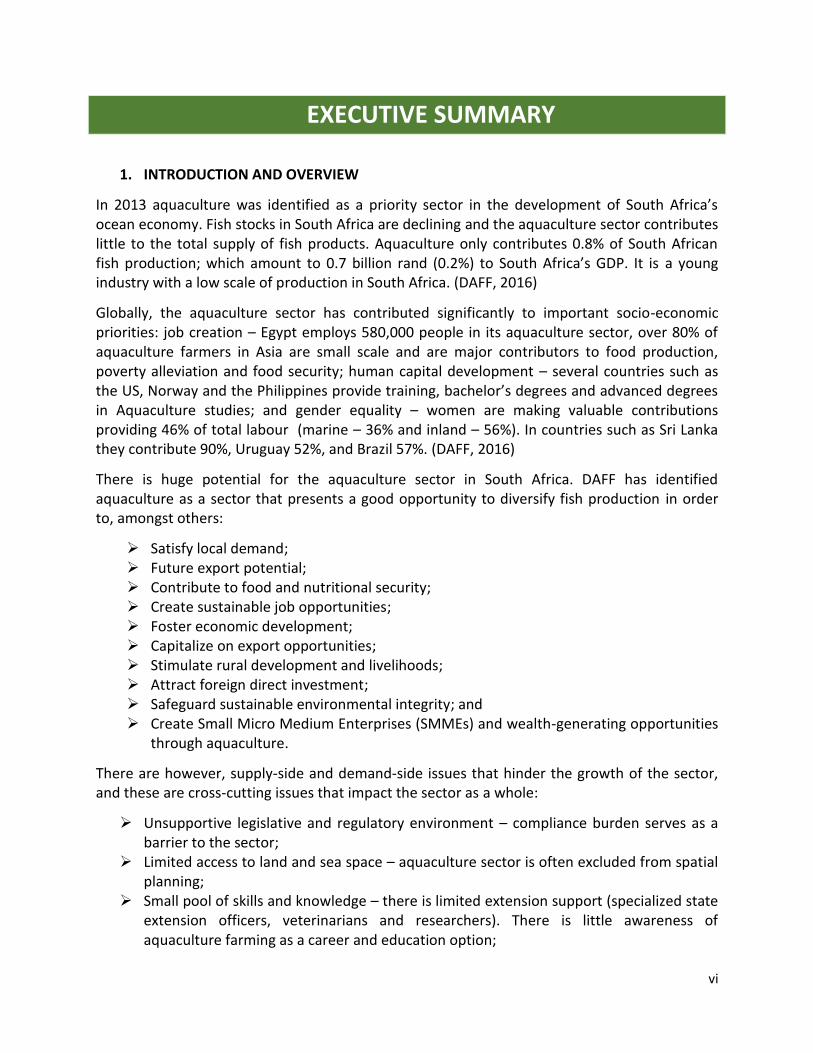
1. INTRODUCTION AND OVERVIEW
In 2013 aquaculture was identified as a priority sector in the development of South Africa’s ocean economy. Fish stocks in South Africa are declining and the aquaculture sector contributes little to the total supply of fish products. Aquaculture only contributes 0.8% of South African fish production; which amount to 0.7 billion rand (0.2%) to South Africa’s GDP. It is a young industry with a low scale of production in South Africa. (DAFF, 2016)
Globally, the aquaculture sector has contributed significantly to important socio-economic priorities: job creation – Egypt employs 580,000 people in its aquaculture sector, over 80% of aquaculture farmers in Asia are small scale and are major contributors to food production, poverty alleviation and food security; human capital development – several countries such as the US, Norway and the Philippines provide training, bachelor’s degrees and advanced degrees in Aquaculture studies; and gender equality – women are making valuable contributions providing 46% of total labour (marine – 36% and inland – 56%). In countries such as Sri Lanka they contribute 90%, Uruguay 52%, and Brazil 57%. (DAFF, 2016)
There is huge potential for the aquaculture sector in South Africa. DAFF has identified aquaculture as a sector that presents a good opportunity to diversify fish production in order to, amongst others:
Satisfy local demand; Future export potential; Contribute to food and nutritional security; Create sustainable job opportunities; Foster economic development; Capitalize on export opportunities; Stimulate rural development and livelihoods; Attract foreign direct investment; Safeguard sustainable environmental integrity; and Create Small Micro Medium Enterprises (SMMEs) and wealth-generating opportunities
through aquaculture.
There are however, supply-side and demand-side issues that hinder the growth of the sector, and these are cross-cutting issues that impact the sector as a whole:
Unsupportive legislative and regulatory environment – compliance burden serves as a barrier to the sector;
Limited access to land and sea space – aquaculture sector is often excluded from spatial planning;
Small pool of skills and knowledge – there is limited extension support (specialized state extension officers, veterinarians and researchers). There is little awareness of aquaculture farming as a career and education option;
vii
Access to finance – aquaculture sector faces difficulty in accessing finance as it is not well understood by financial institutions and deemed to be a high-risk sector; and
Limited accessibility of markets – undeveloped value chains and limited market intelligence has led to fragmented marketing efforts.
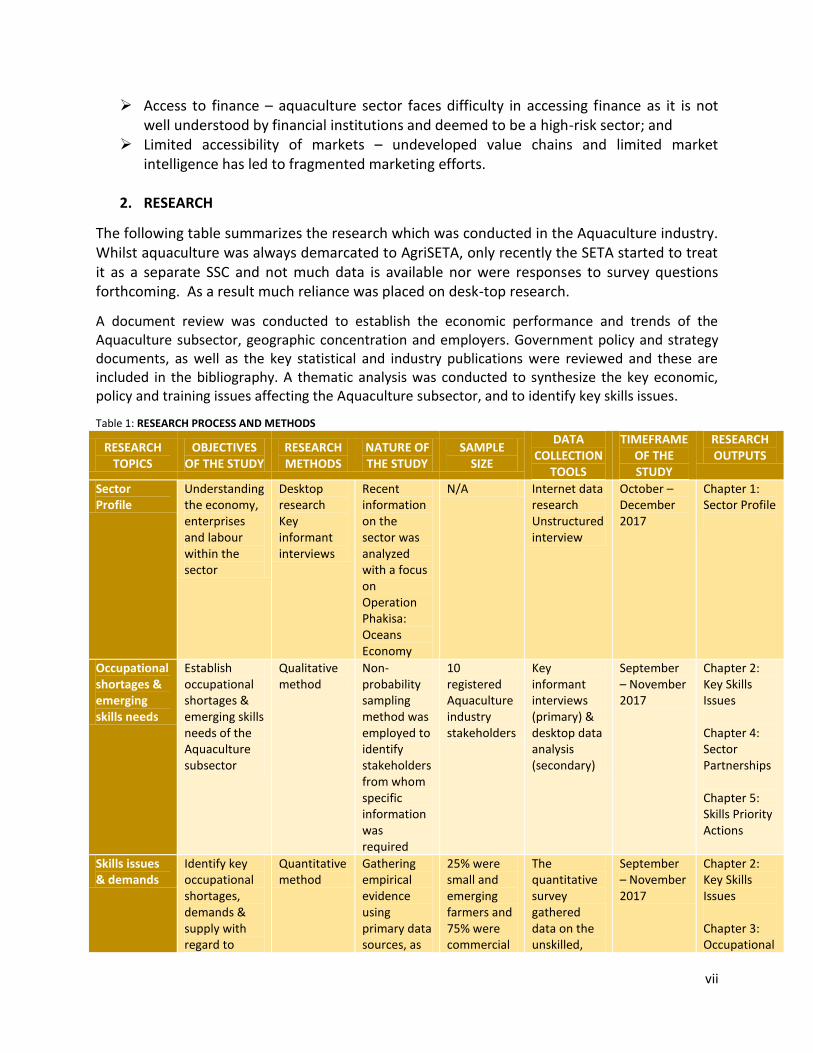
2. RESEARCH
The following table summarizes the research which was conducted in the Aquaculture industry. Whilst aquaculture was always demarcated to AgriSETA, only recently the SETA started to treat it as a separate SSC and not much data is available nor were responses to survey questions forthcoming. As a result much reliance was placed on desk-top research.
A document review was conducted to establish the economic performance and trends of the Aquaculture subsector, geographic concentration and employers. Government policy and strategy documents, as well as the key statistical and industry publications were reviewed and these are included in the bibliography. A thematic analysis was conducted to synthesize the key economic, policy and training issues affecting the Aquaculture subsector, and to identify key skills issues.
Table 1: RESEARCH PROCESS AND METHODS
RESEARCH TOPICS
OBJECTIVES OF THE STUDY
RESEARCH METHODS
NATURE OF THE STUDY
SAMPLE SIZE
DATA COLLECTION
TOOLS
TIMEFRAME OF THE STUDY
RESEARCH OUTPUTS
Sector Profile
Understanding the economy, enterprises and labour within the sector
Desktop research Key informant interviews
Recent information on the sector was analyzed with a focus on Operation Phakisa: Oceans Economy
N/A Internet data research Unstructured interview
October – December 2017
Chapter 1: Sector Profile
Occupational shortages & emerging skills needs
Establish occupational shortages & emerging skills needs of the Aquaculture subsector
Qualitative method
Non-probability sampling method was employed to identify stakeholders from whom specific information was required
10 registered Aquaculture industry stakeholders
Key informant interviews (primary) & desktop data analysis (secondary)
September – November 2017
Chapter 2: Key Skills Issues Chapter 4: Sector Partnerships Chapter 5: Skills Priority Actions
Skills issues & demands
Identify key occupational shortages, demands & supply with regard to
Quantitative method
Gathering empirical evidence using primary data sources, as
25% were small and emerging farmers and 75% were commercial
The quantitative survey gathered data on the unskilled,
September – November 2017
Chapter 2: Key Skills Issues Chapter 3: Occupational
viii
unskilled, skilled, generic Aquaculture subsector occupations and emerging skills needs in the agricultural sector
well as undertaking theoretical, desktop research using secondary data sources
farmers
skilled and generic occupational shortages & skills gaps
Shortages and Skills Gaps
Sector Partnerships
Identify key AgriSETA partnerships
Desktop research
New sub-sector – search for possible partnerships
N/A N/A October – December 2017
Chapter 4: Sector Partnerships
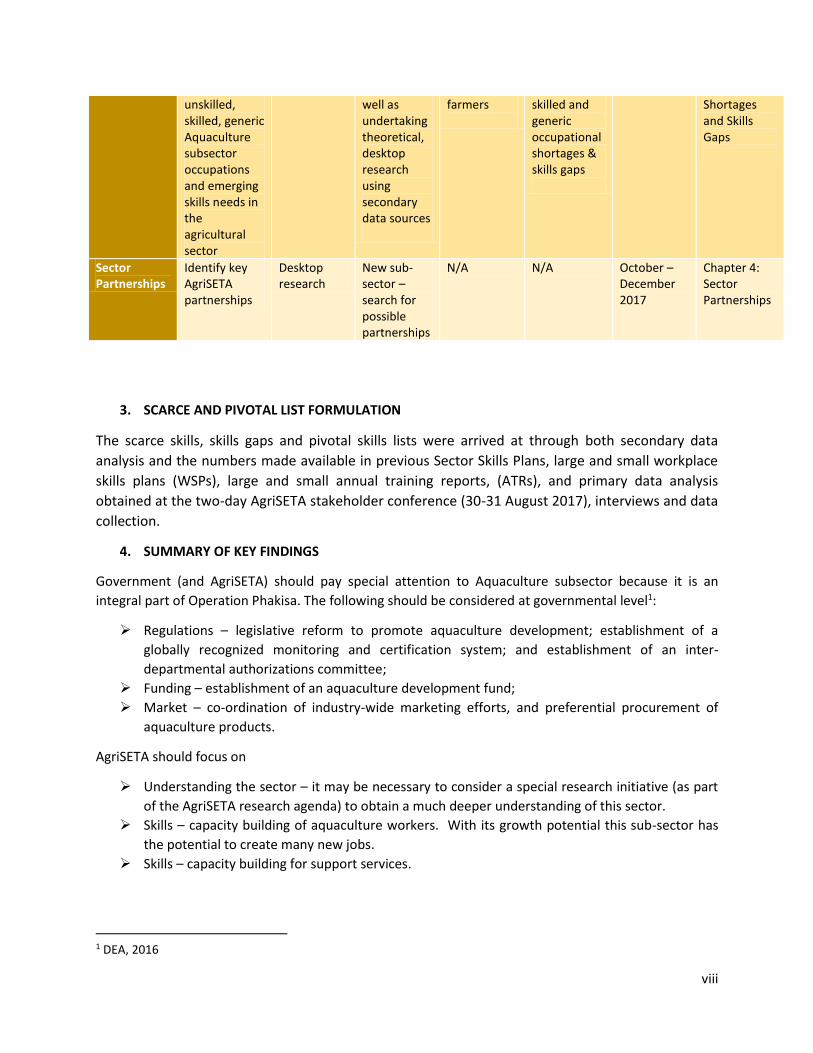
3. SCARCE AND PIVOTAL LIST FORMULATION
The scarce skills, skills gaps and pivotal skills lists were arrived at through both secondary data
analysis and the numbers made available in previous Sector Skills Plans, large and small workplace
skills plans (WSPs), large and small annual training reports, (ATRs), and primary data analysis
obtained at the two-day AgriSETA stakeholder conference (30-31 August 2017), interviews and data
collection.
4. SUMMARY OF KEY FINDINGS
Government (and AgriSETA) should pay special attention to Aquaculture subsector because it is an
integral part of Operation Phakisa. The following should be considered at governmental level1:
Regulations – legislative reform to promote aquaculture development; establishment of a
globally recognized monitoring and certification system; and establishment of an inter-
departmental authorizations committee;
Funding – establishment of an aquaculture development fund;
Market – co-ordination of industry-wide marketing efforts, and preferential procurement of
aquaculture products.
AgriSETA should focus on
Understanding the sector – it may be necessary to consider a special research initiative (as part
of the AgriSETA research agenda) to obtain a much deeper understanding of this sector.
Skills – capacity building of aquaculture workers. With its growth potential this sub-sector has
the potential to create many new jobs.
Skills – capacity building for support services.
1 DEA, 2016

1
1. INTRODUCTION
Chapter 1 of this report provides an overview of the agricultural sector, paying particular attention to
the aquaculture subsector in South Africa. The first section of this chapter looks at the scope of the
Aquaculture subsector’s coverage. Followed by the second section, which outlines AgriSETA
stakeholders and key role-players in the Aquaculture sector. The third section looks at the economic
performance of the overall agricultural sector, zooming into the contribution of Aquaculture to the
South African economy. The fourth section explores the employer profile, based on the AgriSETA
WSP/ATR data submitted for 2017. Finally, the last section provides a labour market profile where the
number and demographics of people employed in the sector is explored. Essentially, chapter one of this
document is intended to set the scene for the skills issues delved into in the subsequent chapters.
1.1 SCOPE OF COVERAGE The scope of AgriSETA covers the agricultural sector, from input services to the farm, activities on the
farm and first level processing activities from the farm. The Aquaculture subsector is classified into a
single economic activity. The table below outlines the formal demarcation of the Aquaculture sub-
sector.
CHAPTER 1: SECTOR PROFILE
2
Table 2: ACTIVITIES WITHIN THE AQUACULTURE SUBSECTOR BY SIC CODE
SUBSECTOR SIC CODE SIC DESCRIPTION
Aquaculture 13000 Fishing, operation of fish hatcheries and fish farming
Source: AgriSETA, 2017
The Aquaculture sub-sector can be divided into two main categories;
Freshwater aquaculture consists mainly of freshwater species such as rainbow trout, brown
trout, Koi carp, crocodiles, ornamental fish, African catfish, Mozambique and Nile tilapia,
Marron and waterblommetjies.
Marine aquaculture consists of abalone, white prawns, oysters, seaweeds, Spanish & Brown
mussels, Dusky & Silver Kob; yellow tail, Atlantic Salmon, Clownfish, White Margined Sole, West
& East coast rock Lobster, Scallop and Blood Worms.
It is important to note that all freshwater aquaculture is demarcated to the AgriSETA but only coastal
marine aquaculture. Deep sea fish species and fishing activities are allocated to the Transport SETA
although many of the large fish factories chose to register with the Foodbev SETA. Some of the large
fishing companies have aquaculture farms on land and this forms part of their mainstream business
SETA registration (thus such aquaculture farms are than registered with, for instance, TETA
For purposes of this sub-sector skills plan the Aquaculture industry (as it relates to the AgriSETA) is
confined to farming with;
Abalone
Catfish
Marine Finfish
Ornamental fish
Rainbow trout
Shellfish
Tilapia
Overall, the agricultural sector comprises of 11 sub-sectors, each organized into a Sub-sector committee
tasked to represent their industry’s interest to AgriSETA. These are: Red meat, Horticulture,
Aquaculture, Fibre, Grain and Cereals, Pest Control, Milling, Pet foods, and Animal feeds, Seed, Poultry,
Sugar and Tobacco. The Aquaculture subsector constitutes 2% of the overall number of levy paying
entities to the AgriSETA. The graph below outlines the relative size of membership number by
subsectors, as captured in the AgriSETA member database of 2017.
3
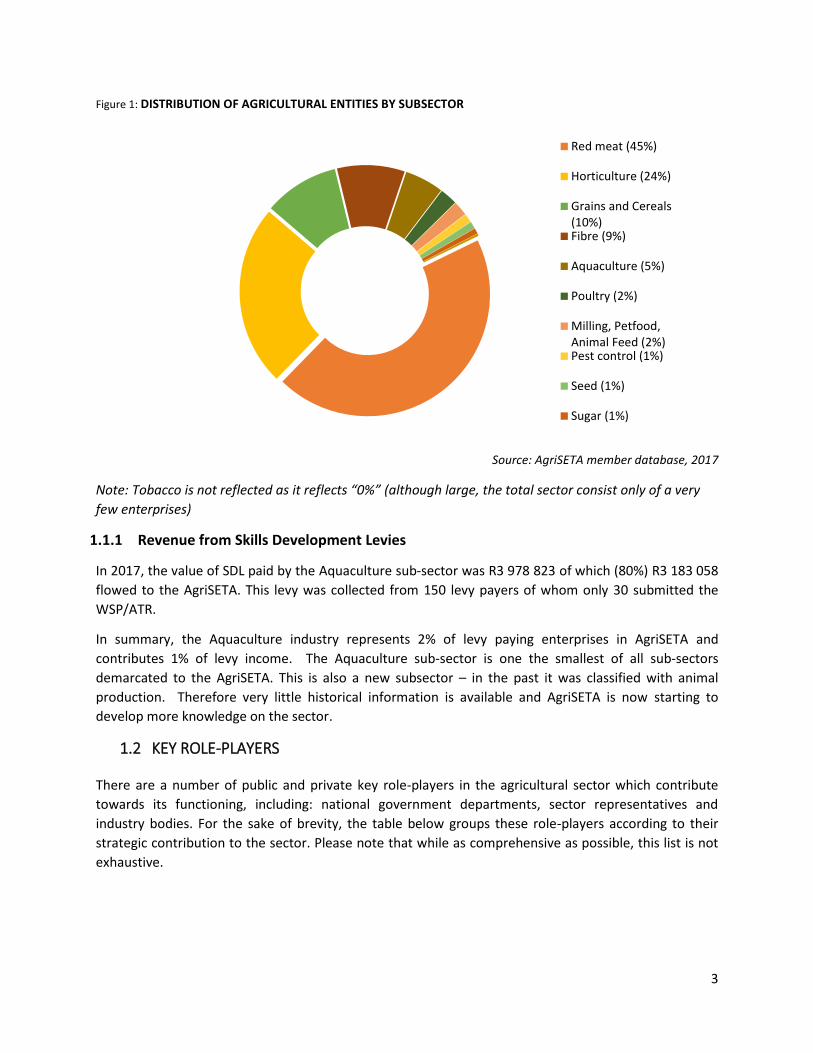
Figure 1: DISTRIBUTION OF AGRICULTURAL ENTITIES BY SUBSECTOR
Source: AgriSETA member database, 2017
Note: Tobacco is not reflected as it reflects “0%” (although large, the total sector consist only of a very
few enterprises)
1.1.1 Revenue from Skills Development Levies
In 2017, the value of SDL paid by the Aquaculture sub-sector was R3 978 823 of which (80%) R3 183 058
flowed to the AgriSETA. This levy was collected from 150 levy payers of whom only 30 submitted the
WSP/ATR.
In summary, the Aquaculture industry represents 2% of levy paying enterprises in AgriSETA and
contributes 1% of levy income. The Aquaculture sub-sector is one the smallest of all sub-sectors
demarcated to the AgriSETA. This is also a new subsector – in the past it was classified with animal
production. Therefore very little historical information is available and AgriSETA is now starting to
develop more knowledge on the sector.
1.2 KEY ROLE-PLAYERS
There are a number of public and private key role-players in the agricultural sector which contribute
towards its functioning, including: national government departments, sector representatives and
industry bodies. For the sake of brevity, the table below groups these role-players according to their
strategic contribution to the sector. Please note that while as comprehensive as possible, this list is not
exhaustive.
Red meat (45%)
Horticulture (24%)
Grains and Cereals(10%)Fibre (9%)
Aquaculture (5%)
Poultry (2%)
Milling, Petfood,Animal Feed (2%)Pest control (1%)
Seed (1%)
Sugar (1%)
4
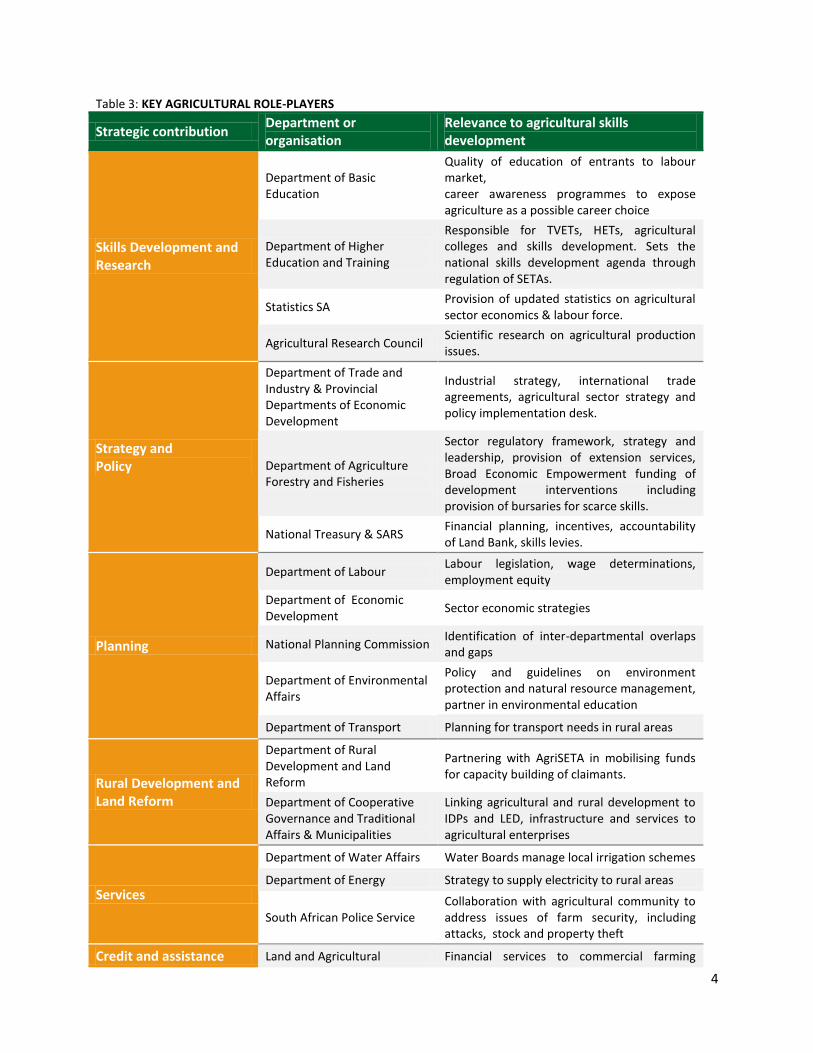
Table 3: KEY AGRICULTURAL ROLE-PLAYERS
Strategic contribution Department or organisation
Relevance to agricultural skills development
Skills Development and Research
Department of Basic Education
Quality of education of entrants to labour market, career awareness programmes to expose agriculture as a possible career choice
Department of Higher Education and Training
Responsible for TVETs, HETs, agricultural colleges and skills development. Sets the national skills development agenda through regulation of SETAs.
Statistics SA Provision of updated statistics on agricultural sector economics & labour force.
Agricultural Research Council Scientific research on agricultural production issues.
Strategy and Policy
Department of Trade and Industry & Provincial Departments of Economic Development
Industrial strategy, international trade agreements, agricultural sector strategy and policy implementation desk.
Department of Agriculture Forestry and Fisheries
Sector regulatory framework, strategy and leadership, provision of extension services, Broad Economic Empowerment funding of development interventions including provision of bursaries for scarce skills.
National Treasury & SARS Financial planning, incentives, accountability of Land Bank, skills levies.
Planning
Department of Labour Labour legislation, wage determinations, employment equity
Department of Economic Development
Sector economic strategies
National Planning Commission Identification of inter-departmental overlaps and gaps
Department of Environmental Affairs
Policy and guidelines on environment protection and natural resource management, partner in environmental education
Department of Transport Planning for transport needs in rural areas
Rural Development and Land Reform
Department of Rural Development and Land Reform
Partnering with AgriSETA in mobilising funds for capacity building of claimants.
Department of Cooperative Governance and Traditional Affairs & Municipalities
Linking agricultural and rural development to IDPs and LED, infrastructure and services to agricultural enterprises
Services
Department of Water Affairs Water Boards manage local irrigation schemes
Department of Energy Strategy to supply electricity to rural areas
South African Police Service Collaboration with agricultural community to address issues of farm security, including attacks, stock and property theft
Credit and assistance Land and Agricultural Financial services to commercial farming
5
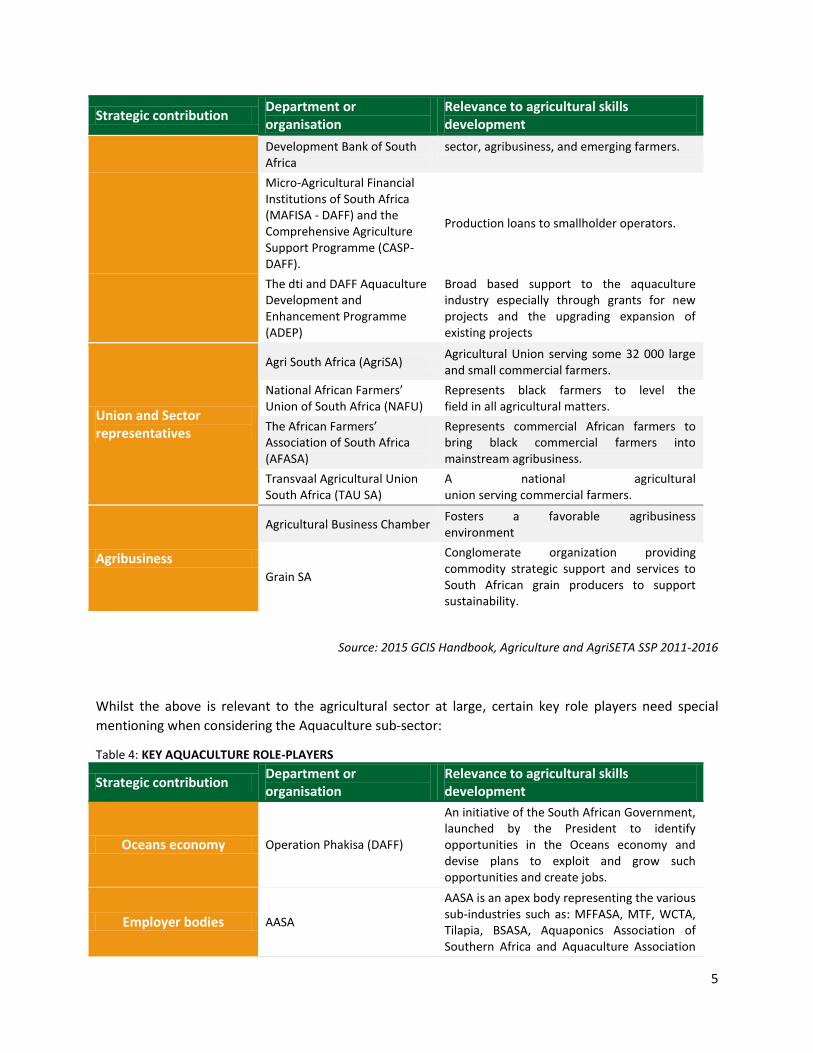
Strategic contribution Department or organisation
Relevance to agricultural skills development
Development Bank of South Africa
sector, agribusiness, and emerging farmers.
Micro-Agricultural Financial Institutions of South Africa (MAFISA - DAFF) and the Comprehensive Agriculture Support Programme (CASP- DAFF).
Production loans to smallholder operators.
The dti and DAFF Aquaculture Development and Enhancement Programme (ADEP)
Broad based support to the aquaculture industry especially through grants for new projects and the upgrading expansion of existing projects
Union and Sector representatives
Agri South Africa (AgriSA) Agricultural Union serving some 32 000 large and small commercial farmers.
National African Farmers’ Union of South Africa (NAFU)
Represents black farmers to level the field in all agricultural matters.
The African Farmers’ Association of South Africa (AFASA)
Represents commercial African farmers to bring black commercial farmers into mainstream agribusiness.
Transvaal Agricultural Union South Africa (TAU SA)
A national agricultural union serving commercial farmers.
Agribusiness
Agricultural Business Chamber Fosters a favorable agribusiness environment
Grain SA
Conglomerate organization providing commodity strategic support and services to South African grain producers to support sustainability.
Source: 2015 GCIS Handbook, Agriculture and AgriSETA SSP 2011-2016
Whilst the above is relevant to the agricultural sector at large, certain key role players need special
mentioning when considering the Aquaculture sub-sector:
Table 4: KEY AQUACULTURE ROLE-PLAYERS
Strategic contribution Department or organisation
Relevance to agricultural skills development
Oceans economy Operation Phakisa (DAFF)
An initiative of the South African Government, launched by the President to identify opportunities in the Oceans economy and devise plans to exploit and grow such opportunities and create jobs.
Employer bodies AASA
AASA is an apex body representing the various sub-industries such as: MFFASA, MTF, WCTA, Tilapia, BSASA, Aquaponics Association of Southern Africa and Aquaculture Association
6
Strategic contribution Department or organisation
Relevance to agricultural skills development
of South Africa (AASA).
International linkages
WAVMA
The mission of the WAVMA is to serve the discipline of aquatic veterinary medicine in enhancing aquatic animal health and welfare, public health and seafood safety, in support of the veterinary profession, aquatic animal owners and industries, and other stakeholders.
Marine Farmers Association of Namibia
Although not directly relevant, the Namibian Mariculture Association was established in order to preserve and promote the interests of the members of the Mariculture industry in Namibia. The South African and Namibian structures interact with each other.
1.3 ECONOMIC PERFORMANCE
1.3.1 Overview
Overall, agriculture contributes 2, 4% to South Africa’s gross domestic product (GDP) and 4, 4% of total
employment (IRR, 2016). Notwithstanding the relatively small share of the total GDP, primary
agriculture is an important sector in the South African economy; the value of primary agricultural
production in South Africa was R263,2 billion in 2016, while its contribution to the GDP was estimated at
R72,2 billion in 2015 (DAFF, 2016). In addition, the sector plays an important role in job creation,
especially in the more rural parts of the country.
Aquaculture in South Africa is a young industry with low volume of production. The following are facts
extracted by DAFF in preparation for Operation Phakisa: Oceans economy in 2015:
Annual production: 4 000 tonnes of which 28% is freshwater and 72% marine. This represents
only 0,8% of all fish products produced in South Africa;
More than 50% of aquaculture farms are located in the Western Cape;
It is an untransformed sector with only 10% PDI participation in management;
2 227 jobs created; and
Aquaculture contributes R0, 7 billion or 0, 2% to the South African GDP.
1.3.2 Economic Outlook of the Aquaculture Sub-Sector
Currently, the Aquaculture sector in South Africa is at a very small scale and faces a number of challenges. Production is focused on a few high-value species, such as abalone, oysters, mussels, finfish and trout – driven mainly by the high cost of production. Other challenges include regulatory barriers, difficulty in accessing funding, poor access to markets, limited pool of skills, poor access to quality inputs, fragmented R&D, limited infrastructure in rural areas and inclusivity in the sector.
7
The Operation Phakisa: Oceans economy lab however set a target for the sector to grow from R0, 67 billion to R3 billion representing 20 000 tonnes per annum by 2030. This will result in the growth of jobs from 2 227 to 15 000 by 2033. This is not unrealistic considering that nations with similar coastline length produce up to 1 000 times more in volume as South Africa. Whilst aquaculture represents 0,8% of fish products produced in South Africa, globally it represents 44% and is growing by 7,2% annually whilst sea harvest only grow by 0,9% annually – worldwide there is a clear shift towards aquaculture. It is estimated that whilst the GDP contribution of aquaculture in South Africa is expected to grow by 6% per annum between 2012 and 2033, employment is projected to grow by 15% per annum.
1.4 EMPLOYER PROFILE
According to SARS there are 1 049 registered Aquaculture industry employers in South Africa. Of them,
150 are paying the skills levy and 30 are submitting the WSP/ATR. Using the levy paying companies as a
proxy, it is clear from the following graph that the vast majority of all Aquaculture enterprises are to be
found in the Western Cape and Eastern Cape. The third largest province is Mpumalanga with 10% of all
Aquaculture enterprises. All the other provinces have less than 10% representation.
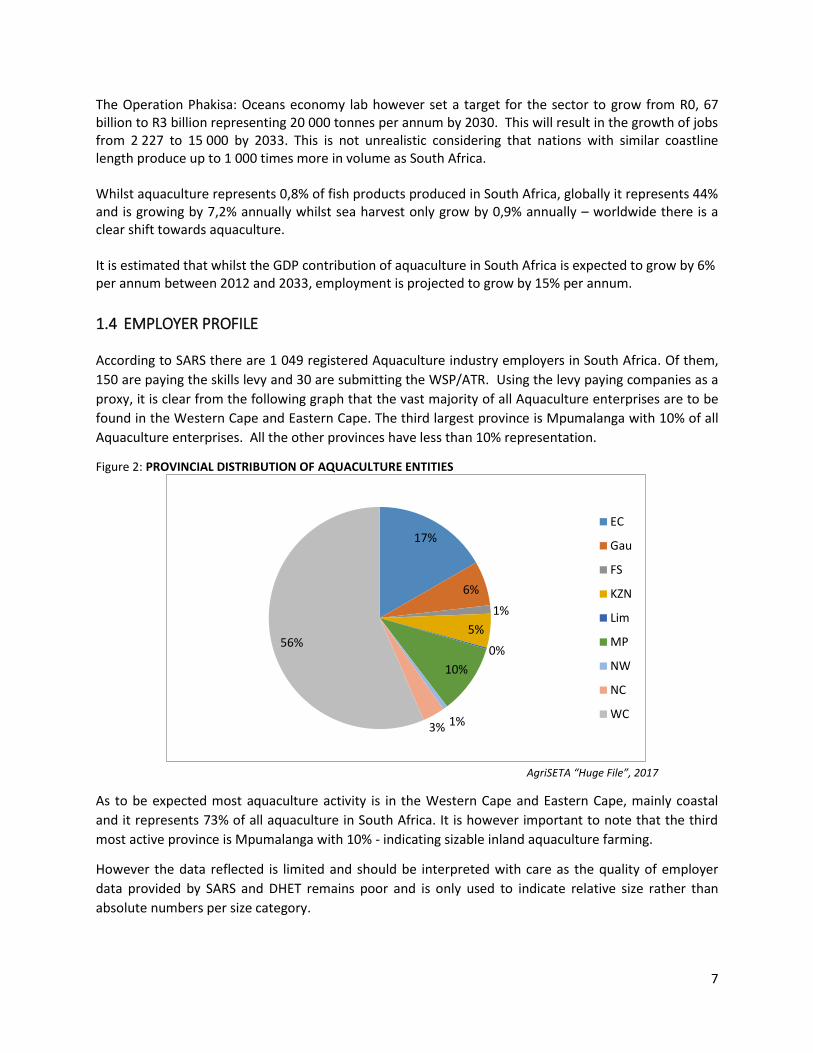
Figure 2: PROVINCIAL DISTRIBUTION OF AQUACULTURE ENTITIES
AgriSETA “Huge File”, 2017
As to be expected most aquaculture activity is in the Western Cape and Eastern Cape, mainly coastal
and it represents 73% of all aquaculture in South Africa. It is however important to note that the third
most active province is Mpumalanga with 10% - indicating sizable inland aquaculture farming.
However the data reflected is limited and should be interpreted with care as the quality of employer
data provided by SARS and DHET remains poor and is only used to indicate relative size rather than
absolute numbers per size category.
17%
6%
1%
5%
0%
10%
1%3%
56%
EC
Gau
FS
KZN
Lim
MP
NW
NC
WC

8
The following table distributes those that are registered with AgriSETA. 2
Figure 3: RELATIVE SIZE DISTRIBUTION OF AQUACULTURE ENTERPRISES
Small = 0 – 49 employees
Medium = 50 – 149 employees
Large = 150+ employees
AgriSETA “Huge File”, 2017
Aquaculture is in essence a small scale sector. This is then also the reason why only 3% of SARS
registered enterprises or 20% of levy payers submit the WSP/ATR – it is not worth the effort as the
mandatory payment from the SETA does not justify the effort to develop the WSP/ATR.
1.4.1 Small Scale and Subsistence Farming (Under-Resourced)
No formal information is as yet available on the small scale farming component of the industry. However
through engagement with the industry the following picture is emerging;
It is estimated that about one-third of all aquaculture farmers (±100 farmers) can be regarded as
under-resourced but they only produce about 15% of the output of the sector.
There is evidence that as subsistence farmers, they are viable, but there is no indication to suggest
that they will be able to step-up to commercial level – much more research and investigation is
needed.
Without any planned and focused intervention, it is foreseen that the under-resourced farmers will
continue to struggle. There are aquatic health standards as well as increasing food safety standards
that are coming into play in the South African freshwater sector that have not previously been
present. These issues are challenging for established semi-commercial and commercial farmers; it
will without doubt be a challenge for under-resourced farmers.
Many of the pond farming activities are conducted on a village/co-operative basis and a large
number of people assist on a part-time basis. A rough estimate will be that these part-time
participants convert into about 200 full-time equivalents.
2 It should be noted that in the context of skills planning, size is determined by number of employees and not turnover. Small = ≤49 employees, Medium 50 – 149 and Large ≥150 and above.
98%
1% 1%0%
20%
40%
60%
80%
100%
120%
Small Medium Large
9
1.5 LABOUR MARKET PROFILE
1.5.1 Provincial Distribution of Employees
The WSP information is used to determine provincial distribution of labour. Due to the small number of
WSP/ATRs received from this sector, the information is used to reflect the relative size of employment
by province rather than the absolute number of workers.
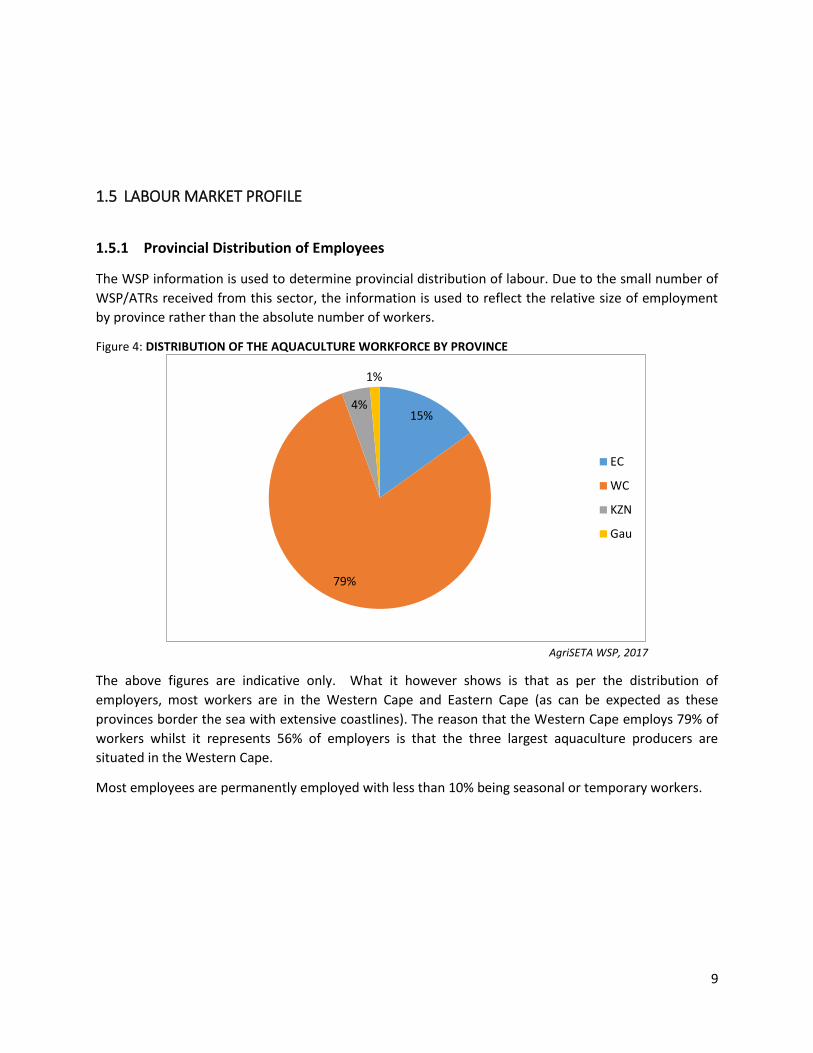
Figure 4: DISTRIBUTION OF THE AQUACULTURE WORKFORCE BY PROVINCE
AgriSETA WSP, 2017
The above figures are indicative only. What it however shows is that as per the distribution of
employers, most workers are in the Western Cape and Eastern Cape (as can be expected as these
provinces border the sea with extensive coastlines). The reason that the Western Cape employs 79% of
workers whilst it represents 56% of employers is that the three largest aquaculture producers are
situated in the Western Cape.
Most employees are permanently employed with less than 10% being seasonal or temporary workers.
15%
79%
4%
1%
EC
WC
KZN
Gau
10
1.5.2 Gender, Race and Age
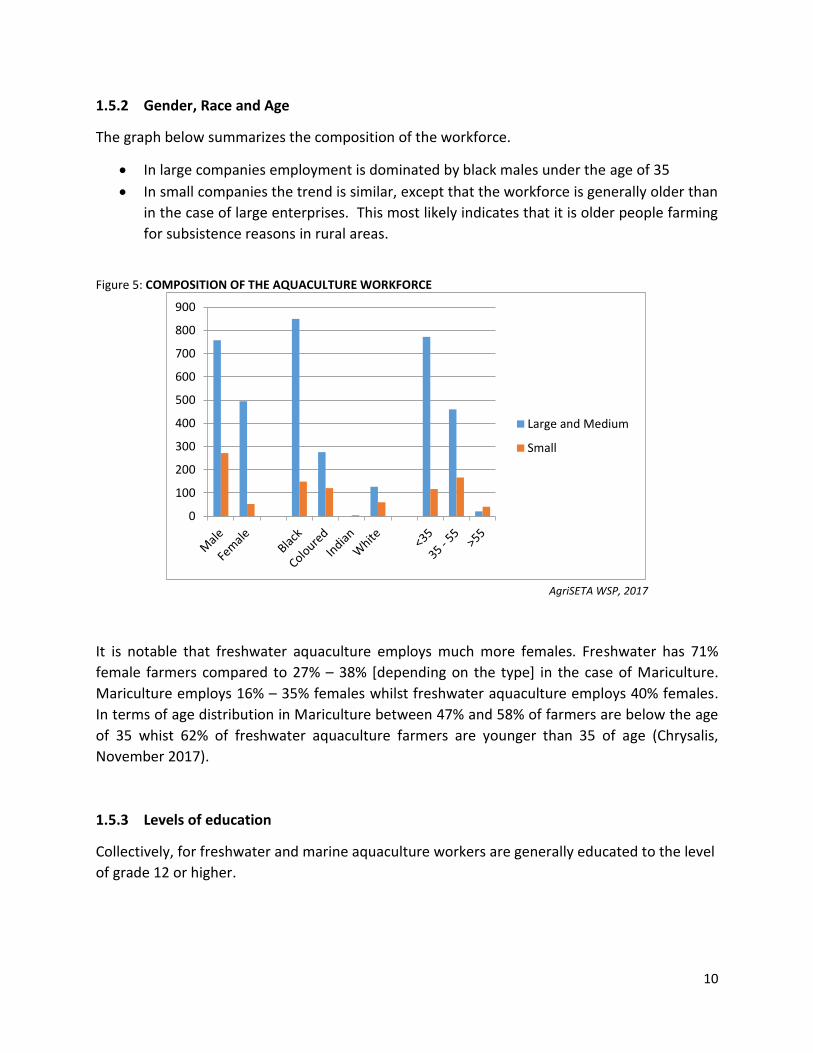
The graph below summarizes the composition of the workforce.
In large companies employment is dominated by black males under the age of 35
In small companies the trend is similar, except that the workforce is generally older than
in the case of large enterprises. This most likely indicates that it is older people farming
for subsistence reasons in rural areas.
Figure 5: COMPOSITION OF THE AQUACULTURE WORKFORCE
AgriSETA WSP, 2017
It is notable that freshwater aquaculture employs much more females. Freshwater has 71%
female farmers compared to 27% – 38% [depending on the type] in the case of Mariculture.
Mariculture employs 16% – 35% females whilst freshwater aquaculture employs 40% females.
In terms of age distribution in Mariculture between 47% and 58% of farmers are below the age
of 35 whist 62% of freshwater aquaculture farmers are younger than 35 of age (Chrysalis,
November 2017).
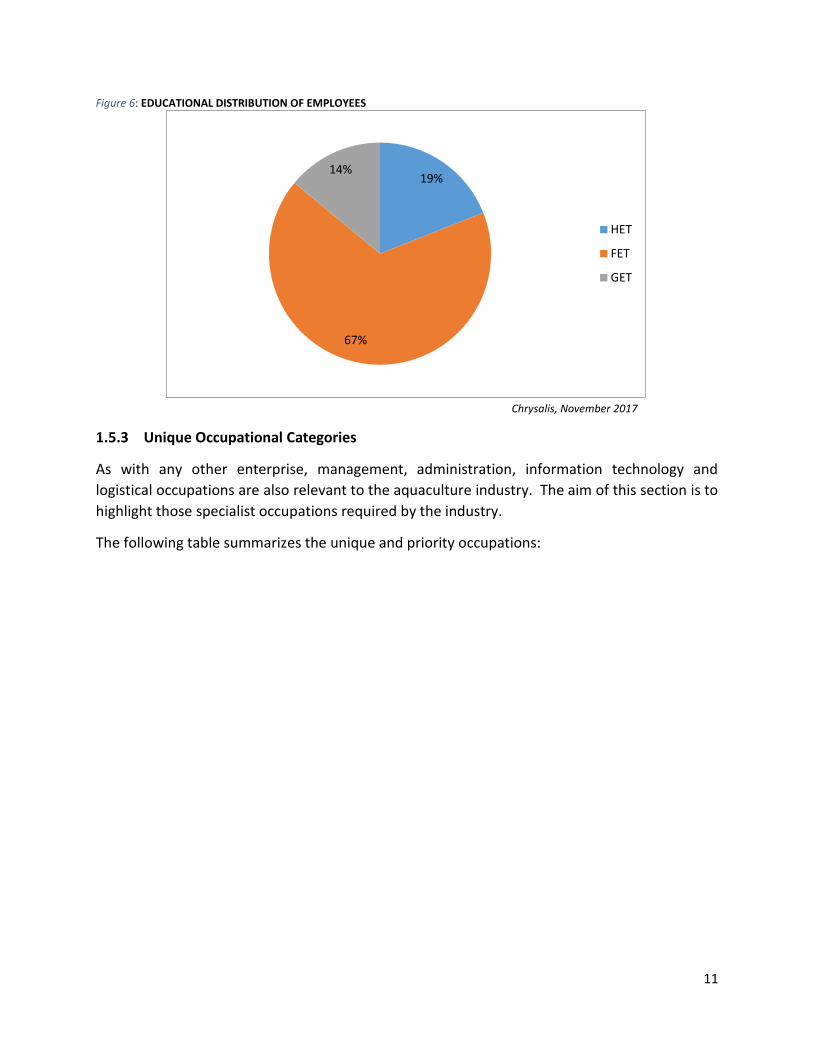
1.5.3 Levels of education
Collectively, for freshwater and marine aquaculture workers are generally educated to the level
of grade 12 or higher.
0
100
200
300
400
500
600
700
800
900
Large and Medium
Small
11
Figure 6: EDUCATIONAL DISTRIBUTION OF EMPLOYEES
Chrysalis, November 2017
1.5.3 Unique Occupational Categories
As with any other enterprise, management, administration, information technology and
logistical occupations are also relevant to the aquaculture industry. The aim of this section is to
highlight those specialist occupations required by the industry.
The following table summarizes the unique and priority occupations:
19%
67%
14%
HET
FET
GET
12
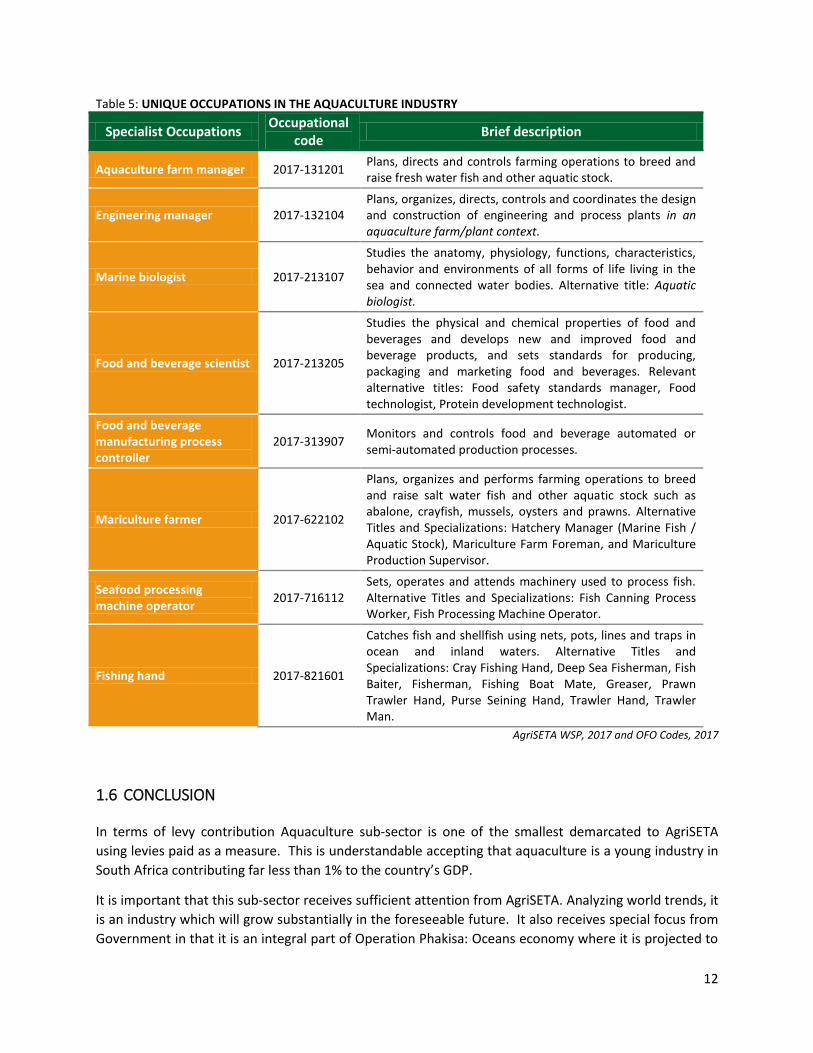
Table 5: UNIQUE OCCUPATIONS IN THE AQUACULTURE INDUSTRY
Specialist Occupations Occupational
code Brief description
Aquaculture farm manager 2017-131201 Plans, directs and controls farming operations to breed and raise fresh water fish and other aquatic stock.
Engineering manager 2017-132104 Plans, organizes, directs, controls and coordinates the design and construction of engineering and process plants in an aquaculture farm/plant context.
Marine biologist 2017-213107
Studies the anatomy, physiology, functions, characteristics, behavior and environments of all forms of life living in the sea and connected water bodies. Alternative title: Aquatic biologist.
Food and beverage scientist 2017-213205
Studies the physical and chemical properties of food and beverages and develops new and improved food and beverage products, and sets standards for producing, packaging and marketing food and beverages. Relevant alternative titles: Food safety standards manager, Food technologist, Protein development technologist.
Food and beverage manufacturing process controller
2017-313907 Monitors and controls food and beverage automated or semi-automated production processes.
Mariculture farmer 2017-622102
Plans, organizes and performs farming operations to breed and raise salt water fish and other aquatic stock such as abalone, crayfish, mussels, oysters and prawns. Alternative Titles and Specializations: Hatchery Manager (Marine Fish / Aquatic Stock), Mariculture Farm Foreman, and Mariculture Production Supervisor.
Seafood processing machine operator
2017-716112 Sets, operates and attends machinery used to process fish. Alternative Titles and Specializations: Fish Canning Process Worker, Fish Processing Machine Operator.
Fishing hand 2017-821601
Catches fish and shellfish using nets, pots, lines and traps in ocean and inland waters. Alternative Titles and Specializations: Cray Fishing Hand, Deep Sea Fisherman, Fish Baiter, Fisherman, Fishing Boat Mate, Greaser, Prawn Trawler Hand, Purse Seining Hand, Trawler Hand, Trawler Man.
AgriSETA WSP, 2017 and OFO Codes, 2017
1.6 CONCLUSION
In terms of levy contribution Aquaculture sub-sector is one of the smallest demarcated to AgriSETA
using levies paid as a measure. This is understandable accepting that aquaculture is a young industry in
South Africa contributing far less than 1% to the country’s GDP.
It is important that this sub-sector receives sufficient attention from AgriSETA. Analyzing world trends, it
is an industry which will grow substantially in the foreseeable future. It also receives special focus from
Government in that it is an integral part of Operation Phakisa: Oceans economy where it is projected to
13
experience an economic and employment growth of 6% and 15% respectively in the period leading up to
2033.
This shift towards aquaculture is also an emotional one in that society becomes more critical of the
uncontrolled exploitation of the oceans and its resources.
Given the fact that information on the sector is tentative and the potential of the sector is apparently
very big, AgriSETA should consider in-depth research into Aquaculture as part of its research agenda.
14
2.1 INTRODUCTION
This chapter focuses on the alignment of skills planning to national strategies insofar as it has relevance
to Aquaculture and it will also focus on factors driving change in the sector, thus influencing particular
skills needs.
2.2 ALIGNMENT OF SKILLS PLANNING TO NATIONAL STRATEGIES AND PLANS
The following section draws attention to the national strategy and planning documents that frame
AgriSETA’s mandate for skills development. All of these legislative and policy frameworks speak to
AgriSETA’s Constitutional mandate, as a Public Institution governed by the Public Finance Management
Act, to develop learning programmes and facilitate the implementation thereof in accordance with the
Skills Development Act, (1998), the Skills Development Levies Act (1999), and the National
Qualifications Framework Act (2008).
There are two seminal strategic documents that underpin AgriSETA’s mandate for skills planning,
namely: the White Paper on Post School Education & Training (2013) and the National Skills
Development Strategy III (NSDS III) (2011 – 2016). Both of these documents highlight the SETAs roles in
CHAPTER 2: KEY SKILLS ISSUES
15
developing clear, sector specific linkages between education and the workplace through an analysis of
the demand and supply of skills in their sector. These documents call for credible institutional
mechanisms for skills planning, programmes that are occupationally oriented, and responsive higher and
further education and training institutions. Furthermore, attention should be given to the needs of local,
community enterprises, co-operatives and the like, with a focus on developing their skills capacities to
meet the needs of their particular environments, thereby closing the gap between the rural and urban
South African economies.
Focusing on aquaculture, the most relevant new initiative is Operation Phakisa: Oceans economy.
Operation Phakisa focuses on unlocking the economic potential of South Africa's oceans, which could
contribute up to R177 billion to the GDP by 2033 and between 800 000 and 1 million direct jobs. Forty
seven (47) detailed initiatives have been identified, which on implementation, will increase the oceans
economy's GDP contribution by R20 million and lead to the creation of 22 000 direct new jobs by 2019.
Of importance is the aquaculture work stream. The sector offers significant potential for rural development, especially for marginalized coastal communities. This work stream has identified eight initiatives to spur the growth of the sector. One initiative will address the selection and implementation of 24 projects across South Africa by 2019.
These projects are expected to grow the aquaculture sector’s revenue from about half a billion rand today, to almost R1. 4 billion in 2019.
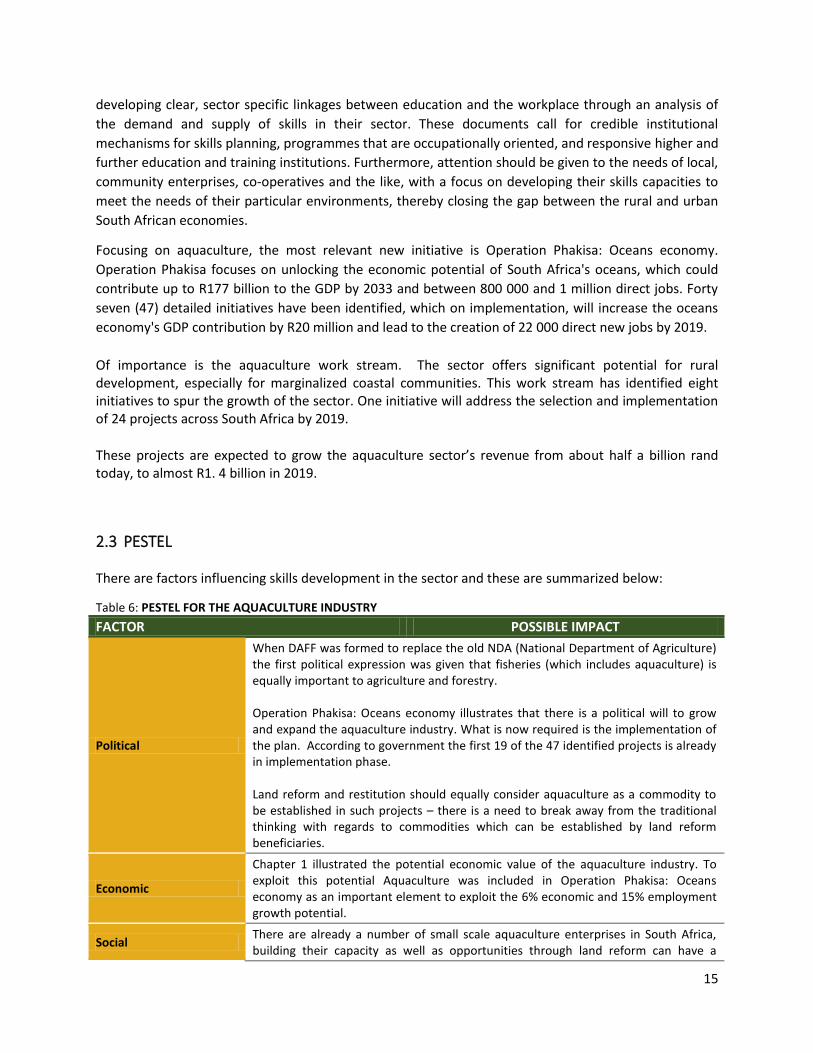
2.3 PESTEL
There are factors influencing skills development in the sector and these are summarized below:
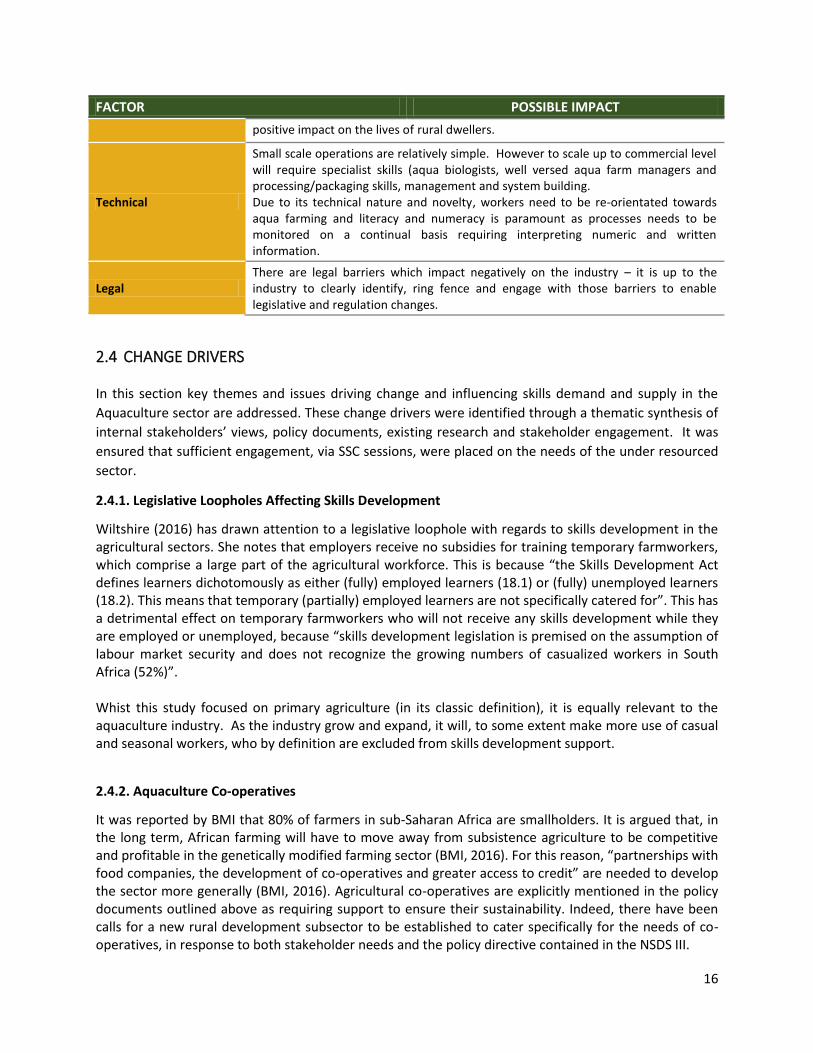
Table 6: PESTEL FOR THE AQUACULTURE INDUSTRY
FACTOR POSSIBLE IMPACT
Political
When DAFF was formed to replace the old NDA (National Department of Agriculture) the first political expression was given that fisheries (which includes aquaculture) is equally important to agriculture and forestry. Operation Phakisa: Oceans economy illustrates that there is a political will to grow and expand the aquaculture industry. What is now required is the implementation of the plan. According to government the first 19 of the 47 identified projects is already in implementation phase. Land reform and restitution should equally consider aquaculture as a commodity to be established in such projects – there is a need to break away from the traditional thinking with regards to commodities which can be established by land reform beneficiaries.
Economic
Chapter 1 illustrated the potential economic value of the aquaculture industry. To exploit this potential Aquaculture was included in Operation Phakisa: Oceans economy as an important element to exploit the 6% economic and 15% employment growth potential.
Social There are already a number of small scale aquaculture enterprises in South Africa, building their capacity as well as opportunities through land reform can have a
16
FACTOR POSSIBLE IMPACT
positive impact on the lives of rural dwellers.
Technical
Small scale operations are relatively simple. However to scale up to commercial level will require specialist skills (aqua biologists, well versed aqua farm managers and processing/packaging skills, management and system building. Due to its technical nature and novelty, workers need to be re-orientated towards aqua farming and literacy and numeracy is paramount as processes needs to be monitored on a continual basis requiring interpreting numeric and written information.
Legal There are legal barriers which impact negatively on the industry – it is up to the industry to clearly identify, ring fence and engage with those barriers to enable legislative and regulation changes.
2.4 CHANGE DRIVERS
In this section key themes and issues driving change and influencing skills demand and supply in the
Aquaculture sector are addressed. These change drivers were identified through a thematic synthesis of
internal stakeholders’ views, policy documents, existing research and stakeholder engagement. It was
ensured that sufficient engagement, via SSC sessions, were placed on the needs of the under resourced
sector.
2.4.1. Legislative Loopholes Affecting Skills Development
Wiltshire (2016) has drawn attention to a legislative loophole with regards to skills development in the agricultural sectors. She notes that employers receive no subsidies for training temporary farmworkers, which comprise a large part of the agricultural workforce. This is because “the Skills Development Act defines learners dichotomously as either (fully) employed learners (18.1) or (fully) unemployed learners (18.2). This means that temporary (partially) employed learners are not specifically catered for”. This has a detrimental effect on temporary farmworkers who will not receive any skills development while they are employed or unemployed, because “skills development legislation is premised on the assumption of labour market security and does not recognize the growing numbers of casualized workers in South Africa (52%)”. Whist this study focused on primary agriculture (in its classic definition), it is equally relevant to the aquaculture industry. As the industry grow and expand, it will, to some extent make more use of casual and seasonal workers, who by definition are excluded from skills development support.
2.4.2. Aquaculture Co-operatives
It was reported by BMI that 80% of farmers in sub-Saharan Africa are smallholders. It is argued that, in the long term, African farming will have to move away from subsistence agriculture to be competitive and profitable in the genetically modified farming sector (BMI, 2016). For this reason, “partnerships with food companies, the development of co-operatives and greater access to credit” are needed to develop the sector more generally (BMI, 2016). Agricultural co-operatives are explicitly mentioned in the policy documents outlined above as requiring support to ensure their sustainability. Indeed, there have been calls for a new rural development subsector to be established to cater specifically for the needs of co-operatives, in response to both stakeholder needs and the policy directive contained in the NSDS III.
17
Aquaculture is ideally suited for co-operative farming – both coastal and inland. Given the projected growth in the demand for protein, which can be supplied by the aquaculture industry, and initiatives such as Operation Phakisa: Oceans economy, it is important that AgriSETA is aware of this driver of change and be pro-active in its support of initiatives in the Aquaculture industry especially to those small scale operators who do not pay the skills levy.
2.4.3 The Green Economy
There is an increasing emphasis on the “green economy” in government policy documents (see, NDP,
NGP). In the agricultural sector, this refers to the use of environmentally sustainable farming practices.
These sustainable practices require new knowledge and skills that cuts across farming enterprises of all
sizes. The need for green knowledge is conveyed through industry specific training interventions across
different subsectors. Whilst there is a tendency to limit discussion on the Green economy to renewable
and efficient energy, the Green economy is also embracing the progression to environmentally friendly
pesticides and feeds which are less harmful to man and its environment. This is even more important as
Aquaculture production is either located in the ocean or it is happening inland utilizing a very scarce
resource in South Africa, namely water.
2.5 IMPLICATIONS FOR SKILLS PLANNING
In this chapter we have seen that the legislative and policy frameworks established by government,
coupled with the contextual change drivers and industry specific perspectives on skills development
point to the following 4 skills implications that need to be addressed in the Aquaculture Sub-Sector Skills
Plan.
4 Skills Implications:
1. Develop the ability of communities to farm in a co-operative manner, both coastal and inland;
2. Train current small scale farmers in understanding fish biology (breeding, feeding regimes, water
and oxygen management and harvesting techniques) to improve the productivity and
profitability of their businesses;
3. Ensuring that agriculture extension officers are well versed in aqua farming. Very often the
extension officers are the primary contact for freshwater farmers who are under resourced.
Unfortunately the advice they give these farmers is frequently incorrect and it can lead to
complications. Pond farming is not highly complex but if you don’t get the basics right you can
become trapped in a low productivity cycle which has happened to many of these farmers; and
4. Given the Operation Phakisa initiative, there is a need for an in-depth understanding of the skills
required to make the identified projects work. Skills such as Aquaculture farm managers,
Aquaculture farmers (also supervisory), Aquaculture Farm Assistant, Veterinarians (focusing on
Aquaculture, Systems building, Hatchery skills, Quality assurance, Technical drivers and feed
manufacturing has been identified. AgriSETA needs to elevate the Aquaculture industry to be a
dedicated research agenda item and to flesh out the skills needs more accurately over time.
18
2.6 CONCLUSIONS
Aquaculture has enormous potential to develop and expand – not only large commercial enterprises,
but also with regards to small scale and co-operative farmers. Operation Phakisa: Oceans economy is a
driver for the development of the aquaculture industry.
Training in both technical (breeding, nutrition, and water quality) and management skills (manage
aquaculture farm, and supervisory skills) are needed. In the case of small scale farmers there is a need
for AET. All of these are interventions required to impact on small scale farmers. This will only be
successful if supported by knowledgeable extension officers.
19
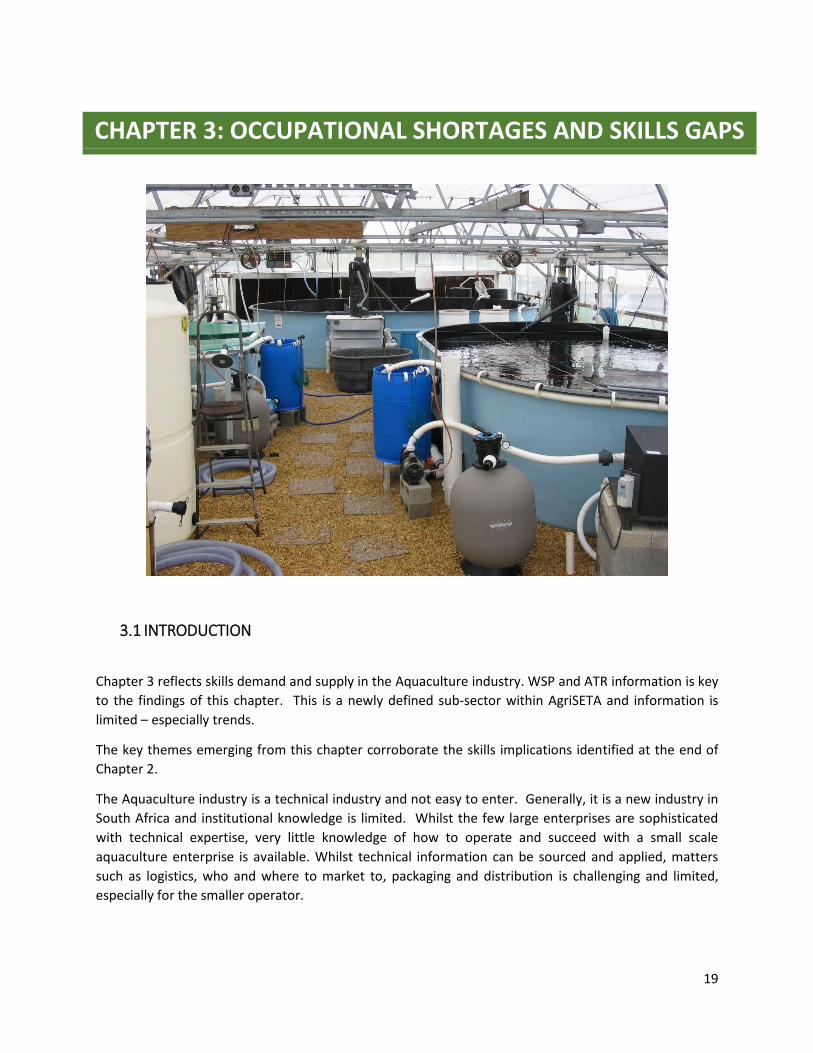
3.1 INTRODUCTION
Chapter 3 reflects skills demand and supply in the Aquaculture industry. WSP and ATR information is key
to the findings of this chapter. This is a newly defined sub-sector within AgriSETA and information is
limited – especially trends.
The key themes emerging from this chapter corroborate the skills implications identified at the end of
Chapter 2.
The Aquaculture industry is a technical industry and not easy to enter. Generally, it is a new industry in
South Africa and institutional knowledge is limited. Whilst the few large enterprises are sophisticated
with technical expertise, very little knowledge of how to operate and succeed with a small scale
aquaculture enterprise is available. Whilst technical information can be sourced and applied, matters
such as logistics, who and where to market to, packaging and distribution is challenging and limited,
especially for the smaller operator.
CHAPTER 3: OCCUPATIONAL SHORTAGES AND SKILLS GAPS
MISMATCHES
20
3.2 EXTENT AND NATURE OF SKILLS DEMAND Many factors impact on the demand for skills in the sector – a solid understanding of the sector will
largely assist in understanding these factors that impact on skills demand – however this is not readily
available. In a PESTEL and SWOT analysis of the sector the following were raised as important factors
impacting on the Aquaculture sector.
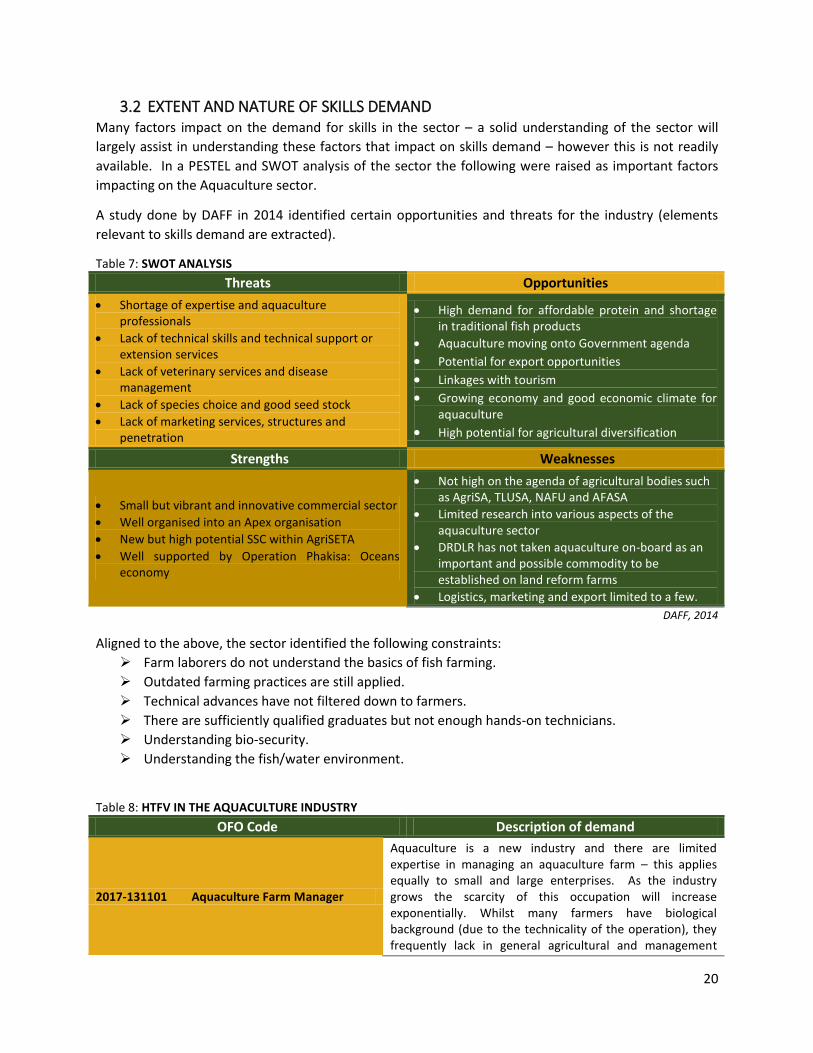
A study done by DAFF in 2014 identified certain opportunities and threats for the industry (elements
relevant to skills demand are extracted).
Table 7: SWOT ANALYSIS
Threats Opportunities
Shortage of expertise and aquaculture professionals
Lack of technical skills and technical support or extension services
Lack of veterinary services and disease management
Lack of species choice and good seed stock
Lack of marketing services, structures and penetration
High demand for affordable protein and shortage in traditional fish products
Aquaculture moving onto Government agenda
Potential for export opportunities Linkages with tourism Growing economy and good economic climate for
aquaculture High potential for agricultural diversification
Strengths Weaknesses
Small but vibrant and innovative commercial sector
Well organised into an Apex organisation
New but high potential SSC within AgriSETA
Well supported by Operation Phakisa: Oceans economy
Not high on the agenda of agricultural bodies such as AgriSA, TLUSA, NAFU and AFASA
Limited research into various aspects of the aquaculture sector
DRDLR has not taken aquaculture on-board as an important and possible commodity to be established on land reform farms
Logistics, marketing and export limited to a few.
DAFF, 2014
Aligned to the above, the sector identified the following constraints:
Farm laborers do not understand the basics of fish farming.
Outdated farming practices are still applied.
Technical advances have not filtered down to farmers.
There are sufficiently qualified graduates but not enough hands-on technicians.
Understanding bio-security.
Understanding the fish/water environment.
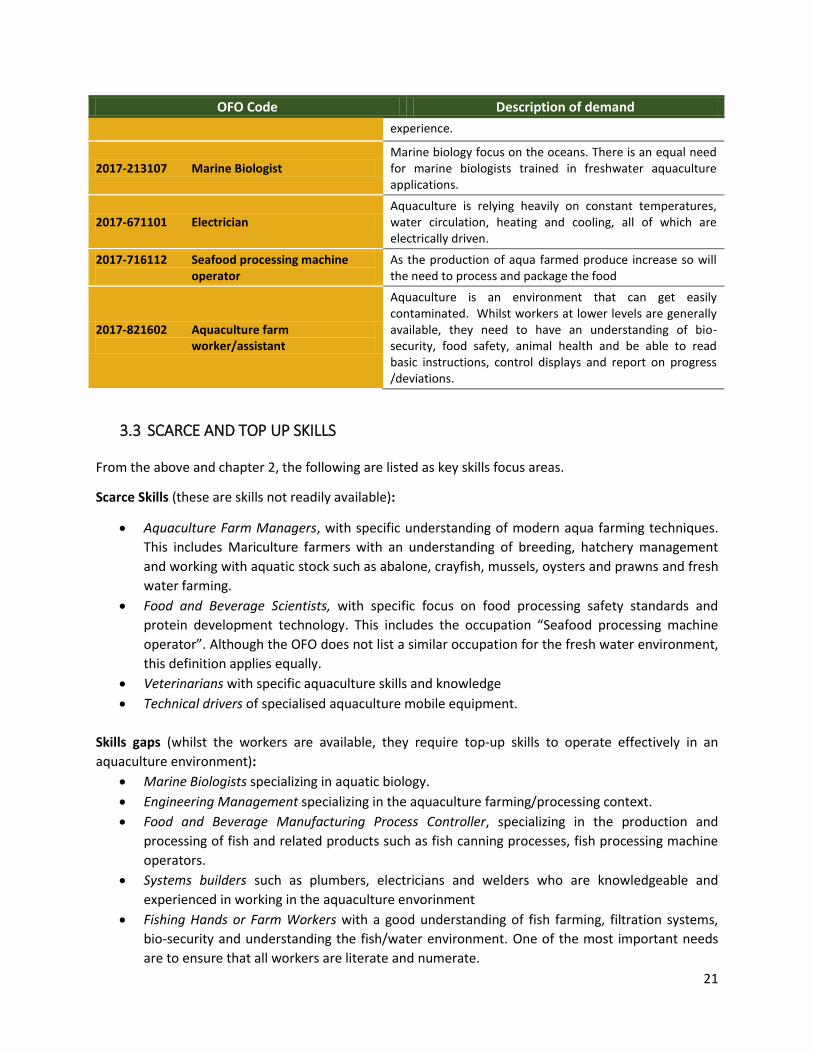
Table 8: HTFV IN THE AQUACULTURE INDUSTRY
OFO Code Description of demand
2017-131101 Aquaculture Farm Manager
Aquaculture is a new industry and there are limited expertise in managing an aquaculture farm – this applies equally to small and large enterprises. As the industry grows the scarcity of this occupation will increase exponentially. Whilst many farmers have biological background (due to the technicality of the operation), they frequently lack in general agricultural and management
21
OFO Code Description of demand
experience.
2017-213107 Marine Biologist Marine biology focus on the oceans. There is an equal need for marine biologists trained in freshwater aquaculture applications.
2017-671101 Electrician Aquaculture is relying heavily on constant temperatures, water circulation, heating and cooling, all of which are electrically driven.
2017-716112 Seafood processing machine operator
As the production of aqua farmed produce increase so will the need to process and package the food
2017-821602 Aquaculture farm worker/assistant
Aquaculture is an environment that can get easily contaminated. Whilst workers at lower levels are generally available, they need to have an understanding of bio-security, food safety, animal health and be able to read basic instructions, control displays and report on progress /deviations.
3.3 SCARCE AND TOP UP SKILLS
From the above and chapter 2, the following are listed as key skills focus areas.
Scarce Skills (these are skills not readily available):
Aquaculture Farm Managers, with specific understanding of modern aqua farming techniques.
This includes Mariculture farmers with an understanding of breeding, hatchery management
and working with aquatic stock such as abalone, crayfish, mussels, oysters and prawns and fresh
water farming.
Food and Beverage Scientists, with specific focus on food processing safety standards and
protein development technology. This includes the occupation “Seafood processing machine
operator”. Although the OFO does not list a similar occupation for the fresh water environment,
this definition applies equally.
Veterinarians with specific aquaculture skills and knowledge
Technical drivers of specialised aquaculture mobile equipment.
Skills gaps (whilst the workers are available, they require top-up skills to operate effectively in an
aquaculture environment):
Marine Biologists specializing in aquatic biology.
Engineering Management specializing in the aquaculture farming/processing context.
Food and Beverage Manufacturing Process Controller, specializing in the production and
processing of fish and related products such as fish canning processes, fish processing machine
operators.
Systems builders such as plumbers, electricians and welders who are knowledgeable and
experienced in working in the aquaculture envorinment
Fishing Hands or Farm Workers with a good understanding of fish farming, filtration systems,
bio-security and understanding the fish/water environment. One of the most important needs
are to ensure that all workers are literate and numerate.
22
3.4 EXTENT AND NATURE OF SUPPLY
There are very few private training providers focusing on aquaculture. They present mainly short
courses, accredited and non-accredited. These providers deliver programmes such as:
Aquaculture System Management Courses. Practical Fish Farmer Courses. Commercial Aquaponics Courses. Aquaculture training focusing on Tilapia.
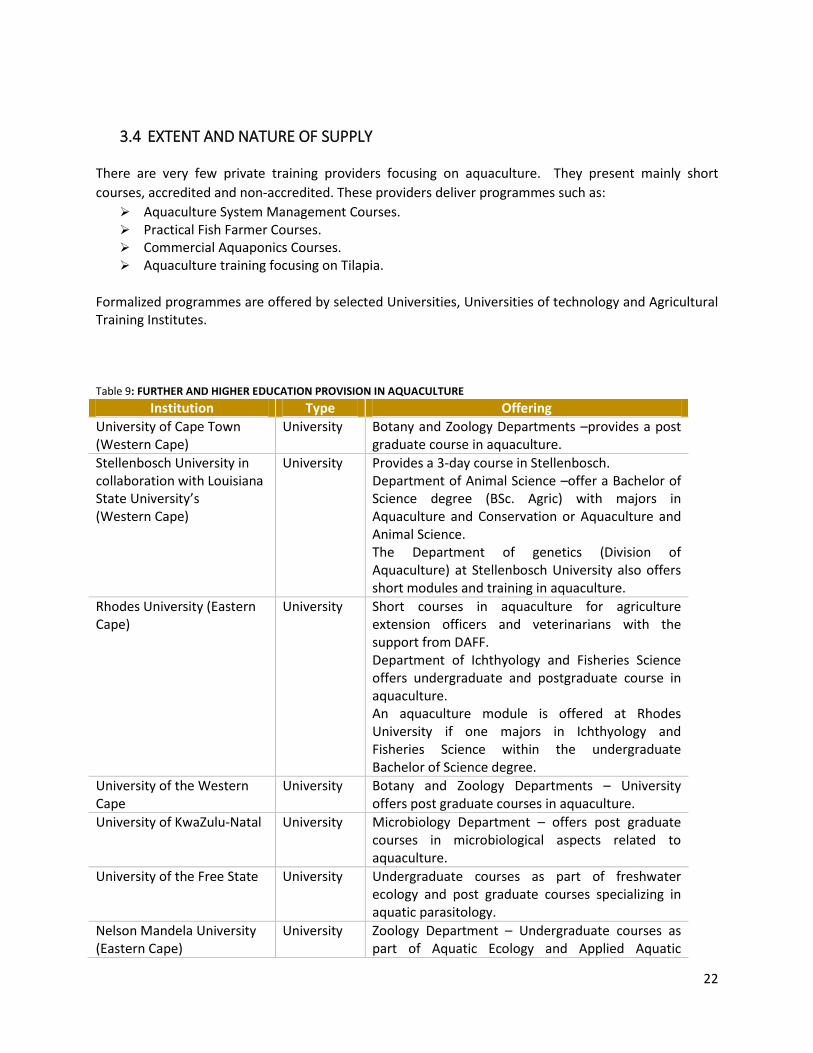
Formalized programmes are offered by selected Universities, Universities of technology and Agricultural Training Institutes.
Table 9: FURTHER AND HIGHER EDUCATION PROVISION IN AQUACULTURE
Institution Type Offering
University of Cape Town (Western Cape)
University Botany and Zoology Departments –provides a post graduate course in aquaculture.
Stellenbosch University in collaboration with Louisiana State University’s (Western Cape)
University Provides a 3-day course in Stellenbosch. Department of Animal Science –offer a Bachelor of Science degree (BSc. Agric) with majors in Aquaculture and Conservation or Aquaculture and Animal Science. The Department of genetics (Division of Aquaculture) at Stellenbosch University also offers short modules and training in aquaculture.
Rhodes University (Eastern Cape)
University
Short courses in aquaculture for agriculture extension officers and veterinarians with the support from DAFF. Department of Ichthyology and Fisheries Science offers undergraduate and postgraduate course in aquaculture. An aquaculture module is offered at Rhodes University if one majors in Ichthyology and Fisheries Science within the undergraduate Bachelor of Science degree.
University of the Western Cape
University Botany and Zoology Departments – University offers post graduate courses in aquaculture.
University of KwaZulu-Natal University Microbiology Department – offers post graduate courses in microbiological aspects related to aquaculture.
University of the Free State University Undergraduate courses as part of freshwater ecology and post graduate courses specializing in aquatic parasitology.
Nelson Mandela University (Eastern Cape)
University Zoology Department – Undergraduate courses as part of Aquatic Ecology and Applied Aquatic

23
Science. Oceans University has just been launched and this is likely to change
University of Limpopo Science Faculty
University Aquaculture Research Unit – offers aquaculture courses at a postgraduate level, focusing on freshwater finfish.
24
University of Zululand Zoology Department (KwaZulu Natal)
University Offers courses with aquaculture components at undergraduate and postgraduate level.
Cape Peninsula University of Technology (Western Cape)
University Department of Biodiversity and Conservation – offers courses with aquaculture components at undergraduate and postgraduate level. (FAO Fisheries and Aquaculture Department, 2017)
Elsenburg Agricultural Training Institute (Western Cape)
Agricultural Training Institute
BSc Agric (NQF 6) Elsenburg offers Animal production in Aquaculture production. Higher Certificate (NQF 5) Elsenburg offers Animal Production in Aquaculture production. Learnership (Animal production) - NQF 4
Glen Agricultural Training Institute (Free State)
Agricultural Training Institute
Ad-hoc informal training in partnership with the Xhariep Fish Hatchery project and private training providers
Madzivhandila Agricultural Training Institute (Limpopo)
Agricultural Training Institute
Module in aquaculture (Animal production) 4 weeks Certificate in aquaculture (Accredited)
Tsolo Agriculture and Rural Development Institute (TARDI) (Eastern Cape)
Agricultural Training Institute
Offers aquaculture as a module The Institute trains advisors and educators on aquaculture
Reconstructed from Chrysalis, November 2017
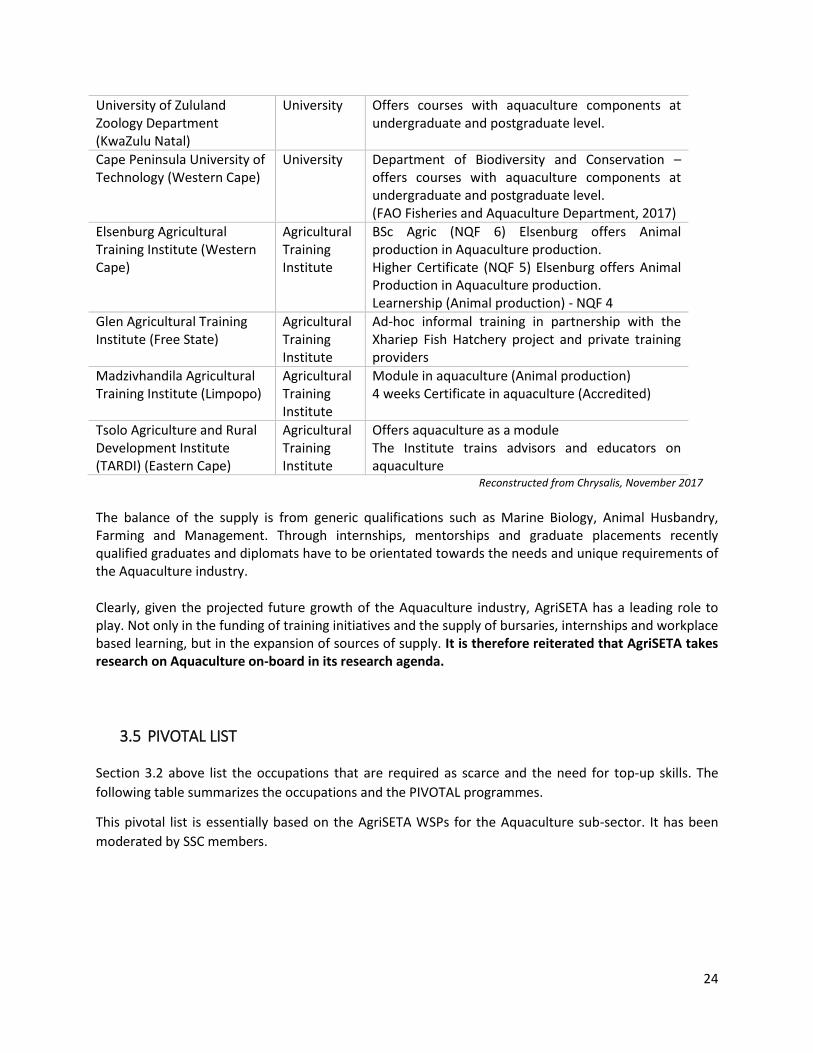
The balance of the supply is from generic qualifications such as Marine Biology, Animal Husbandry, Farming and Management. Through internships, mentorships and graduate placements recently qualified graduates and diplomats have to be orientated towards the needs and unique requirements of the Aquaculture industry.
Clearly, given the projected future growth of the Aquaculture industry, AgriSETA has a leading role to play. Not only in the funding of training initiatives and the supply of bursaries, internships and workplace based learning, but in the expansion of sources of supply. It is therefore reiterated that AgriSETA takes research on Aquaculture on-board in its research agenda.
3.5 PIVOTAL LIST
Section 3.2 above list the occupations that are required as scarce and the need for top-up skills. The
following table summarizes the occupations and the PIVOTAL programmes.
This pivotal list is essentially based on the AgriSETA WSPs for the Aquaculture sub-sector. It has been
moderated by SSC members.
25
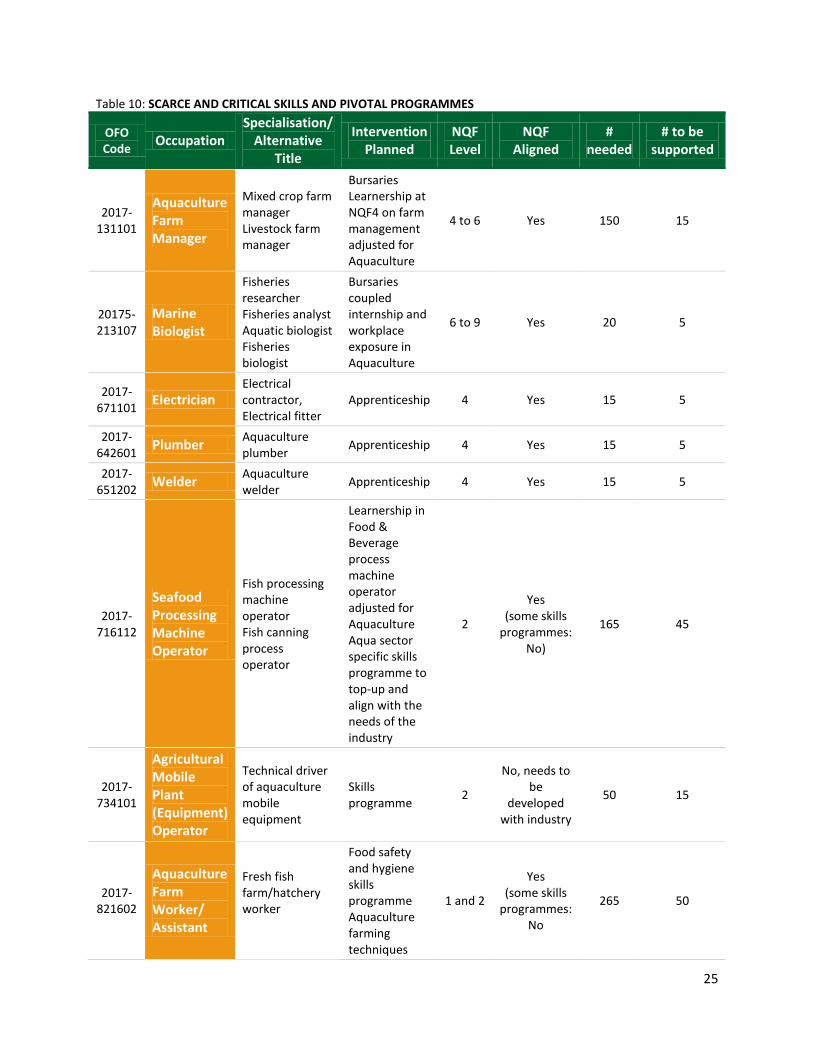
Table 10: SCARCE AND CRITICAL SKILLS AND PIVOTAL PROGRAMMES
OFO Code
Occupation Specialisation/
Alternative Title
Intervention Planned
NQF Level
NQF Aligned
# needed
# to be supported
2017-131101
Aquaculture Farm Manager
Mixed crop farm manager Livestock farm manager
Bursaries Learnership at NQF4 on farm management adjusted for Aquaculture
4 to 6 Yes 150 15
20175-213107
Marine Biologist
Fisheries researcher Fisheries analyst Aquatic biologist Fisheries biologist
Bursaries coupled internship and workplace exposure in Aquaculture
6 to 9 Yes 20 5
2017-671101
Electrician Electrical contractor, Electrical fitter
Apprenticeship 4 Yes 15 5
2017-642601
Plumber Aquaculture plumber
Apprenticeship 4 Yes 15 5
2017-651202
Welder Aquaculture welder
Apprenticeship 4 Yes 15 5
2017-716112
Seafood Processing Machine Operator
Fish processing machine operator Fish canning process operator
Learnership in Food & Beverage process machine operator adjusted for Aquaculture Aqua sector specific skills programme to top-up and align with the needs of the industry
2
Yes (some skills
programmes: No)
165 45
2017-734101
Agricultural Mobile Plant (Equipment) Operator
Technical driver of aquaculture mobile equipment
Skills programme
2
No, needs to be
developed with industry
50 15
2017-821602
Aquaculture Farm Worker/ Assistant
Fresh fish farm/hatchery worker
Food safety and hygiene skills programme Aquaculture farming techniques
1 and 2
Yes (some skills
programmes: No
265 50
26
OFO Code
Occupation Specialisation/
Alternative Title
Intervention Planned
NQF Level
NQF Aligned
# needed
# to be supported
skills programme AET programmes
This table is tentative. The WSP/ATR information is insufficient and the sector did not provide any feedback. At best this table
can be used as an indication.
The following is a list of common skills gaps that need to be integrated into PIVOTAL programmes as an
integral part of the learning process (Chrysalis, November 2017):
Management skills
Business skills
Practical skills fish knowledge technical skills
HACCP systems management
Hatchery biological skills
Technical skills (Plumbing, electrical and welding)
Industry packaging specialists
Aquaculture Veterinary specialists
Aquatic animal health specialists
Designing and building aquaculture systems
Qualified skippers in the mussel and oyster industries
Qualified divers in the mussel and oyster industries
Feed manufacturing knowledge
3.6 CONCLUSIONS
PIVOTAL programmes linked to specific occupations will guide the AgriSETA in its future investment in
the Aquaculture industry. These have been identified and AgriSETA should take this forward and engage
with the sector (and Operation Phakisa) on how best to systematically address the identified skills needs
and prioritize interventions.
27
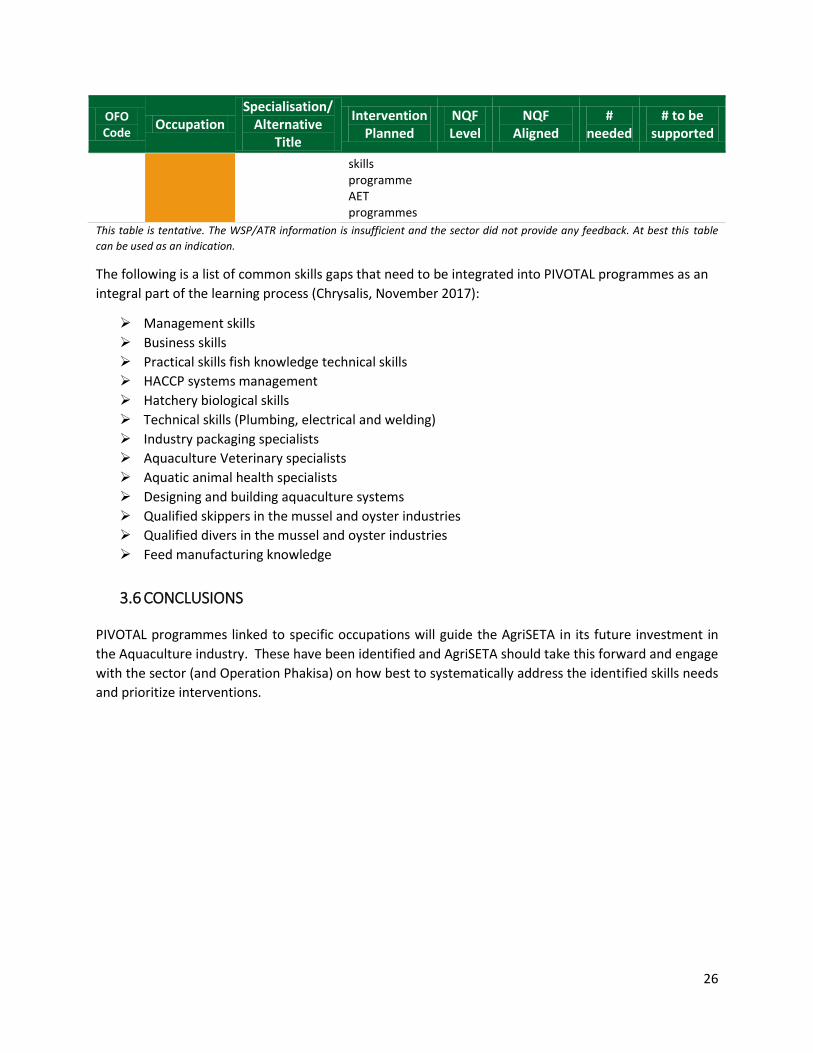
4.1 INTRODUCTION
This chapter highlights the partnerships which exist between the Aquaculture industry and other
institutions benefitting the industry. Some of these partnerships are existing whilst some are emerging.
4.2 PARTNERSHIPS
Table 11 summarizes existing partnerships whilst table 12 highlights possible emerging partnerships that
AgriSETA should consider.
Table 11: EXISTING PARTNERSHIPS
Sub-sector Strategic Partnerships
Department or organisation
Relevance of partnership
Commercial sector development
AgriSETA
Funding the Aquaculture industry as a commodity organization where the industry select the type of intervention which must be industry-wide
CHAPTER 4: SECTOR PARTNERSHIPS
28
Sub-sector Strategic Partnerships
Department or organisation
Relevance of partnership
Funding of learning interventions of individual industry enterprises based on applications put forward to AgriSETA.
Support of existing small-scale operations
DAFF
Work closely with DAFF in the implementation of Operation Phakisa: Oceans economy. Support small scale operators and work with DAFF for seed funding. Work with DAFF on the vertical integration and establishment of small processing and packing units, logistics and marketing.
Coherent industry AASA
The Aqua industry comprises many different elements. As a small and relatively new industry, fragmentation will be counterproductive and therefore AASA is ideally positioned to operate as an apex body for the industry collectively.
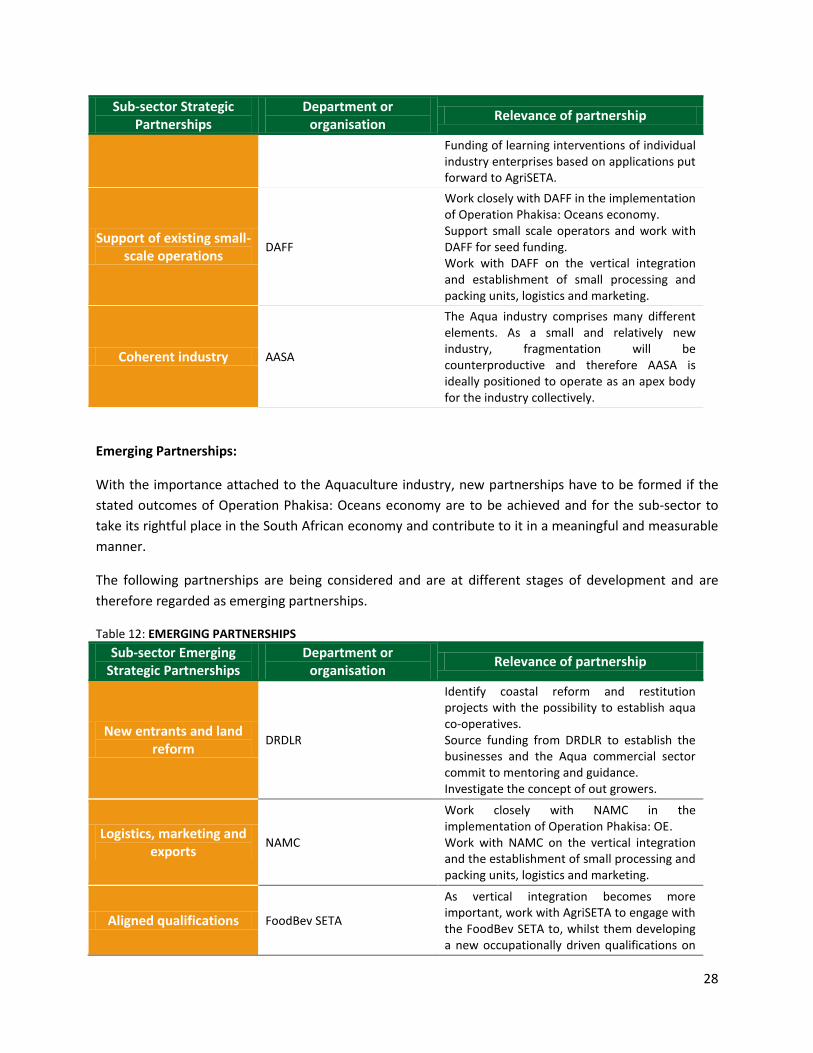
Emerging Partnerships:
With the importance attached to the Aquaculture industry, new partnerships have to be formed if the
stated outcomes of Operation Phakisa: Oceans economy are to be achieved and for the sub-sector to
take its rightful place in the South African economy and contribute to it in a meaningful and measurable
manner.
The following partnerships are being considered and are at different stages of development and are
therefore regarded as emerging partnerships.
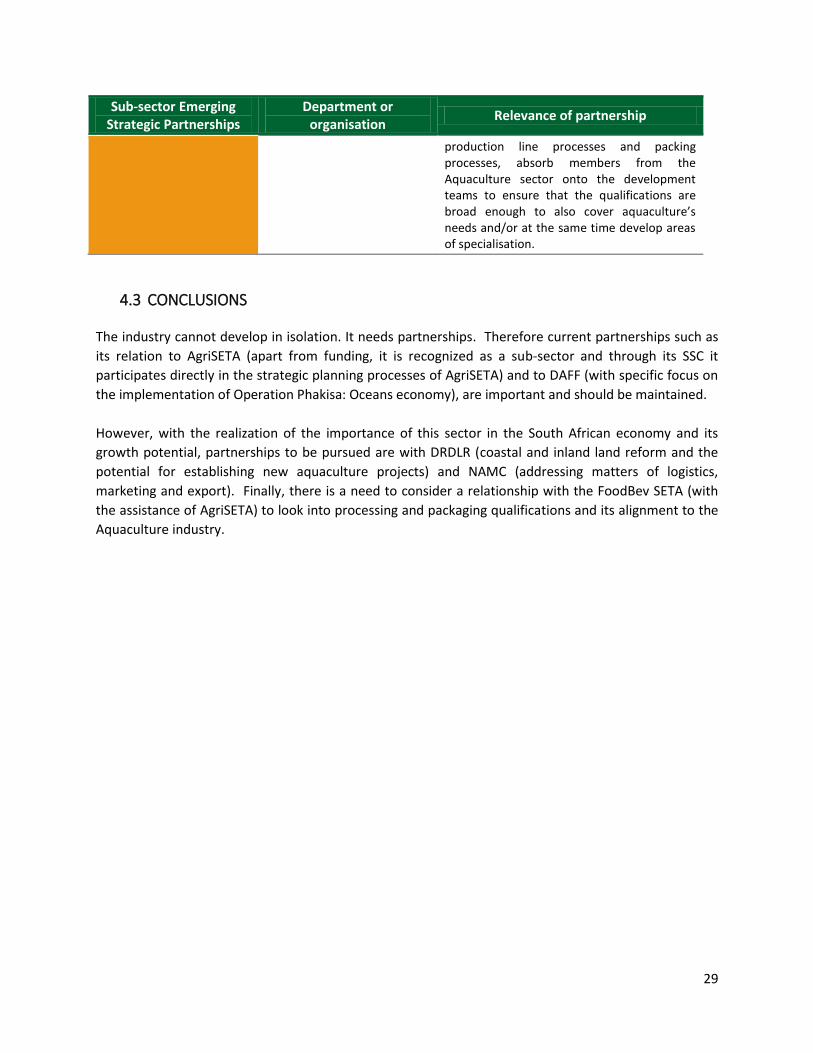
Table 12: EMERGING PARTNERSHIPS
Sub-sector Emerging Strategic Partnerships
Department or organisation
Relevance of partnership
New entrants and land reform
DRDLR
Identify coastal reform and restitution projects with the possibility to establish aqua co-operatives. Source funding from DRDLR to establish the businesses and the Aqua commercial sector commit to mentoring and guidance. Investigate the concept of out growers.
Logistics, marketing and exports
NAMC
Work closely with NAMC in the implementation of Operation Phakisa: OE. Work with NAMC on the vertical integration and the establishment of small processing and packing units, logistics and marketing.
Aligned qualifications FoodBev SETA
As vertical integration becomes more important, work with AgriSETA to engage with the FoodBev SETA to, whilst them developing a new occupationally driven qualifications on
29
Sub-sector Emerging Strategic Partnerships
Department or organisation
Relevance of partnership
production line processes and packing processes, absorb members from the Aquaculture sector onto the development teams to ensure that the qualifications are broad enough to also cover aquaculture’s needs and/or at the same time develop areas of specialisation.
4.3 CONCLUSIONS
The industry cannot develop in isolation. It needs partnerships. Therefore current partnerships such as
its relation to AgriSETA (apart from funding, it is recognized as a sub-sector and through its SSC it
participates directly in the strategic planning processes of AgriSETA) and to DAFF (with specific focus on
the implementation of Operation Phakisa: Oceans economy), are important and should be maintained.
However, with the realization of the importance of this sector in the South African economy and its
growth potential, partnerships to be pursued are with DRDLR (coastal and inland land reform and the
potential for establishing new aquaculture projects) and NAMC (addressing matters of logistics,
marketing and export). Finally, there is a need to consider a relationship with the FoodBev SETA (with
the assistance of AgriSETA) to look into processing and packaging qualifications and its alignment to the
Aquaculture industry.
30
5.1 INTRODUCTION
This chapter aims to synthesize the findings of the previous chapters and establish a set of skills priority
actions for the sub-sector. The intention of these recommended skills priority actions is that they
articulate the micro concerns of the Aquaculture sector.
These recommendations are founded in national policy and sectoral change drivers (chapter 2), as well
as the skills concerns identified by employers and training providers in terms of their skills needs
(chapter 3). This chapter is not a strategic or operational plan, but rather serves to identify priorities
that should be taken forward and further developed in the AgriSETA Strategic Plan and Annual
Performance Plan and to reflect the needs of the Aquaculture industry in those documents.
5.2 KEY FINDINGS FROM PREVIOUS CHAPTERS
From an overview perspective (chapter 1), it is clear that this sector has got enormous growth potential
and that South Africa is lagging behind other countries in developing its Aquaculture industry. The
sector is projected to grow by 6% per annum in economic terms but possibly by as much as 15%
employment in the period leading up to 2033. This growth potential has been recognized and
Aquaculture is a key element of Operation Phakisa: Oceans economy.
CHAPTER 5: SKILLS PRIORITY ACTIONS
31
Skills needs (Chapter 2) can be summarized broadly into three categories.
High level skills such as biologists and aquaculture post-graduate researchers. As a relatively new
industry, much is still to be learned. At the same time animal health and food security is a high priority.
Secondly, there is the need to develop general worker level employees. Aquaculture farming practices
is new and not necessarily understood. The farming processes are also highly controlled which creates
the need for training not only in aqua farming techniques, care of animals, breeding and stock
management, but also to ensure that workers are literate and able to read instructions, understand and
interpret technical information such as temperature, water flows and cooling systems in order to control
production processes.
Thirdly, there is a need to focus on the emerging or small scale farmer – business acumen,
management, logistics and marketing
Chapter 3 provides PIVOTAL programme perspective. The following are important occupations and the
AgriSETA should direct its aquaculture funding mainly towards these occupations.
Finally chapter 4 lists three important existing partnerships that exist already in the sub-sector: with
AgriSETA, DHET and AASA. It is important to note that as a relatively new industry in South Africa and
one that has been identified as having high growth potential, the industry needs to create more
partnerships. The following have been identified:
DRDLR (expanding small scale and cooperative inland fish farming operations in rural areas)
NAMC (to assist in a comprehensive and integrated marketing strategy and develop export
possibilities).
Foodbev SETA (processing and canning qualifications lie within the domain of the Foodbev SETA)
5.3 CONCLUSIONS AND RECOMMENDED ACTIONS
The AgriSETA should take note of the developments in the Aquaculture industry; it is imperative that the
SETA must be aligned to developments in the industry and ensure that the correct skills are available to
the industry at the right time and the right quantity.
Research Agenda
It is recommended that AgriSETA take Aquaculture as a specific focus area onboard onto its research
agenda. This will ensure that the sub-sector is well researched and that more accurate information
become available which will improve strategic and skills planning in the SETA.
AgriSETA can make a major contribution to the attainment of the projected economic and employment
growth projections of the Aquaculture industry by carefully addressing its skills needs.
32
High Level Skills
At a commercial scale the industry is technologically advanced and sensitive. Aqua biologists who
understand the biological and technological interrelationships and who will guide processes to optimize
breeding, growing production and processing are required.
Similarly, as a new industry, there is a need for research (beyond the level of the AgriSETA’s own
research agenda). It is necessary that the AgriSETA engage with the sector to ensure that it funds post
graduate bursaries aligned to the research needs of the Aquaculture sector.
The Aquaculture SSC can play a leading role in the identification of post graduate research needs and
the selection of appropriate candidates.
Commercial Workers
AgriSETA initiatives should focus on production (farm) management and processing and packaging.
Frequently outdated practices are still being used (this applies equally for the under-resourced or small
scale farmers).
In parallel to this there is a need to focus at worker level – aqua farming is new and knowledge needs to
be developed.
New Farmers
There are already a pool of existing small scale farmers and small scale co-operatives. DRDLR land
reform processes create new opportunities for the expansion of aquaculture.
The AgriSETA rural development unit should ensure that they are capacitated with regards to
Aquaculture and lead the way in promoting aquaculture as an alternative to traditional farming
commodities.

33
Agri Handbook, http://www.agrihandbook.co.za/index.php/book/livestock/Aquaculture, 2017
Aquaculture Lab, Operation Phakisa.
Arcos, F.G., Ibara, A.M., Vázquez-Boucard, C., Palacios, E., Racotta, I.S., 2003. Feasible predictive criteria
for reproductive performance of white shrimp Liptopenaeus vannamei: egg quality and female
physiological condition. Aquaculture 228, 335-349.
Arcos, F.G., Racotta, I.S., Ibarra, A.M., 2004. Genetic parameter estimates for reproductive traits and egg
composition in Pacific white shrimp, Penaeus (Liptopenaeus) vannamei. Aquaculture 236, 151-165.
Arnold, S.J., Coman, F.E., Jackson, C.J., Groves, S.A., 2009. High-intensity, zero water-exchange
production of juvenile tiger shrimp, Penaeus monodon: An evaluation of artificial substrates and
stocking density. Aquaculture 293, 42-48.
Arnstein, D.R., Beard, T.W., 1975. Induced maturation of prawn Penaeus orientalis Kishinoujy in the
Laboratory by means of eyes-talk removal. Aquaculture 5, 411-412.
Badawi, H.K., 1975. On maturation and spawning in some penaeid prawns of eyestalk removal.
Aquaculture 5, 411-412.
Balon, E.K., 1995. Origin and domestication of the wild carp, Cyprinus carpio: From Roman gourmet to
the swimming flows. Aquaculture 129, 3-48.
Chien, Y.H., 1992. Water quality requirements and management for marine shrimp culture. In: Wyban, J.
(Ed.), Proceedings of the Special Session on Shrimp Farming. World Aquaculture Society, Baton Rouge,
LA, USA, pp. 30–42.
Chow, S., Sandifer, P.A., 1991. Differences in growth, morphometris traits, and sex maturity among
Pacific white shrimp, Penaeus vannamei, from different commercial hatcheries, Aquaculture 92, 165-
178.
Chrysalis, Report on Aquaculture skills inventory and needs analysis, 2017
DAFF, A Profile of the South African Aquaculture market value chain, 2014
DAFF, Agriculture economic overview, 2016
DEA, Operation Phakisa – Oceans Economy, 2016
BIBLIOGRAPHY
34
IRR, South Africa Survey, Economic survey, 2016
Transnet National Ports Authority, National Ports Plan 2016 Update, 2016
REFERENCE OF PICTURES USED IN THIS DOCUMENT
Cover Page: Florida Institute of Technology, Florida Tech eCurrent.
Chapter 1: New York Times, Another side of Tilapia, the perfect factory fish, May 2011
Chapter 2: WWF web-site, Farmed Shrimp, not dated.
Chapter 3: The Balance, Discover the Top Aquaculture Countries, July 2017
Chapter 4: The fish tank, Let them eat carp: Farmed fish is helping to fight hunger, April
2018
Chapter 5: Tufts University, School of Medicine, Evidence supports ban on growth
antibiotics in farming, November 2011