Embed Size (px)
Citation preview
INT-8989, 2001
SUMMARY
Selective Catalytic Steam Cracking (SCSC), better known as Aquaconversion
technology, is a process that combines thermal cracking and catalytic water dissociation
reaction to upgrade heavy crude oils and vacuum residues by increasing API gravity [1].
Product characterization studies of model molecules and real feedstocks have shown that
some of the chemical changes that occur during SCSC, involve dealkylation of side chains
from alkylaromatic moieties [1-2]. However, to get a better understanding of the structural
transformations experimented by high molecular weight fractions, spectroscopic techniques
and Ruthenium ion catalyzed oxidation (RICO) reaction have been used as characterization
tools.
The purpose of this work is try to predict from spectroscopic data and RICO information
the processability potential of two feedstocks under SCSC conditions. Thus, structural
quality parameter (SQP), defined from spectroscopic data, was found to be helpful to
describe feedstock behavior under AQC conditions. At the same time, RICO procedures
gave valuable information about aliphatic group distributions that was in agreement with
the calculated SQP values. Additionally, RICO results gave some insights related to the
reactivity of the identified aliphatic groups and about their contribution to the conversion
values achieved by the studied vacuum residues.
PDVSA-INTEVEP
INT-8989, 2001
1. INTRODUCTION
Selective Catalytic Steam Cracking (SCSC), better known as Aquaconversion
technology, is a process that combines thermal cracking and catalytic water dissociation
reaction to upgrade heavy crude oils and vacuum residues by increasing API gravity [1].
During this moderate conversion process, water molecules are catalytically dissociated to
form hydrogen free radicals. These radicals saturate hydrocarbon free radicals formed by
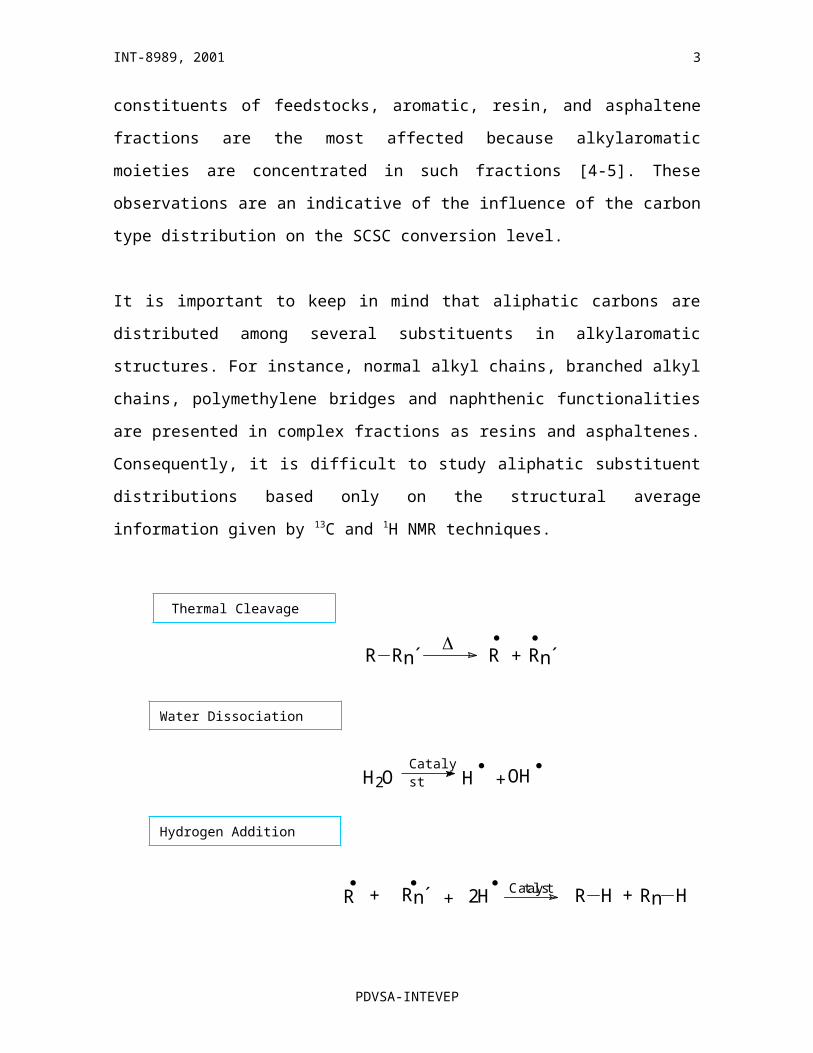
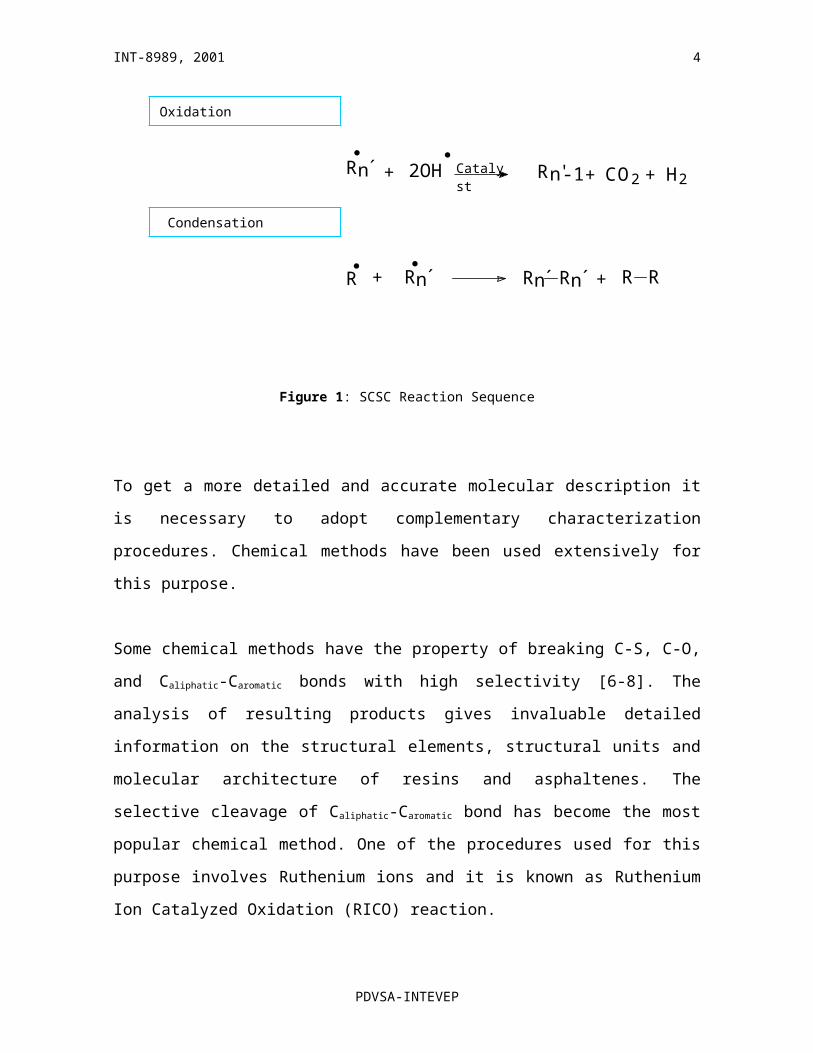
thermal cracking of feedstock components (Figure 1). By this way, condensation reactions
are quenched in such extension that coke formation is considerably reduced. As a result,
lighter hydrocarbon products are formed at higher conversion values than those achieved by
traditional thermal cracking processes at a similar product (vacuum residue) stability level
[1-2].
Previous works related to the Aquaconversion chemistry [3-5] have pointed out that
dealkylation of side chain from alkylaromatic structures is one of the chemical changes that
occur during the process. According to these works, water and the catalyst seem to have a
preference for breaking CSp3-CSp2 bonds located in -position from the aromatic ring.
Consequently, aromatic entities rich in alkyl substituents are expected to give higher
conversion levels than less alkylsubstituted aromatic ones [1-5]. Considering SARA
constituents of feedstocks, aromatic, resin, and asphaltene fractions are the most affected
because alkylaromatic moieties are concentrated in such fractions [4-5]. These observations
are an indicative of the influence of the carbon type distribution on the SCSC conversion
level.
It is important to keep in mind that aliphatic carbons are distributed among several
substituents in alkylaromatic structures. For instance, normal alkyl chains, branched alkyl
chains, polymethylene bridges and naphthenic functionalities are presented in complex
fractions as resins and asphaltenes. Consequently, it is difficult to study aliphatic
substituent distributions based only on the structural average information given by 13C and 1H NMR techniques.
PDVSA-INTEVEP
1
INT-8989, 2001
Figure 1: SCSC Reaction Sequence
To get a more detailed and accurate molecular description it is necessary to adopt
complementary characterization procedures. Chemical methods have been used extensively
for this purpose.
Some chemical methods have the property of breaking C-S, C-O, and Caliphatic-Caromatic bonds
with high selectivity [6-8]. The analysis of resulting products gives invaluable detailed
information on the structural elements, structural units and molecular architecture of resins
and asphaltenes. The selective cleavage of Caliphatic-Caromatic bond has become the most
PDVSA-INTEVEP
2
Water Dissociation
Thermal Cleavage
Hydrogen Addition
R Rn´
R Rn´+
Oxidation
+ Rn´R Rn´ Rn´ R R+
Condensation
H2O H OH+ Catalyst
R Rn´ R H Rn H+ 2H + + Catalyst
Rn´ + 2OH Rn'-1 + CO2 + H2
Catalyst
INT-8989, 2001
popular chemical method. One of the procedures used for this purpose involves Ruthenium
ions and it is known as Ruthenium Ion Catalyzed Oxidation (RICO) reaction.
RICO reaction does not cleavage directly the Caliphatic-Caromatic bond. This reaction is able to
convert aromatic carbons selectively to carbon dioxide and/or carboxylic groups while
leaving aliphatic structures essentially unaffected [9-21]. The reaction pattern is very
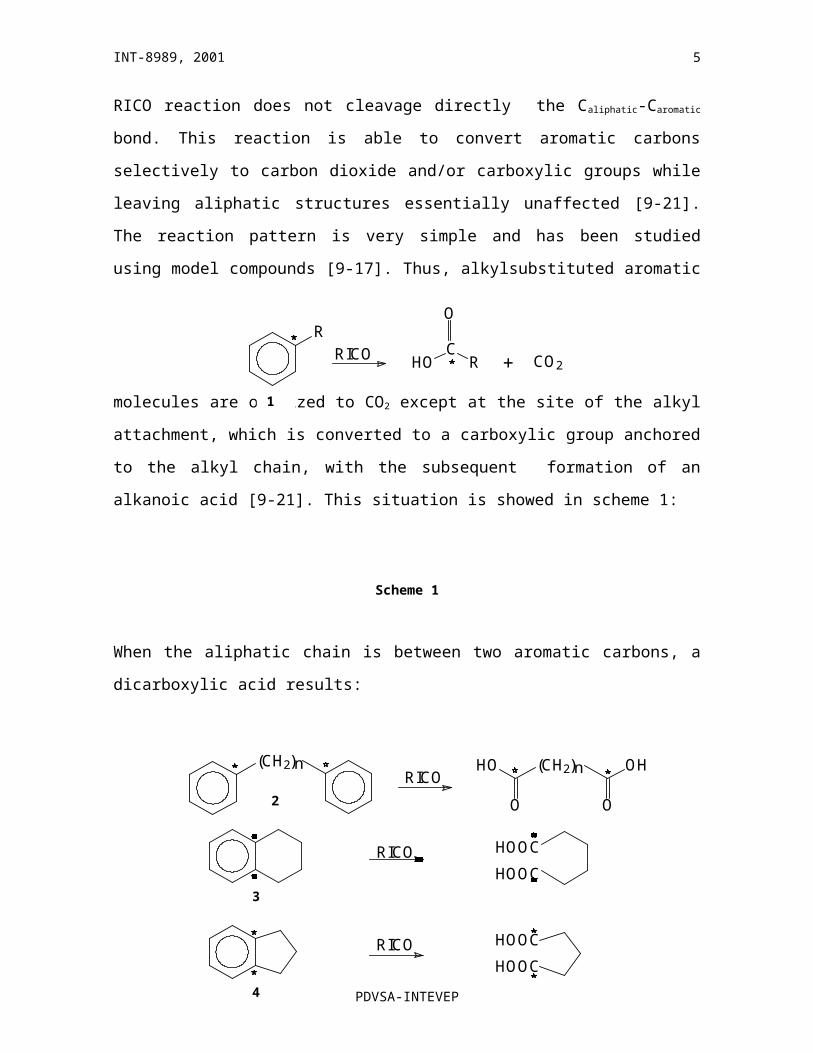
simple and has been studied using model compounds [9-17]. Thus, alkylsubstituted
aromatic molecules are oxidized to CO2 except at the site of the alkyl attachment, which is
converted to a carboxylic group anchored to the alkyl chain, with the subsequent formation
of an alkanoic acid [9-21]. This situation is showed in scheme 1:
Scheme 1
When the aliphatic chain is between two aromatic carbons, a dicarboxylic acid results:
Scheme 2
PDVSA-INTEVEP
3
R
RICO CHO R
O
+ CO2
1
2
3
4
RICOHOOC
HOOC
(CH2)n
O
HO (CH2)nRICO
O
OH
RICOHOOC
HOOC
INT-8989, 2001
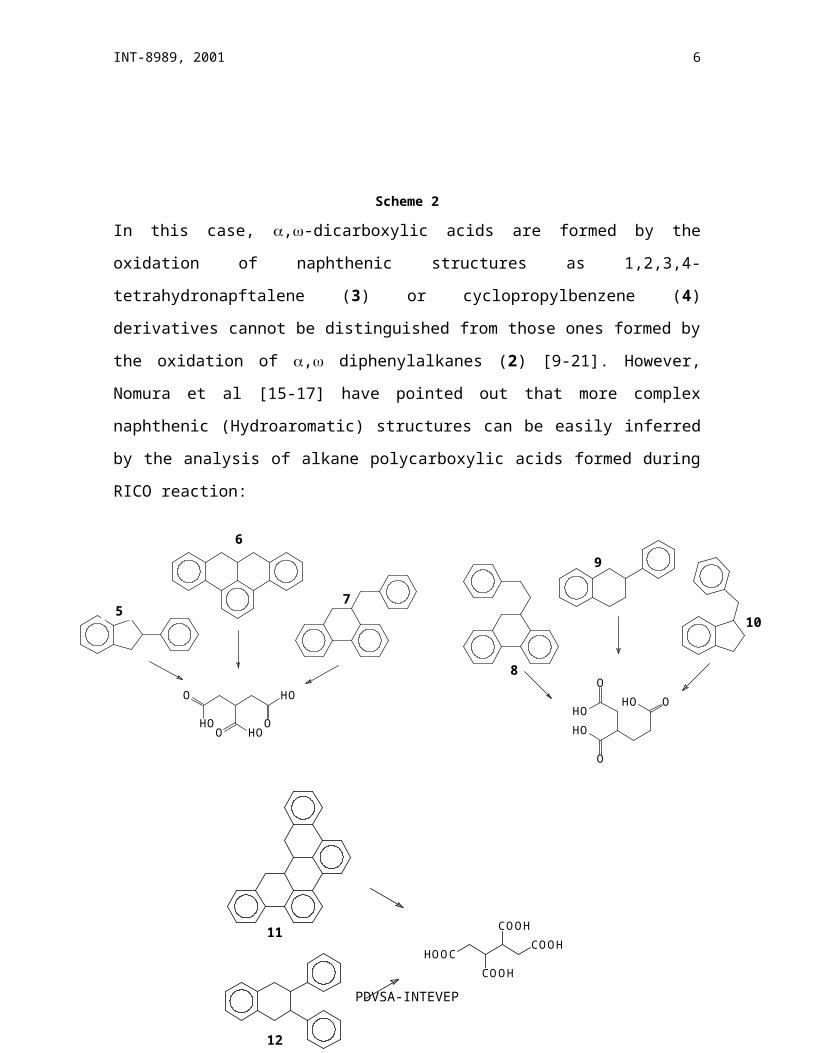
In this case, ,-dicarboxylic acids are formed by the oxidation of naphthenic structures as
1,2,3,4-tetrahydronapftalene (3) or cyclopropylbenzene (4) derivatives cannot be
distinguished from those ones formed by the oxidation of , diphenylalkanes (2) [9-21].
However, Nomura et al [15-17] have pointed out that more complex naphthenic
(Hydroaromatic) structures can be easily inferred by the analysis of alkane polycarboxylic
acids formed during RICO reaction:
Scheme 3
If this kind of structures is presented in resins and asphaltenes, alkane polycarboxylic acids
are expected to be form during RICO reaction.
PDVSA-INTEVEP
4
7
HOHO
O
O HO
O
5
6
9
10
8
HO
HO
HO O
O
O
11
HOOCCOOH
COOH
COOH
12
INT-8989, 2001
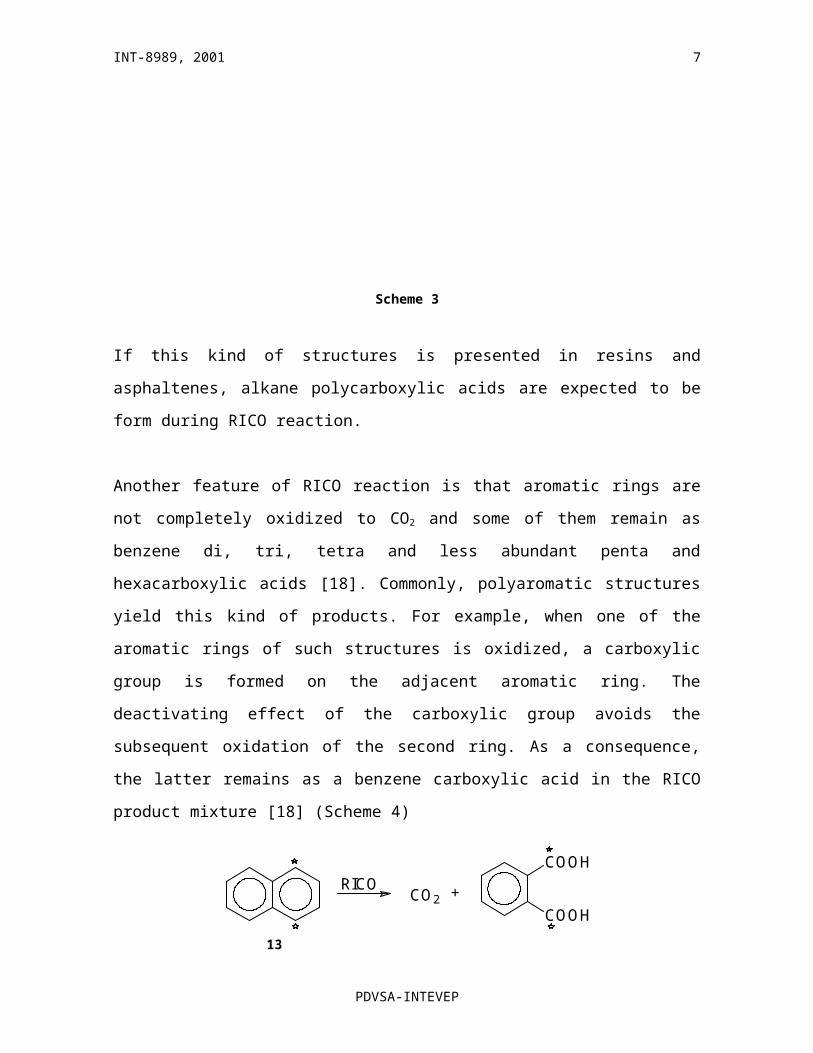
Another feature of RICO reaction is that aromatic rings are not completely oxidized to CO2
and some of them remain as benzene di, tri, tetra and less abundant penta and
hexacarboxylic acids [18]. Commonly, polyaromatic structures yield this kind of products.
For example, when one of the aromatic rings of such structures is oxidized, a carboxylic
group is formed on the adjacent aromatic ring. The deactivating effect of the carboxylic
group avoids the subsequent oxidation of the second ring. As a consequence, the latter
remains as a benzene carboxylic acid in the RICO product mixture [18] (Scheme 4)
Scheme 4
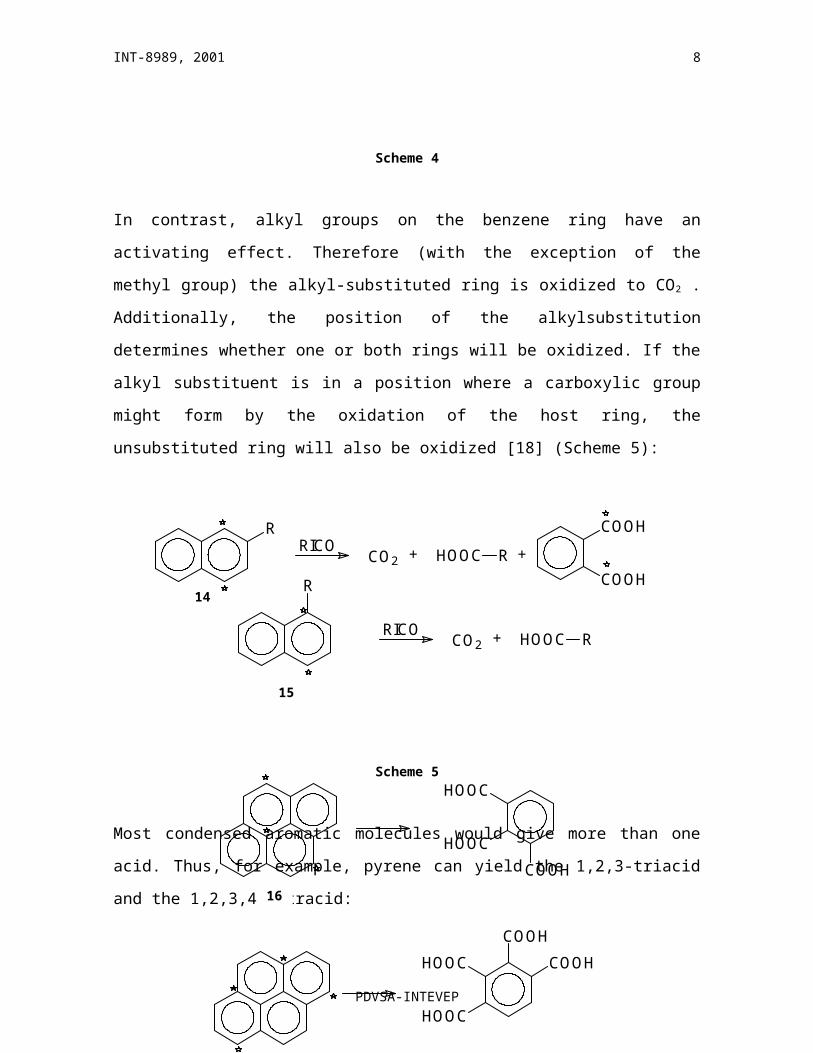
In contrast, alkyl groups on the benzene ring have an activating effect. Therefore (with the
exception of the methyl group) the alkyl-substituted ring is oxidized to CO2 . Additionally,
the position of the alkylsubstitution determines whether one or both rings will be oxidized.
If the alkyl substituent is in a position where a carboxylic group might form by the
oxidation of the host ring, the unsubstituted ring will also be oxidized [18] (Scheme 5):
Scheme 5
PDVSA-INTEVEP
5
RICOCO2 +
COOH
COOH
13
R
RICOCO2 + RHOOC
RRICO
CO2 + RHOOC +
COOH
COOH14
15
INT-8989, 2001
Most condensed aromatic molecules would give more than one acid. Thus, for example,
pyrene can yield the 1,2,3-triacid and the 1,2,3,4 tetracid:
Scheme 6
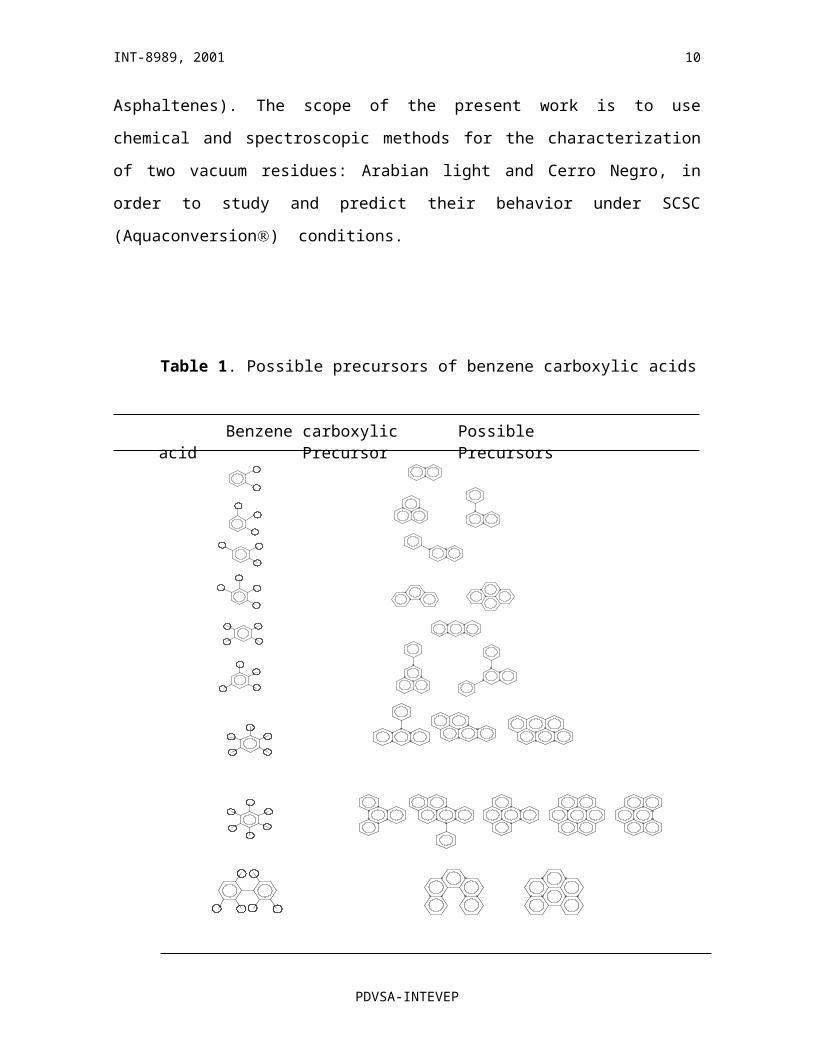
Table 1 lists common benzene polycarboxylic acids found in RICO product mixture and
their possible aromatic system precursors [15-18].
As can be seen, the analysis of benzene polycarboxylic acids provides invaluable insight
into the mode of condensation and possible structures of aromatic systems contained in
resin and asphaltene fractions.
Thus, the analysis of RICO products together with the information provided by
spectroscopic techniques can give important structural details of the most affected SARA
fractions during SCSC process (i.e., Aromatics, Resins and Asphaltenes). The scope of the
present work is to use chemical and spectroscopic methods for the characterization of two
vacuum residues: Arabian light and Cerro Negro, in order to study and predict their
behavior under SCSC (Aquaconversion) conditions.
PDVSA-INTEVEP
6
HOOC
HOOC
COOH
HOOC
HOOC
COOH
COOH
16
INT-8989, 2001
Table 1. Possible precursors of benzene carboxylic acids
PDVSA-INTEVEP
7
Benzene carboxylic acidPrecursor
Possible Precursors
INT-8989, 2001
2. EXPERIMENTAL
2.1 SARA Fractionation
Asphaltenes from two vacuum residues (Arabian Light (AL) and Cerro Negro (CN) were
obtained by precipitation with n-heptane (HPLC grade, J.T Baker) [22]. The resulting
maltene portion was fractionated into Saturates, Aromatics and Resins by preparative
HPLC as indicated in reference [23]. SARA fractions were further characterized by
elemental analysis (Carbon (C), Hydrogen (H), Oxygen (O), Sulfur (S), Nitrogen (N)),
Vapor Phase Osmometry (VPO), and Nuclear Magnetic Resonance spectroscopy (1H NMR
and 13C NMR).
2.2 Elemental Analysis and Molecular weight Determination.
C, H, and O were determined in a LECO Analyzer, model CHSN-932. Sulfur was
determined in a LECO Analyzer, model IR 432 and Nitrogen, in a Dorhman Analyzer,
model 1000. Average molecular weight was determinated in a Knauer Osmometer using
CH2Cl2 and CHCl3 as solvents. Benzil was used as a reference material.
2.3 1H NMR Spectroscopy and Average Molecular Parameter Calculation.
NMR analyses were performed in a Bruker Spectrometer ACP-400. 1H NMR spectra were
acquired at 400 MHz with a 12 ppm window and a flip angle of 45º. The recycle time was 5
seconds and TMS was used as reference. Sample concentration was 25 mg/mL in CH 2Cl2/
CS2 1:1.
1H NMR data, carbon and hydrogen content determined by elemental analysis, and VPO
molecular weight were used as input data to calculate Average Molecular Parameters
(AMP) by the methodology reported in reference [24].
PDVSA-INTEVEP
8
INT-8989, 2001
2.4 13C NMR Spectroscopy.
13C NMR analyses were performed at 100.614 MHz. About 400 mg of the sample were
dissolved in a Cr (III) acetylacetonate / deuterated chlorofom solution (0.01 M). 13C NMR
spectra were acquired using a single pulse technique (30º pulse ) with a period of 5 second
between each pulse. 8000 pulses were accumulated in 12 hours.
2.5 RICO Reaction Procedure and CO2 Measurement.
Aromatic, resin and asphaltene fractions from AL and CN vacuum residues were submitted
to RICO reaction as follow:
About 200.0 mg of sample, 12.0 mg of RuCl2.3H2O, and 4.0 g of NaIO4, were placed into a
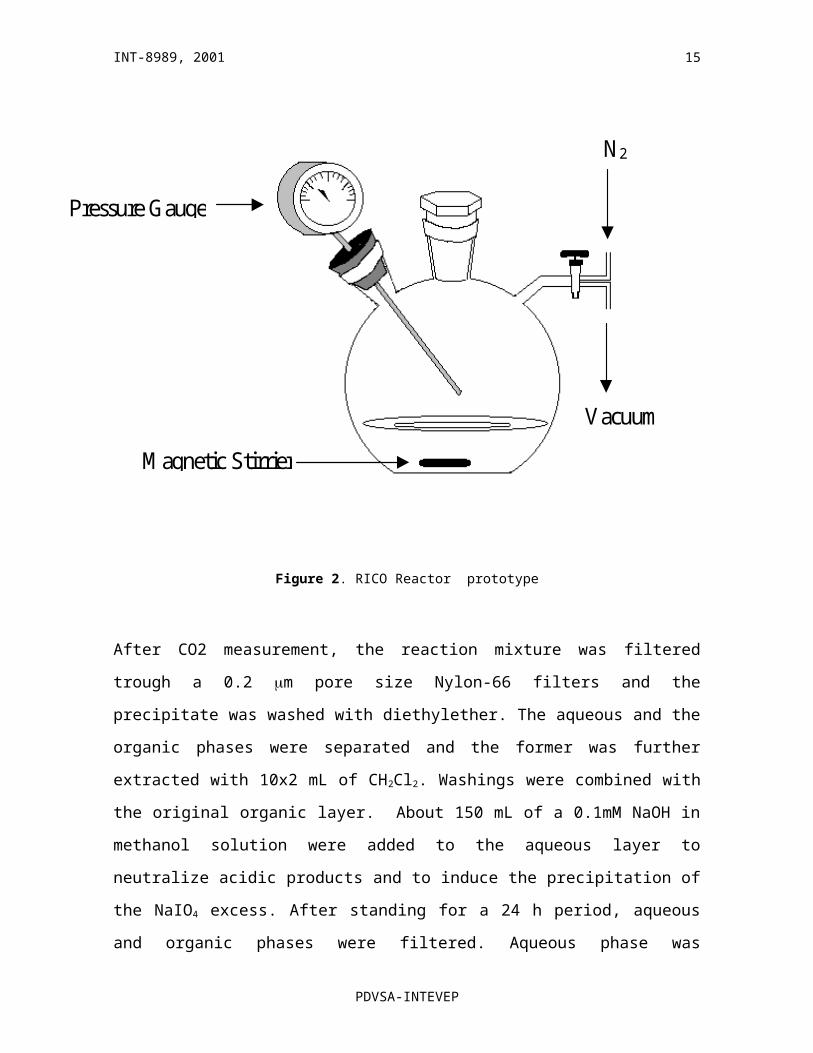
250 mL flat bottom glass reactor prototype, designed to measure the pressure of CO2
evolved during the reaction, (Figure 2). Air contained in the reactor was evacuated using
vacuum and replaced by N2. With a N2 positive pressure and using a glass funnel, 6.0 mL of
CCl4, 6.0 mL of CH3CN and 10 mL of H2O were added. Then, the reactor was closed
hermetically and filled with N2 up to reach a pressure of 3.0 psi.
The heterogeneous mixture was magnetically stirred for 24 hours at room temperature,
during which the initial dark brown color changed to yellow pale. At this point the reaction
was stopped and the final pressure was measured.
Concentration of the evolved CO2 was measured by using the GASTEC colorimetric
method. GASTEC No. 2H Carbon Dioxide detector tube with a measuring range of 1-10 %
v/v (Gastec Corporation) was connected to the reactor N2 inlet and to the GASTEC pump
for the other end. Then, 50.0 mL of the gas contained in the reactor were taken by suction
of the GASTEC pump. CO2 was absorbed on the package as the gas passed through the
GASTEC detector tube. A color response was generated indicating CO2 concentration
level.
PDVSA-INTEVEP
9
INT-8989, 2001
Figure 2. RICO Reactor prototype
After CO2 measurement, the reaction mixture was filtered trough a 0.2 m pore size
Nylon-66 filters and the precipitate was washed with diethylether. The aqueous and the
organic phases were separated and the former was further extracted with 10x2 mL of
CH2Cl2. Washings were combined with the original organic layer. About 150 mL of a
0.1mM NaOH in methanol solution were added to the aqueous layer to neutralize acidic
products and to induce the precipitation of the NaIO4 excess. After standing for a 24 h
period, aqueous and organic phases were filtered. Aqueous phase was evaporated at 70°C
to dryness. Organic phased was joined to the evaporated aqueous phase and concentrated
using a N2 stream.
PDVSA-INTEVEP
10
N2
Vacuum
Pressure Gauge
Magnetic Stirrier
INT-8989, 2001
2.6 Esterification Procedure.
Esterification of RICO products was carried out by adding 5,0 mL of a 14% solution of BF 3
in methanol (Pierce Chemical) to the product solution. The resulting mixture was stirred at
room temperature for 12 hours. After adding the esterifier reagent, the yellow pale color of
the product solution changed to red because of iodine liberation. To eliminate this
interference, about 100 mg of Zinc powder was added to reduce I2 to I- [21]. Then, the
mixture was dried over Na2SO4, filtrated, and concentrated to 1.0 mL by rotary evaporation
at 30ºC and N2 stream. The methylester solution was further analyzed by GC-MS.
2.7 GC-MS Analysis.
GC-MS analyses were performed in a HP5890 Serie II Gas Chromatograph equipped with
a split injector and a BD-1701 capillary column (30m x 0.25mm coated with 0.5m DB-1)
connected to a HP5970 mass detector. Helium gas used as carrier gas. Typically operating
chromatographic conditions are listed in Table 2
Table 2: Operating chromatographic conditions in GC-MS analysis
Initial T (ºC) Final T (ºC) T Ramp (ºC/min)
Injector 250 250 0
Column 35 300
300
7
n/ Final T
2.8. Pilot Plant Tests.
Pilot plant tests were performed in a one barrel/day capacity pilot plant operated at a fixed
temperature and fed with the Arabian Light or the Cerro Negro vacuum residue, steam,
and the catalyst. The reaction was stopped when products reached a critical P-value of 1.20
(P-value was determined as indicated in reference [25]).
PDVSA-INTEVEP
11
INT-8989, 2001
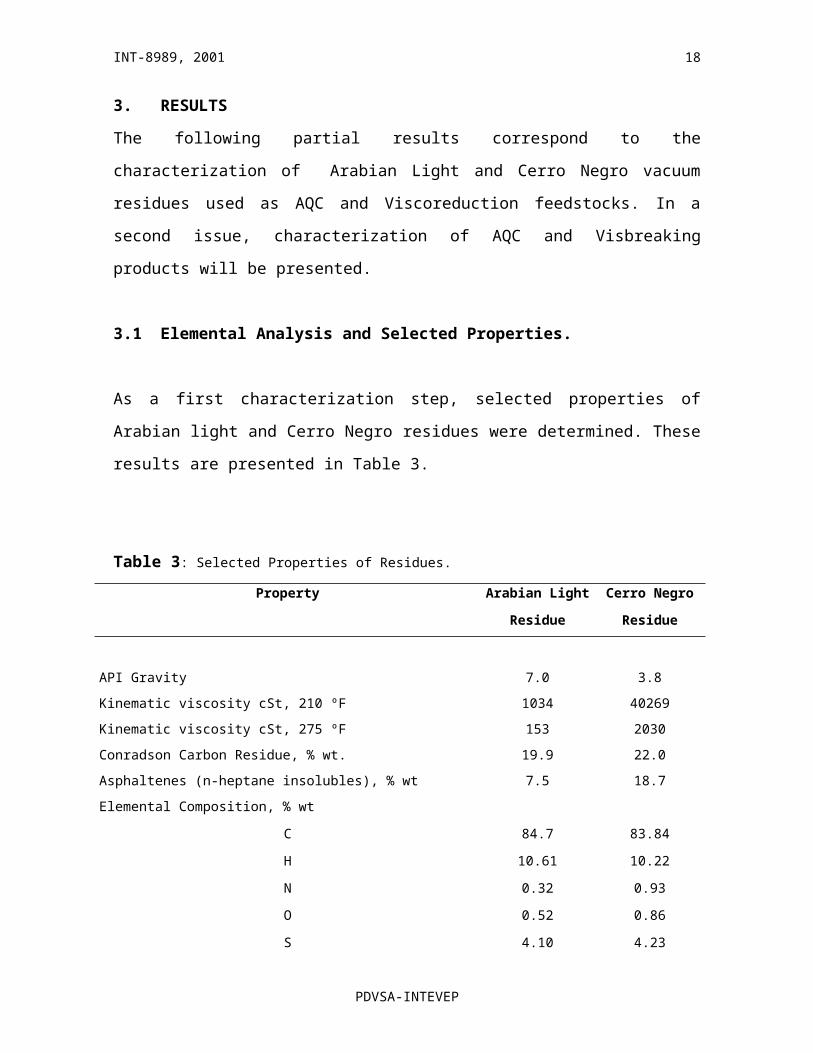
3. RESULTS
The following partial results correspond to the characterization of Arabian Light and Cerro
Negro vacuum residues used as AQC and Viscoreduction feedstocks. In a second issue,
characterization of AQC and Visbreaking products will be presented.
3.1 Elemental Analysis and Selected Properties.
As a first characterization step, selected properties of Arabian light and Cerro Negro
residues were determined. These results are presented in Table 3.
Table 3: Selected Properties of Residues.
Property Arabian Light
Residue
Cerro Negro
Residue
API Gravity 7.0 3.8
Kinematic viscosity cSt, 210 ºF 1034 40269
Kinematic viscosity cSt, 275 ºF 153 2030
Conradson Carbon Residue, % wt. 19.9 22.0
Asphaltenes (n-heptane insolubles), % wt 7.5 18.7
Elemental Composition, % wt
C
H
N
O
S
84.7
10.61
0.32
0.52
4.10
83.84
10.22
0.93
0.86
4.23
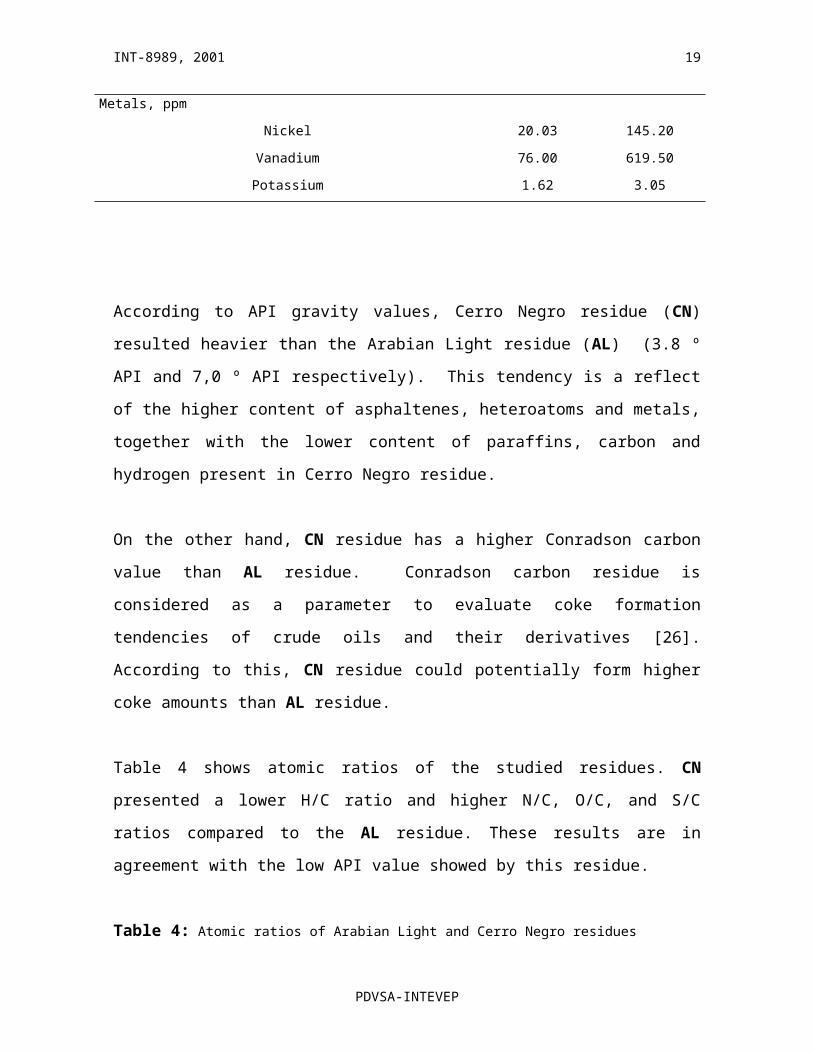
Metals, ppm
Nickel
Vanadium
Potassium
20.03
76.00
1.62
145.20
619.50
3.05
PDVSA-INTEVEP
12
INT-8989, 2001
According to API gravity values, Cerro Negro residue (CN) resulted heavier than the
Arabian Light residue (AL) (3.8 º API and 7,0 º API respectively). This tendency is a
reflect of the higher content of asphaltenes, heteroatoms and metals, together with the lower
content of paraffins, carbon and hydrogen present in Cerro Negro residue.
On the other hand, CN residue has a higher Conradson carbon value than AL residue.
Conradson carbon residue is considered as a parameter to evaluate coke formation
tendencies of crude oils and their derivatives [26]. According to this, CN residue could
potentially form higher coke amounts than AL residue.
Table 4 shows atomic ratios of the studied residues. CN presented a lower H/C ratio and
higher N/C, O/C, and S/C ratios compared to the AL residue. These results are in
agreement with the low API value showed by this residue.
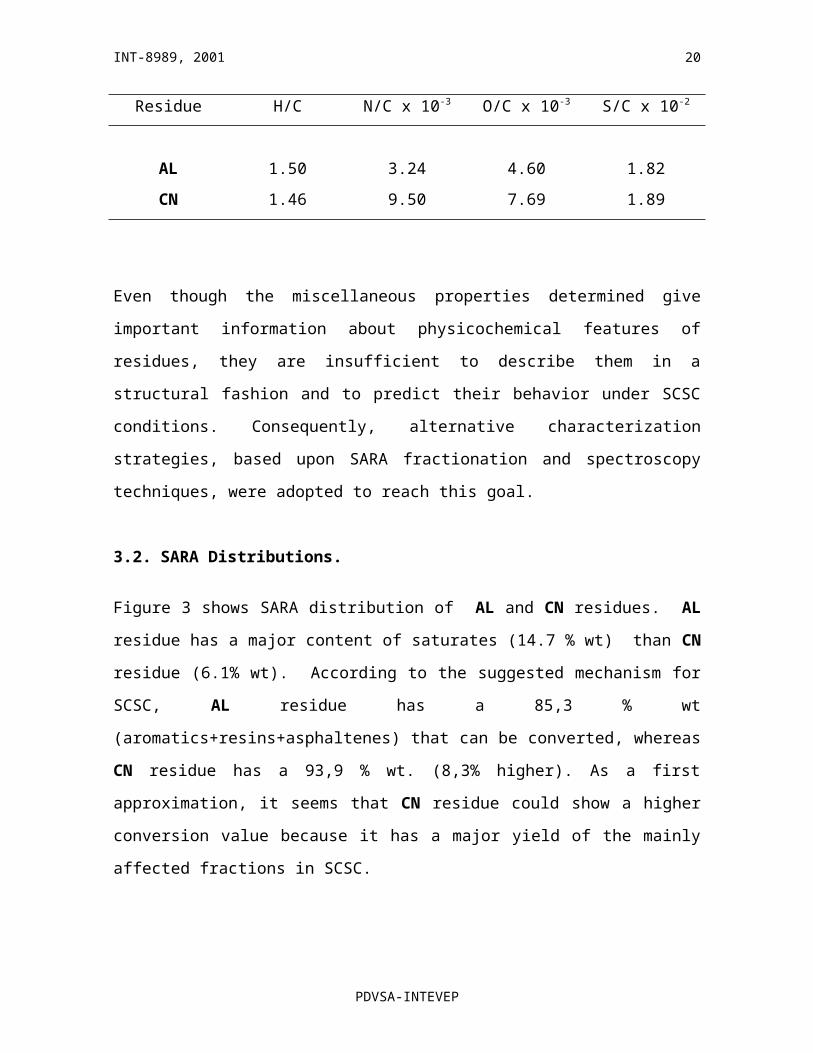
Table 4: Atomic ratios of Arabian Light and Cerro Negro residues
Residue H/C N/C x 10-3 O/C x 10-3 S/C x 10-2
AL 1.50 3.24 4.60 1.82
CN 1.46 9.50 7.69 1.89
Even though the miscellaneous properties determined give important information about
physicochemical features of residues, they are insufficient to describe them in a structural
fashion and to predict their behavior under SCSC conditions. Consequently, alternative
characterization strategies, based upon SARA fractionation and spectroscopy techniques,
were adopted to reach this goal.
3.2. SARA Distributions.
PDVSA-INTEVEP
13
INT-8989, 2001
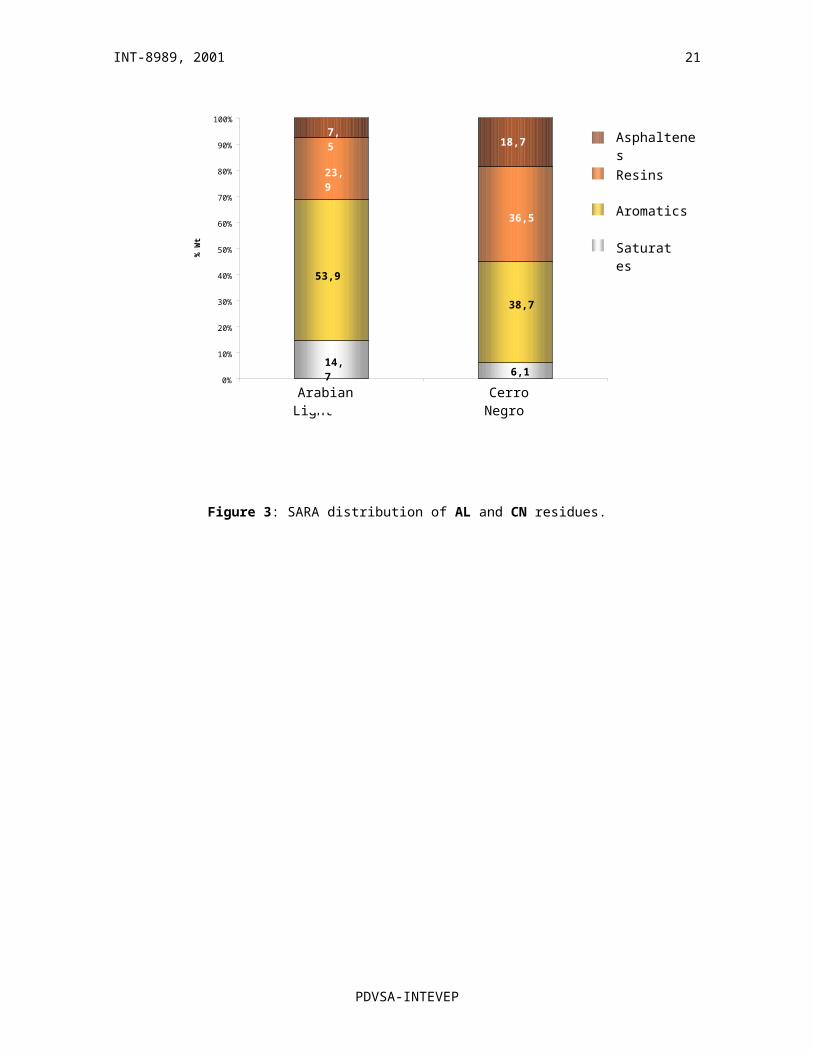
Figure 3 shows SARA distribution of AL and CN residues. AL residue has a major
content of saturates (14.7 % wt) than CN residue (6.1% wt). According to the suggested
mechanism for SCSC, AL residue has a 85,3 % wt (aromatics+resins+asphaltenes) that can
be converted, whereas CN residue has a 93,9 % wt. (8,3% higher). As a first
approximation, it seems that CN residue could show a higher conversion value because it
has a major yield of the mainly affected fractions in SCSC.
Figure 3: SARA distribution of AL and CN residues.
PDVSA-INTEVEP
14
14,76,1
53,9
38,7
23,9
36,5
7,518,7
0%
10%
20%
30%
40%
50%
60%
70%
80%
90%
100%
Arabian Light
% W
t
Saturates
Aromatics
Resins
Asphaltenes
Cerro Negro
INT-8989, 2001
As stated before, aromatics, resins and asphaltenes suffer the most important chemical
changes in SCSC [4-5]. Among them, the aromatic fraction was that affected the most. As
observed in Figure 3, AL residue is richer in aromatic fraction, whereas CN residue is in
polars (resins+ asphaltenes). Even though AL residue presents a higher content in aromatic
fraction, this is not a guarantee to ensure high conversion levels, because in SCSC,
transformations could be associated not only to weight yields of SARA fractions, but also
to the structural characteristics of them [5]. In consequence, it is difficult to establish from
SARA distributions, which of the studied residues will show the highest conversion level.
3.3 Structural Quality of SARA fractions: 13C NMR Analysis.
It has been discussed how SARA distributions do not give enough information to predict
relative conversion levels in SCSC. In consequence, other parameters must be found to
improve such predictions.
It is believed that alkyl substituents in aromatic structures can have a significant influence
on the conversion value [1-5], Therefore, it is necessary to evaluate their relative abundance
in order to establish this influence. Thus, the ratio alkyl substituent/aromatic ring can be
used as a parameter to estimate the structural quality of a SCSC feedstock and to predict its
behavior under SCSC conditions. 13C NMR data gives information about carbon type
distributions (aromatic and aliphatic carbons) of SARA fractions that can be used to
estimate this parameter.
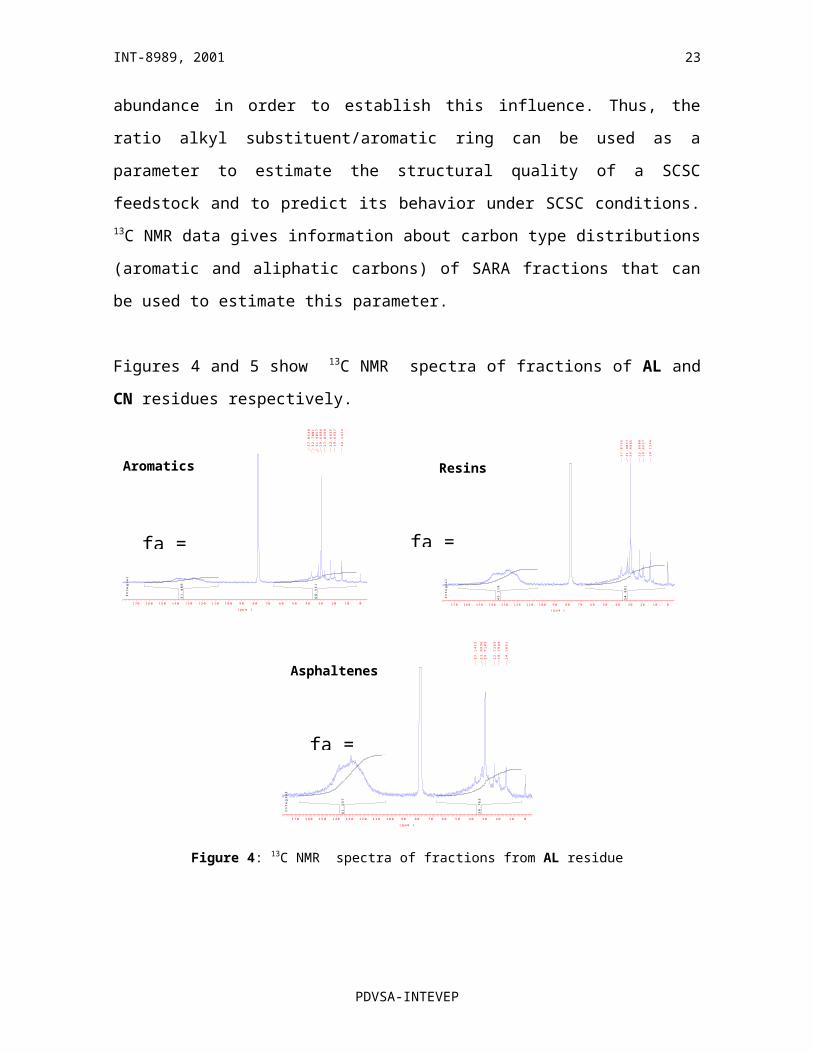
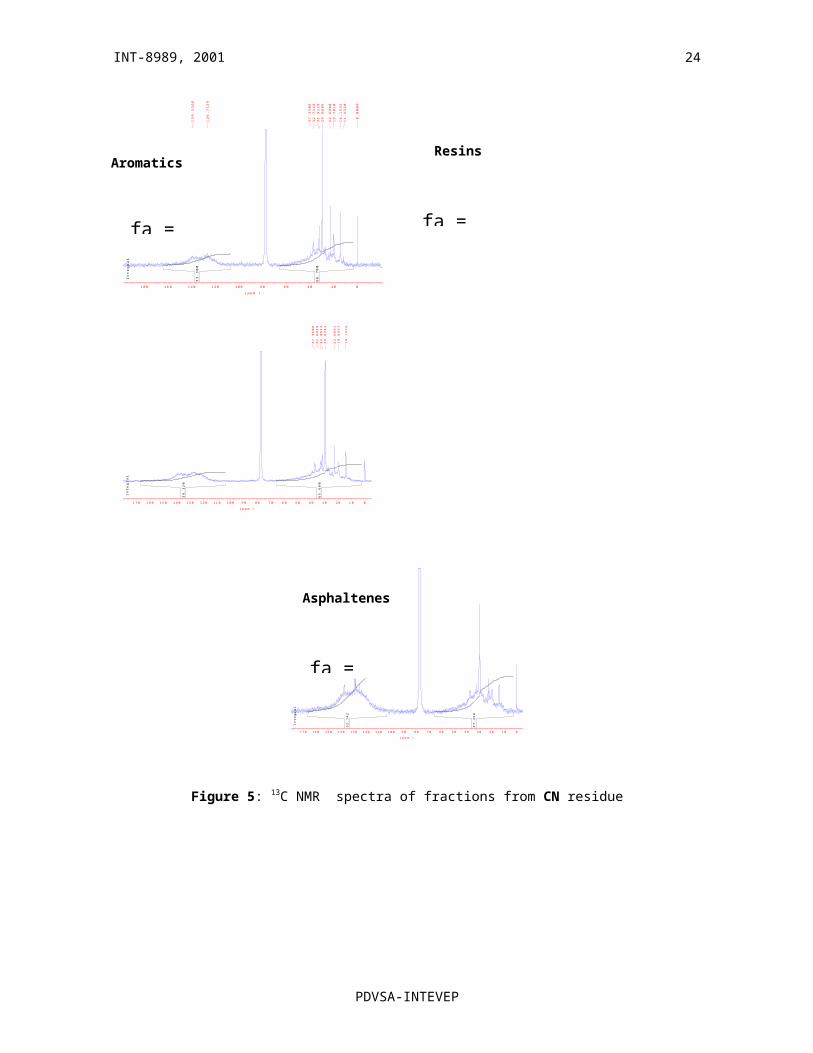
Figures 4 and 5 show 13C NMR spectra of fractions of AL and CN residues respectively.
PDVSA-INTEVEP
15
INT-8989, 2001
31
.4
89
68
.5
11
In
te
gr
al
37
.0
54
83
2.
70
01
31
.9
05
72
9.
68
86
27
.0
59
9
22
.6
83
51
9.
69
37
14
.1
47
4
( p p m )
01 02 03 04 05 06 07 08 09 01 0 01 1 01 2 01 3 01 4 01 5 01 6 01 7 0
45
.1
19
54
.8
81
In
te
gr
al
37
.0
76
5
31
.9
05
72
9.
68
86
22
.6
90
81
9.
69
37
14
.1
54
6
( p p m )
01 02 03 04 05 06 07 08 09 01 0 01 1 01 2 01 3 01 4 01 5 01 6 01 7 0
61
.2
37
38
.7
63
In
te
gr
al
37
.1
41
5
31
.9
99
62
9.
71
03
22
.7
26
91
9.
79
48
14
.1
69
1
( p p m )
01 02 03 04 05 06 07 08 09 01 0 01 1 01 2 01 3 01 4 01 5 01 6 01 7 0
Figure 4: 13C NMR spectra of fractions from AL residue
33
.3
00
66
.7
00
In
te
gr
al
13
9.
33
66
12
6.
71
29
37
.3
50
93
2.
71
46
31
.9
12
92
9.
68
86
22
.6
90
81
9.
70
10
14
.1
54
61
1.
43
20
-0
.0
00
0
( p p m )
02 04 06 08 01 0 01 2 01 4 01 6 01 8 0
34
.3
20
65
.6
80
In
te
gr
al
37
.3
50
93
2.
69
29
31
.8
91
32
9.
67
42
22
.6
69
11
9.
69
37
14
.1
47
4
( p p m )
01 02 03 04 05 06 07 08 09 01 0 01 1 01 2 01 3 01 4 01 5 01 6 01 7 0
PDVSA-INTEVEP
16
Aromatics
fa = 0.315
Resins
fa = 0.451
Asphaltenes
fa = 0.612
Aromatics
fa = 0.333
Resins
fa = 0.343
INT-8989, 2001
52
.7
42
47
.2
58
In
te
gr
al
( p p m )
01 02 03 04 05 06 07 08 09 01 0 01 1 01 2 01 3 01 4 01 5 01 6 01 7 0
Figure 5: 13C NMR spectra of fractions from CN residue
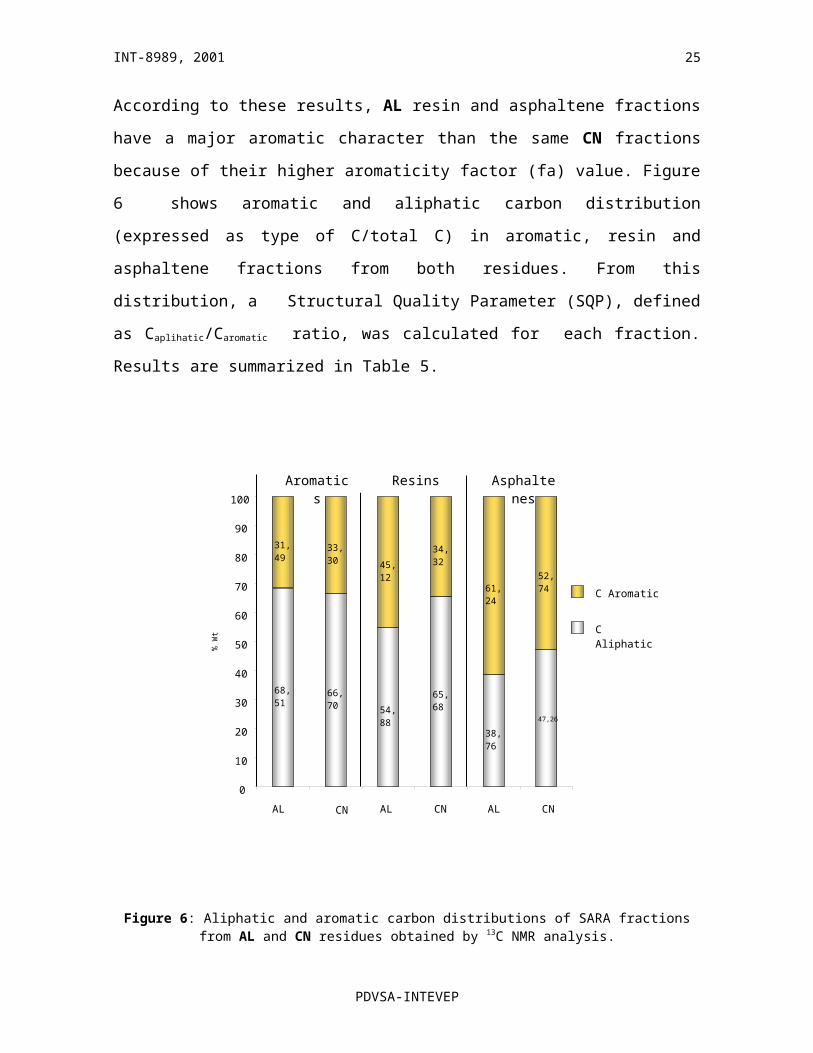
According to these results, AL resin and asphaltene fractions have a major aromatic
character than the same CN fractions because of their higher aromaticity factor (fa) value.
Figure 6 shows aromatic and aliphatic carbon distribution (expressed as type of C/total C)
in aromatic, resin and asphaltene fractions from both residues. From this distribution, a
Structural Quality Parameter (SQP), defined as Caplihatic/Caromatic ratio, was calculated for
each fraction. Results are summarized in Table 5.
PDVSA-INTEVEP
17
Asphaltenes
fa = 0.527
68,51
66,70
65,68
38,76
47,26
31,49
33,30
45,12
34,32
61,24
52,74
54,88
0
10
20
30
40
50
60
70
80
90
100
AL
% W
t
C Aromatic
C Aliphatic
Aromatics Resins Asphaltenes
AL AL CN CN CN
INT-8989, 2001
Figure 6: Aliphatic and aromatic carbon distributions of SARA fractions from AL and CN residues obtained by 13C NMR analysis.
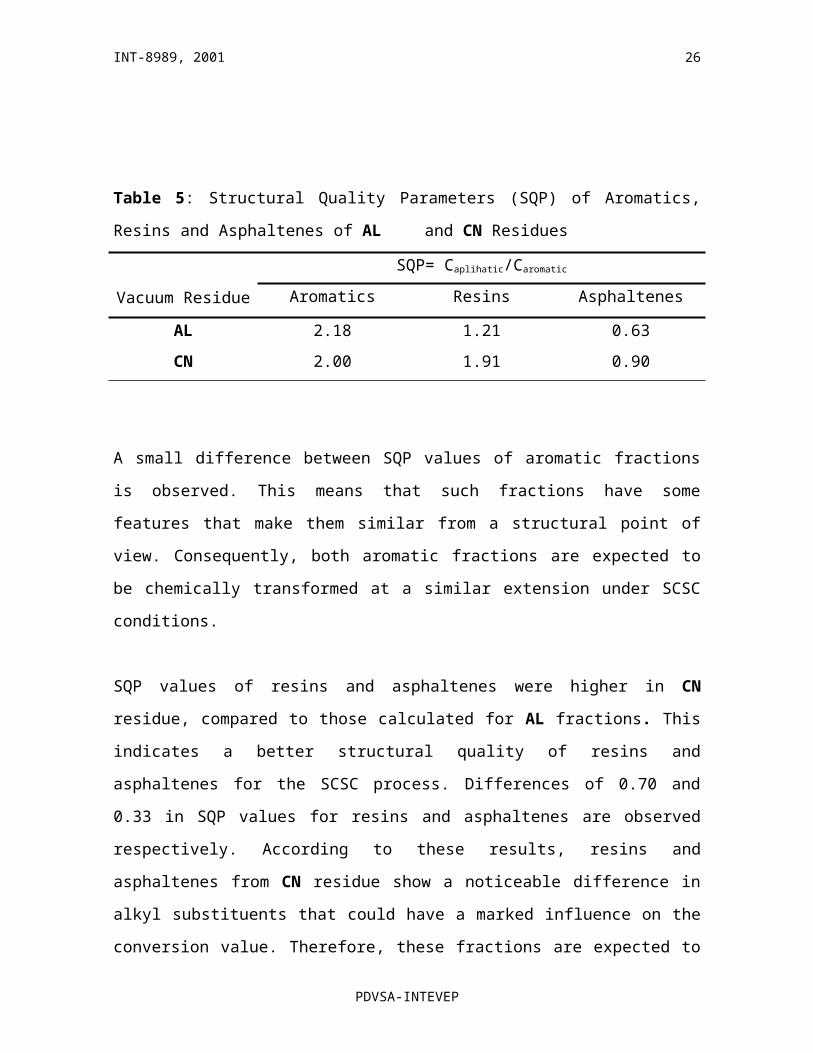
Table 5: Structural Quality Parameters (SQP) of Aromatics, Resins and Asphaltenes of AL
and CN Residues
Vacuum Residue
SQP= Caplihatic/Caromatic
Aromatics Resins Asphaltenes
AL 2.18 1.21 0.63
CN 2.00 1.91 0.90
A small difference between SQP values of aromatic fractions is observed. This means that
such fractions have some features that make them similar from a structural point of view.
Consequently, both aromatic fractions are expected to be chemically transformed at a
similar extension under SCSC conditions.
SQP values of resins and asphaltenes were higher in CN residue, compared to those
calculated for AL fractions. This indicates a better structural quality of resins and
asphaltenes for the SCSC process. Differences of 0.70 and 0.33 in SQP values for resins
and asphaltenes are observed respectively. According to these results, resins and
asphaltenes from CN residue show a noticeable difference in alkyl substituents that could
have a marked influence on the conversion value. Therefore, these fractions are expected to
have a more important contribution to the conversion of CN residue than in the case of AL
residue.
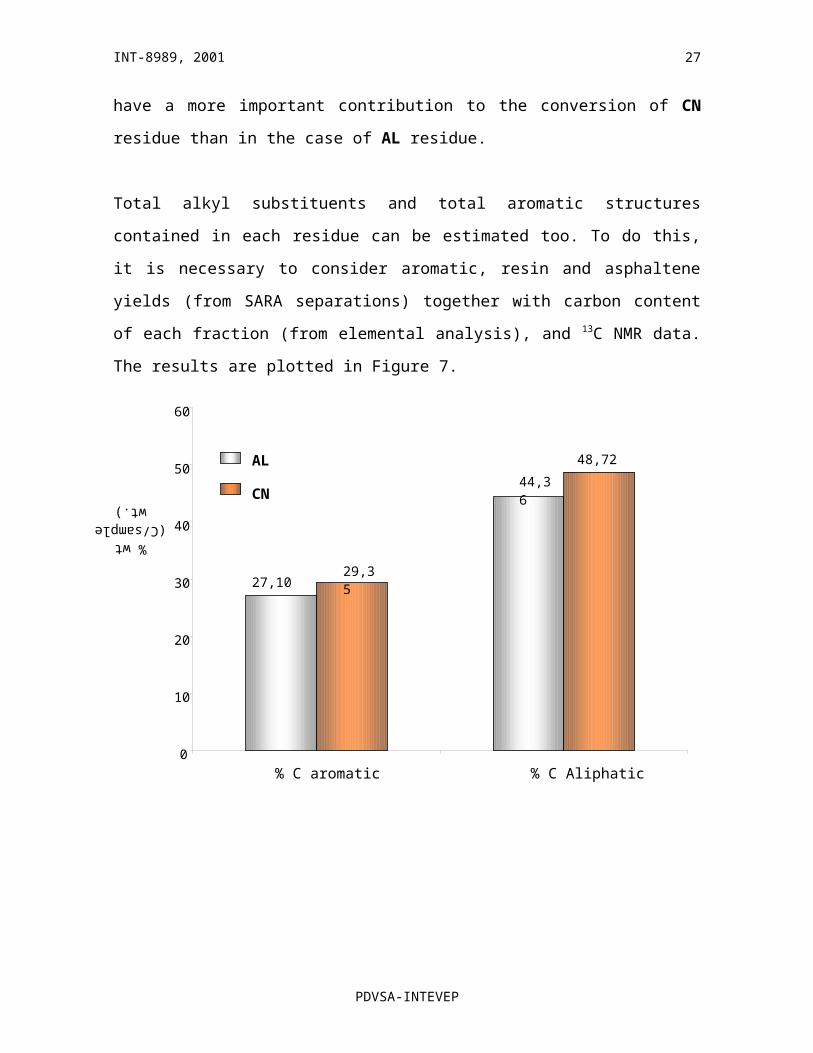
Total alkyl substituents and total aromatic structures contained in each residue can be
estimated too. To do this, it is necessary to consider aromatic, resin and asphaltene yields
PDVSA-INTEVEP
18
INT-8989, 2001
(from SARA separations) together with carbon content of each fraction (from elemental
analysis), and 13C NMR data. The results are plotted in Figure 7.
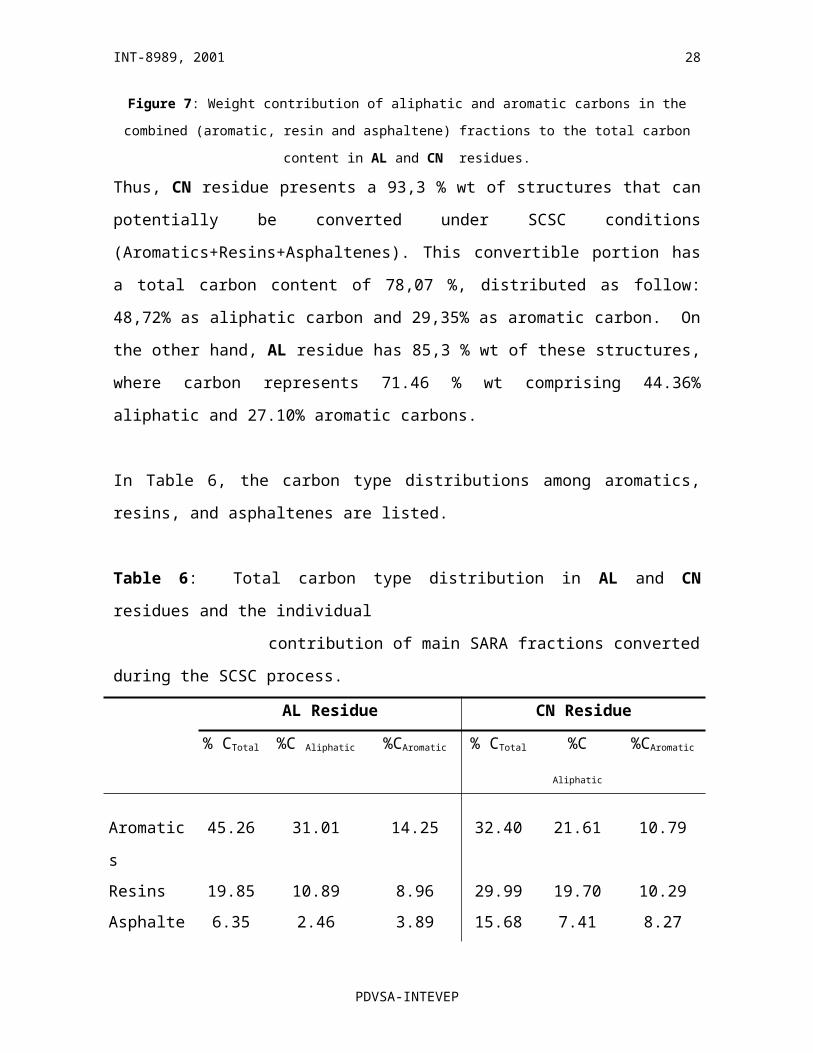
Figure 7: Weight contribution of aliphatic and aromatic carbons in the combined (aromatic, resin and
asphaltene) fractions to the total carbon content in AL and CN residues.
Thus, CN residue presents a 93,3 % wt of structures that can potentially be converted under
SCSC conditions (Aromatics+Resins+Asphaltenes). This convertible portion has a total
carbon content of 78,07 %, distributed as follow: 48,72% as aliphatic carbon and 29,35% as
aromatic carbon. On the other hand, AL residue has 85,3 % wt of these structures, where
carbon represents 71.46 % wt comprising 44.36% aliphatic and 27.10% aromatic carbons.
In Table 6, the carbon type distributions among aromatics, resins, and asphaltenes are
listed.
Table 6: Total carbon type distribution in AL and CN residues and the individual
contribution of main SARA fractions converted during the SCSC process.
PDVSA-INTEVEP
19
27,10
44,36
29,35
48,72
0
10
20
30
40
50
60
% C aromatic % C Aliphatic
% wt (C/sample wt.)
AL
CN
INT-8989, 2001
AL Residue CN Residue
% CTotal %C Aliphatic %CAromatic % CTotal %C Aliphatic %CAromatic
Aromatics 45.26 31.01 14.25 32.40 21.61 10.79
Resins 19.85 10.89 8.96 29.99 19.70 10.29
Asphaltenes 6.35 2.46 3.89 15.68 7.41 8.27
Total 71.46 44.36 27.10 78.07 48.72 29.35
Considering these results, a Total Structural Quality Parameter (TSQP) was calculated for
each residue considering total aliphatic and aromatic carbon content in Aromatic, Resin and
Asphaltene fractions ((Caliphatic)/(Caromatic)). Results are listed in Table 7.
Table 7: Total Structural Quality Parameter Calculated for AL and CN Residues.
Residue TSQP= (Caliphatic)/(Caromatic).
AL 1.64
CN 1.66
Thus, a subtle difference in TSQP values was observed: CN residue TSQP value is a little
bit higher compared to the one obtained for AL residue.
To explain this result, we have to consider that TSQP value has two main components: A
quality component and a mass yield component. Quality component is related to the
individual SQP value of the mainly affected SARA fractions, while the mass yield
component is related to the relative weight percentage of them. Each component will have
and important contribution to the TSQP value. For instance, mass yield of the aromatic
fraction of AL residue will have a more important contribution than the one corresponding
to resins and asphaltenes. In contrast, mass yield of resins and asphaltenes from CN residue
will have a significant contribution to the TSQP value than the aromatic one. Depending on
PDVSA-INTEVEP
20
INT-8989, 2001
the contribution of each component to TSQP, the resulting difference between two TSQP
values will be bigger or smaller. In this case, the difference was small. In consequence, it is
difficult to make a prediction based only on this parameter. Individual SQP values should
be considered instead.
As stated before, the aromatic fractions in both residues are expected to undergo chemical
changes at the same extension because they have almost the same SQP value. However,
resins and asphaltenes in CN residue should be more affected than the same fractions in AL
residue. The global effect is that CN residue should experience more chemical changes
than residue AL residue SCSC conditions.
3.4 Structural Quality Parameters Calculated from 1H NMR Data.
Average molecular parameters were calculated using information from 1H NMR spectra,
VPO molecular weight, and total carbon content as indicated in reference [24]. Aliphatic
and aromatic carbon content of aromatic, resin and asphaltene fractions were determined
among these parameters. Additionally, SQP values were calculated too. Results are
summarized in Table 8.
Table 8: SQP values Calculated from 1H NMR Data
Residue
Aromatics Resins Asphaltenes
%
Caliphatic
% Caromatic
SQP%
Caliphatic
% Caromatic
SQP%
Caliphatic
% Caromatic
SQP
AL 72.18 27.82 2.59 54.71 45.29 1.21 60.01 39.96 1.50
CN 72.10 27.90 2.58 58.99 41.01 1.44 61.73 38.26 1.61
PDVSA-INTEVEP
21
INT-8989, 2001
As can be seen, SQP values determined from 1H NMR data, differs from those calculated
from 13C NMR data. The difference is attributed to the considerations made during average
molecular parameter (AMP) calculation. However, the tendency is the same: Higher SQP
value for resins and asphaltenes from CN residue and almost the same SQP value for the
aromatic fraction of both residues. Therefore, predictions made upon 13C NMR data are
reinforced by 1H NMR results. Less demanding analytical requirements of 1H NMR suggest
this option as a better alternative for routine analysis.
3.5 Pilot Plant tests.
Predictions were confirmed during SCSC pilot plant test. These tests were performed using
AL and CN residues as feedstocks. The reaction was stopped at the conversion level where
products showed a minimal P-value of 1.20. In this case, P-value was used as a product
stability criterion (a P-value under 1.15 indicates that products are unstable and solid
deposition (asphaltenes) can occur [1]).
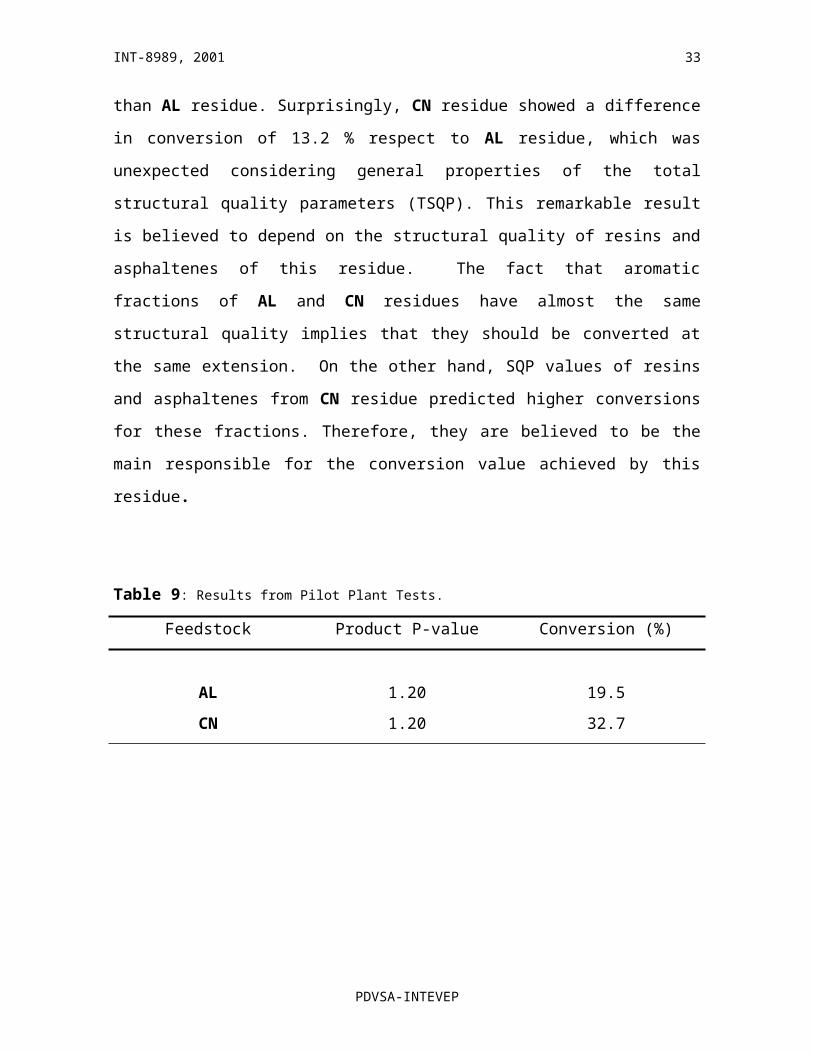
Table 9 shows results obtained from pilot plant tests. As predicted, at the same critical
product stability level (P-value of 1.20), CN residue showed higher conversion level than
AL residue. Surprisingly, CN residue showed a difference in conversion of 13.2 % respect
to AL residue, which was unexpected considering general properties of the total structural
quality parameters (TSQP). This remarkable result is believed to depend on the structural
quality of resins and asphaltenes of this residue. The fact that aromatic fractions of AL and
CN residues have almost the same structural quality implies that they should be converted
at the same extension. On the other hand, SQP values of resins and asphaltenes from CN
residue predicted higher conversions for these fractions. Therefore, they are believed to be
the main responsible for the conversion value achieved by this residue.
Table 9: Results from Pilot Plant Tests.
PDVSA-INTEVEP
22
INT-8989, 2001
Feedstock Product P-value Conversion (%)
AL 1.20 19.5
CN 1.20 32.7
3.6 Structural Details of Aliphatic Substituents in SARA Fractions. RICO Product
Analysis.
To get a deeper knowledge about aliphatic distribution in aromatic, resin and asphaltene
fractions from the studied residues, RICO reaction was performed. Four kinds of aliphatic
substituents were identified: Normal alkyl side chains, branched alkyl side chains,
polymethylene bridges and hydroaromatic (naphthenic) structures. Remarks about these
results are discussed as follow:
3.6.1. Normal Alkyl Side Chains.
Alkyl side chains attached to aromatic carbons in aromatic, resin and asphaltene molecules
can be converted to alkanoic acids by RICO as shown is scheme 1 [9-21]. If the R groups
are normal alkyl groups, then the resultant acids form a series of n-alkanoic acids. These
products were quantified by GC-MS in the form of methyl- esters by the m/z 74 fragment
ion. Authors have reported length of the n-alkyl side chains from C2 to C28 and up to C33
[14-21]. However, shorter chains (from C2 to C5) are difficult to analyze as ester
derivatives because of their high volatility, they are lost during the evaporation procedure
performed as a previous step to the GC-MS analysis[11-21]. Ion Chromatographic
technique has been used to solve this problem [15-20]. Unfortunately, this methodology
was not adopted in the present work, so the information related to these specific
substituents was lost. As a consequence, normal and branched alkyl chains distributions
start in C6 component for all fractions analyzed.
3.6.1.1 Normal Alkyl Chains in Aromatic Fractions.
PDVSA-INTEVEP
23
INT-8989, 2001
RICO oxidation has been successfully used in the characterization of resins and
asphaltenes [9-21]. Works related to the characterization of aromatic fractions by this
chemical method has not been reported up to now. It is important to point out that this is
the first work done on this fraction. Results are discussed in the next paragraphs.
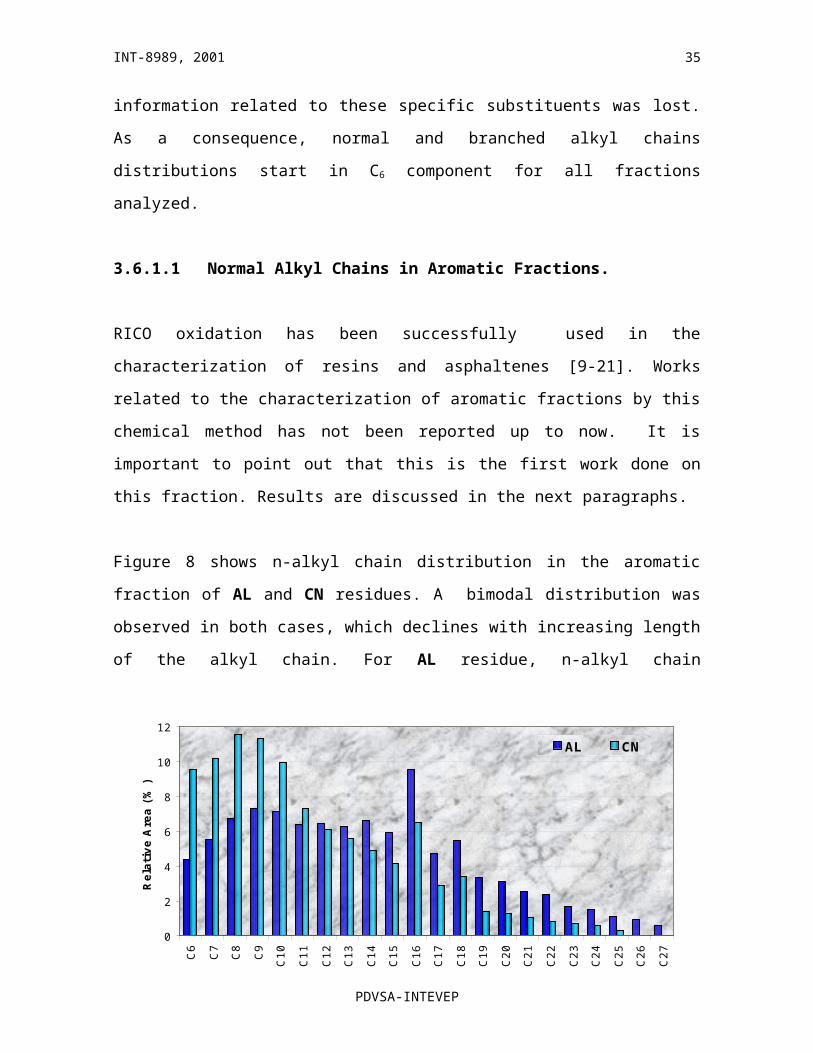
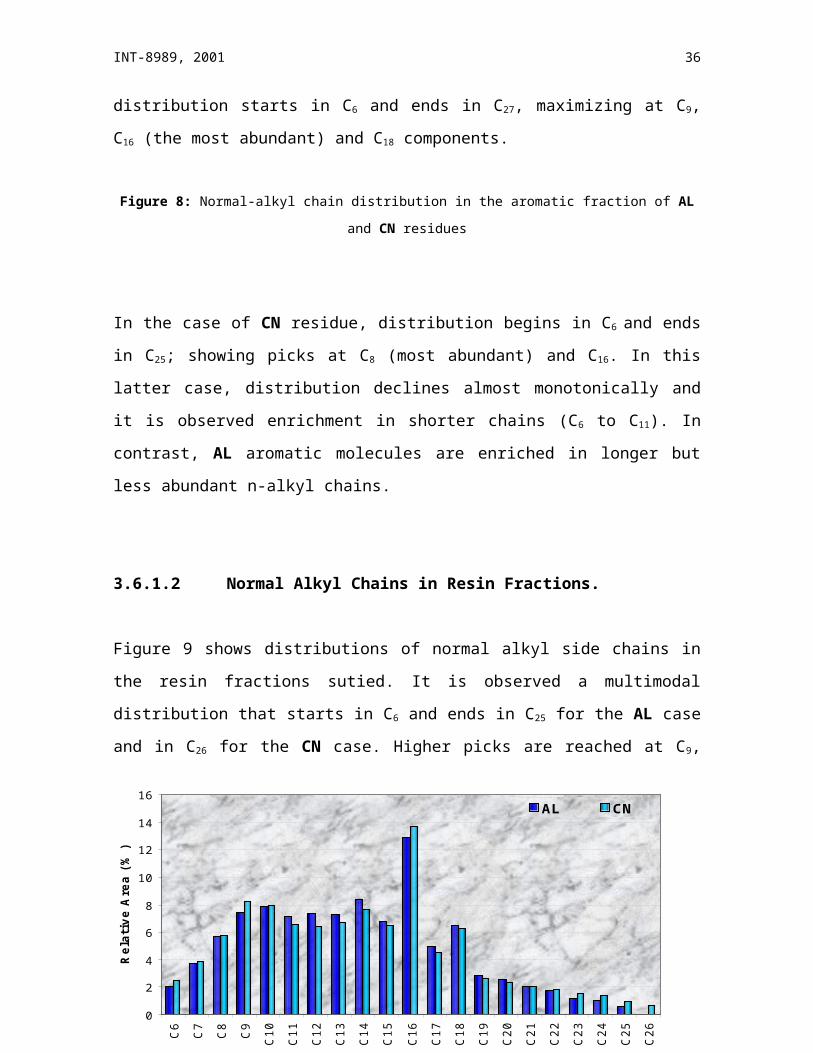
Figure 8 shows n-alkyl chain distribution in the aromatic fraction of AL and CN residues.
A bimodal distribution was observed in both cases, which declines with increasing length
of the alkyl chain. For AL residue, n-alkyl chain distribution starts in C6 and ends in C27,
maximizing at C9, C16 (the most abundant) and C18 components.
Figure 8: Normal-alkyl chain distribution in the aromatic fraction of AL and CN residues
In the case of CN residue, distribution begins in C6 and ends in C25; showing picks at C8
(most abundant) and C16. In this latter case, distribution declines almost monotonically and
it is observed enrichment in shorter chains (C6 to C11). In contrast, AL aromatic molecules
are enriched in longer but less abundant n-alkyl chains.
3.6.1.2 Normal Alkyl Chains in Resin Fractions.
PDVSA-INTEVEP
24
0
2
4
6
8
10
12
C6
C7
C8
C9
C10
C11
C12
C13
C14
C15
C16
C17
C18
C19
C20
C21
C22
C23
C24
C25
C26
C27
Rela
tive A
rea (
%)
AL CN
INT-8989, 2001
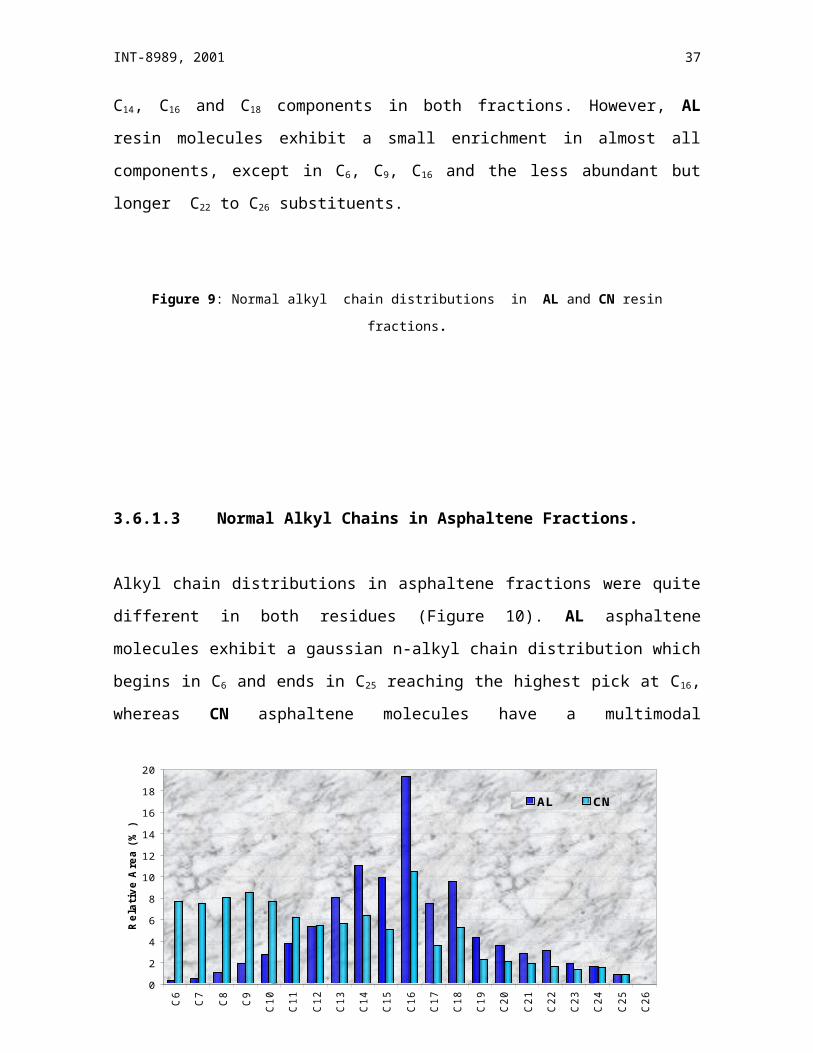
Figure 9 shows distributions of normal alkyl side chains in the resin fractions sutied. It is
observed a multimodal distribution that starts in C6 and ends in C25 for the AL case and in
C26 for the CN case. Higher picks are reached at C9, C14, C16 and C18 components in both
fractions. However, AL resin molecules exhibit a small enrichment in almost all
components, except in C6, C9, C16 and the less abundant but longer C22 to C26 substituents.
Figure 9: Normal alkyl chain distributions in AL and CN resin fractions.
3.6.1.3 Normal Alkyl Chains in Asphaltene Fractions.
PDVSA-INTEVEP
25
0
2
4
6
8
10
12
14
16
C6
C7
C8
C9
C10
C11
C12
C13
C14
C15
C16
C17
C18
C19
C20
C21
C22
C23
C24
C25
C26
Rela
tive A
rea (
%)
AL CN
INT-8989, 2001
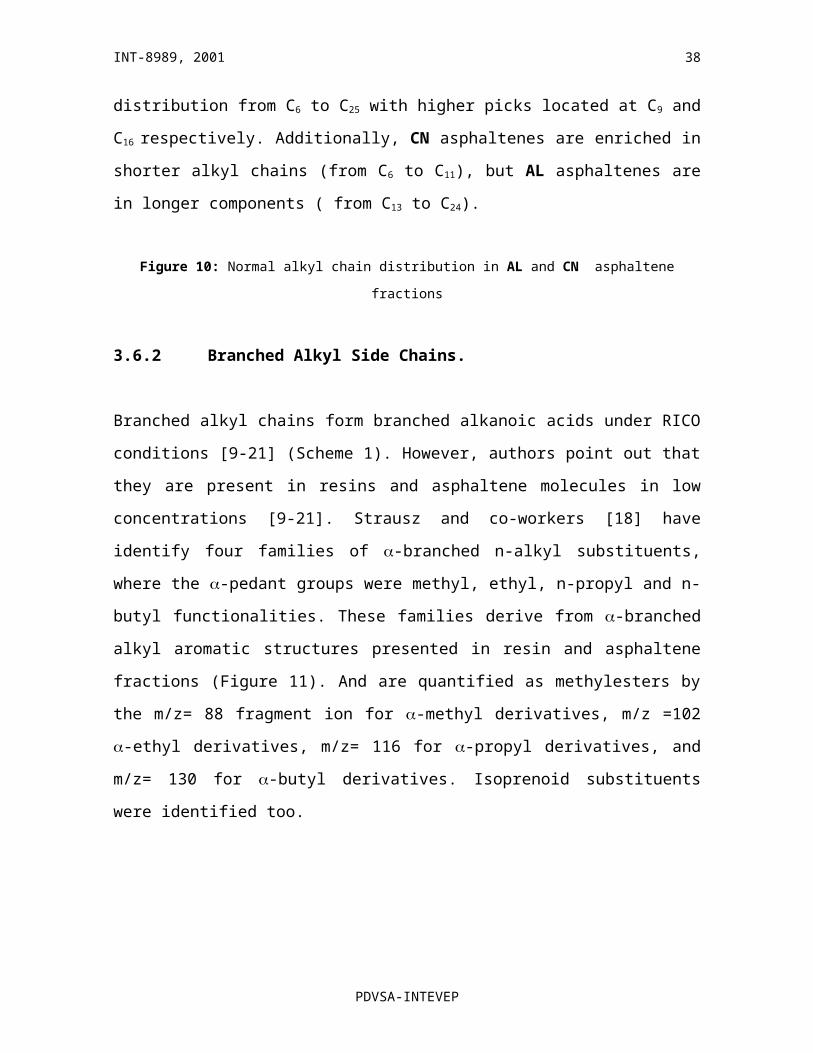
Alkyl chain distributions in asphaltene fractions were quite different in both residues
(Figure 10). AL asphaltene molecules exhibit a gaussian n-alkyl chain distribution which
begins in C6 and ends in C25 reaching the highest pick at C16, whereas CN asphaltene
molecules have a multimodal distribution from C6 to C25 with higher picks located at C9 and
C16 respectively. Additionally, CN asphaltenes are enriched in shorter alkyl chains (from C6
to C11), but AL asphaltenes are in longer components ( from C13 to C24).
Figure 10: Normal alkyl chain distribution in AL and CN asphaltene fractions
3.6.2 Branched Alkyl Side Chains.
Branched alkyl chains form branched alkanoic acids under RICO conditions [9-21]
(Scheme 1). However, authors point out that they are present in resins and asphaltene
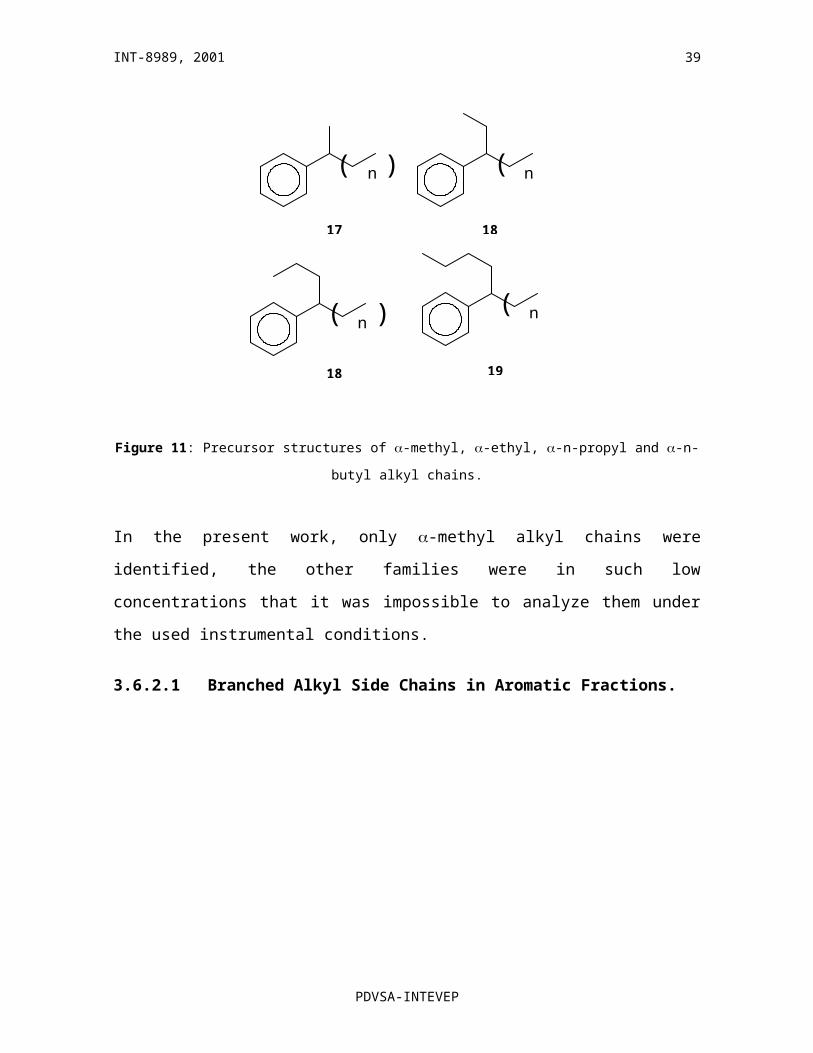
molecules in low concentrations [9-21]. Strausz and co-workers [18] have identify four
families of -branched n-alkyl substituents, where the -pedant groups were methyl, ethyl,
n-propyl and n-butyl functionalities. These families derive from -branched alkyl aromatic
structures presented in resin and asphaltene fractions (Figure 11). And are quantified as
methylesters by the m/z= 88 fragment ion for -methyl derivatives, m/z =102 -ethyl
derivatives, m/z= 116 for -propyl derivatives, and m/z= 130 for -butyl derivatives.
Isoprenoid substituents were identified too.
PDVSA-INTEVEP
26
0
2
4
6
8
10
12
14
16
18
20
C6
C7
C8
C9
C10
C11
C12
C13
C14
C15
C16
C17
C18
C19
C20
C21
C22
C23
C24
C25
C26
Rela
tive A
rea (
%)
AL CN
INT-8989, 2001
Figure 11: Precursor structures of -methyl, -ethyl, -n-propyl and -n-butyl alkyl chains.
In the present work, only -methyl alkyl chains were identified, the other families were in
such low concentrations that it was impossible to analyze them under the used instrumental
conditions.
3.6.2.1 Branched Alkyl Side Chains in Aromatic Fractions.
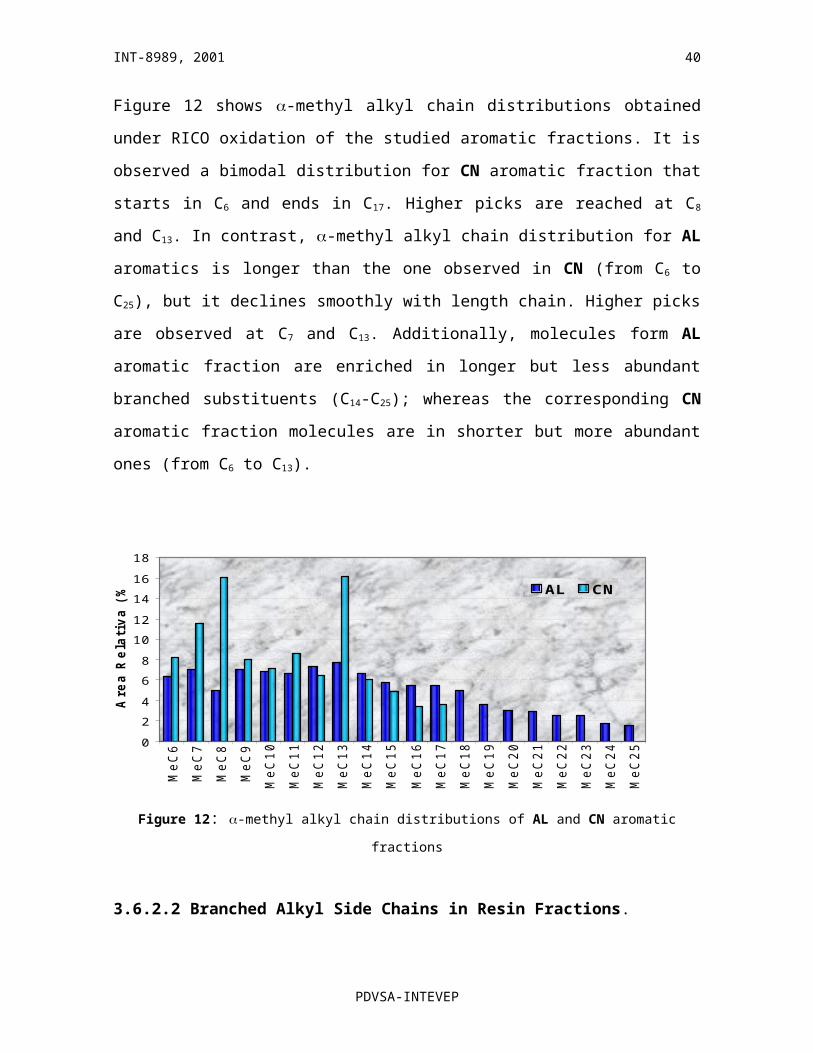
Figure 12 shows -methyl alkyl chain distributions obtained under RICO oxidation of the
studied aromatic fractions. It is observed a bimodal distribution for CN aromatic fraction
that starts in C6 and ends in C17. Higher picks are reached at C8 and C13. In contrast, -
methyl alkyl chain distribution for AL aromatics is longer than the one observed in CN
(from C6 to C25), but it declines smoothly with length chain. Higher picks are observed at C7
and C13. Additionally, molecules form AL aromatic fraction are enriched in longer but less
abundant branched substituents (C14-C25); whereas the corresponding CN aromatic fraction
molecules are in shorter but more abundant ones (from C6 to C13).
PDVSA-INTEVEP
27
( )n n( )
n( ) n( )
17 18
18 19
INT-8989, 2001
Figure 12: -methyl alkyl chain distributions of AL and CN aromatic fractions
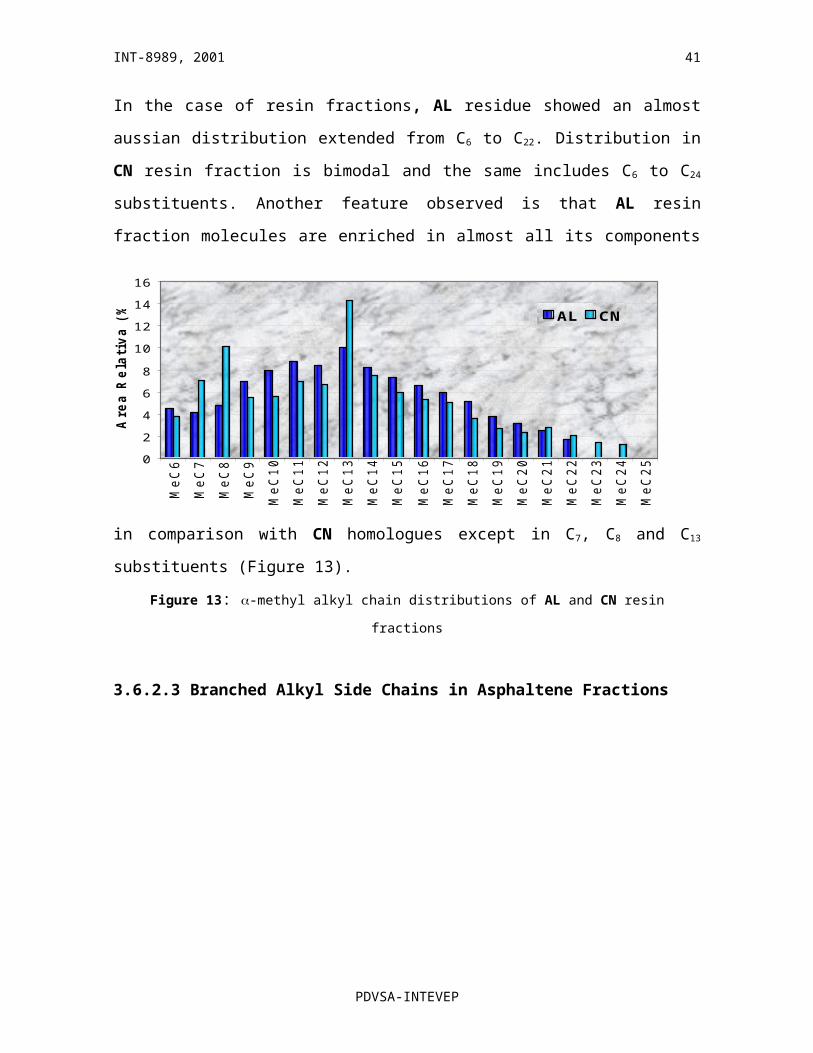
3.6.2.2 Branched Alkyl Side Chains in Resin Fractions.
In the case of resin fractions, AL residue showed an almost aussian distribution extended
from C6 to C22. Distribution in CN resin fraction is bimodal and the same includes C6 to C24
substituents. Another feature observed is that AL resin fraction molecules are enriched in
almost all its components in comparison with CN homologues except in C7, C8 and C13
substituents (Figure 13).
Figure 13: -methyl alkyl chain distributions of AL and CN resin fractions
PDVSA-INTEVEP
28
0
2
4
6
8
10
12
14
16
18
MeC6
MeC7
MeC8
MeC9
MeC10
MeC11
MeC12
MeC13
MeC14
MeC15
MeC16
MeC17
MeC18
MeC19
MeC20
MeC21
MeC22
MeC23
MeC24
MeC25
Are
a R
ela
tiva (
%)
AL CN
0
2
4
6
8
10
12
14
16
MeC6
MeC7
MeC8
MeC9
MeC10
MeC11
MeC12
MeC13
MeC14
MeC15
MeC16
MeC17
MeC18
MeC19
MeC20
MeC21
MeC22
MeC23
MeC24
MeC25
Are
a R
ela
tiva (
%)
AL CN
INT-8989, 2001
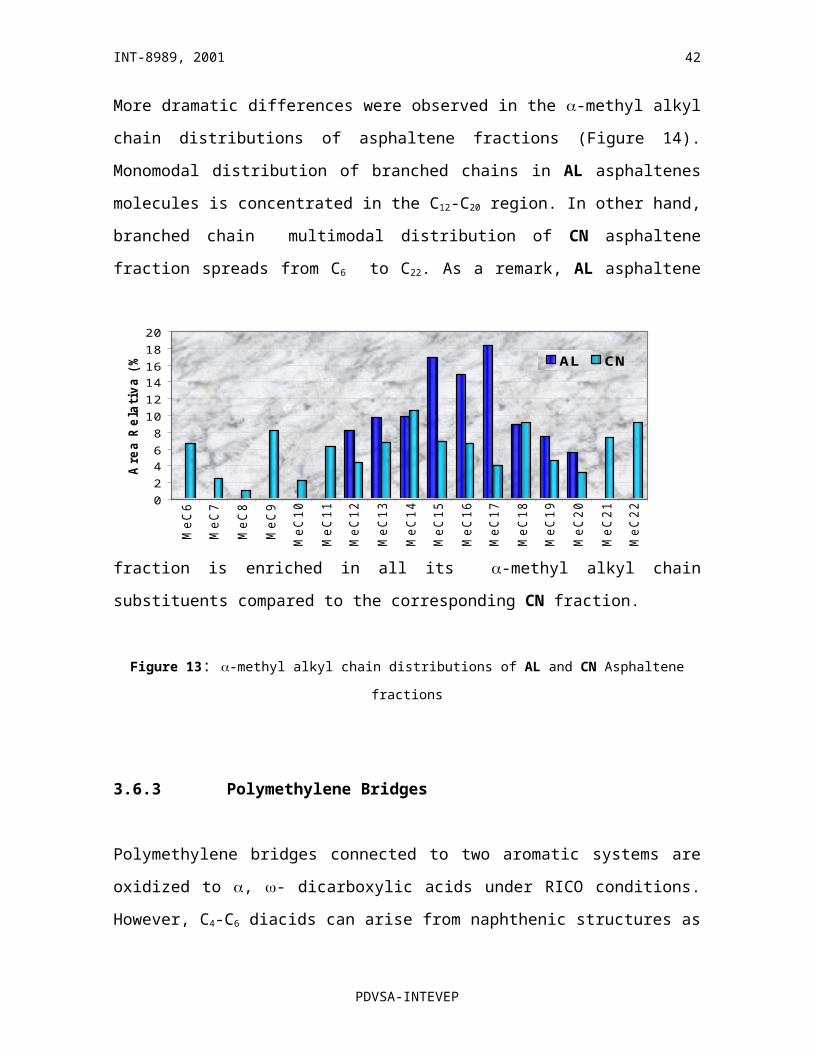
3.6.2.3 Branched Alkyl Side Chains in Asphaltene Fractions
More dramatic differences were observed in the -methyl alkyl chain distributions of
asphaltene fractions (Figure 14). Monomodal distribution of branched chains in AL
asphaltenes molecules is concentrated in the C12-C20 region. In other hand, branched chain
multimodal distribution of CN asphaltene fraction spreads from C6 to C22. As a remark, AL
asphaltene fraction is enriched in all its -methyl alkyl chain substituents compared to the
corresponding CN fraction.
Figure 13: -methyl alkyl chain distributions of AL and CN Asphaltene fractions
3.6.3 Polymethylene Bridges
Polymethylene bridges connected to two aromatic systems are oxidized to , -
dicarboxylic acids under RICO conditions. However, C4-C6 diacids can arise from
naphthenic structures as shown in scheme 2 [9-20]. Strausz and co-workers have reported
distributions of polymethylene bridges ranging from C4 to C33. C2 and C3 diacids are
unstable under RICO conditions and they are further oxidized to CO2 [13,16]. In the
present work, dicarboxylic acids (polymethylene bridges) were analyzed by GC-MS as
PDVSA-INTEVEP
29
0
2
4
6
8
10
12
14
16
18
20
MeC6
MeC7
MeC8
MeC9
MeC10
MeC11
MeC12
MeC13
MeC14
MeC15
MeC16
MeC17
MeC18
MeC19
MeC20
MeC21
MeC22
Are
a R
ela
tiva (
%)
AL CN
INT-8989, 2001
methyl-ester using m/z = 59 fragment ion to the shorter components (C4-C9) and m/z= 98
fragment ion for longer components (C10-C20). Distributions were split because of the
decreasing intensity of m/z = 59 fragment ion with length chain. In longer chains, m/z= 98
fragment ion signal became more intense.
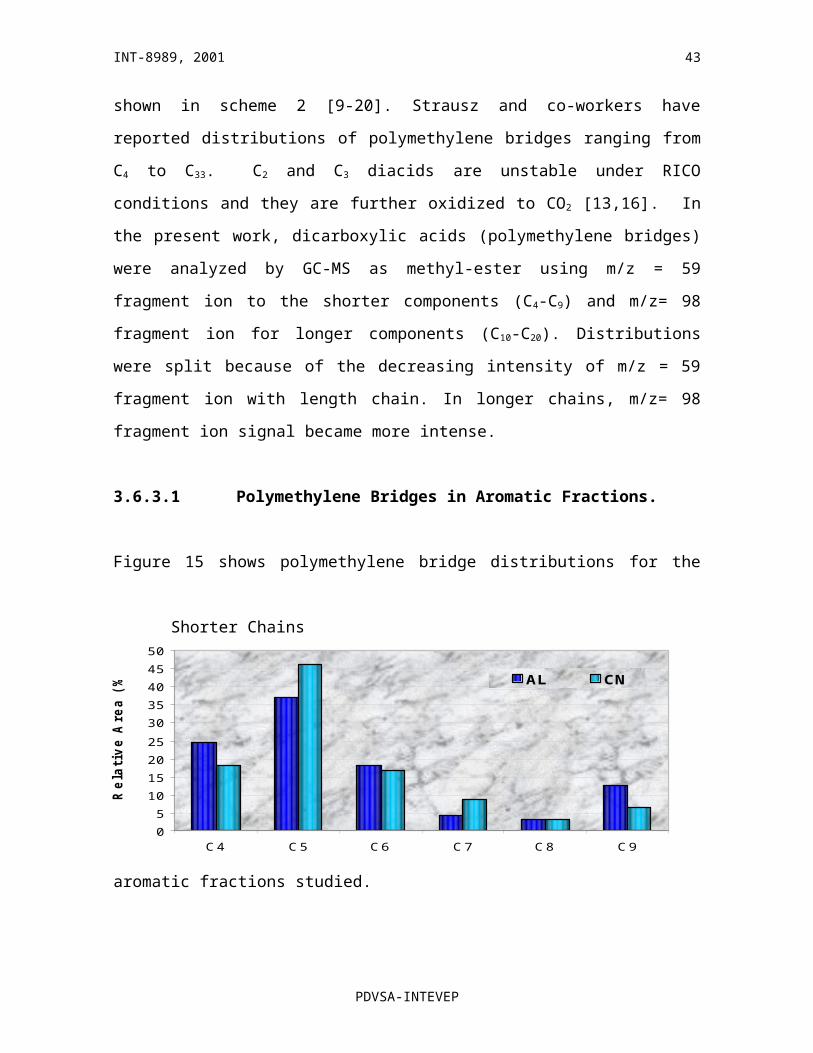
3.6.3.1 Polymethylene Bridges in Aromatic Fractions.
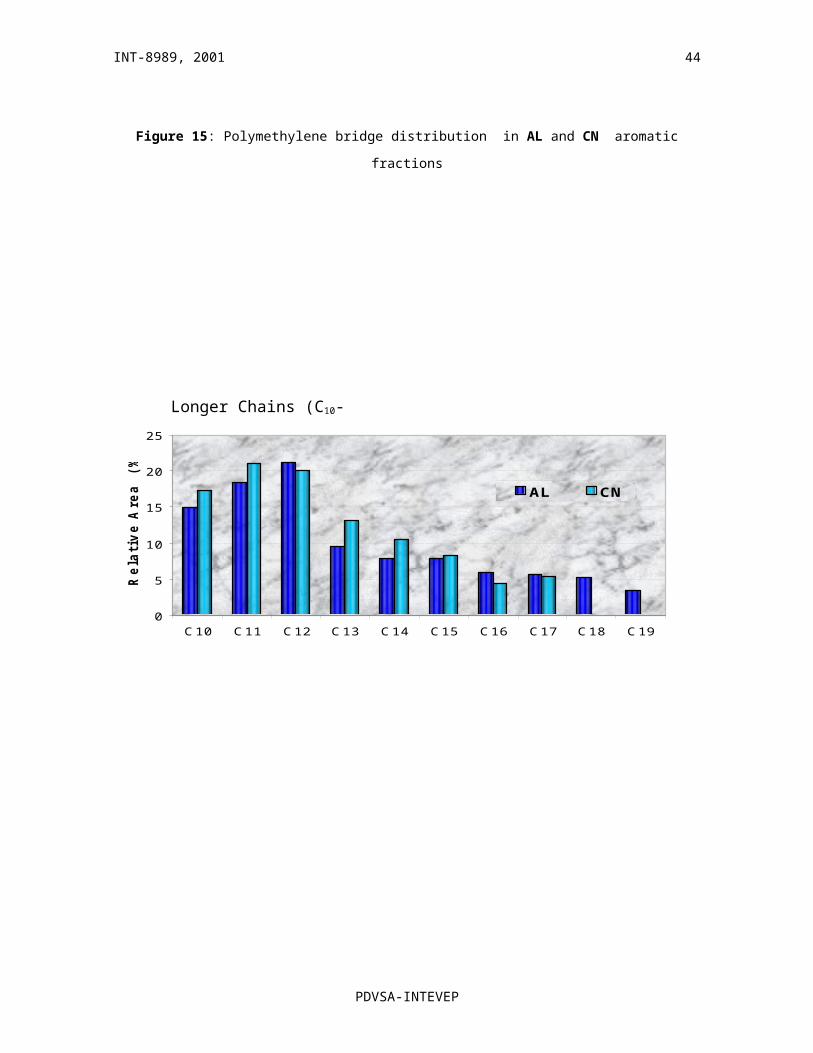
Figure 15 shows polymethylene bridge distributions for the aromatic fractions studied.
Figure 15: Polymethylene bridge distribution in AL and CN aromatic fractions
PDVSA-INTEVEP
30
0
5
10
15
20
25
30
35
40
45
50
C4 C5 C6 C7 C8 C9
Rela
tive A
rea (
%)
AL CN
0
5
10
15
20
25
C10 C11 C12 C13 C14 C15 C16 C17 C18 C19
Rela
tive A
rea
(%
)
AL CN
Shorter Chains (C4-C9)
Longer Chains (C10-C19)
INT-8989, 2001
In both aromatic fractions, short polymethylenic chain distributions showed a monomodal
shape that declines smoothly with increasing length chain. A similar trend is observed in
longer polymethylenic substituents. In the case of AL residue, aromatic fraction molecules
exhibit a total distribution from C4 to C19, with higher picks located at C5, C11 and C12
substituents. Similar higher picks are observed in CN aromatic fraction molecules.
However, the distribution extends up to C17.
Concerning to the relative abundance, CN aromatic molecules are enriched in C5, C7, C8
shorter components and in almost all the longer substituents with the exception of C12, C16
and C17 chains.
3.6.3.2 Polymethylene Bridges in Resins Fractions.
Similar monomodal shapes were found in polymethylene bridge distributions of resins
fractions from AL and CN residues (Figure 16). AL resin fraction exhibits a distribution
ranging from C4 to C17 with higher picks at C5 and C11; whereas distribution in CN resin
fraction is spread up to C19 with prominent picks at C5 and C12 respectively.
In terms of relative abundance, enrichment in C4, C5, C7, C12, C15, and C17-C19 components
was observed in the CN resin fraction in comparison with the same AL fraction.
PDVSA-INTEVEP
31
INT-8989, 2001
Figure 16: Polymethylene bridge distribution in AL and CN resin fractions
3.6.3.3 Polymethylene Bridges in Asphaltene Fractions.
Polymethylenic bridges in asphaltene fractions showed the same monomodal patterns
observed in aromatic and resin fractions. Figure 17 shows the results obtained. Prominent
picks are reached at C5 and C12 components as well as in aromatics and resins.
Nevertheless, differences in relative abundance and length chain were observed. Thus,
polymethylenic bridge distribution in AL asphaltenes ranged from C4 to C18, where the C5
PDVSA-INTEVEP
32
0
5
10
15
20
25
30
35
40
C4 C5 C6 C7 C8 C9
Rela
tive A
rea (
%)
AL CN
Shorter Chains (C4-C9)
0
5
10
15
20
25
C10 C11 C12 C13 C14 C15 C16 C17 C18 C19
Rela
tiv
e A
rea
(%
)
AL CN
Longer Chains (C10-C19)
INT-8989, 2001
and C12 components were the most important. Enrichment in C6-C9 and C13, C14, C17 and C18
substituents was observed in contrast with the same components in CN asphaltenes.
Polymethylenic bridge distribution in CN asphaltenes is not so extended as in AL
homologue fraction. It ends at C16 with higher picks in C5 and C12 and a significant
abundance in C4, C5, C10-C12 and C15-C16 substituents.
Figure 17: Polymethylene bridge distribution in AL and CN asphaltene fractions
PDVSA-INTEVEP
33
0
5
10
15
20
25
30
35
40
C4 C5 C6 C7 C8 C9
Rela
tive A
rea(%
)
AL CN
0
5
10
15
20
25
30
C10 C11 C12 C13 C14 C15 C16 C17 C18
Rela
tive A
rea (
%)
AL CN
Shorter Chains (C4-C9)
Longer Chains (C10-C18)
INT-8989, 2001
3.6.4 Hydroaromatic Structures.
During RICO reaction experiences, Nomura and co-workers [15-17] identified some alkyl
polycarboxylic acids as possible products of the oxidation of three or more aryl-substituted
alkyl bridges and the oxidation of partially saturated condensed structures (Scheme 3). It is
believe with high probability that these products arise from the latter precursors
(hydroaromatic structures). Thus, 1,2,3-tricarboxy propane (C3 triacid), 1,2,4-tricarboxy-
butane (C4 triacid) and 1,2,3,4- tetracarboxy-butane (C4-tetraacid) were successfully
identified by GC-MS as methylesters.
In the present work, only C3 and C4 triacids were identified by the m/z =127 fragment ion.
C4 tetraacid was not observed in all the studied cases.
3.6.4.1 Hydroaromatic Structures in Aromatic and Resin Fractions
Trends in hydroaromatic structures distribution in aromatic and resin fractions of both
residue were very similar (Figure 18). In these fractions, CN residue showed higher
contents in C3-triacid products compared to the C4 homologue. This result is a reflect of the
high concentration of hydroaromatic fragments in aromatic and resin fraction of CN residue
that are similar to the structures 5, 6, and 7 showed in Scheme 3.
Related to the AL aromatic and resin fractions, an enrichment in C4 triacid was found,
which means that structures as 8, 9, and 10 (Scheme 3) dominate in these fractions.
PDVSA-INTEVEP
34
Resins
INT-8989, 2001
Figure 18: Distribution of C3 and C4 tricabcoxylic acids as representative products of hydroaromatic
structures in AL and CN aromatic and resin fractions
3.6.4.2 Hydroaromatic Structures in Asphaltene Fractions
Hydroaromatic distribution in asphaltene fractions was different than those observed in
aromatics and resins (Figure 19). In this case, the relative abundance C3-triacid/ C4-triacid
ratio changed in both residue. Thus, AL asphaltene molecules showed a higher content in
hydroaromatic portions similar to the 5, 6, and 7 structures (Scheme 3). This conclusion is
supported by the higher concentration of C3-triacid observed in this asphaltenic fraction.
PDVSA-INTEVEP
35
0
10
20
30
40
50
60
70
80
C3 C4
Rela
tive A
rea (
%)
CN AL
45
46
47
48
49
50
51
52
53
54
55
C3 C4
Rela
tive A
rea (
%)
CN AL
Aromatics
Resins
INT-8989, 2001
In the other hand, CN asphaltenes showed a higher content in C4 triacid, which means that
in this fraction structures 8, 9 and 10 predominate over structures 5, 6, and 7 (Scheme 3).
The opposite result was obtained in aromatic and resin fractions of both residues.
Figure 19: Distribution of C3 and C4 tricarboxylic acids as representative products of hydroaromatic
structures in AL and CN asphaltene fractions
3.7 Group Distributions
To get a better knowledge of the influence of aliphatic groups to the conversion value of
SCSC process, global distributions were considered in each studied fraction. Figure 20
shows these results.
As can be seen, in all fractions normal alkyl chains are the most abundant aliphatic group,
followed by polymetylene bridges, and the less abundant branched alkyl chains and
hydroaromatic structures.
PDVSA-INTEVEP
36
42
44
46
48
50
52
54
56
C3 C4
Rela
tive A
rea (
%)
CN AL
Asphaltenes
INT-8989, 2001
PDVSA-INTEVEP
37
0
10
20
30
40
50
60
70
80
n-alkyl chains Bridges Branched Chains Hydroaromatics
Rela
tive A
rea (
%)
CN ALAsphaltenes
0
10
20
30
40
50
60
70
80
90
100
n-alkyl chains Bridges BranchedChains
Hydroaromatics
Rela
tive A
rea (
%) CN ALAromatics
0
10
20
30
40
50
60
70
80
n-alkyl chains Bridges Branched Chains Hydroaromatics
Rela
tive A
rea (
%) CN ALResins
INT-8989, 2001
Figure 20: Aliphatic Group Contributions in aromatic, resin and asphaltene fractions from AL and CN
residues
The first observation that arises from these results is that aromatic, resin and asphaltene
fractions from CN residue are enriched in polymethylenic bridges and branched chains
compared to the same fractions in AL residue. However, in the case of n-alkyl chains, AL
aromatic fraction showed higher abundance than the corresponding CN fraction. In
contrast, CN resins and asphaltenes exhibit a major content in this kind of substituents.
Concerning to hydroaromatic structures, aromatic fractions presented a very low abundance
in comparison with resin and asphaltene fractions. However, in resin fraction relative
concentration was almost the same in both residues. A noticeable difference was observed
in asphaltenes: AL asphaltenes were more enriched in this components than the CN
homologue fraction.
The global effect is that aromatic fractions from both residues have almost the same content
of aliphatic structures, whereas, resins and asphaltenes from CN residue are more enriched
in such structures than the same fractions in AL residue. These trends can be observed in
Figure 21 and they are in agreement with the SQP values calculated from spectroscopic
data.
PDVSA-INTEVEP
38
80
85
90
95
100
105
110
Aromatics Resins Asphaltenes
Rela
tive A
rea (
%) CN AL
INT-8989, 2001
Figure 21: Total aliphatic group content in aromatic, resin and asphaltene fractions from AL and CN residues
estimated from RICO results.
3.8 Group Contributions
According to the SCSC pilot plant test results and to the RICO information, we can
speculate about reactivity trends for each aliphatic group and its contribution to the
conversion value. Thus, normal alkyl chains are believed to contribute the most to the
conversion together with polymethylene bridges and branched alkyl chains (in less
extension). Polymethylene bridges are believed to be the most reactive group among these
substituents because they have two possible points of attack (Figure 22). Hydroaromatic
structures are thought to have a lower contribution because they can either experiment
dealkylation to form lighter hydrocarbon products or dehydrogenation to form more
condensed aromatic systems that could be responsible for coke formation (Figure 22).
PDVSA-INTEVEP
39
INT-8989, 2001
Figure 22: Possible alkyl group contribution to the conversion of SCSC process
4. CONCLUSION
Structural characterization of SARA fractions from vacuum residues is a useful predictive
tool for Selective Catalytic Steam Cracking (SCSC). It has been demonstrated that SCSC
conversion levels are influenced not only by the abundance of SARA fractions rich in
alkylaromatic structures, but also by the quality of them in terms of Caliphatic/Caromatic ratios.
Based upon 13C and 1H NMR data, a structural quality parameter (SQP) was defined. This
parameter could be used to predict feedstock behavior under SCSC conditions. However,
SQP values, calculated from 13C NMR data, are more accurate than those calculated from 1H NMR, since no assumptions for AMP calculations are required. 1H NMR parameters are
a viable alternative for routine analysis due to the less analytical demands involved.
Related to the structural details of aliphatic substituents, RICO reaction gave valuable
information about distributions of such substituents. Thus, normal alkyl chains and
polymethylene bridges were the most abundant alkyl substituents, whereas, branched alkyl
chains and hydroaromatic structures showed lower concentration in all the studied
fractions.
RICO results reinforced the spectroscopic information obtained, because resins and
asphaltenes from CN residue were richer in aliphatic structures than the same AL fractions,
which is in agreement with the SQP values calculated from RMN data. Additionally, RICO
product analysis gave some insight about reactivity of aliphatic groups that could explain
the observed behavior of the studied residues under SCSC conditions.
PDVSA-INTEVEP
40
INT-8989, 2001
5. FINAL COMENTS.
As stated at the beginning of the result discussion, the information presented in this work
corresponds to the partial characterization of SCSC feedstocks. In this issue, we have only
discussed aliphatic substituent distributions. Information regarding to the condensation
modes of aromatic systems and the mass balance that includes CO2 measurements
(complementary RICO information) are in progress and will be presented in a second issue
together with characterization of visbreaking and Aquaconversion products.
PDVSA-INTEVEP
41
INT-8989, 2001
REFERENCES
[1] Pereira, P.; Marzin, R.; Zacarías, L.; López, I.; Hernández, F.; Córdova, J.; Szeoke,
J.; Flores, C.; Duque, J.; and Solari, R. Visión Tecnológica. 6. No. 1, 5-14, 1998.
[2] Pereira, P.; Machin, I.; Salerno, G.; Cotte, E.; Higuerey, I.; Andriollo, A.; Córdova,
J.; Zacarías, L.; Marzín, R.; Rivas, G. La Investigación y Desarrollo en
Mejoramiento de Crudos Extrapesados en PDVSA-INTEVEP: Aquaconversión.
Acta Científica Venezolana. Vol. 50 Suplemento 1, pp: 48-53, 1999.
[3] Pereira, P.; Zacarías, L.; Huode, E.; and Feintuch, H. Petroleum Technology
Qquartarly. Winter 1998-1999; pp 29-37
[4] Higuerey, I.; Pereira, P.; and León, V. Symposium on Crude Oil Upgrading from
Reservoir to Refinery Presented Before the Division of Petroleum Chemistry, Inc.
221st ACS Meeting, San Diego, CA, April 1-5, 2001, pp: 64-65.
[5] Higuerey, I.; and Pereira, P. Modificaciones Químicas y Estructurales Inducidas por
el Vapocraqueo Termocatalítico de Crudos Pesados y Residuos. Memorias del IV
Congreso Venezolano de Química. Mérida. Edo. Mérida, Venezuela. 7-11 Febrero,
1999. 650-652.
[6] Payzant, J. D., Montgomery, D. S. And Strausz, O. P. Sulfides in Petroleum. Org.
Geochem. 9, 357-369, 1986.
[7] Peng, P., Morales-Izquierdo, A., Hogg, A., Strausz, O. P. Molecular Structure of
Athabasca Asphaltenes: Sulfide, Ether and Ester Linkages. Energy & Fuels. 11,
1171-1187, 1997.
[8] Stock, Leon M. and Obeg Marcus. Oxidation and Decarboxylation. A reaction
Sequence for the Study of Aromatic Structural Elements in Pocahontas No. 3 Coal.
Energy & Fuels, 11, 987-997, 1997
[9] Stock, Leon M. And Tse, Kwok-tuen. Ruthenium Tetroxide Catalyzed Oxidation of
Illinois No. 6 Monterey Coal. Fuel. 59, 694-698, 1980.
[10] Stock, Leon M. And Tse, Kwok-tuen. Ruthenium Tetroxide Catalyzed Oxidation of
Illinois No. 6 Coal and Some Representative Hydrocarbons. Fuel. 62, 974-976, 1983
PDVSA-INTEVEP
42
INT-8989, 2001
[11] Stock, L., M., and Wang S. Ruthenium Tetroxide Catalyzed Oxidation of Illinois
No. 6 Coal. The Formation of Volatile Monocarboxylic acids. Fuel. 64, 1713-1717,
1985.
[12] Mojelsky, T. W., Montgomery, D. S., Strausz, O. P. Ruthenium (VIII) Catalyzed
Oxidation of High Molecular Weight Components of Athabasca Oil Sand Bitumen.
AOSTRA J. Res., 2, 131-137, 1985.
[13] Mojelsky, T. W., Ignasiak, T. M., Frakman, Z., McIntyre, D.D., Lown, E. M.,
Montgomery, D. S., Strausz, O. P. Structural Features of Alberta Oil Sand Bitumen
and Heavy Oil Asphaltenes. Energy & Fuels. 6, 1, 83-96, 1991
[14] Murata, S.; U-esaka, K.; Ino-ue, H.; and Nomura, M. Studies on Aliphatic Portion
of Coal Organic Materials Based on Ruthenium Ion Catalyzed Oxidation. Energy &
Fuels. 8, 1379-1383, 1994
[15] Artok, L., Murata, S., and Nomura, M., Satoh, T. Reexamination of the RICO
Method. Energy & Fuels. 12, 391-398, 1998.
[16] Nomura, M.; Artok, L.; Murata, S.; Yamamoto, A.; Hama, H.; Gao, H.; and Kidena
K. Structural Evaluation of Zao Zhuang Coal. Energy & Fuels. 12, 512-523, 1998.
[17] Su, Y., Artok, L., Murata, S., and Nomura, M. Structural Analysis of the Asphaltene
Fraction of an Arabian Mixture by a Ruthenium-Ion-Catalyzed Oxidation Reaction.
Energy & Fuels. 12, 1265-1271, 1998.
[18] Strausz, O. P.; Mojelsky, T. W.; and Lown, E. M. The Molecular Structure of
Asphaltene: An Unfolding Story. Fuel. 71, 1355-1363, 1992.
[19] Strausz, O. P.; Mojelsky, T. W.; Faraji, F.; Lown E. M.; and Peng, P. Additional
Structural Details of Athabasca Asphaltene and Their Ramifications. Energy &
Fuels. 13, 207-227, 1999.
[20] Strausz, O. P.; Mojelsky, T. W.; Lown E. M.; Kowalewski, I.; and Behar, F.
Structural Features of Boscan and Duri Asphaltenes. Energy & Fuels. 13, 228-247,
1999.
[21] Peng, P.; Morales-Izquierdo, A.; Lown, E. M.; and Strausz O. P. Chemical Structure
and Biomarker Content of Jinghan Asphaltenes and Kerogens. Energy & Fuels. 13,
248-265, 1999.
PDVSA-INTEVEP
43
INT-8989, 2001
[22] IP-143/90. Asphaltenes (Heptane Insolubles) in Petroleum Products. Institute of
Petroleum. London, 1990.
[23] Carbognani, L., Izquierdo A. Preparative and Automated Compound Class
separation of Venezuelan Vacuum Residua by High Performance Liquid
Chromatography. Journal of Chromatography. 484, 399-408, 1989.
[24] León, V. Average Molecular Weight of Oil Fractions by Nuclear Magnetic
Resonance. Fuel, 66 (10); 1445-1446, 1987.
[25] Shell Meted Series. State of Peptization of Asphaltenes in Oil. P-Value. 1066-83,
1983.
[26] Speight, J. G. The Chemistry and Technology of Petroleum. 2° Edition. Marcel
Dekker, N.Y. Chapter 8; pp: 285-289, 1991.
PDVSA-INTEVEP
44


![Untitled-1 [aqua-me.ae]](https://img.pdfslide.us/doc/110x75/61b26a9c529835162559e407/untitled-1-aqua-meae.jpg)


![Aqua grill flyer[1]](https://img.pdfslide.us/doc/110x75/559bf1bf1a28ab18428b45df/aqua-grill-flyer1.jpg)


![Conversion Disorder[1]](https://img.pdfslide.us/doc/110x75/55cf8f8a550346703b9d4623/conversion-disorder1.jpg)