Embed Size (px)
Citation preview
A QoE Perspective on Sizing Network Buffers
Oliver HohlfeldRWTH Aachen University
Enric PujolTU Berlin
Florin CiucuUniversity of Warwick
Anja FeldmannTU Berlin
Paul BarfordUW Madison
ABSTRACT
Despite decades of operational experience and focused research ef-forts, standards for sizing and configuring buffers in network sys-tems remain controversial. An extreme example of this is the re-cent claim that excessive buffering (i.e., bufferbloat) can severelyimpact Internet services. In this paper, we systematically examinethe implications of buffer sizing choices from the perspective offactors impacting end user experience. To assess user perceptionof application quality under various buffer sizing schemes we em-ploy Quality of Experience (QoE) metrics. We evaluate these met-rics over a wide range of end-user applications (e.g., web brows-ing, VoIP, and RTP video streaming) and workloads in two realistictestbeds emulating access and backbone networks. The main find-ing of our extensive evaluations is that network workload, ratherthan buffer size, is the primary determinant of end user QoE. Ourresults also highlight the relatively narrow conditions under whichbufferbloat seriously degrades QoE, i.e., when buffers are oversizedand sustainably filled.
Categories and Subject Descriptors
C.2.6 [Internetworking]: Routers
Keywords
Buffer size; bufferbloat; QoE
1. INTRODUCTIONPacket buffers are widely deployed in network devices to re-
duce packet loss caused by transient traffic bursts. Surprisingly,even after decades of research and operational experience, ‘proper’buffer sizing remains challenging due to inherent trade-offs in per-formance metrics applied to the problem and different applicationrequirements. While queueing theory suggests that large buffersimprove transfer throughput at the expense of larger delays, thereexists real-time applications requiring low and consistent delay, andthus preferring little to no buffering. Responding to the need to ad-dress such orthogonal objectives, the community has been involvedin a decades-long struggle to identify general rules for both sizing
Permission to make digital or hard copies of all or part of this work for personal or
classroom use is granted without fee provided that copies are not made or distributed
for profit or commercial advantage and that copies bear this notice and the full citation
on the first page. Copyrights for components of this work owned by others than the
author(s) must be honored. Abstracting with credit is permitted. To copy otherwise, or
republish, to post on servers or to redistribute to lists, requires prior specific permission
and/or a fee. Request permissions from [email protected].
IMC’14, November 5–7, 2014, Vancouver, BC, Canada.
Copyright is held by the owner/author(s). Publication rights licensed to ACM.
ACM 978-1-4503-3213-2/14/11 ...$15.00.
http://dx.doi.org/10.1145/2663716.2663730.
and managing buffers that tries to match both ends of the spectrum(i.e., low delay and high performance).
Traditionally, router buffer sizing is proportional to the band-width of the linecards i.e., bandwidth-delay product (BDP). Thisrule-of-thumb emerged in the mid 1990s based on studies of thedynamics of TCP flows [25, 44]. A decade later, Appenzeller et al.reexamined buffer sizing and argued that throughput can be main-tained using much smaller buffer sizes in core routers [9]. Thisreignited interest in the research community with regards to bufferdimensioning schemes, however the issue continues to remain farfrom resolved.
Recently, the buffer sizing debate has focused on the existence oflarge buffers in the network edge (bufferbloat [6]) and stimulateda debate on its potential negative effects. Excessive buffering can
cause excessive queuing delays, e.g., in the order of seconds), inphases of congestion when the buffer capacity is fully utilized. Re-sulting excessive delays can degrade the performance from a users’perspective [6], e.g., by adversely effecting TCP due to increasedround trip times or unnecessary timeouts. While the existence oflarge buffers has been observed, little is known on how often queuesare utilized to degrade performance in practice. Also, the evalua-tion of the bufferbloat problem has so far focused on evaluatinginfluence on QoS metrics. In the absence of a solid understanding,buffer sizes are currently used to drive engineering changes in In-ternet standards (see e.g., [18]) and motivate new AQM approaches(e.g., CoDeL [32]). We posit that a deeper understanding of buffer-ing effects is needed before altering important engineering aspects.
This paper describes the first comprehensive study on the impactof buffer sizes on end-user quality. The goal of our work is to elu-cidate the sizing issues empirically and to pave the way for moreinformed sizing decisions. Unlike previous studies that considerQuality of Service (QoS) metrics (e.g., packet loss or throughput)our study focuses on end-user Quality of Experience (QoE). Theuse of standardized QoE metrics enables estimation of end-userperceived quality without involving human subjects. By using QoEmetrics rather than conducting user studies, we are able to assessquality in an extensive sensitivity study involving a broad range ofbuffer size and workload configurations. Identified experimentalscenarios pave the way for controlled user studies conducted in ascaled down fashion in the future.
Concretely, we evaluate QoE metrics for relevant user appli-cations (i.e., web browsing, VoIP, and RTP video streaming) intwo realistic laboratory-based testbeds: access and backbone net-works. Each application type is analyzed over Internet-like trafficscenarios—without isolation in separate QoS classes—and over arange of buffer sizes.
Our main observations are as follows:
1. We mainly find network workload, rather than buffer size, tobe the primary determinant of end-user QoE. As intuitivelyexpected, sustainable congestion impacts both QoS and QoEmetrics by keeping the queue of the bottleneck buffer filled.This effect is amplified by large (bloated) buffers. In the ab-sence of congestion, however, (even bloated) buffer sizes im-pact QoS metrics, as observed by previous studies, e.g., [11],but impact QoE metrics only marginally. The good news fornetwork operators is that limiting congestion, e.g., via QoS orover-provisioning, can yield more immediate QoE improve-ments than efforts to optimize buffering.
2. We show the perceptual (QoE) perspective on buffering todiffer from the known QoS perspective. This further empha-sizes the use of application specific and perceptual metrics inInternet measurements. In this regard, this paper serves as anexample on the use of QoE metrics for measurement studies.
2. RELATED WORKThe rule-of-thumb [25, 44] for dimensioning network buffers
relies on the bandwidth-delay-product (BDP) RTT ∗ C formula,where RTT is the round-trip-time and C is the (bottleneck) linkcapacity. The reasoning is that, in the presence of few TCP flows,this ensures that the bottleneck link remains saturated even underpacket loss. This is not necessary for links with a large numberof concurrent TCP flows (e.g., backbone links). It was suggestedin [44] and convincingly shown in [9, 11] that much smaller bufferssuffice to achieve high link utilizations. The proposal is to reducebuffer sizes by a factor of
√n as compared to the BDP, where n
is the number of concurrent TCP flows [9]. Much smaller buffersizes have been proposed, e.g., drop-tail buffers with ≈ 20 − 50packets for core routers [17]. However, these come at the expenseof reduced link utilization [11]. This problem has been addressedby a modified TCP congestion control control scheme that aims tomaintain high link utilizations in small buffer regimes [20]. For anoverview of existing buffer sizing schemes we refer the reader to[45].
While the above discussion focuses on backbone networks, morerecent studies focus on access networks, e.g., [13, 28, 30, 42], end-hosts [1], and 3G networks [22]. These studies find that excessivebuffering in the access network exists and can cause excessive de-lays (e.g., on the order of seconds). This has fueled the recent buff-erbloat debate [6, 19] regarding a potential degradation in Qualityof Service (QoS).
Indeed, prior work has shown that buffer sizing impact QoS met-rics. Examples include network-centric aspects such as per-flowthroughput [33], flow-completion times [29], link utilizations [11],packet loss rates [11], and fairness [46]. Sommers et al. studiedbuffer sizing from an operational perspective by addressing theirimpact on service level agreements [37]. However, QoS metricsand even SLAs do not necessarily reflect the actual implicationsfor the end-user. A first step towards investigating the impact ofbuffering on gaming QoE has been made in simulations for Pois-son traffic [36]. In this paper, we present the firstQoE centric studythat broadly investigates the impact of buffering and backgroundtraffic by using realistic testbed hardware and Internet like trafficscenarios.
3. BUFFERING IN THEWILDBefore investigating the impact of buffering on QoE, we first
motivate our study by investigating the occurrence of buffering in
the wild. Our analysis is based on snapshots of Linux kernel levelTCP statistics for 430 million randomly selected TCP/HTTP con-nections captured at a major Content Distribution Network (CDN).The data was collected at different vantage points, located primar-ily in central Europe, over a period of five months in 2011. Allflows were established by end-users to retrieve content from therespective CDN caches, thus they capture typical web browsing ac-tivity. This data corpus represents a significant sample of Internetusers. It includes 81 million unique IP addresses originating from22,490 autonomous systems (roughly 60% of the total advertisedASes when capturing the trace), located in more than 220 coun-tries. Due to the vantage point locations, 56% of the IPs are locatedin central Europe.
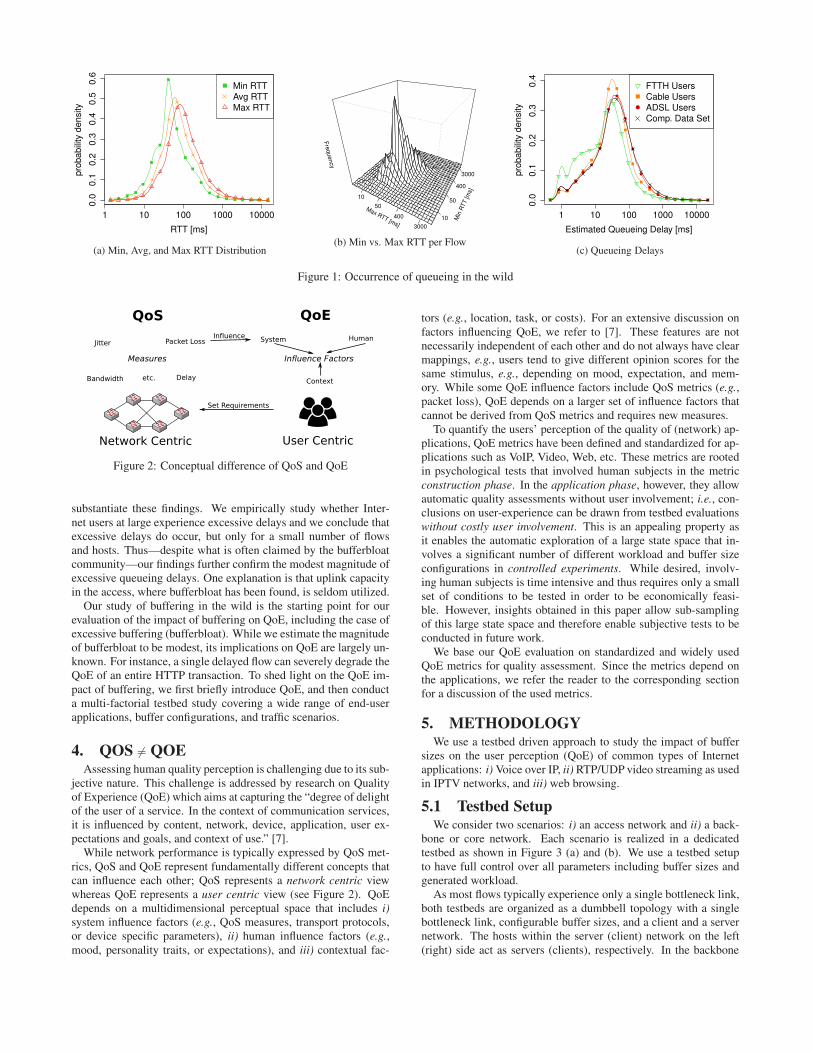
We build our evaluation on smoothed RTT (sRTT) informationreported in the data set. Smoothed RTT values are estimated bythe TCP stack using Karn’s algorithm and are provided by the ker-nel level TCP statistics. For each TCP connection, the data setreports (i) the minimum sRTT, (ii) the average sRTT, (iii) the max-imum sRTT, and (iv) the number of samples. To evaluate the vari-ability due to queueing, we focus on flows that have at least 10RTT samples. The distribution (PDF) of the logarithm of the mini-mum, average, and maximum RTT is shown in Figure 1a. The plothighlights that the average and maximum RTT deviate significantlyfrom the minimum RTT, which is one indicator of possible queue-ing. Figure 1b underlines this intuition by showing the relationshipof minimum and maximum RTT per flow in a 2D histogram. Thefigure shows that the maximum RTT significantly differs from theminimum RTT per flow, which further suggests the presence ofqueuing.
We estimate the queueing delay by evaluating the sRTT range(i.e., max-min) for each connection with at least 10 RTT samples.The implicit assumption is that the minimum RTT accounts for anempty queue and that queueing is the only source of delay varia-tions. In general, additional factors such as route changes and layer2 delays—particularly prominent in wireless networks—also con-tribute to delay variations. Since we cannot distinguish these fac-tors from queuing delays, our estimation overestimates queueingand thus yields an upper bound on the magnitude of queueing.
We show the PDF of the logarithm of the estimated queueing de-lay in Figure 1c. Based on whois and DNS information, we splitthe complete data set into ADSL, Cable, and FTTH users and showtheir respective queuing delay distribution. Using this scheme, weassociate 70% the flows to ADSL users, 1.4% to Cable users, and0.02% to FTTH users. Most of the user flows experience a mod-est amount of queueing; 80% of all the flows experience less than100ms of delay variation. Only 2.8% (1%) experience excessivequeueing delays of more than 500ms (1000ms). This correspondsto only 2.5% (2%) of the observed hosts. We also consider userproximity to the CDN caches. Specifically, we consider flows withminimum RTT ≤ 100ms. In this setting, even more flows experi-ence modest amounts of queueing: 95% (99.9%) of all connectionshave a queuing delay of less than 100ms (1sec), respectively.
Recently, the issue of buffer bloat has attracted significant at-tention. The debate is based on observations (e.g., [28]) showingthat bufferbloat can happen, rather than it does happen. Despitethis lack of empirical evidence, the bufferbloat argument has beenused to motivate engineering changes in Internet standards (e.g.,see [18]) and to motivate new AQM approaches (e.g., CoDeL [32]).Two very recent studies examined the magnitude of the problembased on data from 118K [8] and 25K hosts [12], respectively andconcluded that the magnitude of bufferbloat is modest.
Our results, based on a much large data set of 80M hosts thatis representative for a significant body of Internet users, further
1 10 100 1000 10000
0.0
0.1
0.2
0.3
0.4
0.5
0.6
RTT [ms]
pro
ba
bili
ty d
en
sity
Min RTT
Avg RTT
Max RTT
(a) Min, Avg, and Max RTT Distribution
Max RTT [ms]
10
50
400
3000
Min
RTT [m
s]
10
50
400
3000
Fre
quency
(b) Min vs. Max RTT per Flow
1 10 100 1000 10000
0.0
0.1
0.2
0.3
0.4
Estimated Queueing Delay [ms]
pro
ba
bili
ty d
en
sity
FTTH Users
Cable Users
ADSL Users
Comp. Data Set
(c) Queueing Delays
Figure 1: Occurrence of queueing in the wild
QoS QoE
User CentricNetwork Centric
Set Requirements
Packet Loss
Delay
JitterHumanSystem
Context
Influence FactorsMeasures
Influence
Bandwidth etc.
Figure 2: Conceptual difference of QoS and QoE
substantiate these findings. We empirically study whether Inter-net users at large experience excessive delays and we conclude thatexcessive delays do occur, but only for a small number of flowsand hosts. Thus—despite what is often claimed by the bufferbloatcommunity—our findings further confirm the modest magnitude ofexcessive queueing delays. One explanation is that uplink capacityin the access, where bufferbloat has been found, is seldom utilized.
Our study of buffering in the wild is the starting point for ourevaluation of the impact of buffering on QoE, including the case ofexcessive buffering (bufferbloat). While we estimate the magnitudeof bufferbloat to be modest, its implications on QoE are largely un-known. For instance, a single delayed flow can severely degrade theQoE of an entire HTTP transaction. To shed light on the QoE im-pact of buffering, we first briefly introduce QoE, and then conducta multi-factorial testbed study covering a wide range of end-userapplications, buffer configurations, and traffic scenarios.
4. QOS 6= QOEAssessing human quality perception is challenging due to its sub-
jective nature. This challenge is addressed by research on Qualityof Experience (QoE) which aims at capturing the “degree of delightof the user of a service. In the context of communication services,it is influenced by content, network, device, application, user ex-pectations and goals, and context of use.” [7].
While network performance is typically expressed by QoS met-rics, QoS and QoE represent fundamentally different concepts thatcan influence each other; QoS represents a network centric viewwhereas QoE represents a user centric view (see Figure 2). QoEdepends on a multidimensional perceptual space that includes i)
system influence factors (e.g., QoS measures, transport protocols,or device specific parameters), ii) human influence factors (e.g.,mood, personality traits, or expectations), and iii) contextual fac-
tors (e.g., location, task, or costs). For an extensive discussion onfactors influencing QoE, we refer to [7]. These features are notnecessarily independent of each other and do not always have clearmappings, e.g., users tend to give different opinion scores for thesame stimulus, e.g., depending on mood, expectation, and mem-ory. While some QoE influence factors include QoS metrics (e.g.,packet loss), QoE depends on a larger set of influence factors thatcannot be derived from QoS metrics and requires new measures.
To quantify the users’ perception of the quality of (network) ap-plications, QoE metrics have been defined and standardized for ap-plications such as VoIP, Video, Web, etc. These metrics are rootedin psychological tests that involved human subjects in the metricconstruction phase. In the application phase, however, they allowautomatic quality assessments without user involvement; i.e., con-clusions on user-experience can be drawn from testbed evaluationswithout costly user involvement. This is an appealing property asit enables the automatic exploration of a large state space that in-volves a significant number of different workload and buffer sizeconfigurations in controlled experiments. While desired, involv-ing human subjects is time intensive and thus requires only a smallset of conditions to be tested in order to be economically feasi-ble. However, insights obtained in this paper allow sub-samplingof this large state space and therefore enable subjective tests to beconducted in future work.
We base our QoE evaluation on standardized and widely usedQoE metrics for quality assessment. Since the metrics depend onthe applications, we refer the reader to the corresponding sectionfor a discussion of the used metrics.
5. METHODOLOGYWe use a testbed driven approach to study the impact of buffer
sizes on the user perception (QoE) of common types of Internetapplications: i)Voice over IP, ii) RTP/UDP video streaming as usedin IPTV networks, and iii) web browsing.
5.1 Testbed SetupWe consider two scenarios: i) an access network and ii) a back-
bone or core network. Each scenario is realized in a dedicatedtestbed as shown in Figure 3 (a) and (b). We use a testbed setupto have full control over all parameters including buffer sizes andgenerated workload.
As most flows typically experience only a single bottleneck link,both testbeds are organized as a dumbbell topology with a singlebottleneck link, configurable buffer sizes, and a client and a servernetwork. The hosts within the server (client) network on the left(right) side act as servers (clients), respectively. In the backbone
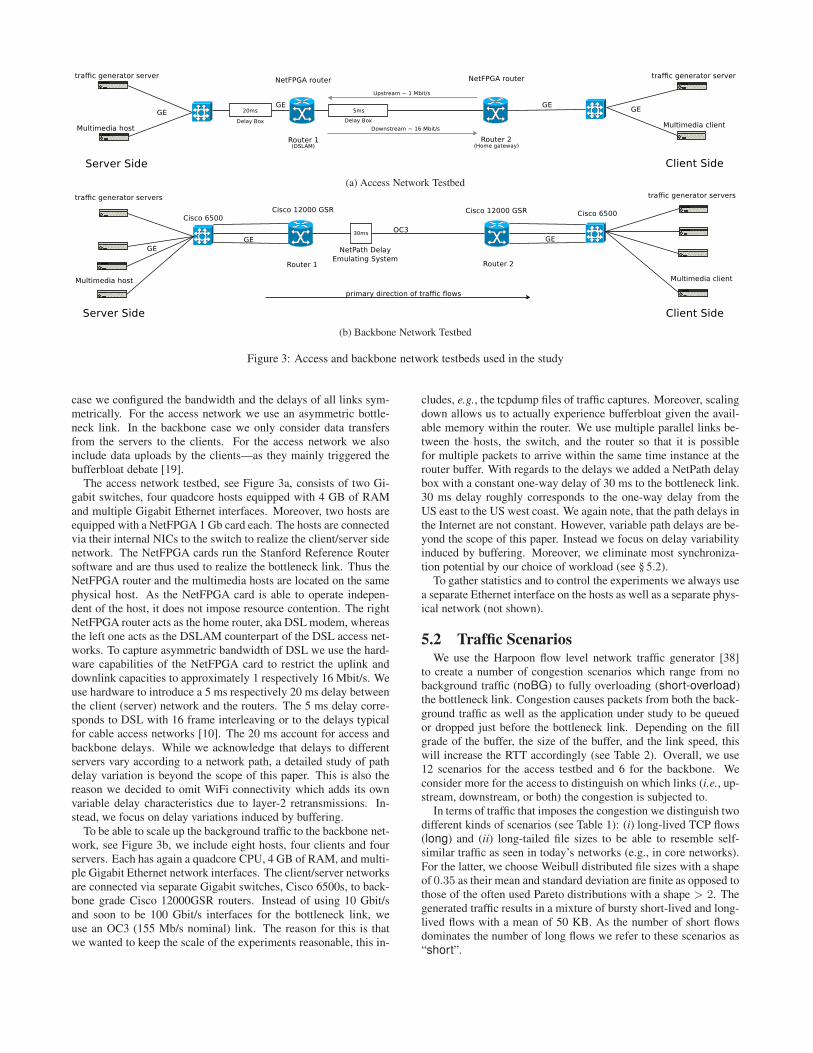
(a) Access Network Testbed
(b) Backbone Network Testbed
Figure 3: Access and backbone network testbeds used in the study
case we configured the bandwidth and the delays of all links sym-metrically. For the access network we use an asymmetric bottle-neck link. In the backbone case we only consider data transfersfrom the servers to the clients. For the access network we alsoinclude data uploads by the clients—as they mainly triggered thebufferbloat debate [19].
The access network testbed, see Figure 3a, consists of two Gi-gabit switches, four quadcore hosts equipped with 4 GB of RAMand multiple Gigabit Ethernet interfaces. Moreover, two hosts areequipped with a NetFPGA 1 Gb card each. The hosts are connectedvia their internal NICs to the switch to realize the client/server sidenetwork. The NetFPGA cards run the Stanford Reference Routersoftware and are thus used to realize the bottleneck link. Thus theNetFPGA router and the multimedia hosts are located on the samephysical host. As the NetFPGA card is able to operate indepen-dent of the host, it does not impose resource contention. The rightNetFPGA router acts as the home router, aka DSLmodem, whereasthe left one acts as the DSLAM counterpart of the DSL access net-works. To capture asymmetric bandwidth of DSL we use the hard-ware capabilities of the NetFPGA card to restrict the uplink anddownlink capacities to approximately 1 respectively 16 Mbit/s. Weuse hardware to introduce a 5 ms respectively 20 ms delay betweenthe client (server) network and the routers. The 5 ms delay corre-sponds to DSL with 16 frame interleaving or to the delays typicalfor cable access networks [10]. The 20 ms account for access andbackbone delays. While we acknowledge that delays to differentservers vary according to a network path, a detailed study of pathdelay variation is beyond the scope of this paper. This is also thereason we decided to omit WiFi connectivity which adds its ownvariable delay characteristics due to layer-2 retransmissions. In-stead, we focus on delay variations induced by buffering.
To be able to scale up the background traffic to the backbone net-work, see Figure 3b, we include eight hosts, four clients and fourservers. Each has again a quadcore CPU, 4 GB of RAM, and multi-ple Gigabit Ethernet network interfaces. The client/server networksare connected via separate Gigabit switches, Cisco 6500s, to back-bone grade Cisco 12000GSR routers. Instead of using 10 Gbit/sand soon to be 100 Gbit/s interfaces for the bottleneck link, weuse an OC3 (155 Mb/s nominal) link. The reason for this is thatwe wanted to keep the scale of the experiments reasonable, this in-
cludes, e.g., the tcpdump files of traffic captures. Moreover, scalingdown allows us to actually experience bufferbloat given the avail-able memory within the router. We use multiple parallel links be-tween the hosts, the switch, and the router so that it is possiblefor multiple packets to arrive within the same time instance at therouter buffer. With regards to the delays we added a NetPath delaybox with a constant one-way delay of 30 ms to the bottleneck link.30 ms delay roughly corresponds to the one-way delay from theUS east to the US west coast. We again note, that the path delays inthe Internet are not constant. However, variable path delays are be-yond the scope of this paper. Instead we focus on delay variabilityinduced by buffering. Moreover, we eliminate most synchroniza-tion potential by our choice of workload (see § 5.2).
To gather statistics and to control the experiments we always usea separate Ethernet interface on the hosts as well as a separate phys-ical network (not shown).
5.2 Traffic ScenariosWe use the Harpoon flow level network traffic generator [38]
to create a number of congestion scenarios which range from nobackground traffic (noBG) to fully overloading (short-overload)the bottleneck link. Congestion causes packets from both the back-ground traffic as well as the application under study to be queuedor dropped just before the bottleneck link. Depending on the fillgrade of the buffer, the size of the buffer, and the link speed, thiswill increase the RTT accordingly (see Table 2). Overall, we use12 scenarios for the access testbed and 6 for the backbone. Weconsider more for the access to distinguish on which links (i.e., up-stream, downstream, or both) the congestion is subjected to.
In terms of traffic that imposes the congestion we distinguish twodifferent kinds of scenarios (see Table 1): (i) long-lived TCP flows(long) and (ii) long-tailed file sizes to be able to resemble self-similar traffic as seen in today’s networks (e.g., in core networks).For the latter, we choose Weibull distributed file sizes with a shapeof 0.35 as their mean and standard deviation are finite as opposed tothose of the often used Pareto distributions with a shape > 2. Thegenerated traffic results in a mixture of bursty short-lived and long-lived flows with a mean of 50 KB. As the number of short flowsdominates the number of long flows we refer to these scenarios as“short”.
Testbed Name Flow Interarrival File Size # Sessions Concurrent Link Utilization [%] Packet DescriptionDistribution Distribution Up Down Flows Mean Sd Loss [%]
Up Down Up Down Up DownAccess
noBG — — — — — — — — — — — No bg. traffic
short-few exp-a weibull1 — 98.9 0.3 0.7 0.1 34.7 0 Upstream1 8 95 8.5 5.6 15.2 58.6 0.7 Bidirectional— 8 27.8 44.1 13.7 25.1 1.4 3 Downstream
short-many exp-a weibull1 — 98.9 0.3 0.7 0.1 33.1 0 Upstream1 16 93.3 10.7 4.3 20.1 60.9 1.3 Bidirectional— 16 53.8 78.7 12.8 23.5 4 4.5 Downstream
long-few — infinite1 — 99 0.2 0.7 0.0 1 0 Upstream1 8 71.9 83.1 8.9 12.6 41.7 0.6 Bidirectional— 8 39.5 99.9 1.9 0.6 0.1 0.5 Downstream
long-many — infinite8 — 98.9 0.3 0.7 0.0 14.4 0.0 Upstream8 64 83.8 61.8 11.2 26.4 60.7 0.2 Bidirectional— 64 68.5 99.6 3.9 4.9 0.03 9.3 Downstream
Backbone
noBG — — — — — — — — No bg. trafficshort-low exp-b weibull — 3 ∗ 10 18 16.5 11.6 0short-medium exp-b weibull — 3 ∗ 30 49 49.5 18.8 0short-high exp-b weibull — 3 ∗ 60 206 98 6.5 0.2short-overload exp-b weibull — 3 ∗ 256 2170 99.7 2.2 5.2long — infinite — 3 ∗ 256 675 99.7 0.1 3.8
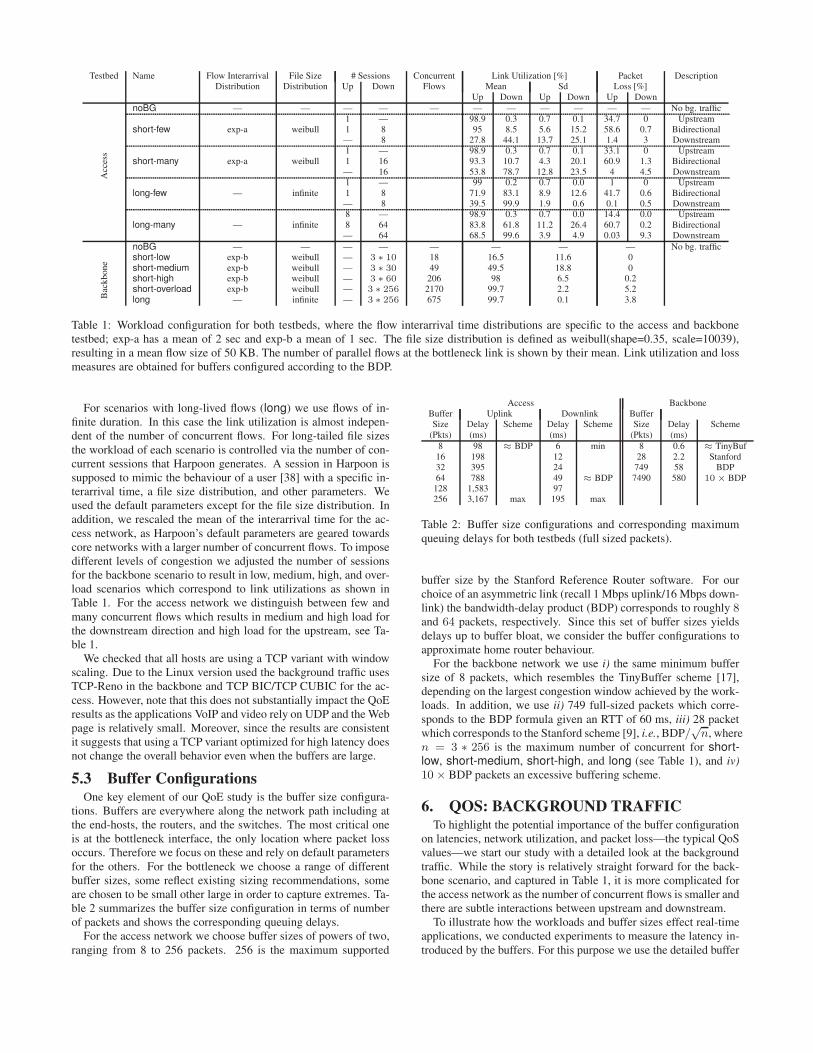
Table 1: Workload configuration for both testbeds, where the flow interarrival time distributions are specific to the access and backbonetestbed; exp-a has a mean of 2 sec and exp-b a mean of 1 sec. The file size distribution is defined as weibull(shape=0.35, scale=10039),resulting in a mean flow size of 50 KB. The number of parallel flows at the bottleneck link is shown by their mean. Link utilization and lossmeasures are obtained for buffers configured according to the BDP.
For scenarios with long-lived flows (long) we use flows of in-finite duration. In this case the link utilization is almost indepen-dent of the number of concurrent flows. For long-tailed file sizesthe workload of each scenario is controlled via the number of con-current sessions that Harpoon generates. A session in Harpoon issupposed to mimic the behaviour of a user [38] with a specific in-terarrival time, a file size distribution, and other parameters. Weused the default parameters except for the file size distribution. Inaddition, we rescaled the mean of the interarrival time for the ac-cess network, as Harpoon’s default parameters are geared towardscore networks with a larger number of concurrent flows. To imposedifferent levels of congestion we adjusted the number of sessionsfor the backbone scenario to result in low, medium, high, and over-load scenarios which correspond to link utilizations as shown inTable 1. For the access network we distinguish between few andmany concurrent flows which results in medium and high load forthe downstream direction and high load for the upstream, see Ta-ble 1.
We checked that all hosts are using a TCP variant with windowscaling. Due to the Linux version used the background traffic usesTCP-Reno in the backbone and TCP BIC/TCP CUBIC for the ac-cess. However, note that this does not substantially impact the QoEresults as the applications VoIP and video rely on UDP and the Webpage is relatively small. Moreover, since the results are consistentit suggests that using a TCP variant optimized for high latency doesnot change the overall behavior even when the buffers are large.
5.3 Buffer ConfigurationsOne key element of our QoE study is the buffer size configura-
tions. Buffers are everywhere along the network path including atthe end-hosts, the routers, and the switches. The most critical oneis at the bottleneck interface, the only location where packet lossoccurs. Therefore we focus on these and rely on default parametersfor the others. For the bottleneck we choose a range of differentbuffer sizes, some reflect existing sizing recommendations, someare chosen to be small other large in order to capture extremes. Ta-ble 2 summarizes the buffer size configuration in terms of numberof packets and shows the corresponding queuing delays.
For the access network we choose buffer sizes of powers of two,ranging from 8 to 256 packets. 256 is the maximum supported
Access BackboneBuffer Uplink Downlink BufferSize Delay Scheme Delay Scheme Size Delay Scheme(Pkts) (ms) (ms) (Pkts) (ms)
8 98 ≈ BDP 6 min 8 0.6 ≈ TinyBuf16 198 12 28 2.2 Stanford32 395 24 749 58 BDP64 788 49 ≈ BDP 7490 580 10 × BDP128 1,583 97256 3,167 max 195 max
Table 2: Buffer size configurations and corresponding maximumqueuing delays for both testbeds (full sized packets).
buffer size by the Stanford Reference Router software. For ourchoice of an asymmetric link (recall 1 Mbps uplink/16 Mbps down-link) the bandwidth-delay product (BDP) corresponds to roughly 8and 64 packets, respectively. Since this set of buffer sizes yieldsdelays up to buffer bloat, we consider the buffer configurations toapproximate home router behaviour.
For the backbone network we use i) the same minimum buffersize of 8 packets, which resembles the TinyBuffer scheme [17],depending on the largest congestion window achieved by the work-loads. In addition, we use ii) 749 full-sized packets which corre-sponds to the BDP formula given an RTT of 60 ms, iii) 28 packetwhich corresponds to the Stanford scheme [9], i.e., BDP/
√n, where
n = 3 ∗ 256 is the maximum number of concurrent for short-low, short-medium, short-high, and long (see Table 1), and iv)
10× BDP packets an excessive buffering scheme.
6. QOS: BACKGROUND TRAFFICTo highlight the potential importance of the buffer configuration
on latencies, network utilization, and packet loss—the typical QoSvalues—we start our study with a detailed look at the backgroundtraffic. While the story is relatively straight forward for the back-bone scenario, and captured in Table 1, it is more complicated forthe access network as the number of concurrent flows is smaller andthere are subtle interactions between upstream and downstream.
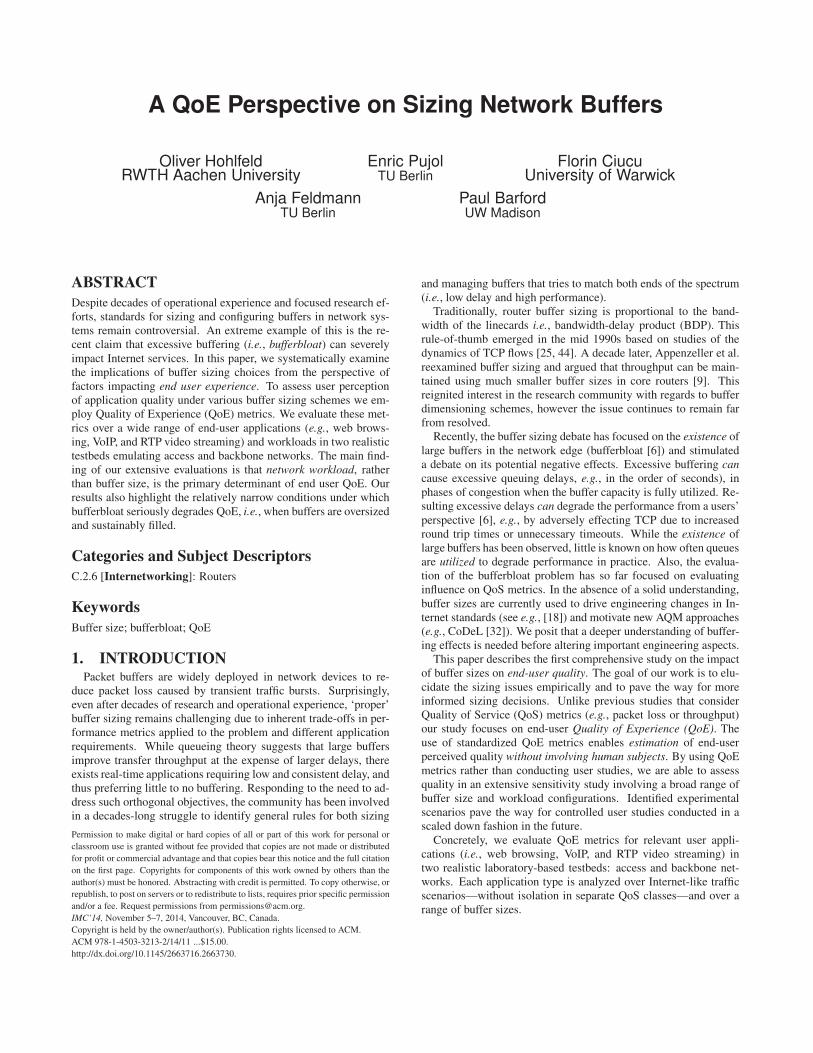
To illustrate how the workloads and buffer sizes effect real-timeapplications, we conducted experiments to measure the latency in-troduced by the buffers. For this purpose we use the detailed buffer
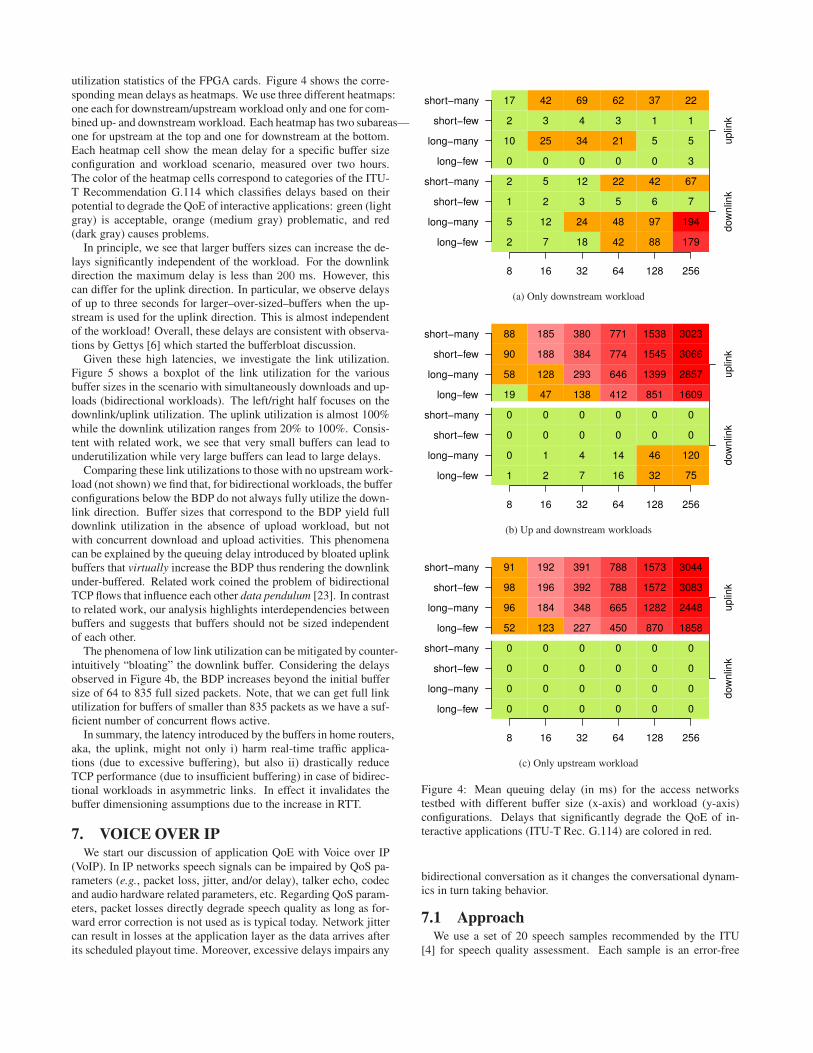
utilization statistics of the FPGA cards. Figure 4 shows the corre-sponding mean delays as heatmaps. We use three different heatmaps:one each for downstream/upstream workload only and one for com-bined up- and downstream workload. Each heatmap has two subareas—one for upstream at the top and one for downstream at the bottom.Each heatmap cell show the mean delay for a specific buffer sizeconfiguration and workload scenario, measured over two hours.The color of the heatmap cells correspond to categories of the ITU-T Recommendation G.114 which classifies delays based on theirpotential to degrade the QoE of interactive applications: green (lightgray) is acceptable, orange (medium gray) problematic, and red(dark gray) causes problems.
In principle, we see that larger buffers sizes can increase the de-lays significantly independent of the workload. For the downlinkdirection the maximum delay is less than 200 ms. However, thiscan differ for the uplink direction. In particular, we observe delaysof up to three seconds for larger–over-sized–buffers when the up-stream is used for the uplink direction. This is almost independentof the workload! Overall, these delays are consistent with observa-tions by Gettys [6] which started the bufferbloat discussion.
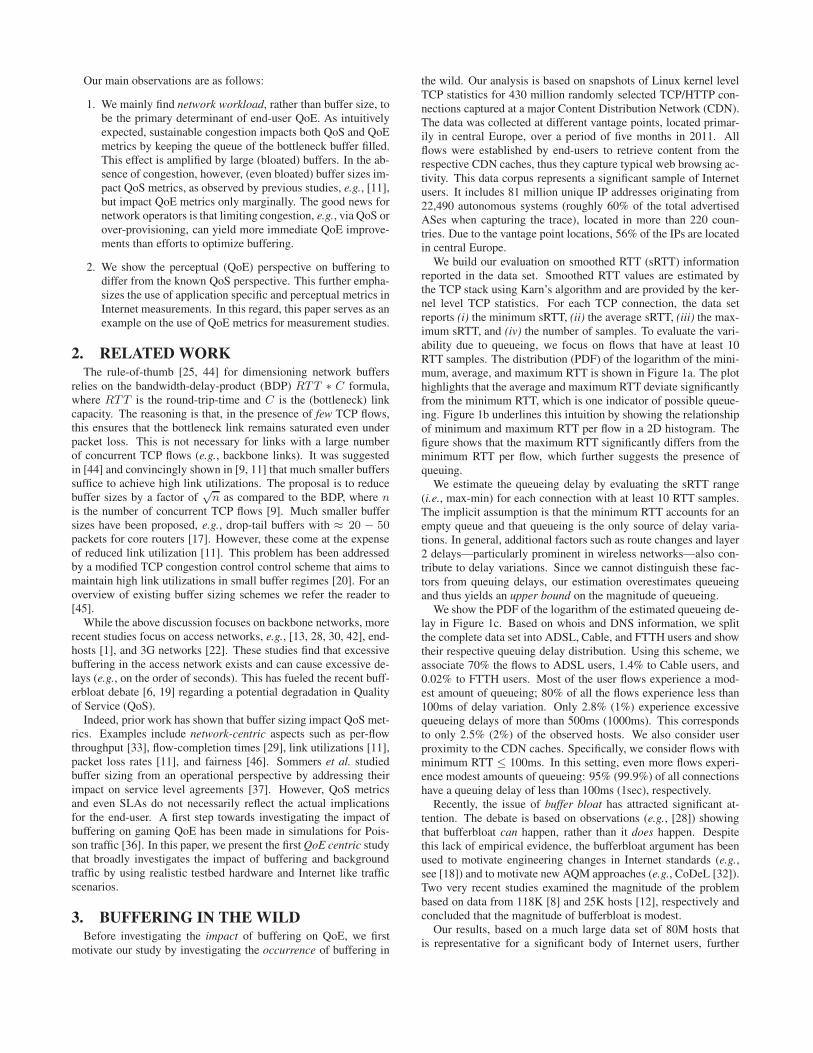
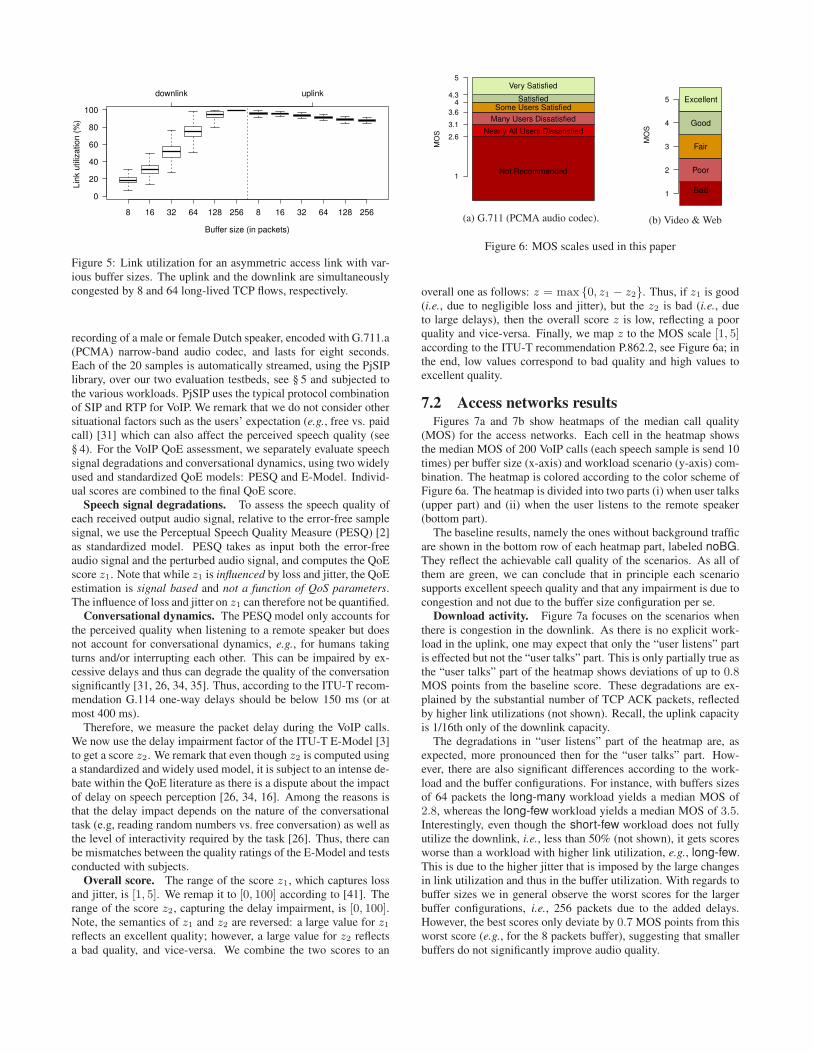
Given these high latencies, we investigate the link utilization.Figure 5 shows a boxplot of the link utilization for the variousbuffer sizes in the scenario with simultaneously downloads and up-loads (bidirectional workloads). The left/right half focuses on thedownlink/uplink utilization. The uplink utilization is almost 100%while the downlink utilization ranges from 20% to 100%. Consis-tent with related work, we see that very small buffers can lead tounderutilization while very large buffers can lead to large delays.
Comparing these link utilizations to those with no upstream work-load (not shown) we find that, for bidirectional workloads, the bufferconfigurations below the BDP do not always fully utilize the down-link direction. Buffer sizes that correspond to the BDP yield fulldownlink utilization in the absence of upload workload, but notwith concurrent download and upload activities. This phenomenacan be explained by the queuing delay introduced by bloated uplinkbuffers that virtually increase the BDP thus rendering the downlinkunder-buffered. Related work coined the problem of bidirectionalTCP flows that influence each other data pendulum [23]. In contrastto related work, our analysis highlights interdependencies betweenbuffers and suggests that buffers should not be sized independentof each other.
The phenomena of low link utilization can bemitigated by counter-intuitively “bloating” the downlink buffer. Considering the delaysobserved in Figure 4b, the BDP increases beyond the initial buffersize of 64 to 835 full sized packets. Note, that we can get full linkutilization for buffers of smaller than 835 packets as we have a suf-ficient number of concurrent flows active.
In summary, the latency introduced by the buffers in home routers,aka, the uplink, might not only i) harm real-time traffic applica-tions (due to excessive buffering), but also ii) drastically reduceTCP performance (due to insufficient buffering) in case of bidirec-tional workloads in asymmetric links. In effect it invalidates thebuffer dimensioning assumptions due to the increase in RTT.
7. VOICE OVER IPWe start our discussion of application QoE with Voice over IP
(VoIP). In IP networks speech signals can be impaired by QoS pa-rameters (e.g., packet loss, jitter, and/or delay), talker echo, codecand audio hardware related parameters, etc. Regarding QoS param-eters, packet losses directly degrade speech quality as long as for-ward error correction is not used as is typical today. Network jittercan result in losses at the application layer as the data arrives afterits scheduled playout time. Moreover, excessive delays impairs any
2
5
1
2
0
10
2
17
7
12
2
5
0
25
3
42
18
24
3
12
0
34
4
69
42
48
5
22
0
21
3
62
88
97
6
42
0
5
1
37
179
194
7
67
3
5
1
22
8 16 32 64 128 256
long−few
long−many
short−few
short−many
long−few
long−many
short−few
short−many
dow
nlin
kuplin
k
(a) Only downstream workload
1
0
0
0
19
58
90
88
2
1
0
0
47
128
188
185
7
4
0
0
138
293
384
380
16
14
0
0
412
646
774
771
32
46
0
0
851
1399
1545
1538
75
120
0
0
1609
2857
3066
3023
8 16 32 64 128 256
long−few
long−many
short−few
short−many
long−few
long−many
short−few
short−many
dow
nlin
kuplin
k
(b) Up and downstream workloads
0
0
0
0
52
96
98
91
0
0
0
0
123
184
196
192
0
0
0
0
227
348
392
391
0
0
0
0
450
665
788
788
0
0
0
0
870
1282
1572
1573
0
0
0
0
1858
2448
3083
3044
8 16 32 64 128 256
long−few
long−many
short−few
short−many
long−few
long−many
short−few
short−many
dow
nlin
kuplin
k
(c) Only upstream workload
Figure 4: Mean queuing delay (in ms) for the access networkstestbed with different buffer size (x-axis) and workload (y-axis)configurations. Delays that significantly degrade the QoE of in-teractive applications (ITU-T Rec. G.114) are colored in red.
bidirectional conversation as it changes the conversational dynam-ics in turn taking behavior.
7.1 ApproachWe use a set of 20 speech samples recommended by the ITU
[4] for speech quality assessment. Each sample is an error-free
8 16 32 64 128 256 8 16 32 64 128 256
0
20
40
60
80
100
Buffer size (in packets)
Lin
k u
tiliz
ation (
%)
downlink uplink
Figure 5: Link utilization for an asymmetric access link with var-ious buffer sizes. The uplink and the downlink are simultaneouslycongested by 8 and 64 long-lived TCP flows, respectively.
recording of a male or female Dutch speaker, encoded with G.711.a(PCMA) narrow-band audio codec, and lasts for eight seconds.Each of the 20 samples is automatically streamed, using the PjSIPlibrary, over our two evaluation testbeds, see § 5 and subjected tothe various workloads. PjSIP uses the typical protocol combinationof SIP and RTP for VoIP. We remark that we do not consider othersituational factors such as the users’ expectation (e.g., free vs. paidcall) [31] which can also affect the perceived speech quality (see§ 4). For the VoIP QoE assessment, we separately evaluate speechsignal degradations and conversational dynamics, using two widelyused and standardized QoE models: PESQ and E-Model. Individ-ual scores are combined to the final QoE score.
Speech signal degradations. To assess the speech quality ofeach received output audio signal, relative to the error-free samplesignal, we use the Perceptual Speech Quality Measure (PESQ) [2]as standardized model. PESQ takes as input both the error-freeaudio signal and the perturbed audio signal, and computes the QoEscore z1. Note that while z1 is influenced by loss and jitter, the QoEestimation is signal based and not a function of QoS parameters.The influence of loss and jitter on z1 can therefore not be quantified.
Conversational dynamics. The PESQ model only accounts forthe perceived quality when listening to a remote speaker but doesnot account for conversational dynamics, e.g., for humans takingturns and/or interrupting each other. This can be impaired by ex-cessive delays and thus can degrade the quality of the conversationsignificantly [31, 26, 34, 35]. Thus, according to the ITU-T recom-mendation G.114 one-way delays should be below 150 ms (or atmost 400 ms).
Therefore, we measure the packet delay during the VoIP calls.We now use the delay impairment factor of the ITU-T E-Model [3]to get a score z2. We remark that even though z2 is computed usinga standardized and widely used model, it is subject to an intense de-bate within the QoE literature as there is a dispute about the impactof delay on speech perception [26, 34, 16]. Among the reasons isthat the delay impact depends on the nature of the conversationaltask (e.g, reading random numbers vs. free conversation) as well asthe level of interactivity required by the task [26]. Thus, there canbe mismatches between the quality ratings of the E-Model and testsconducted with subjects.
Overall score. The range of the score z1, which captures lossand jitter, is [1, 5]. We remap it to [0, 100] according to [41]. Therange of the score z2, capturing the delay impairment, is [0, 100].Note, the semantics of z1 and z2 are reversed: a large value for z1reflects an excellent quality; however, a large value for z2 reflectsa bad quality, and vice-versa. We combine the two scores to an
MO
S
1
2.6
3.1
3.6
44.3
5Very Satisfied
SatisfiedSome Users Satisfied
Many Users Dissatisfied
Nearly All Users Dissatisfied
Not Recommended
(a) G.711 (PCMA audio codec).
MO
S
1
2
3
4
5 Excellent
Good
Fair
Poor
Bad
(b) Video & Web
Figure 6: MOS scales used in this paper
overall one as follows: z = max {0, z1 − z2}. Thus, if z1 is good(i.e., due to negligible loss and jitter), but the z2 is bad (i.e., dueto large delays), then the overall score z is low, reflecting a poorquality and vice-versa. Finally, we map z to the MOS scale [1, 5]according to the ITU-T recommendation P.862.2, see Figure 6a; inthe end, low values correspond to bad quality and high values toexcellent quality.
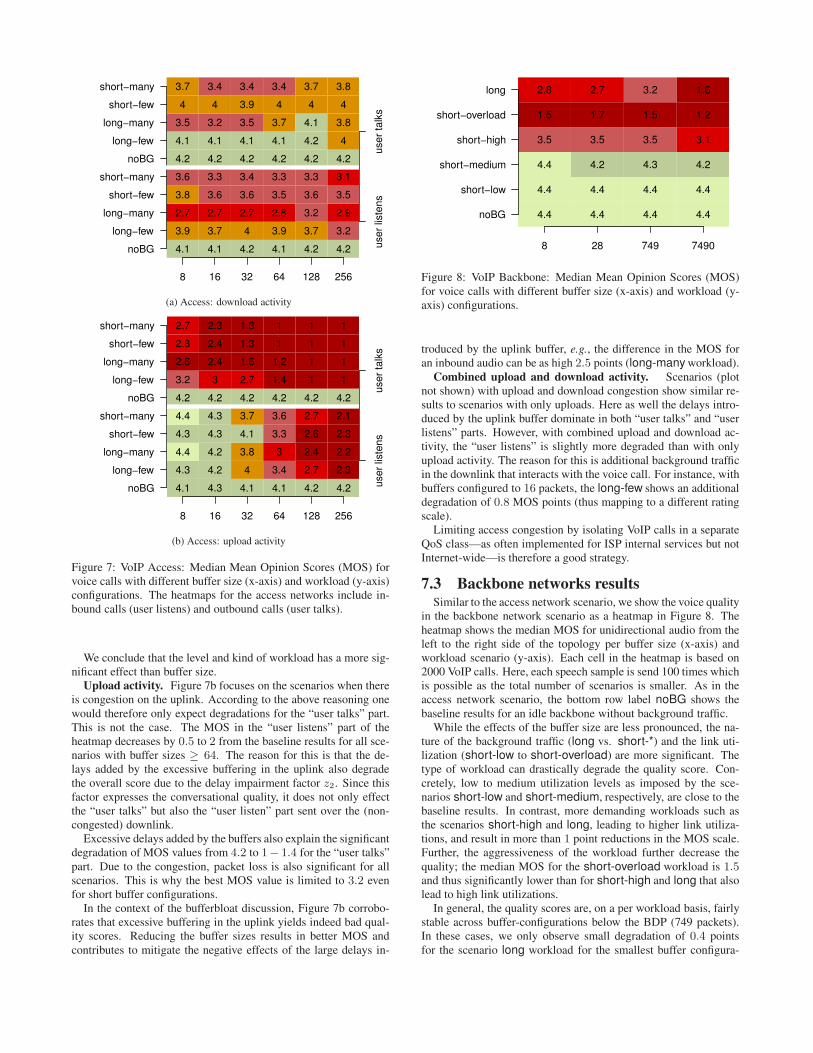
7.2 Access networks resultsFigures 7a and 7b show heatmaps of the median call quality
(MOS) for the access networks. Each cell in the heatmap showsthe median MOS of 200 VoIP calls (each speech sample is send 10times) per buffer size (x-axis) and workload scenario (y-axis) com-bination. The heatmap is colored according to the color scheme ofFigure 6a. The heatmap is divided into two parts (i) when user talks(upper part) and (ii) when the user listens to the remote speaker(bottom part).
The baseline results, namely the ones without background trafficare shown in the bottom row of each heatmap part, labeled noBG.They reflect the achievable call quality of the scenarios. As all ofthem are green, we can conclude that in principle each scenariosupports excellent speech quality and that any impairment is due tocongestion and not due to the buffer size configuration per se.
Download activity. Figure 7a focuses on the scenarios whenthere is congestion in the downlink. As there is no explicit work-load in the uplink, one may expect that only the “user listens” partis effected but not the “user talks” part. This is only partially true asthe “user talks” part of the heatmap shows deviations of up to 0.8MOS points from the baseline score. These degradations are ex-plained by the substantial number of TCP ACK packets, reflectedby higher link utilizations (not shown). Recall, the uplink capacityis 1/16th only of the downlink capacity.
The degradations in “user listens” part of the heatmap are, asexpected, more pronounced then for the “user talks” part. How-ever, there are also significant differences according to the work-load and the buffer configurations. For instance, with buffers sizesof 64 packets the long-many workload yields a median MOS of2.8, whereas the long-few workload yields a median MOS of 3.5.Interestingly, even though the short-few workload does not fullyutilize the downlink, i.e., less than 50% (not shown), it gets scoresworse than a workload with higher link utilization, e.g., long-few.This is due to the higher jitter that is imposed by the large changesin link utilization and thus in the buffer utilization. With regards tobuffer sizes we in general observe the worst scores for the largerbuffer configurations, i.e., 256 packets due to the added delays.However, the best scores only deviate by 0.7MOS points from thisworst score (e.g., for the 8 packets buffer), suggesting that smallerbuffers do not significantly improve audio quality.
4.1
3.9
2.7
3.8
3.6
4.2
4.1
3.5
4
3.7
4.1
3.7
2.7
3.6
3.3
4.2
4.1
3.2
4
3.4
4.2
4
2.7
3.6
3.4
4.2
4.1
3.5
3.9
3.4
4.1
3.9
2.8
3.5
3.3
4.2
4.1
3.7
4
3.4
4.2
3.7
3.2
3.6
3.3
4.2
4.2
4.1
4
3.7
4.2
3.2
2.9
3.5
3.1
4.2
4
3.8
4
3.8
8 16 32 64 128 256
noBG
long−few
long−many
short−few
short−many
noBG
long−few
long−many
short−few
short−many
user
liste
ns
user
talk
s
(a) Access: download activity
4.1
4.3
4.4
4.3
4.4
4.2
3.2
2.6
2.8
2.7
4.3
4.2
4.2
4.3
4.3
4.2
3
2.4
2.4
2.3
4.1
4
3.8
4.1
3.7
4.2
2.7
1.6
1.3
1.3
4.1
3.4
3
3.3
3.6
4.2
1.4
1.2
1
1
4.2
2.7
2.4
2.6
2.7
4.2
1
1
1
1
4.2
2.3
2.2
2.3
2.1
4.2
1
1
1
1
8 16 32 64 128 256
noBG
long−few
long−many
short−few
short−many
noBG
long−few
long−many
short−few
short−many
user
liste
ns
user
talk
s
(b) Access: upload activity
Figure 7: VoIP Access: Median Mean Opinion Scores (MOS) forvoice calls with different buffer size (x-axis) and workload (y-axis)configurations. The heatmaps for the access networks include in-bound calls (user listens) and outbound calls (user talks).
We conclude that the level and kind of workload has a more sig-nificant effect than buffer size.
Upload activity. Figure 7b focuses on the scenarios when thereis congestion on the uplink. According to the above reasoning onewould therefore only expect degradations for the “user talks” part.This is not the case. The MOS in the “user listens” part of theheatmap decreases by 0.5 to 2 from the baseline results for all sce-narios with buffer sizes ≥ 64. The reason for this is that the de-lays added by the excessive buffering in the uplink also degradethe overall score due to the delay impairment factor z2. Since thisfactor expresses the conversational quality, it does not only effectthe “user talks” but also the “user listen” part sent over the (non-congested) downlink.
Excessive delays added by the buffers also explain the significantdegradation of MOS values from 4.2 to 1− 1.4 for the “user talks”part. Due to the congestion, packet loss is also significant for allscenarios. This is why the best MOS value is limited to 3.2 evenfor short buffer configurations.
In the context of the bufferbloat discussion, Figure 7b corrobo-rates that excessive buffering in the uplink yields indeed bad qual-ity scores. Reducing the buffer sizes results in better MOS andcontributes to mitigate the negative effects of the large delays in-
4.4
4.4
4.4
3.5
1.5
2.8
4.4
4.4
4.2
3.5
1.7
2.7
4.4
4.4
4.3
3.5
1.5
3.2
4.4
4.4
4.2
3.1
1.2
1.6
8 28 749 7490
noBG
short−low
short−medium
short−high
short−overload
long
Figure 8: VoIP Backbone: Median Mean Opinion Scores (MOS)for voice calls with different buffer size (x-axis) and workload (y-axis) configurations.
troduced by the uplink buffer, e.g., the difference in the MOS foran inbound audio can be as high 2.5 points (long-manyworkload).
Combined upload and download activity. Scenarios (plotnot shown) with upload and download congestion show similar re-sults to scenarios with only uploads. Here as well the delays intro-duced by the uplink buffer dominate in both “user talks” and “userlistens” parts. However, with combined upload and download ac-tivity, the “user listens” is slightly more degraded than with onlyupload activity. The reason for this is additional background trafficin the downlink that interacts with the voice call. For instance, withbuffers configured to 16 packets, the long-few shows an additionaldegradation of 0.8 MOS points (thus mapping to a different ratingscale).
Limiting access congestion by isolating VoIP calls in a separateQoS class—as often implemented for ISP internal services but notInternet-wide—is therefore a good strategy.
7.3 Backbone networks resultsSimilar to the access network scenario, we show the voice quality
in the backbone network scenario as a heatmap in Figure 8. Theheatmap shows the median MOS for unidirectional audio from theleft to the right side of the topology per buffer size (x-axis) andworkload scenario (y-axis). Each cell in the heatmap is based on2000 VoIP calls. Here, each speech sample is send 100 times whichis possible as the total number of scenarios is smaller. As in theaccess network scenario, the bottom row label noBG shows thebaseline results for an idle backbone without background traffic.
While the effects of the buffer size are less pronounced, the na-ture of the background traffic (long vs. short-*) and the link uti-lization (short-low to short-overload) are more significant. Thetype of workload can drastically degrade the quality score. Con-cretely, low to medium utilization levels as imposed by the sce-narios short-low and short-medium, respectively, are close to thebaseline results. In contrast, more demanding workloads such asthe scenarios short-high and long, leading to higher link utiliza-tions, and result in more than 1 point reductions in the MOS scale.Further, the aggressiveness of the workload further decrease thequality; the median MOS for the short-overload workload is 1.5and thus significantly lower than for short-high and long that alsolead to high link utilizations.
In general, the quality scores are, on a per workload basis, fairlystable across buffer-configurations below the BDP (749 packets).In these cases, we only observe small degradation of 0.4 pointsfor the scenario long workload for the smallest buffer configura-
tion. However, buffer configuration larger than the BDP, i.e, 7490packets, lead to excessive queueing delays. As in the access net-work scenario, excessive delays lead to significant quality degra-dations of the z2 delay impairment component. For example, thescores corresponding to the scenarios long and short-overloadworkloads haveMOS values of almost half of their counterpart withthe BDP configuration.
7.4 Key findings for VoIP QoEWefind that VoIP QoE is substantially degraded when VoIP flows
have to compete for resources in congested links. This is particu-larly highlighted in the backbone network scenario, where low tomedium link utilizations yields good QoE and high link utilization(> 98%) degrade the QoE. In the case of the latter, the congestionleads to insufficient bandwidth on the bottleneck link that affectsthe VoIP QoE.
For access networks we show that, due to the asymmetric linkcapacities, the different audio directions can yield different QoEscores. For instance, in one direction (e.g., user talks) the speechquality might be acceptable, while it is impaired for the other (e.g.,remote speaker talks) or vice-versa. Moreover, the speech quality ismuch more sensitive to congestion on the upstream direction thanthe downstream one. Due to the light queueing delays introducedby bloated buffers in the uplink, maintaining a conversation can bechallenging in the presence of uplink congestion.
For both access and backbone networks, configuring small bufferscan results in better QoE. However, our results highlight that thismay not suffice to yield “excellent” quality ratings. Thus, we advo-cate to use QoS mechanisms to isolate VoIP traffic from the othertraffic. This is already common for ISP internal services but not forISP external services.
8. RTP VIDEO STREAMINGNext, we explore the quality of video streaming using the Real-
time Transport Protocol (RTP) which is commonly used by IPTVservice providers. RTP streaming can be impaired by packet loss,jitter, and/or delay. Again packet losses directly degrades the videoas basic RTP-based video streaming typically does not involve anymeans of error recovery. Network jitter and delays result in simi-lar impairments as with voice and include visual artifacts or jerkyplayback. However, they depend on the concrete error concealmentstrategy applied by the video decoder.
8.1 ApproachWe chose three different video clips from various genres as ref-
erence. Each video has a length 16 seconds. They are chosen tobe representative of various different kinds of TV content and varyin level of detail and movement complexity. Thus, they result indifferent frame-level properties and encoding efficiency; A) an in-terview scene, B) a soccer match, and C) a movie. Each videois encoded using H.264 in SD (4 Mbps) as well as HD (8 Mbps)resolution. Each frame is encoded using 32 slices to keep errorslocalized. This choice of our encoding settings is motivated by ourexperiences with an operational IPTV network of a Tier-1 ISP.
We use VLC to stream each clip using UDP/RTP and MPEG-2Transport Streams. Without any adjustment VLC tries to transmitall packets belonging a frame immediately. This leads to trafficspikes exceeding the access network capacity. In effect VLC andother streaming software propagate the information bursts directlyto the network layer. As our network capacity, in particular for theaccess, is limited we configured VLC to smooth the transmissionrate over a larger time window as is typical for commercial IPTVvendors. More specifically, we decided to use a smoothing interval
1
0.47
0.41
0.47
0.44
1
0.55
0.46
0.56
0.53
1
0.47
0.4
0.48
0.43
1
0.56
0.46
0.56
0.51
1
0.47
0.4
0.48
0.42
1
0.55
0.47
0.56
0.5
1
0.47
0.41
0.48
0.41
1
0.56
0.45
0.56
0.48
1
0.47
0.42
0.48
0.45
1
0.56
0.47
0.56
0.48
1
0.47
0.44
0.48
0.46
1
0.56
0.51
0.57
0.48
8 16 32 64 128 256
noBG
long−few
long−many
short−few
short−many
noBG
long−few
long−many
short−few
short−many
SD
HD
(a) Access: download activity
1
1
0.95
0.46
0.4
0.38
1
0.99
0.58
0.52
0.45
0.44
1
1
0.95
0.47
0.4
0.38
1
0.99
0.58
0.53
0.45
0.44
1
1
0.88
0.48
0.41
0.4
1
1
0.59
0.56
0.46
0.45
1
1
0.88
0.49
0.46
0.48
1
1
0.59
0.58
0.54
0.56
8 28 749 7490
noBG
short−low
short−medium
short−high
short−overload
long
noBG
short−low
short−medium
short−high
short−overload
long
SD
HD
(b) Backbone
Figure 9: Median MOS (color) and SSIM (text) for HD and SDRTP video streams with different buffer size (x-axis) and workloads(y-axis).
(1 second) that ensures that the available capacity is not exceededin the absence of background traffic. The importance of smoothingthe sending rate is often ignored in available video assessment toolssuch as EvalVid, making them inapplicable for this study.
We note that Set-top-Boxes in IPTV networks often use propri-etary retransmission schemes that request lost packets once [24].Due to the unavailability of exact implementation details we do notaccount for such recovery. Our results thus present a baseline in theexpected quality; however, systems deploying active (retransmis-sion) or passive (FEC) error recovery can achieve higher quality.
We use two different full-reference metrics, PSNR and SSIM, tocompute quality scores from the original and the perturbed videostream. While not considered as QoE metric, PSNR (Peak SignalNoise Ratio) enables a quality ranking of the same video contentsubject to different impairments [43, 27]. However, it does not nec-essarily correlate well with human-perception in general settings.SSIM (Structural SIMilarity) [47] has been shown to correlate bet-ter with human perception [48]. We map PSNR and SSIM scoresto quality scores according to [49].
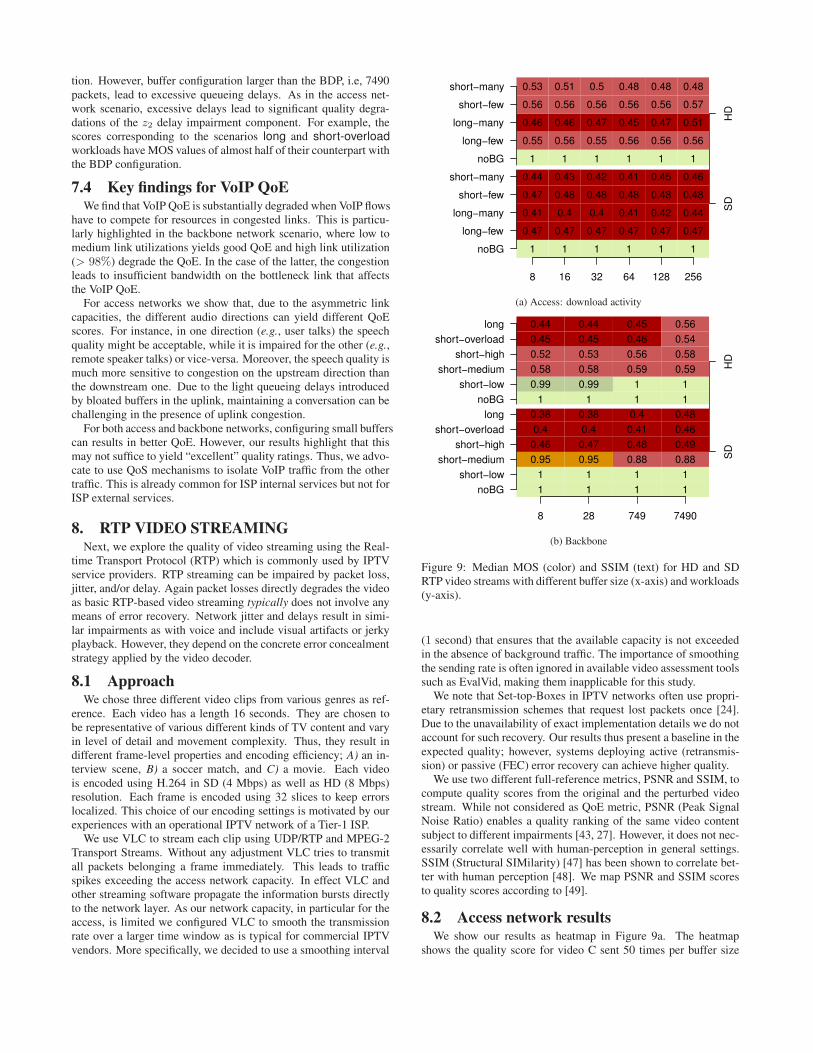
8.2 Access network resultsWe show our results as heatmap in Figure 9a. The heatmap
shows the quality score for video C sent 50 times per buffer size
(x-axis) and workload (y-axis) combination. Each cell shows themedian SSIM score and is colored according to the correspondingMOS score (see Figure 6b); a SSIM score of 1 expresses excel-lent video quality, whereas 0 expresses bad quality. The upper andthe bottom parts of the heatmap correspond to the results of HDand SD video streams, respectively. We omit quality scores ob-tained for the PSNR metric as they yield predicted scores similarto those obtained by SSIM. Also, as we focus on IPTV networkswhere the user consumes TV streams, no video traffic is present inthe upstream. For this reason, we only show results for workloadscongesting the downlink.
To show the achievable quality for all buffer size configurationsin the absence of background traffic, we show baseline results inrows labeled noBG. In these cases, the video quality is not de-graded due to the absence of congestion.
In the presence of congestion, however, the SD video quality isseverely degraded, expressed by a “bad” MOS score. This holdsregardless of the workloads and the buffer configuration; the linkutilization by all of the workloads cause video degradation due topacket loss in the video stream. We observe that even a low packetloss rate can yield lowMOS estimates. Moreover, much higher lossrates (one order of magnitude bigger) can yield the same estimates.For instance, although both scenarios, long-few and long-many,have a similar SSIM and MOS score for buffers sized to 256 and 8packets respectively, they show different packet loss rates of 0.5%and 12.5%.
In comparison to the SD video, degradations in HD videos areless pronounced although, in some cases, the packet loss rate ishigher. For instance, the packet loss rate for HD and SD videostreaming is, with the long-few workload and buffers sized to 256packets, 2.6% and 1.3% respectively. However, the HD videostream obtains a better MOS score. This interesting phenomenacan be explained by the higher resolution and bit-rate of HD videostreams, which reduce the visual impact of artifacts resulting frompacket losses during video streams.
In the case of UDP video streaming in access networks, whatmatters is the available bandwidth, not the buffer size. Moreover,even though buffers regulate the trade-off between packet lossesand delay, they have limited influence on the quality from the per-spective of an IPTV viewer.
8.3 Backbone network resultsSimilar to the previous access network scenario, we show the
video quality scores obtained for the same video C as a heatmapin Figure 9b, both for SD and HD resolution. Each cell of theheatmap shows the median SSIM score and is colored according tothe corresponding perceptive MOS score (see Figure 6b). As in theprevious scenario, the video was sent 50 times per buffer size (x-axis) and workload (y-axis) configuration. We omit PSNR qualityscores as they are similar to the SSIM quality scores.
As in the access network scenario, the bottom row labeled noBGshows the baseline results for an idle backbone without backgroundtraffic. Similarly, workloads that do not fully utilize the bottlenecklink, i.e., short-low, lead to optimal video quality, as expressed byan SSIM score of 1. The reason is that the available capacity in thebottleneck link allows streaming the video without suffering frompacket losses.
First quality degradations are observable in the short-mediumscenario, where the quality decreases with increasing link utiliza-tion. In this scenario, workloads achieve full link utilization for749/7490 buffers more often than for the 8/28 buffer configura-tions. It results in higher loss rates for the video flows lowering
the quality and is more pronounced for the HD videos which havehigher bandwidth requirements.
Workloads that sustainably utilize the bottleneck link, i.e., short-high, short-overload, and long, yield bad quality scores due tohigh loss rates. These scenarios provide insufficient available band-width to stream the video without losses. Increasing the buffer sizehelps to decrease the loss rate, leading to slight improvements inthe SSIM score.
Comparing the obtained quality scores among the three differentvideos leads to minor differences in quality scores. These differ-ences result from different encoding efficiencies that cause differ-ent levels of burstiness in the streamed video. However, the qualityscores of all video clips lead to the same primary observation: qual-ity mainly depends on the workload configuration and decreaseswith link utilization. Increasing the buffer size helps to lower theloss rate and therefore to marginally improve the video quality.
8.4 Key findings for RTP video QualityOur results indicate a roughly binary behavior of video quality: i)
when the bottleneck link has sufficient available capacity to streamthe video, the video quality is good, and ii) otherwise the qualityis bad. In between, if the background traffic utilizes the link onlytemporarily, the video quality is sometimes degraded. This resultsin an overall degradation that increases with link utilization. Us-ing HD videos yields marginally better quality scores even thoughthey use higher bandwidth. We find that the influence of the buffersize is marginal as delay does not play a major role for IPTV. Whatmainly matters is the available bandwidth. We did not include qual-ity metrics relevant for interactive TV or video-calls. We furthernote that our results represent a baseline quality achievable withouterror recovery. Error recovery (e.g., retransmissions) will increasethe overall quality.
9. WEB BROWSINGWe next move to web browsing, our last application under study.
The web browsing experience (WebQoE) can be quantified by twomain indicators [14]. One is the page loading time (PLT), which isdefined as the difference between a Web page request time and thecompletion time of rendering the Web page in a browser. Anotheris the time for the first visual sign of progress. In this paper weconsider PLT of information retrieval tasks, for which there existsan ITU QoE model (i.e., G.1030 [5]) to map page loading times touser scores.
We note that WebQoE does not directly depend on packet loss ar-tifacts, but rather on the completion time of underlying TCP flows.Thus, factoring in various workloads and buffer sizing configura-tions—which influence the TCP performance—is particularly rele-vant for understanding WebQoE from a network only perspective.Given that the PLT as measured in a browser can be approximatedfrom flow completion times as parameter, is sometimes consideredas a QoS parameter. Since the applied G.1030 model logarithmi-cally maps PLT to QoE, it can be misbelieved QoS parameters can(always) be mapped to QoE.We therefore note that other QoE mod-els are of higher complexity as different input parameter are usedthat cannot be directly derived from a QoS parameters, e.g., speechsignals as used in Section 7.
9.1 ApproachTo evaluate the WebQoE, we map the PLT to a user score z by
using the ITU Recommendation G.1030 [5] specified for web in-formation retrieval tasks. We consider the one-page version of theITU model, which logarithmically maps single PLT’s to scores inthe range z ∈ [1, 5] (i.e., 5:excellent, 4:good, 3:fair, 2:poor, 1:bad,
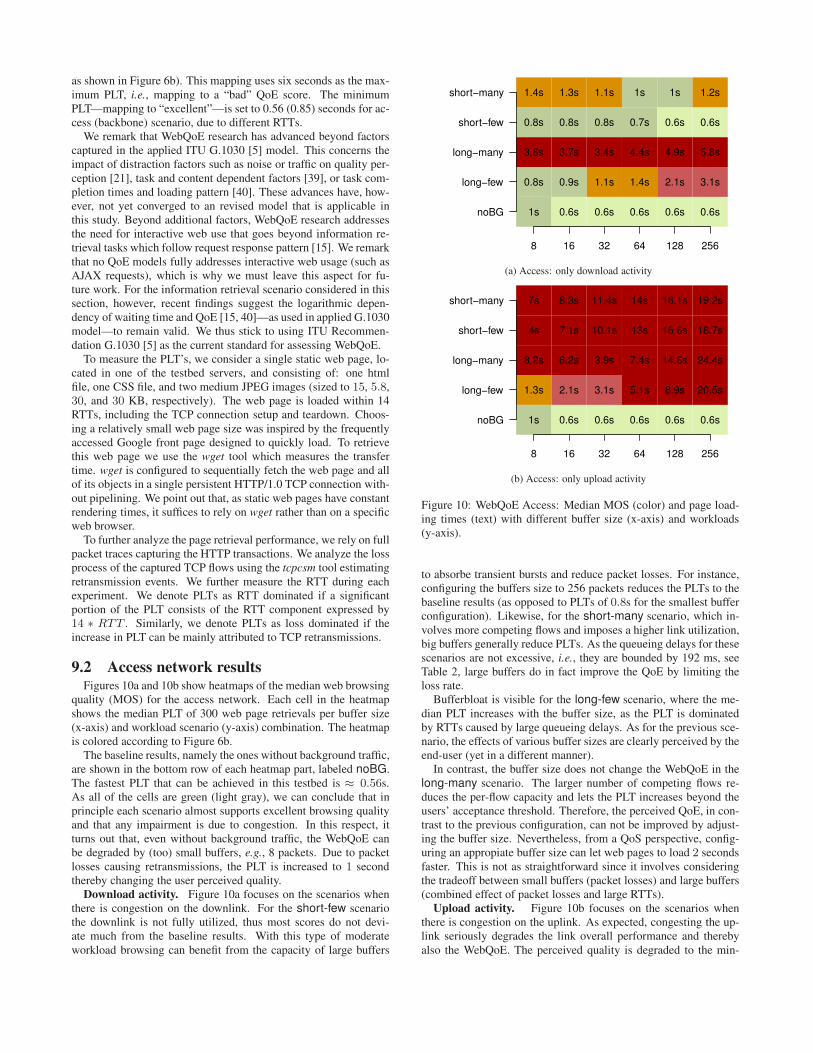
as shown in Figure 6b). This mapping uses six seconds as the max-imum PLT, i.e., mapping to a “bad” QoE score. The minimumPLT—mapping to “excellent”—is set to 0.56 (0.85) seconds for ac-cess (backbone) scenario, due to different RTTs.
We remark that WebQoE research has advanced beyond factorscaptured in the applied ITU G.1030 [5] model. This concerns theimpact of distraction factors such as noise or traffic on quality per-ception [21], task and content dependent factors [39], or task com-pletion times and loading pattern [40]. These advances have, how-ever, not yet converged to an revised model that is applicable inthis study. Beyond additional factors, WebQoE research addressesthe need for interactive web use that goes beyond information re-trieval tasks which follow request response pattern [15]. We remarkthat no QoE models fully addresses interactive web usage (such asAJAX requests), which is why we must leave this aspect for fu-ture work. For the information retrieval scenario considered in thissection, however, recent findings suggest the logarithmic depen-dency of waiting time and QoE [15, 40]—as used in applied G.1030model—to remain valid. We thus stick to using ITU Recommen-dation G.1030 [5] as the current standard for assessing WebQoE.
To measure the PLT’s, we consider a single static web page, lo-cated in one of the testbed servers, and consisting of: one htmlfile, one CSS file, and two medium JPEG images (sized to 15, 5.8,30, and 30 KB, respectively). The web page is loaded within 14RTTs, including the TCP connection setup and teardown. Choos-ing a relatively small web page size was inspired by the frequentlyaccessed Google front page designed to quickly load. To retrievethis web page we use the wget tool which measures the transfertime. wget is configured to sequentially fetch the web page and allof its objects in a single persistent HTTP/1.0 TCP connection with-out pipelining. We point out that, as static web pages have constantrendering times, it suffices to rely on wget rather than on a specificweb browser.
To further analyze the page retrieval performance, we rely on fullpacket traces capturing the HTTP transactions. We analyze the lossprocess of the captured TCP flows using the tcpcsm tool estimatingretransmission events. We further measure the RTT during eachexperiment. We denote PLTs as RTT dominated if a significantportion of the PLT consists of the RTT component expressed by14 ∗ RTT . Similarly, we denote PLTs as loss dominated if theincrease in PLT can be mainly attributed to TCP retransmissions.
9.2 Access network resultsFigures 10a and 10b show heatmaps of the median web browsing
quality (MOS) for the access network. Each cell in the heatmapshows the median PLT of 300 web page retrievals per buffer size(x-axis) and workload scenario (y-axis) combination. The heatmapis colored according to Figure 6b.
The baseline results, namely the ones without background traffic,are shown in the bottom row of each heatmap part, labeled noBG.The fastest PLT that can be achieved in this testbed is ≈ 0.56s.As all of the cells are green (light gray), we can conclude that inprinciple each scenario almost supports excellent browsing qualityand that any impairment is due to congestion. In this respect, itturns out that, even without background traffic, the WebQoE canbe degraded by (too) small buffers, e.g., 8 packets. Due to packetlosses causing retransmissions, the PLT is increased to 1 secondthereby changing the user perceived quality.
Download activity. Figure 10a focuses on the scenarios whenthere is congestion on the downlink. For the short-few scenariothe downlink is not fully utilized, thus most scores do not devi-ate much from the baseline results. With this type of moderateworkload browsing can benefit from the capacity of large buffers
1s
0.8s
3.8s
0.8s
1.4s
0.6s
0.9s
3.7s
0.8s
1.3s
0.6s
1.1s
3.4s
0.8s
1.1s
0.6s
1.4s
4.4s
0.7s
1s
0.6s
2.1s
4.9s
0.6s
1s
0.6s
3.1s
5.8s
0.6s
1.2s
8 16 32 64 128 256
noBG
long−few
long−many
short−few
short−many
(a) Access: only download activity
1s
1.3s
8.2s
4s
7s
0.6s
2.1s
6.2s
7.1s
8.3s
0.6s
3.1s
3.9s
10.1s
11.4s
0.6s
5.1s
7.4s
13s
14s
0.6s
8.9s
14.6s
16.6s
16.1s
0.6s
20.5s
24.4s
18.7s
19.2s
8 16 32 64 128 256
noBG
long−few
long−many
short−few
short−many
(b) Access: only upload activity
Figure 10: WebQoE Access: Median MOS (color) and page load-ing times (text) with different buffer size (x-axis) and workloads(y-axis).
to absorbe transient bursts and reduce packet losses. For instance,configuring the buffers size to 256 packets reduces the PLTs to thebaseline results (as opposed to PLTs of 0.8s for the smallest bufferconfiguration). Likewise, for the short-many scenario, which in-volves more competing flows and imposes a higher link utilization,big buffers generally reduce PLTs. As the queueing delays for thesescenarios are not excessive, i.e., they are bounded by 192 ms, seeTable 2, large buffers do in fact improve the QoE by limiting theloss rate.
Bufferbloat is visible for the long-few scenario, where the me-dian PLT increases with the buffer size, as the PLT is dominatedby RTTs caused by large queueing delays. As for the previous sce-nario, the effects of various buffer sizes are clearly perceived by theend-user (yet in a different manner).
In contrast, the buffer size does not change the WebQoE in thelong-many scenario. The larger number of competing flows re-duces the per-flow capacity and lets the PLT increases beyond theusers’ acceptance threshold. Therefore, the perceived QoE, in con-trast to the previous configuration, can not be improved by adjust-ing the buffer size. Nevertheless, from a QoS perspective, config-uring an appropiate buffer size can let web pages to load 2 secondsfaster. This is not as straightforward since it involves consideringthe tradeoff between small buffers (packet losses) and large buffers(combined effect of packet losses and large RTTs).
Upload activity. Figure 10b focuses on the scenarios whenthere is congestion on the uplink. As expected, congesting the up-link seriously degrades the link overall performance and therebyalso the WebQoE. The perceived quality is degraded to the min-
0.9s
0.8s
0.9s
1.3s
3.4s
5s
0.8s
0.8s
1s
1.3s
3.5s
4.8s
0.8s
0.8s
0.8s
1.5s
4.5s
5.9s
0.8s
0.8s
0.8s
1.6s
9.5s
9.2s
8 28 749 7490
noBG
short−low
short−medium
short−high
short−overload
long
Figure 11: WebQoE Backbone: Median MOS (color) and pageloading times (text) with different buffer size (x-axis) and work-loads (y-axis).
imum for every buffer size configuration of the scenarios short-many, short-few, and the long-many. The only scenario wherethe browsing experience is slightly more acceptable is the long-few scenario if buffers are small. Such configuration reduces themedian PLT from 20 to 1.3 seconds, which maps to a fair qualityrating.
From a QoS perspective, the figure shows that the PLT and thebuffer size are strongly correlated to the QoE. A wise decision onthe dimensioning of the buffers can reduce the PLT from 24.4 to3.8 seconds (long-many). However, and in line with the previousobservations, such reductions do not generally suffice to change theuser perceived (bad) quality.
Combined upload and download activity. In the case of work-loads in both, the uplink and downlink direction (not shown), theQoE is dominated by the upload activity. However, due to loweroverall link utilization and shorter queueing delays (see § 6), themedian PLT are less than for the scenarios involving only uploads.The resulting scores generally map to bad quality scores; only thelong-few workload shows better QoE for buffers ≤ 128 packets.
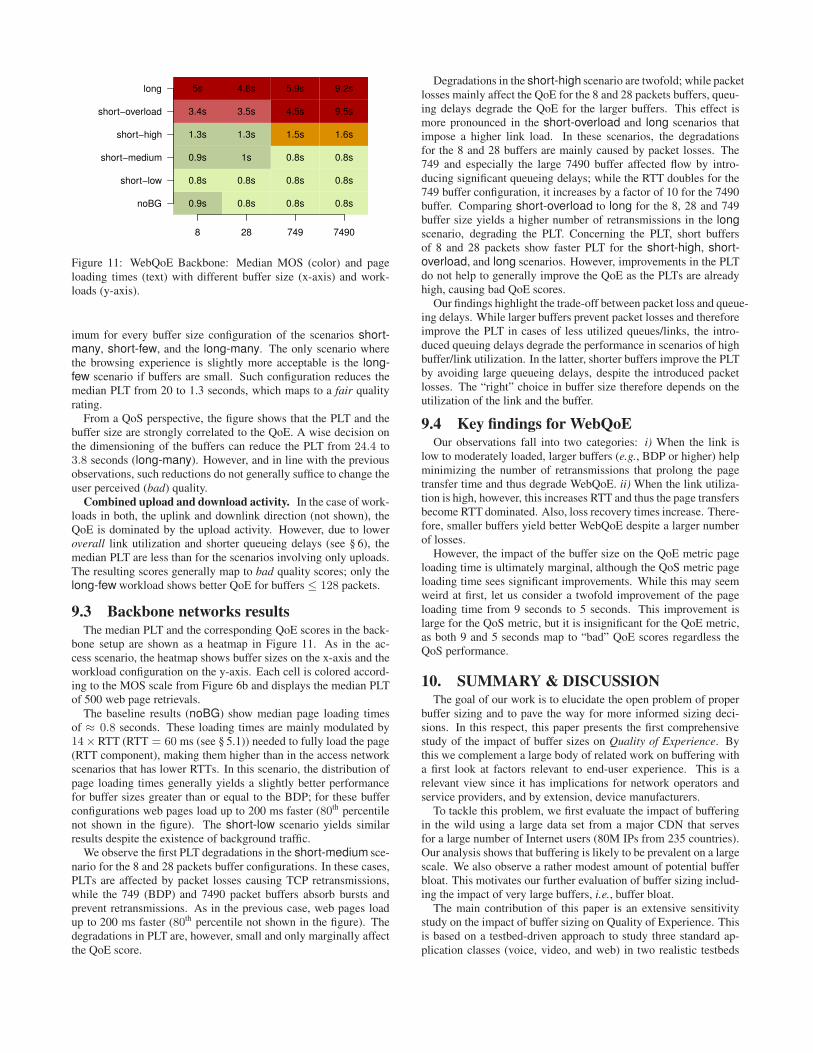
9.3 Backbone networks resultsThe median PLT and the corresponding QoE scores in the back-
bone setup are shown as a heatmap in Figure 11. As in the ac-cess scenario, the heatmap shows buffer sizes on the x-axis and theworkload configuration on the y-axis. Each cell is colored accord-ing to the MOS scale from Figure 6b and displays the median PLTof 500 web page retrievals.
The baseline results (noBG) show median page loading timesof ≈ 0.8 seconds. These loading times are mainly modulated by14×RTT (RTT = 60 ms (see § 5.1)) needed to fully load the page(RTT component), making them higher than in the access networkscenarios that has lower RTTs. In this scenario, the distribution ofpage loading times generally yields a slightly better performancefor buffer sizes greater than or equal to the BDP; for these bufferconfigurations web pages load up to 200 ms faster (80th percentilenot shown in the figure). The short-low scenario yields similarresults despite the existence of background traffic.
We observe the first PLT degradations in the short-medium sce-nario for the 8 and 28 packets buffer configurations. In these cases,PLTs are affected by packet losses causing TCP retransmissions,while the 749 (BDP) and 7490 packet buffers absorb bursts andprevent retransmissions. As in the previous case, web pages loadup to 200 ms faster (80th percentile not shown in the figure). Thedegradations in PLT are, however, small and only marginally affectthe QoE score.
Degradations in the short-high scenario are twofold; while packetlosses mainly affect the QoE for the 8 and 28 packets buffers, queu-ing delays degrade the QoE for the larger buffers. This effect ismore pronounced in the short-overload and long scenarios thatimpose a higher link load. In these scenarios, the degradationsfor the 8 and 28 buffers are mainly caused by packet losses. The749 and especially the large 7490 buffer affected flow by intro-ducing significant queueing delays; while the RTT doubles for the749 buffer configuration, it increases by a factor of 10 for the 7490buffer. Comparing short-overload to long for the 8, 28 and 749buffer size yields a higher number of retransmissions in the longscenario, degrading the PLT. Concerning the PLT, short buffersof 8 and 28 packets show faster PLT for the short-high, short-overload, and long scenarios. However, improvements in the PLTdo not help to generally improve the QoE as the PLTs are alreadyhigh, causing bad QoE scores.
Our findings highlight the trade-off between packet loss and queue-ing delays. While larger buffers prevent packet losses and thereforeimprove the PLT in cases of less utilized queues/links, the intro-duced queuing delays degrade the performance in scenarios of highbuffer/link utilization. In the latter, shorter buffers improve the PLTby avoiding large queueing delays, despite the introduced packetlosses. The “right” choice in buffer size therefore depends on theutilization of the link and the buffer.
9.4 Key findings for WebQoEOur observations fall into two categories: i) When the link is
low to moderately loaded, larger buffers (e.g., BDP or higher) helpminimizing the number of retransmissions that prolong the pagetransfer time and thus degrade WebQoE. ii) When the link utiliza-tion is high, however, this increases RTT and thus the page transfersbecome RTT dominated. Also, loss recovery times increase. There-fore, smaller buffers yield better WebQoE despite a larger numberof losses.
However, the impact of the buffer size on the QoE metric pageloading time is ultimately marginal, although the QoS metric pageloading time sees significant improvements. While this may seemweird at first, let us consider a twofold improvement of the pageloading time from 9 seconds to 5 seconds. This improvement islarge for the QoS metric, but it is insignificant for the QoE metric,as both 9 and 5 seconds map to “bad” QoE scores regardless theQoS performance.
10. SUMMARY & DISCUSSIONThe goal of our work is to elucidate the open problem of proper
buffer sizing and to pave the way for more informed sizing deci-sions. In this respect, this paper presents the first comprehensivestudy of the impact of buffer sizes on Quality of Experience. Bythis we complement a large body of related work on buffering witha first look at factors relevant to end-user experience. This is arelevant view since it has implications for network operators andservice providers, and by extension, device manufacturers.
To tackle this problem, we first evaluate the impact of bufferingin the wild using a large data set from a major CDN that servesfor a large number of Internet users (80M IPs from 235 countries).Our analysis shows that buffering is likely to be prevalent on a largescale. We also observe a rather modest amount of potential bufferbloat. This motivates our further evaluation of buffer sizing includ-ing the impact of very large buffers, i.e., buffer bloat.
The main contribution of this paper is an extensive sensitivitystudy on the impact of buffer sizing on Quality of Experience. Thisis based on a testbed-driven approach to study three standard ap-plication classes (voice, video, and web) in two realistic testbeds
emulating access and backbone networks. Our evaluation consid-ers a wide range of traffic scenarios and buffer size configurations,including buffer bloat.
Our main finding is that the level of competing network workloadis the primary determinant of user QoE. It is generally known andunderstood that buffer sizing impacts QoS metrics. In particular,it is not surprising that sustainable congestion degrades networkperformance. Surprisingly, our results show that in the absence ofcongestion, buffer sizing has a significant impact on QoS metrics,whereas it only marginally impacts QoE metrics. The good news ofthis novel observation for network operators is that limiting conges-tion, e.g., via QoS mechanisms or over-provisioning, may actuallyyield more immediate improvements in QoE than efforts to reducebuffering. There are, however, several subtle issues that complicatebuffer sizing.
Concretely, application characteristics and the level of conges-tion determine the potential impact of buffer sizing choices. In thecase of Web browsing, large buffers yield better QoE for moderatenetwork loads, while smaller buffers improve QoE for high networkloads. This suggests load-dependent buffer sizing schemes. De-spite the potential for optimization, the impact of reasonable buffersizes on QoE metrics is marginal, while the impact on QoS met-rics can be significant. This is relevant for network operators, as itindicates that as long as buffers are kept to a reasonable size theirimpact is of marginal relevance. Concerning the ongoing buffer-bloat debate, our main claim is that only relatively narrow condi-tions seriously degrade QoE, i.e., when buffers are over-sized andsustainably filled. Such conditions indeed occur in practice, as ourempirical evaluation and other recent studies confirm, but their oc-currence is relatively rare.
We remark that emulations are by definition an abstraction of livenetworks and that predictive QoE models are abstractions of end-users. Thus our results should not be interpreted as representativeof any specific network deployment or specific end-user quality rat-ings. We do, however, argue that our results accurately reflect thekey interactions between buffer sizes and network traffic, which isthe objective of our study.
We envision future work to extend our first step towards the QoE-driven buffer size evaluation in the following directions: 1) includ-ing more applications, 2) going beyond testbed studies by verifyingthe results of our testbed-driven evaluations in operational (wire-less) networks, and 3) verifying selected scenarios in user studies.While our UDP video quality assessment did not involve retrans-missions for error recovery, initial work on HTTP video streamingis consistent with our results.
Observed discrepancies among network-centric QoS metrics andapplication/user centric QoE metrics advocate a stronger use of ap-plication centric metrics in measurement and performance evalu-ation studies. This is challenging since QoE is an application-specific measure and thus needs to be evaluated individually forevery application. To reduce the complexity of QoE assessment innetwork design and network measurement, it appears appealing toaim for a general mapping of network performance (e.g., QoS met-rics) to QoE. We believe this is possible for some QoE indicators,e.g., page-loading time in specific scenarios. However, since QoSand QoE represent fundamentally different concepts that depend ondifferent parameters despite of common misconceptions QoE can-not be generally derived from QoS metrics. Examples used in thispaper include speech QoE assessment based on audio signals orvideo quality assessment based on decoded video frames. To sim-plify future QoE evaluations, this paper exemplifies the use of QoEmetrics for measurement studies.
11. ACKNOWLEDGEMENTSOliver Hohlfeld was supported in part by DFG SFB 1053 and
Telekom Innovation Laboratories project OMAR. We thank MarkAllman and Dennis Guse for their insightful comments andMichaelBlodgett for maintaining the WAIL backbone testbed. We alsothank the anonymous IMC reviewers and our shepherd RodrigoFonseca for their valuable comments and suggestions to improvethis manuscript.
12. REFERENCES
[1] Bufferbloat. http://www.bufferbloat.net/.
[2] ITU-T Recommendation P.862: Perceptual Evaluation ofSpeech Quality (PESQ): An Objective Method forEnd-To-End Speech Quality Assessment of Narrow-BandTelephone Networks and Speech Codecs, 2001.
[3] ITU-T Recommendation G.107: The E-Model, acomputational model for use in transmission planning, 2003.
[4] ITU-T Rec. P.862 annex a: Reference implementations andconformance testing for ITU-T Recs P.862, P.862.1 a.P.862.2, 2005.
[5] ITU-T Recommendation G.1030: estimating end-to-endperformance in IP networks for data applications, 2005.
[6] Bufferbloat: What’s wrong with the internet? Queue,9(12):10:10–10:20, Dec. 2011.
[7] Qualinet white paper on definitions of Quality of Experience.European Network on Quality of Experience in MultimediaSystems and Services (COST Action IC 1003), Patrick LeCallet, Sebastian Möller and Andrew Perkis, eds., Version1.1, June 2012.
[8] M. Allman. Comments on bufferbloat. ACM CCR,43(1):31–37, Jan. 2013.
[9] G. Appenzeller, I. Keslassy, and N. McKeown. Sizing routerbuffers. In ACM SIGCOMM, 2004.
[10] N. Barakat and T. E. Darcie. Delay characterization of cableaccess networks. IEEE Communications Letters,11(4):357–359, 2007.
[11] N. Beheshti, Y. Ganjali, M. Ghobadi, N. McKeown, andG. Salmon. Experimental study of router buffer sizing. InACM IMC, 2008.
[12] C. Chirichella and D. Rossi. To the moon and back: areInternet bufferbloat delays really that large. In IEEEINFOCOM TMA Workshop, 2013.
[13] M. Dischinger, A. Haeberlen, K. P. Gummadi, and S. Saroiu.Characterizing residential broadband networks. In ACMIMC, 2007.
[14] S. Egger, T. Hossfeld, R. Schatz, and M. Fiedler. Tutorial:Waiting Times in Quality of Experience for Web basedServices. In IEEE QoMEX, 2012.
[15] S. Egger, P. Reichl, T. Hosfeld, and R. Schatz. “time isbandwidth”? narrowing the gap between subjective timeperception and Quality of Experience. In IEEE ICC, 2012.
[16] S. Egger, R. Schatz, K. Schoenenberg, A. Raake, andG. Kubin. Same but different? - using speech signal featuresfor comparing conversational voip quality studies. In IEEEICC, 2012.
[17] M. Enachescu, Y. Ganjali, A. Goel, N. McKeown, andT. Roughgarden. Routers with very small buffers. In IEEEINFOCOM, 2006.
[18] J. Gettys. IW10 considered harmful. IETF Internet-Draft,2011.
[19] J. Gettys and K. Nichols. Bufferbloat: Dark buffers in theinternet. ACM Queue, 9:40:40–40:54, Nov. 2011.
[20] Y. Gu, D. F. Towsley, C. V. Hollot, and H. Zhang.Congestion control for small buffer high speed networks. InIEEE INFOCOM, 2007.
[21] D. Guse, S. Egger, A. Raake, and S. Möller. Web-QoE underreal-world distractions: Two test cases. In IEEE QoMEX,2014.
[22] K. L. Haiqing Jiang, Yaogong Wang and I. Rhee. Tacklingbufferbloat in 3G/4G networks. In ACM IMC, 2012.
[23] M. Heusse, S. A. Merritt, T. X. Brown, and A. Duda.Two-way TCP connections: old problem, new insight. ACMCCR, 41(2):6–15, 2011.
[24] O. Hohlfeld, B. Balarajah, S. Benner, A. Raake, andF. Ciucu. On revealing the ARQ mechanism of MSTV. InIEEE ICC, 2011.
[25] V. Jacobson. Modified TCP congestion control algorithm.End2end-interest mailing list, Apr. 1990.
[26] N. Kitawaki and K. Itoh. Pure delay effects on speech qualityin telecommunications. IEEE Journal on Selected Areas in
Communications, 9(4):586–593, 1991.
[27] J. Korhonen and J. You. Peak signal-to-noise radio revised:Is simple beautiful? In IEEE QoMEX, 2012.
[28] C. Kreibich, N. Weaver, B. Nechaev, and V. Paxson.Netalyzr: Illuminating the edge network. In ACM IMC, 2010.
[29] A. Lakshmikantha, C. Beck, and R. Srikant. Impact of filearrivals and departures on buffer sizing in core routers.IEEE/ACM ToN, 19(2):347–358, Apr. 2011.
[30] J. Martin, J. Westall, T. Shaw, G. White, R. Woundy,J. Finkelstein, and G. Hart. Cable modem buffer managementin docsis networks. In IEEE conference on Sarnoff, 2010.
[31] S. Möller, W.-Y. Chan, N. Côté, T. H. Falk, A. Raake, andM. Wältermann. Speech quality estimation: Models andtrends. IEEE Signal Process. Mag., 28(6):18–28, 2011.
[32] K. Nichols and V. Jacobson. Controlling queue delay. ACMQueue, 10(5), May 2012.
[33] R. S. Prasad, C. Dovrolis, and M. Thottan. Router buffersizing for tcp traffic and the role of the output/input capacityratio. IEEE/ACM ToN, 17(5):1645–1658, Oct. 2009.
[34] A. Raake. Predicting speech quality under random packetloss: Individual impairment and additivity with othernetwork impairments. Acta Acustia, 90:1061–1083, 2004.
[35] B. Sat and B. W. Wah. Analyzing voice quality in popularvoip applications. IEEE MultiMedia, 16(1):46–59, 2009.
[36] L. Sequeira et al. The influence of the buffer size in packetloss for competing multimedia and bursty traffic. In SPECTS,2013.
[37] J. Sommers, P. Barford, A. Greenberg, and W. Willinger. AnSLA perspective on the router buffer sizing problem.SIGMETRICS Perf. Eval. Review, 35:40–51, March 2008.
[38] J. Sommers, H. Kim, and P. Barford. Harpoon: a flow-leveltraffic generator for router and network tests. SIGMETRICS
Perf. Eval. Review, 32(1):392–392, June 2004.
[39] D. Strohmeier, S. Jumisko-Pyykko, and A. Raake. Towardtask-dependent evaluation of web-QoE: Free exploration vs.“who ate what?”. In IEEE Globecom Workshops, 2012.
[40] D. Strohmeier, M. Mikkola, and A. Raake. The importanceof task completion times for modeling web-QoE ofconsecutive web page requests. In IEEE QoMEX, 2013.
[41] L. Sun. Speech Quality Prediction for Voice over Internet
Protocol Networks. PhD thesis, Univ. of Plymouth, 2004.
[42] S. Sundaresan, W. de Donato, N. Feamster, R. Teixeira,S. Crawford, and A. Pescapè. Measuring home broadbandperformance. Commun. ACM, 55(11):100–109, Nov. 2012.
[43] Q. H. Thu and M. Ghanbari. Scope of validity of PSNR inimage/video quality assessment. Electronics Letters,44(13):800–801, June 2008.
[44] C. Villamizar and C. Song. High performance tcp in ansnet.ACM CCR, 24(5):45–60, Oct. 1994.
[45] A. Vishwanath, V. Sivaraman, and M. Thottan. Perspectiveson router buffer sizing: recent results and open problems.ACM CCR, 39(2):34–39, Mar. 2009.
[46] M. Wang and Y. Ganjali. The effects of fairness in buffersizing. In IFIP-TC6 conference on Ad Hoc and sensor
networks, wireless networks, next generation internet, 2007.
[47] Z. Wang, A. C. Bovik, H. R. Sheikh, and E. P. Simoncelli.Image quality assessment: From error visibility to structuralsimilarity. IEEE Trans. on Image Processing, 13:600–612,2004.
[48] Z. Wang, L. Lu, and A. Bovik. Video quality assessmentbased on structural distortion measurement. SignalProcessing: Image Communication, 19(1), Jan. 2004.
[49] T. Zinner, O. Abboud, O. Hohlfeld, T. Hossfeld, andP. Tran-Gia. Towards QoE management for scalable videostreaming. In 21st ITC-SS, 2010.