Embed Size (px)
Citation preview

3 " 7 9
A/Qfd S/0.28H21
THE LOCAL ECONOMIC IMPACT OF ALTERNATIVE STATE
BUDGET REDUCTIONS FOR SELECTED
TEXAS COMMUNITY COLLEGES
DISSERTATION
Presented to the Graduate Council of the
North Texas State University in Partial
Fulfillment of the Requirements
For the Degree of
DOCTOR OF PHILOSOPHY
By
Abdelrahim Saleh, B.A., M.B.A.
Denton, Texas
May, 1988

Saleh, Abdelrahim Mohamad, The Local Economic Impact of
Alternative State Budget Reductions for Selected Texas
Community Colleges. Doctor of Philosophy (College
Teaching), May, 1988, 90 pp., 20 tables, 1 illustration,
bibliography, 51 titles.
The purpose of this study was to determine the local
economic impact of alternative state budget reductions for
Texas community colleges by investigating the income losses
to the Metropolitan Statistical Areas (MSAs) if state
appropriations were reduced by 10, 15, and 20 percent. The
objective of this study was achieved through an economic
analysis of the local economy of selected MSAs and by
computing the income size which was generated by selected
colleges. Eight community colleges located in eight MSAs
participated by answering mailed questionnaires.
The model of Direct Economic Impact was applied to
describe the colleges' economic impact. The model was
composed of college expenditures, employee expenditures,
student expenditures, and the economic multiplier.
The study revealed that the selected community colleges
were responsible for creating new jobs and increasing the
income of the local economies. These eight colleges were
responsible for increasing the income of the local economies
by $294,945,560 and for creating 5,129 jobs.

Reduction in state appropriations to the selected
community colleges will reduce the income they produce. A
state appropriation cut of 10 percent will result in a loss
to the local economy of $6,153,951. A 15 percent reduction
in state appropriations will cause the local economy to lose
$9,230,943. A 20 percent reduction in state appropriations
will reduce the local economic income by $12,307,920.

TABLE OF CONTENTS
LIST OF TABLES
LIST OF ILLUSTRATIONS
Chapter
I. INTRODUCTION 1
Statement of the Problem Purpose of the Study Significance of the Study General Background of the Problem Theoretical background of the problem
II. LITERATURE REVIEW 14
Studies in Economic Impact Statewide Studies
III. METHODOLOGY 23
Research Model Steps for Counting Direct Economic Impact The Multiplier Sources of Data
State Financial Support--Expected Changes
IV. ECONOMIC ANALYSIS 37
Amarillo College Economic Impact Galveston College Economic Impact Grayson County College Economic Impact The Economic Impact of Midland College Odessa College Economic Impact Texarkana Community College Economic Impact Temple Junior College Economic Impact Tyler Junior College Economic Impact Texas Financial Appropriations and the Assumed Budget Cuts Chapter Summary
V. SUMMARY, FINDINGS, CONCLUSIONS, AND RECOMMENDATIONS 64
Summary
m

Findings Conclusions Recommendations
APPENDIXES 7 2
Appendix A Appendix B
BIBLIOGRAPHY 8 5
IV

LIST OF TABLES
Table Page
1. Selected Local Economies And Colleges . .
2. Colleges Economic Impact Studies
3. Direct Economic Impact Model
4. Sources Of Primary Data
5. Sources Of Secondary Data
6. Amarillo College Economic Impact
7. Galveston College Economic Impact . . . .
8. Grayson County College Economic Impact . .
9. Midland College Economic Impact
10. Odessa College Economic Impact
11. Texarkana Community College Economic Impact
12. Temple Junior College Economic Impact . .
13. Tyler Junior College Economic Impact . . .
14. Financial Appropriation 1985-86
15. MSA Dollar Loss From A 10 Percent Cut . .
16. MSA Dollar Loss From A 15 Percent Cut . .
17. MSA Dollar Loss From A 20 Percent Cut . .
18. Income Percentage Losses From A 10 Percent Cut
19. Income Percentage Losses From A 15 Percent Cut .
20. Income Percentage Losses From A 20 Percent Cut .
4
19
25
35
36
39
42
44
46
48
50
51
53
55
56
58
59
60
62
63

LIST OF ILLUSTRATIONS
Figure P a g e
1. Information Economics Model 05
VI

CHAPTER I
INTRODUCTION
In the next biennium Texas community colleges will
receive 3.3 percent in state funding over the amount
originally appropriated to them in 1985-87. Such
appropriations have been called inadequate by many
institutional officials (Jaschik 1987). The 3.3 percent
increase was much less than the 30 percent increases which
had been requested (Dallas Community College District
1986).
Fluctuations and reductions in state appropriations may
become a dominant feature of community college funding in
the future. Under such constraints, community colleges need
to learn how to survive and how to continue their missions.
State funding reductions must also be evaluated economically
to determine the economic impact on Metropolitan Statistical
Areas (MSAs) in which community colleges are located.
The reduction in state funding may be associated with a
reduction in the community colleges* economic impact on
local areas. An investigation of some of the economic
consequences of statewide reductions in funding on the MSAs
in which selected community colleges are located is
accomplished through this study.

2
Statement of the Problem
The problem addressed in this study is the negative
local economic consequences of state appropriation cuts. As
participants in the economic development of their local
areas, community colleges are particularly vulnerable to
reductions in state funding. Because funding may continue
to be reduced due of problems facing the business and oil
industry, state actions are critical in preventing a
reduction in the income of local economies in which these
colleges are located.
The degree of disparity of income and employment among
the regions in Texas is a continuing major economic issue.
The Rio Grande Valley Region's lowest average personal
income was reported as $5,620, in 1985, in McAllen,
Edinburg, Mission, and Hidalgo (Kay 1986). During this same
period the unemployment rate in Midland was 4.1 percent, in
Bowie 8.2 percent, and in Galveston 9.7 percent (Economic
Research and Analysis Department 1985). Differences in
industrial employment structure among various Texas regions
were the major cause of variations in personal income and
unemployment. While nonfarming employment was 22 percent of
the total employment in McAllen, Edinburg, Mission and
Hidalgo, it was 51 percent in Midland (Kay 1986).
Purpose of the Study
The purpose of this study is to measure the local
economic impact of reduced community college funding by

3
P®^-forming an economic bass analysis on sight Metropolitan
Statistical Areas (MASs) in Texas Across-the-board changes
in state allocations were considered in the reduced
community college funding. Multiplier estimates for
selected local areas were achieved by using employment data
on local and state economic activity.
The community colleges selected for this study are
listed in Table 1. Each college was selected because it was
located in a Metropolitan Statistical Area (MSA) which
included no more than two counties. This selection not only
eliminated the more complex economic MSAs, but provided a
simpler model for demonstrating local economic reduction
more readily.
Significance of the Study
Information on community colleges' economic impact may
act as a signal for taxpayers, legislators, or college
administrators determine whether the returns are at least as
great as the taxpayers' investments. Information economics
provides a model for evaluating alternative information
systems that will help in understanding the significance and
objectives of this study (Crandall 1969). Starting with the
different signals in each system, the investigator then
examines the actions generated by each type of signal and
the events resulting from these actions. Finally, the
outcome generated by each type of signal is evaluated, with

TABLE 1
SELECTED LOCAL ECONOMIES AND COLLEGES
Colleges County Metropolitan Statistical Area (MSA)*
Amarillo College
Galveston College Grayson Coun. Coll. Midland College Odessa College Temple Junior Coll.
Texarkana Comm. Coll, Tyler Junior Coll.
Potter & Randall Galveston Grayson Midland Ector Bell & Coryell Bowie Smith
Amarillo
Galv. Texas City Sherman-Denison Midland Odessa Killeen-Temple
Texarkana Tyler
* An MSA is a county or group of contiguous counties containing a city with a population of at least 50,000 or a combination of cities. It represents a community college's local economy.
the preferable system being the one that maximizes the final
outcome (see Figure 1).

Fig. 1. Information Economics Model .
* N=Information systems alternatives; Y=Signals provided by N; A=Actions taken by decision-maker based on Y; X=Events resulting from A; 0=Financial Outcome.
The beginning of the cycle "N" is information about the
state budget cuts, "Y" is generated signals about
fluctuating economic impact associated with each level of
N , and A is the action assumed to be taken by decision-
makers, either at the state or the college level, to correct
the damage. The event "X" is the result of the action taken
in "A" and may represent a closing of businesses, a higher
rate of unemployment, and a lower level of personal income.
"0" represents the final outcome of each event.
This study focuses on translating the information given
at "N" to signals for "Y." Such signals serve as an
indication as to which actions are to be taken in "A" to
correct the damage to the economy. This study does not
investigate such actions; it only provides a basis for those
who are interested in taking actions. Interested

6
individuals can process the data and transmit it, using it
as a basis for making decisions and taking actions in the
real world, and bringing about a result that has utility.
This research is archival in nature. Archival research
is concerned with the examination of recorded facts. These
facts can be found in either secondary or primary sources
(Robert 1969).
General Background of the Problem
The missions or goal statements of community colleges
share a common objective in stating their primary purpose to
be to provide post-secondary educational opportunities for
the population they serve (Ryan 1985). Such statements are
usually a listing of different valuable outcomes of learning
such as knowledge, creative capabilities, economic
productivity, and cultural enrichment.
Eaton (1985) recommended that a careful look be taken
at the changing needs of the society in relation to
traditional community colleges' values in order to improve
their missions. It is also essential to redesign curriculum
to accommodate differences in today's economy and society.
Doucette, Richardson and Fenske (1985) mentioned some
<3ifficulties in improving missions and keeping the colleges
competitive in the face of the fiscal and demographic
realities of the 1980s. The first difficulty is translating
goals into actions. The second difficulty is to assess the
levels of constituent support for each of the proportionally

7
defined missions as well as the constituents' willingness to
fund these missions. The missions that have priority may be
those that can be financially supported.
In a survey done by Duea (1981), college presidents
were asked to name the most critical issues facing their
colleges at the time of the survey and over the next decade.
Out of some twenty critical issues listed, the changing
missions and purpose of their institutions were ranked fifth
in current importance, but ranked second in importance for
the next ten years. The problems of inflation and other
financial concerns ranked as the most critical issues facing
them both currently and in the future.
Financial support for public community colleges has
usually come from five sources: state government, federal
government, gifts, grants, and student tuition. Sales taxes
serve as a major source of revenue at the state level, and
income taxes serve as the major source of revenue at the
federal level (Wattenbarger and Starnes 1976). Pressure to
obtain more funds from student tuition may be pursued, as
has been done recently in Texas. Increasing tuition as an
alternative source of support means putting pressure on
students during bad economic times. If the financial
outlook is bad for federal and state governments because of
declining revenues from income and sales taxes, then it is
also bad for students.
Variations in a community college's financial needs may

8
be affected by diversity of programs and financial support,
inflation, and instructional costs (Wattenbarger 1985). As
programs increase in diversity and number, and as prices
increase and enrollments fluctuate, state appropriations for
community colleges may represent a much more vital source of
funding.
Uncertain and shrinking financial resources in the
State of Texas have been observed between 1985 and 1987.
This phenomenon is expected to greatly affect the cash flow
of both state and local governments.
The attempts to reduce the deficit and to balance the
budget, in order to lower the interest rate and to spur
economic growth, have been discussed and adapted at the
federal level. Evans (1985) reported that the $200 billion
deficit is planned to disappear by accumulated and
programmed cuts in the federal budget. If so, the federal
financial appropriations for state governments are expected
to diminish.
McDiarmid and other state political leaders said that
the federal Gramm-Rudmann-Hollings Deficit-Reduction Act,
which requires automatic cuts in federal spending to reduce
the national budget deficit, will probably limit or prevent
increases in state appropriations in the next few years.
The deficit reduction act is expected to reduce state
budgets. A research group operated by the National
Governors Association and the National Conference of State

Legislatures projected that state governments would lose
more than $3 billion in federal grants in 1986 and $13.7
billion in 1987 (Jaschick 1986).
The declining price of oil is another problem putting
financial pressures on finances in the state of Texas.
Rabin (1985) reported that 25 percent of the Texas labor
force is directly or indirectly dependent on the oil
industry. Energy makes up a 12 percent share of the state's
economy (McClelland 1986). Ashworth, Texas Commissioner of
Higher Education, said a drop in the price of oil of $1 a
barrel generally means Texas' tax revenue will decline by
$50 million a year (Jaschick 1986a).
Big oil companies have announced cuts in their capital
spending plans to protect their cash flows and dividends.
Texas banks have been struggling for months against a
combination of bad energy loans and bad property loans (Even
Big Oil Must Shrink 1986).
Former Governor John Connally declared that unless
things change drastically, Texas will face revenue short-
falls of some $3 billion below what the state needs to
operate (McNeedy 1986). Other expectations reported by
Hillman (12) assessed the budget gap at $3.5 billion.
Ashworth (Jaschik 1986a) called the recent price
decline "very bad news." Falling oil prices earlier led the
Texas Legislature to approve a tuition increase for public
institutions. Colleges cannot set the price of oil, they

10
can only try to hold down consumption. Colleges have
attempted different conservation techniques to hold down
consumption, but the rising prices of utilities, books and
periodicals, supplies and materials, equipment, and salaries
may have crippled the effect of the colleges' attempts.
Generally, an increase in tuition may not be a good
substitute revenue for community colleges. Since the
elasticity of student demand has not been determined, it
makes it difficult to assesss the relationship between
changes in the number of students enrolled and corresponding
changes in tuition. For example, an increase in tuition may
be accompanied by a decline in the number of students who
attend colleges. Therefore, the shortage in college revenue
remains a continuous problem.
Theoretical Background of the Problem
Despite interventions in most advanced economies, the
economic problem of lagging regions has persisted
(Richardson 1973). A region may suffer from low income,
high unemployment and sluggish activity rates, poor growth
and productivity performance, and local or internal
immigration problems. It is possible to observe a range of
regional differences inside the nation or the state. There
are always some regions that are above average and others
that are below average (Richardson 1973). It is possible to

11
observe some regions that remain at the bottom of their
league over decades.
The people of a local region often have a better
understanding of their needs and problems than those outside
that area. Supporting them in allocating different
productive units within their region may better help in
developing it. Bendavid-val (1983) said that what appears
to be good for the nation may not be necessarily be good for
each of its regions, and what is good for a region may not
necessarily be good for the nation. In the nation's
interest, reallocating rural laborers in industrial programs
out of a specific region may improve the gross national
product, but for that region it means losing people from the
villages and small towns who perform important services for
the farming industry.
The dissimilarity of economic structures among the
regions inside the nation or among the localities of the
region generates different responses to business cycles.
Each economic sector may fluctuate or swing in a different
range. Therefore, it is someone's responsibility to choose
between economic stability or economic growth for the local
economy.
If the main objective is the development of the local
economy, then what are the available standards of
development? One is to identify and account for important
intra-regional linkages that influence the efficiency and
12
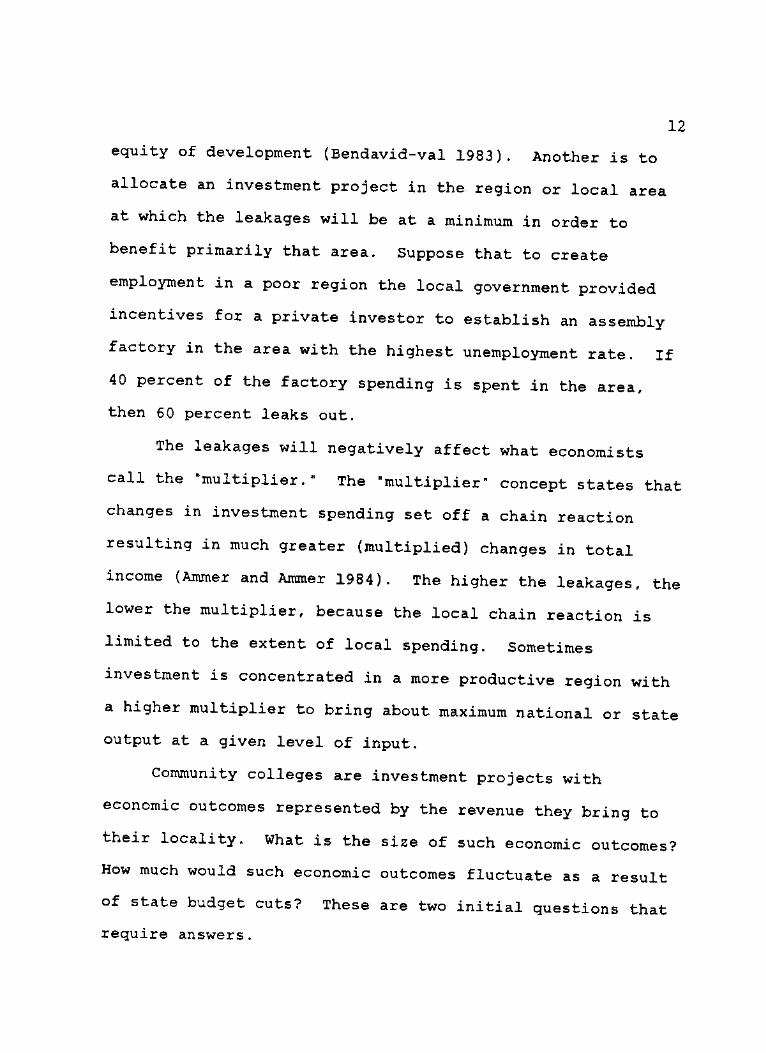
equity of development (Bendavid-val 1983). Another is to
allocate an investment project in the region or local area
at which the leakages will be at a minimum in order to
benefit primarily that area. Suppose that to create
employment in a poor region the local government provided
incentives for a private investor to establish an assembly
factory in the area with the highest unemployment rate. If
40 percent of the factory spending is spent in the area,
then 60 percent leaks out.
The leakages will negatively affect what economists
ca-H ^ e "multiplier." The "multiplier" concept states that
changes in investment spending set off a chain reaction
resulting in much greater (multiplied) changes in total
income (Ammer and Ammer 1984). The higher the leakages, the
lower the multiplier, because the local chain reaction is
limited to the extent of local spending. Sometimes
investment is concentrated in a more productive region with
a higher multiplier to bring about maximum national or state
output at a given level of input.
Community colleges are investment projects with
economic outcomes represented by the revenue they bring to
their locality. What is the size of such economic outcomes?
How much would such economic outcomes fluctuate as a result
of state budget cuts? These are two initial questions that
require answers.

13
Ryan (1985) described the community colleges' outcomes
as producers of jobs, as consumers of goods and services, as
owners of property and as depositors and investors of cash
resources that contribute to an expanding credit base.
Merchants, landlords, bankers and other business persons may
be sensitive to the students and college employees as
sources of additional income for their business ventures.
The colleges circulate funds into the economy through
expenditures, salary payments, purchases of goods and
services, and capital construction. Each element of
circulated funds represents an input for a local area. The
economic impact associated with each part of input is due to
the size of the input and the local multiplier.

CHAPTER II
LITERATURE REVIEW
A search of the literature revealed approximately
sixty-seven publications dealing with the economic impact of
community colleges (Andrew 1977). Nearly all of the
relevant models are derived from the major economic impact
categories described by Caffrey and Isaac. Introducing the
Caffrey-Isaac models and some of the other studies in
economic impact constitutes the review of related literature
in this study.
Caff.rey-Isaac (1958) models are the most widely
utilized handbook for economic impact studies. The models
cover three different sectors: the economic impact on local
businesses, the economic impact on local government, and the
economic impact on individuals.
The first sector in Caffrey-Isaac models is a college's
impact on local businesses. The model includes a college's
direct purchases from local businesses either by college
faculty, staff, visitors, or students; the purchases from
local sources by local businesses in support of their
college-related business volume; or, as the model is called,
"second round" purchases, which is what economists call "the
multiplier effect."
14

15
The second sector in Caffrey-Isaac models is local
government college-related revenue and expenses. The local
government revenue comes from taxes on a college's local
purchases, state aid to local governments attributable to
the presence of the college, and other college—related
revenue collected by the local government, such as auto
registration fees from the college staff and students, new
user charges for utilities, fees for licenses and permits
taken out by the college, and assessment charges paid by a
college. The college-related expenses of a local government
are due primarily to students from outside the community
attending the college.
The third sector in Caffrey-Isaac models is the
economic impact on individuals sector. This sector deals
with the number of local jobs attributable to the presence
of a college, the personal income of local individuals from
college-related jobs and business activities, and the
durable goods purchased with income from college-related
jobs and business activities.
The Caffrey-Isaac (1971) models sparked a controversial
argument. For some analysts of economic impact, the models'
complexity and heaviness posed major problems. According to
Bidder (1982) and Ryan (1985), the Caffrey-Isaac (1971)
models contain a total of seventy-eight measurable
variables. This, combined with the forty different models,
have most probably scared off many would-be economic impact

16
analysts. Manning (1975) and Gritz (1983) have accused
Caffrey-Isaac models of unjustified elimination of the
economic impact of part-time students from their models.
The weaknesses of Caffrey-Isaac models have been
attacked by different researchers such as Manning (1975),
Kaltenback (1979), and Gritz (1983). Such attacks were due
to issues such as the difficulty in obtaining the data
required for the models. The required data are very
difficult to obtain and may be beyond reach of the available
resources of many community colleges. Kattenback (1979)
described two reasons for modifying Caffrey-Isaac models:
many of the equations in the models are inappropriate due to
their complexity, and the cost of conducting the models is
too high.
Ryan (1985) modified Caffrey-Isaac models because they
did not utilize the readily available census and United
States Bureau of Labor statistics. The large number of
equations in the models, complicates them, and many of the
equations are inappropriate.
Ryan (1985) assumed that community colleges bring funds
into the economy through tuition and fees, local and state
appropriations, private gifts, and federal grants. Colleges
circulate funds into the economy through expenditures,
salary payments, purchases of goods and services, and
capital construction. The prominent economic status of
colleges is represented by the economic actions they take as

17
employers, consumers of goods and services, investors, and
property owners.
A distinguishing feature of Ryan's model when compared
with the Caffrey-Isaac models is that Ryan's model utilizes
substitutes for the survey and estimate methods used by
Caffrey-Isaac. Ryan's substitutions save a lot of time and
effort in the measurement of economic impact and have made
the measurement much simpler.
Ryan has substituted for different parts of Caffrey-
Isaac models by utilizing publications of Unite States
Bureau of Labor statistics. These standard government
documents were consulted to provide county averages for
income spent on nonhousing and rental items. At the same
time, substitutions have been made for staff and student
surveys.
Studies in Economic Impact
The economic benefits received by communities from
their colleges have been confirmed by many studies
throughout the United States. In Texas, a study was done by
Rafter (1973) about the economic impact from the University
of Texas at Arlington on the city of Arlington. Rafter
applied (Caffrey-Isaac 1971) models and found that the
University of Texas at Arlington had a positive economic
impact on the Arlington business community. Approximately
5.5 percent of Arlington's jobs, and approximately 5 percent
of Arlington's income, were related to the university.

18
Table 2 shows community colleges in the United States
which have conducted economic impact studies. In the State
of Texas no such studies have been done on community
colleges.
Some economic impact studies were done on an individual
college basis. Owings (1977), the Office of Institute
Research Study (1974), Breslin (1979), and Marilyn and Esco
(1978) have chosen community colleges as their research
subjects. But other economic impact studies were conducted
on a statewide basis (Andrew 1977, Bess 1980, Kaltenback
1979, Rafter 1973). The method used by statewide basis
studies to choose their samples was confusing because either
the samples were not selected randomly, or it was not clear
what criteria were used in selecting the samples.
Owings (1977), and the Office of Institute Research
(1974) have reported the economic impact of two small
community colleges on the counties in which they are
located. Owings (1977) reported the economic impact of
1,275 students enrolled at Northwest Alabama State Junior
College. The Office of Institute Research reported the
economic impact of 1,547 full-time students and 1,597 part-
time students enrolled at Burlington Community College.
Owings (1977) concluded that a yearly total of $9.3 million
was added to the county where Northwest College was located,
while approximately $3.2 million was added to the county in
which Burlington Community College was located. The

19
TABLE 2
COLLEGES ECONOMIC IMPACT STUDIES
College State
Alabama State Junior C Alabama Bakersfield C California Bismark C.C North Dakota Brookdale C.C New Jersey Bulks C.C.C Pennsylvania Burlington C.C New Jersey Central Piedmont C.C North Carolina Chemeketa C.C. « • • • • . . Oregon C.C. of Allegheny County Pennsylvania Cuyahoga C.C Ohio Cypress College California Florida Junior C Florida Gainsville Junior C Florida Genessee C.C New York Harrisburg Area C.C Pennsylvania Long Beach C.C California Mercer county C.C New Jersey Metropolitan C.C Missouri Mokawk Valley C.C New York Mount Hood C.C. . . . , . , . . , , . , t , Oregon Onendago C.C New York Rocklan C.C. . . . . . . . . , , . . . New York Spokane C.C ] Washington St. Louis C.C Missouri Thomas Nelson C.C Virginia Valencia C.C Florida William Rainey Harper C Illinois
Source: G. Jeremiah Ryan, "A Short-cut of Estimating Economic Impact, "Community/Junior Colleae Ouarterlv. 9 (1985): 200. * — " *
differences in the value added are due to the differences in
the colleges' locations and sizes.
A study of the economic impact of Trenton State College
by Breslin (1979) described different ways a college could
impact a community. The primary, or direct, economic impact
on a community results from expenditures in the local

20
environment by a college and its faculty, staff, students,
and visitors to the campus. A college's direct impact is
associated with the additional impact represented by the
multiplier effect. The total economic impact of a college
was the result of both direct and multiplier effects.
The Marilyn and Esco (1978) study estimated that the
economic loss to Rochland county caused by a decrease in
enrollment at Rochland Community College of 500 students
would be $1,086,053, and the economic gain from an increase
in enrollment of 500 students would be $1,457,735. The
annual loss to Rochland County if Rochland Community College
did not exist was estimated to be $33,436,252.
Statewide Studies
Andrew and Wellsfry (1977) have measured the economic
impact of the Virginia Community College system on the
Commonwealth of Virginia, using a modified form of Caffrey-
Isaac models. The researchers have matched some economic
indicators to determine whether there was measurable change
in the college system's economy since its development in
1966. The researchers intended to compare the change in the
local economy before and after the establishment of the
college system, and to compare the growth rate of Virginia
with that of the nation. The critical question for such a
study is whether the investment in the community college
system has paid off or not.
21
Andrew and Wellsfry (1977) described three different
expenditures generated as a result of community colleges:
business expenditures, employee expenditures, and personal
expenditures. The three kinds of expenditures are funded
internally and externally. The internal sources of funds
are related to tuition, federal grants, and private gifts.
The external sources of funds are the state and federal
appropriations. Such funding would not be available to
Virginia without the development of community colleges.
The result of Andrew-Wellsfry•s (1977) study indicated
that community colleges give more to communities than they
take. The total economic benefits received by the college's
local area exceed the local area's general tax fund
appropriation, and the business volume generated by the
presence of the colleges exceeds the state's appropriations
for these colleges. Virginia's economy improved subsequent
to the advent of the colleges, and the rate of growth was
greater than that of the nation as a whole.
Linthicum (1979) reported the economic impact of
Maryland s seventeen statewide community colleges. In
serving more than 80,000 students enrolled in credit
programs and thousands more attending noncredit classes, the
seventeen colleges increased the business volume of Maryland
by at least $124 million. Of this, $62 million was in
direct expenditures by the colleges and their staff and
faculty. Another $62 million was from indirect expenditures

22
by local business and individuals in support of their
college-related business volume. Ninety-five percent of the
colleges' staff lived in Maryland, and about 70 percent of
the colleges' purchases and 75 percent of their disposable
income were spent in Maryland.
Bess's (1980) study was conducted to assess the
economic impact of Illinois community colleges upon their
local districts. A sample of six colleges was selected, and
the study examined their local businesses, local
governments, faculty, staff, and students. The study
revealed that community colleges made substantial positive
economic contributions to their districts. Bess found that
some colleges produced a greater economic return than did
others. Some of the factors accounting for these
differences were the percentage of staff living in the
district, the percentage of college funds expended in the
district, and the percentage of students who were enrolled
on a full-time basis.
Ryan (1985) has applied his model for an entire
community college sector in New Jersey. Ryan found the
economic impact of the community college system on the State
of New Jersey to be impressive. The sector contributed over
$800 million to the state's economy and 27,000 full-time
jobs.

CHAPTER III
METHODOLOGY
The theoretical discussion indicates that community
colleges have an economic impact on their local economies
but does not indicate what the local economic impact would
be for a reduction in statewide funding of state community
colleges. The State of Texas may cut its financial
appropriations to community colleges by varying rates. Such
state actions affect community colleges' external financial
sources and consequently their ability to spend and to
employ.
Research Model
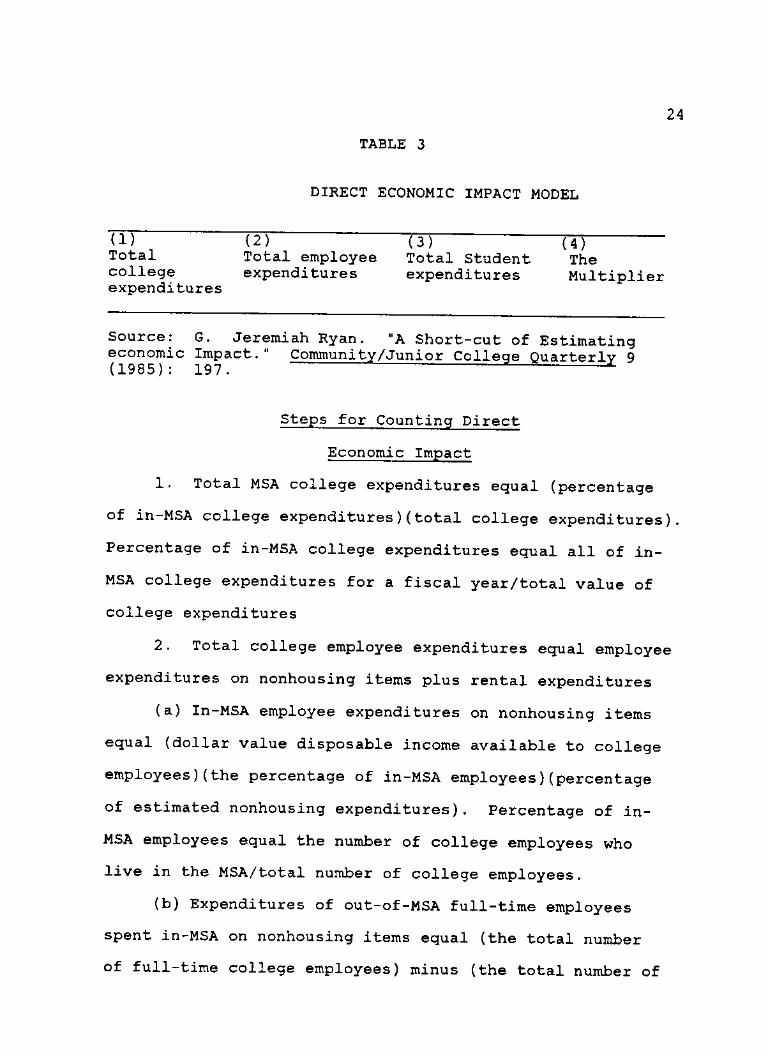
The Direct Economic Impact Model DEIM is used in this
study. It is possible to divide the (DEIM) into four main
parts. These parts are: the total college expenditures in
the Metropolitan Statistical Area (MSA) spent by a college,
the total employee expenditures in the MSA, the total
student expenditures in the MSA, and the multiplier. The
model's four parts are sufficient to include all of the
community college's economic impact factors, (see Table 3)
23
24
TABLE 3
DIRECT ECONOMIC IMPACT MODEL
(!) (2) (3) (4) Total Total employee Total Student The college expenditures expenditures Multiplier expenditures
Source: G. Jeremiah Ryan. "A Short-cut of Estimating economic Impact." Community/Junior Colleae Ouarterlv 9 (1985): 197.
Steps for Counting Direct
Economic Impact
1. Total MSA college expenditures equal (percentage
of in-MSA college expenditures)(total college expenditures).
Percentage of in-MSA college expenditures equal all of in-
MSA college expenditures for a fiscal year/total value of
college expenditures
2. Total college employee expenditures equal employee
expenditures on nonhousing items plus rental expenditures
(a) In-MSA employee expenditures on nonhousing items
equal (dollar value disposable income available to college
employees)(the percentage of in-MSA employees)(percentage
of estimated nonhousing expenditures). Percentage of in-
MSA employees equal the number of college employees who
live in the MSA/total number of college employees.
(b) Expenditures of out-of-MSA full-time employees
spent in-MSA on nonhousing items equal (the total number
of full-time college employees) minus (the total number of

25
full-time college employees who live in-MSA)(average
nonhousing expenditures). The average nonhousing
expenditures from two income categories of $16,735 and
$21,908, as reported by Consumer Expenditures Survey, were
used to estimate nonhousing expenditures per employee.
The average nonhousing expenditures per employee was estimated
to be $13,513. The percentage of nonhousing expenditures
was computed by dividing $13,513 by the average of the
two income categories.
(c) Rental expenditures, by full-time college staff
equal (total full-time employees living in-MSA) (percentage
who rent)(MSA rent)(12). The rental rates per Metropolitan
Statistical Area (MSA) were obtained from the 1980 Census
of Housing in Texas. An adjustment for inflation rates was
achieved by referring to the 1987 CPI Detailed Report.
3. Total student expenditures equal total expenditures
by full-time students plus total expenditures by part-time
students. Total expenditures by full-time students equal
(total number of full-time students)(average annual
college-related expenditures for full-time students).
Total expenditures by part-time students were counted by
equating two part-time students with one full-time students.
4. Total estimated economic impact equal (total
expenditures by the college) plus (total employee
expenditures) plus (total student expenditures) multiplied
by the (multiplier effect).

26
The first part of the Direct Economic Impact Model
consisted of total in-MSA college expenditures. This was
computed by multiplying the percentage of in-MSA college
expenditures by total college expenditures. Measuring the
percentage of college expenditures in the MSA was done by
dividing a total value of the last 200 payments which were
paid for college expenditures during the 1986 fiscal year by
a total value of college expenditures. College expenditures
data excluded salaries, internal items and transfers, and
taxes.
The second part that has been considered in the model
consisted of the total college employee expenditures in the
Metropolitan Statistical Area (MSA), which was composed of
the disposable income of in-MSA employees spent in the MSA
on nonhousing items, the expenditures of out-of-MSA full-
time employees on nonhousing items in the MSA, and the
rental expenditures by full-time college employees living in
the MSA.
The in-MSA nonhousing expenditures were computed by
multiplying the disposable income available to college
employees by the percentage of in-MSA college employees, and
by the percentage of nonhousing expenditures. The
percentage of in-MSA full-time college employees was
measured by dividing the number of full-time college
employees who lived in the MSA by the total number of full-
time college employees. The disposable income was the money

27
paid directly to staff and did not include taxes and
retirement.
Measurement of the out-of-MSA full-time employee
expenditures for nonhousing items was made by deducting the
total number of full-time college employees who were living
in the MSA from the total number of full-time college
employees and then multiplying the balance by the average
in-MSA nonhousing expenditures. The rental expenditures by
college staff living in MSA was measured by multiplying the
"total full-time employees who were living in-MSA" by
"average percentage who rent" and multiplying the product by
the "average mean rent." The product was multiplied by
twelve for the annual basis adjustment.
The third part of the model consisted of the total
student expenditures, composed of two types: total
expenditures by full-time students, and total expenditures
by part-time students. The total expenditures of full-time
students were a function of the total number of full-time
students multiplied by the average annual college-related
expenditures for full-time students. Two part-time students
were equivalent to one full-time student.
The Multiplier
The fourth part of the Direct Economic Impact Model
(DEIM) was the multiplier. Multiplier measurement was not
included in Ryan's (1985) DEIM. A county multiplier
consists of a relationship between the export, service and

28
total economic activities of a local community. Dividing
the community's total workers by the community's basic jobs
was the recommended method for multiplier measurement
(Palmer, Thompson, and Kang 1958). County's multiplier
equal total county employment/county basic employment.
The base theory concept begins with the premise that exogenous expenditures are the sole source of growth in a regional economy. Employment and income in basic industries which are generated through these exogenous expenditures lead to an expansion in the support activities of the nonbasic sector. The base multiplier indicates the total change in economic activity due to an initial change in exogenous expenditures in the basic industries (Milon 1982, 13).
Kang recommended that the amount of employment in a county
be used as a unit of measurement for a multiplier (Kang
1958). The volume of employment reflected the general
picture of economic activities. A change in income caused
the volume of effective demand to change and in turn
affected the level of productive activities.
Employment, however, does not possess all the qualifications to serve as a perfect unit of measurement. There are some sectors of economic activity which do not lend themselves to quantification in terms of employment. Such sectors are represented by the flow of money capital and the return on it, or financial transactions across the community border line (Kang 1958, 18).
The first task in measuring a community multiplier was to
divide community employment between basic or export and
nonbasic or service activities (Weiss and Gooding 1966).
Basic employment would be expected to be heaviest in the
industrial activities, and sustained by external payments
(Thomson 1958). A community can export when its labor can

29
produce not only more than it consumes but also a surplus
value of what such a community can consume.
The method used to divide community employment between
export and service activities can significantly affect the
ultimate multiplier result (Weiss and Gooding 1966). The
classification of most of the industry groups was determined
by the use of Location Quotients. In the literature some
activities like tourism and defense were considered to be
exporters of goods and services.
Location Quotients (LQ) have been used to measure the
relative concentration of employment in a given industry in
one county compared with the State of Texas. The LQ for an
industry (i) in a given county was defined as (Weiss and
Gooding 1966):
LQi = ei/et Ei/Et ei = county industry (i) employment.
et = county total employment. Ei = Texas industry (i) employment,
excluding ei. Et = Texas total employment,
excluding et.
A Location Quotient greater or equal to 1.00 indicated
that a county economy has "extra" workers in that particular
industry, and such a county produced a "surplus" of goods and
services for export (Weiss and Gooding 1966). A LQ less than
1.00 was interpreted to mean that a county economy has no
"extra" workers in a particular industry, and no "surplus" of
goods and services have been produced for export.

30
Location Quotient assumptions were discussed by-
researchers such as Terry (1958), Isard (1950), and Isserman
(1980). Such assumptions included the following: community
patterns of use and habits of consumption were assumed to be
the same as the State of Texas as a whole, and average labor
productivities were assumed to be equal in the two areas.
Location Quotients were used mainly to identify
industries with significant export orientation. Weiss and
Gooding (1966) confirmed that Location Quotients were fairly
reliable in indicating export industries in local areas. But
in a step ahead, Milon and others (1982) confirmed that the
Location Quotients lead to a reasonable estimate for a
multiplier.
Milon, Walter, Mulkey, and Ellerbrock (1982) described
that the precision gained through the use of Location
Quotients to determine a multiplier depends on the level of
sectoral data disaggregation and the validity of assumptions
necessary to implement the Location Quotients approach. The
level of disaggregation depends upon data availability.
Segregating some economic activities which share specific
common characteristics may facilitate drawing a line between
basic and service industries. The methodology of segregation
takes into consideration the substitutability of different
economic activities for each other and the availability of
data about each economic activity.

31
The agriculture sector was segregated as an individual
sector. Dividing the agriculture sector into different
agricultural crops was not possible because of a lack of
available data. For most counties under study, County
Business Patterns, a publication of the United States Bureau
of Labor Statistics, shows the agriculture data for the
sector as a whole.
In the mining sector, the total value of non-fuel
minerals produced in Texas in 1983 was $1.57 billion (Ohi and
Mcbride 1985). The mining sector in this study has been
segregated into two parts: nonfuel minerals and the oil
sector.
The manufacturing sector has been segregated into
several parts: paper products, stone and glass products,
metal industries, fabricated metal products, machinery,
transportation equipment, and miscellaneous manufacturing
industries. Most of the manufacturing sector was expected to
be export employment.
The transportation-and-other-public-utilities sector
consisted of the following components: local transit,
trucking and warehousing, water transportation, transport-
ation services, communication, electricity and gas, and sani-
tary services. Employment in the railroad industry,
trucking, and warehousing was expected to be export
employment.

32
The wholesale trade sector included two components:
wholesale trade of durable goods, and wholesale trade of
nondurable goods. Petroleum bulk stations were included
under nondurable trade.
The retail trade sector has been segregated into
building materials, general merchandise, food, automotive
dealers and service, apparel and accessory stores, furniture
stores, eating and drinking establishments, and miscellaneous
retail. Food, and eating and drinking establishments were
expected to be a service employment.
The finance, insurance, and real estate sector was
composed of banking, credit agencies other than banks,
insurance agents and broker services, real estate and holding
institutions, and other investment offices. Most of the
services in this sector were expected to be non-export
industries.
The services sector represents the following activities:
hotels and other lodging, personnel services, business
services, auto repair services, miscellaneous repair
services, amusement services, health services, legal
services, social services, membership organizations, and
miscellaneous services. The hotel industry was expected to
be an export industry.
Local, state, and federal governments were the last
sector to be considered in measuring a county's multiplier.
State and federal employee in the county were expected to be

33
a basic industry, because they receive their incomes from
outside the county. Community college employees were part of
the state employees total.
Sources of Data
There are two major types of data: primary data and
secondary data. The primary data were obtained through
questionnaires sent to thirteen community colleges included
in Appendix A. Three letters and one telephone call yielded
eight responses. Two responses were received to the first
letter, another two responses were received to the second
letter, and the last four responses were received as a result
of the third letter and telephone calls. Table 4 contains
the suggested sources of primary data, even though these
sources may differ from one college to another.
The reliability of the primary data was a function of
each college s recorded information and each college's
understanding of the questionnaires. Table 5 presents the
sources of the secondary data.

34
TABLE 4
Variable
SOURCES OF PRIMARY DATA
Sources
(1) Total college in-MSA expenditures for 1986 fiscal year
(2) *Total college expenditures for 1986 fiscal year
(3) Total student activity expenditures for 1986 fiscal year
(4) **Disposable income avail-able for college employees
(5) Number of full-time college employees living in-MSA
(6) Total number of full-time college employees
(7) Total number of full-time students
(8) Average annual college related expenditures for full-time students
(9) Total number of part-time students
(10) Average annual college related expenditures of part-time students
College business records
1986 ended year audited budget
Student Activity Office
College business records
Address information on payroll or college directory
Payroll or college directory
Registrar's Office
Financial Aid Office
Registrar's Office
Financial Aid Office
*Total college expenditures exclude salary, internal items, and transfers and taxes.
**The figure is the money paid directly to staff and did not include taxes or retirement.

35
TABLE 5
SOURCES OF SECONDARY DATA
Variable Sources
(1) The percentage of Consumer Expend. Survey estimated nonhousing expenditures
(2) Average nonhousing Consumer Expend. Survey expenditures
(3) Percentage who Census of Housing rent
(4) County mean rent Census of Housing
The average of nonhousing expenditures, $13,513, was
reported by Consumer Expenditures Survey under two income
categories: $16,735 and $21,908. The rental rates for
Metropolitan Statistical Areas (MSAs) were obtained from the
1980 Census of Housing in Texas. An adjustment for inflation
was achieved by referring to the 1987 CPI Detailed Report.
The source of information for the percentage of the staff who
rent housing, 39 percent, was the Census of Housing.
State Financial Support--Expected Changes
Texas' financial appropriation to community colleges
enhanced the economic impact on their local areas. This
economic impact may decrease if the State of Texas reduces
its appropriations to community colleges in the future.
Texas' appropriations could be reduced at different rates.
36
Rates of 10 percent, 15 percent, and 20 percent were
arbitrarily chosen as estimates for state appropriations cuts
for this study. Rates of 5 percent and lower were eliminated
because higher rates could give a clearer estimation.
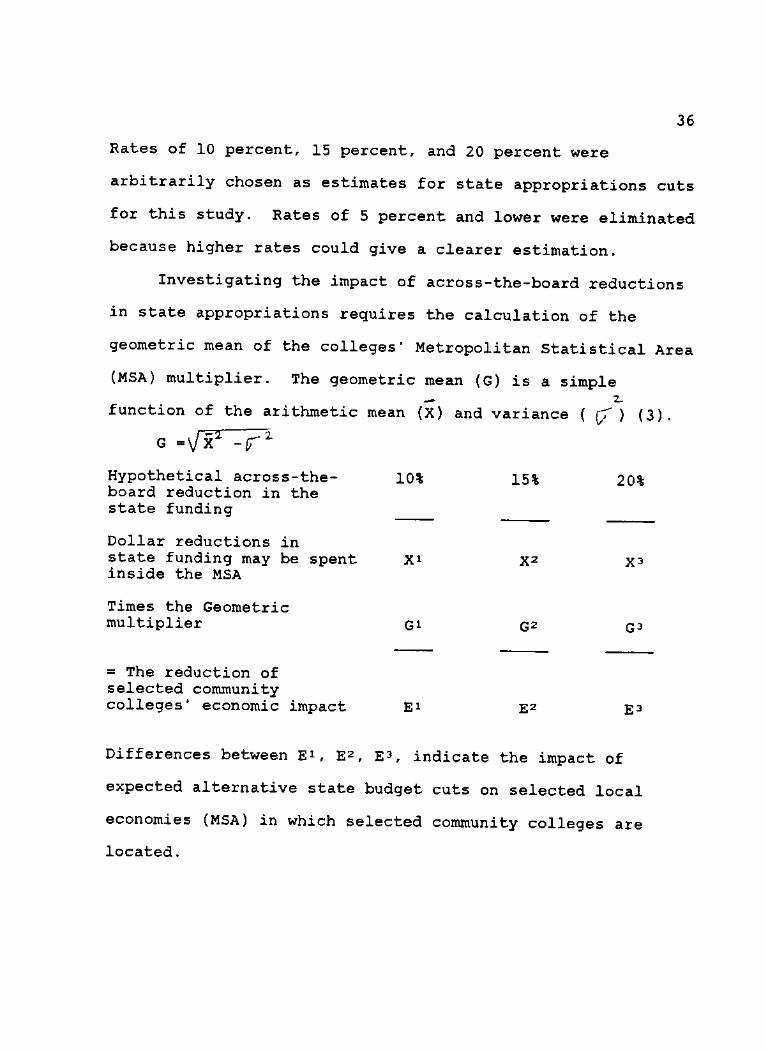
Investigating the impact of across-the-board reductions
in state appropriations requires the calculation of the
geometric mean of the colleges' Metropolitan Statistical Area
(MSA) multiplier. The geometric mean (G) is a simple — 2_
function of the arithmetic mean (X) and variance ( {/" ) (3).
G = \JX2 - f %
Hypothetical across-the- 10% 15% 20% board reduction in the state funding
Dollar reductions in state funding may be spent X* X 2 X 3
inside the MSA
Times the Geometric multiplier G* G2
G3
= The reduction of selected community colleges' economic impact E1 E2
E3
Differences between E*, E2, E3, indicate the impact of
expected alternative state budget cuts on selected local
economies (MSA) in which selected community colleges are
located.

CHAPTER IV
THE ECONOMIC ANALYSIS
The main objectives of this Chapter are to describe the
economic impact of the community colleges selected for this
study, and to assess the impact of alternative state budget
cuts upon the collegs1 economic impact. The methodology
discussed in Chapter III for the Direct Economic Impact
Model, and the economic multiplier estimates, is applied in
this Chapter.
Amarillo College Economic Impact
In 1986, the total economic impact of Amarillo
Community College on the Amarillo Metropolitan Statistical
Area (MSA), which includes Potter and Randall counties, was
$41,741,256. This amount represents 2.1 percent of the
MSA's $1,977,832,000 income for 1986, as reported in the
1987 Texas Almanac.
The college hired 364 full-time and 512 part-time
employees, which reflect the direct employment impact of the
college. The presence of the college enriched the local
economic sectors by creating 453 job opportunities due to
the effect of the economic multiplier. Table 6 contains
Amarillo College's economic impact components.
Amarillo College's economic impact, as reported in
37

38
Table 6, was based upon (1) the college's total expenditures
TABLE 6
AMARILLO COLLEGE ECONOMIC IMPACT
Economic Components Value
Total college expenditures $8,397,618
Total employee expenditures + 6,235,300
Total student expenditures 14,354,065
T 0 T A L $28,986,983
Multiplied by the economic multiplier 1.44
= Amarillo College economic impact $41,741,256
of $8,397,618 in the Amarillo Metropolitan Statistical Area
(MSA); (2) the total employee expenditures of $6,235,300, (3)
the total student expenditures of $14,354,065, and (4) the
economic multiplier, which was 1.44. The product of the sum
of the first three parts and the fourth part, the economic
multiplier, constitutes the total economic impact of the
college.
Amarillo College records show that college expenditures
in the Amarillo Metropolitan Statistical Area (MSA) were
$8,397,618 during the 1985-86 academic year. Such
expenditures were usually made to finance the college's

39
purchases and expenditures from the MSA area.
The 620 equivalent full-time college employees spent
$5,353,214 on nonhousing items and $859,323 on rent in the
Amarillo Metropolitan Statistical Area (MSA). Average
annual nonhousing expenditures were estimated at $13,513
yearly by a Consumer Expenditures Survey, and average
monthly rent expenditures were estimated at $304.
Amarillo College's student expenditures represnted its
largest economic impact component. Approximately 1,400
full-time students spent $6,918,331 during the 1985-86
academic year. Approximately 3,500 part-time students spent
$7,435,734 during the same period. The semester average for
full-time student expenditures at Texas community colleges
of $2,037, excluding tuition and fees, was used to determine
student expenditures for each college.
The Amarillo Metropolitan Statistical Area's (MSA)
economic multiplier of 1.44 was estimated from the
employment data for Potter and Randall counties for 1984.
This multiplier means that for every one dollar injected
into the Amarillo economy, another $.44 is generated through
increased earnings, sales, and construction activity in the
area.
Potter County's economic multiplier (1.53) is the
result of 63,534 workers divided into 42,280 basic jobs and
21,254 service jobs (see Appendix). The allocation of basic
and service workers was based on the methodology described

40
in Chapter III. The agriculture sector was responsible for
creating 384 basic jobs due to industries in the sector such
as beef cattle, wheat, sorghums, and, crops. The
manufacturing sector was made up of 9,032 basic jobs in food
production, apparel, printing, stone, metal, manufacturing
administrative, and petroleum production. The MSA is a
center for wholesale trade, banking, and contains several
basic service industries such as auto, health, social and
transportation.
Randall County's 11,381 basic jobs and 3,607 service
jobs determined the county economic multiplier of 1.34.
Basic employment was divided among six county economic
sectors: 290 positions in the agriculture sector, 1,638
jobs in the construction sector, 727 positions in the
manufacturing sector, 362 employment in the transportation
sector, 1,483 jobs in the service sector, and 5,457 workers
in the trade sector (see Appendix).
Galveston College Economic Impact
The total economic impact of Galveston College on the
Galveston-Texas City Metropolitan Statistical Area, (MSA)
which includes Galveston county only, was $20,259,358. The
generated economic impact was approximately .80 percent of
the 1986 reported income of $2,287,447,000
Galveston College was responsible for generating 334
job opportunities in the MSA. The directly-generated jobs
consisted of 149 full-time jobs and 65 part-time jobs--which
41
were equivalent to 32 full-time jobs. The indirectly-
generated jobs consisted of 153 job opportunities created in
the local economy as a result of the economic multiplier.
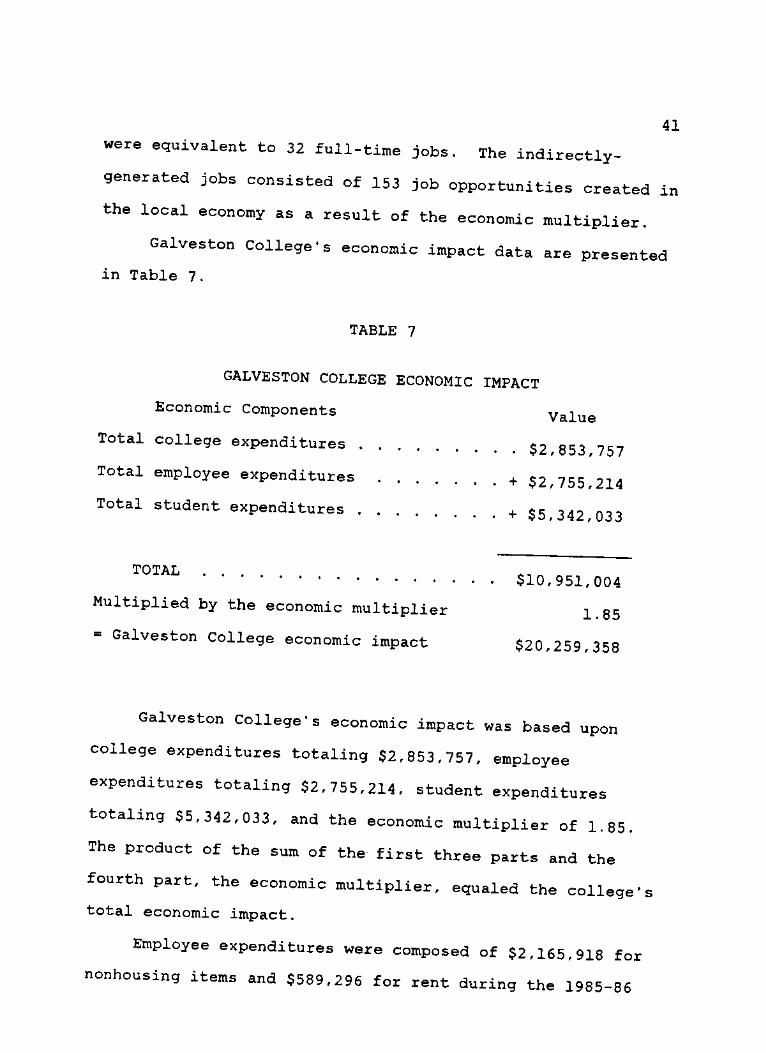
Galveston College's economic impact data are presented
in Table 7.
TABLE 7
GALVESTON COLLEGE ECONOMIC IMPACT
Economic Components Value
Total college expenditures $2,853,757
Total employee expenditures + $2,755 214
Total student expenditures + $5,342,033
T ° T A L $10,951,004
Multiplied by the economic multiplier i. 8 5
Galveston College economic impact $20,259,358
Galveston College's economic impact was based upon
college expenditures totaling $2,853,757, employee
expenditures totaling $2,755,214, student expenditures
totaling $5,342,033, and the economic multiplier of 1.85.
The product of the sum of the first three parts and the
fourth part, the economic multiplier, equaled the college's
total economic impact.
Employee expenditures were composed of $2,165,918 for
nonhousing items and $589,296 for rent during the 1985-86

42
academic year. A total of 487 full-time students, and more
than 1,200 part-time students spent $1,935,150 and
$3,406,883, respectively.
The Galveston-Texas City MSA's economic multiplier of
1.85 was estimated through the classification of the MSA's
workers into basic and service positions (see Appendix).
The economic analysis of MSA employment revealed that
approximately 39,547 basic workers and 33,338 service
workers were located in the area. The basic jobs were
divided among several economic sectors: 7,159 in rubber,
chemical, and petroleum industries; 4,666 in the
transportation sector; 12,288 by the trade sector, 1,975 in
insurance businesses; 1,348 in hotels; and 873 in social
activities. The Location Quotient ratios discussed in the
previous Chapter were used to identify basic and service
jobs.
Grayson County College Economic Impact
In 1986, the economic impact of Grayson County College
on the Sherman-Denison Metropolitan Statistical Area (MSA),
which includes Grayson County only, was $27,507,524. This
amount represents 3.07 percent of the MSA's 1986 income of
$896,153,000, as reported by the 1986 Texas Almanac. The
college was responsible for the creation of 543 job
opportunities in the MSA. The college itself created 283
jobs and the other 260 jobs were created indirectly in the

43
local economic sectors due to the effect of the economic
multiplier.
Grayson County College's economic impact is
demonstrated in Table III.
TABLE 8
GRAYSON COUNTY COLLEGE ECONOMIC IMPACT
Economic Components Value
Total college expenditures $3,454,764
Total employee expenditures + $3,433,032
Total student expenditures + $8,653,178
T 0 T A L $15,540,974
Multiplied by the economic multiplier 1.77
Grayson County College economic impact $27,507,524
The college's economic impact, as demonstrated in Table
8, was due to several factors. The first factor was total
college expenditures, which was the $3,454,764 paid by the
college to finance its purchases and expenses. The second
factor was total employee expenditures, which were composed
of $3,108,026 paid for nonhousing items, and $363,545 spent
by 283 full-time equivalent employees on rent. The third
factor was student expenditures, which were composed of
$3,950,422 spent annually by 963 full-time students and by
more than 2000 part-time students.

44
The fourth factor used to determine the economic impact
of Grayson College was the Grayson County economic
multiplier of 1.77. The economic analysis used Location
Quotient ratios for the county to classify its workers into
19,550 basic jobs and 14,596 service jobs, (see Appendix).
Basic employment was divided among the following sectors:
1,841 jobs in the manufacturing sector in food production;
4,209 in textile, apparel, lumber, furniture, paper,
leather, stone, fabrics, and metal; 3,230 in electronics
production; and 646 in instruments manufacturing. Grayson
is considered a trade center for North Texas and Southern
Oklahoma, and its retail trade sector captured 5,672 basic
jobs.
The Economic Impact Of Midland College
The total economic impact of Midland College on the
Midland Metropolitan Statistical Area (MSA), which includes
Midland county only, was $38,322,594. This amount
represents approximately 3 percent of the MSA's reported
1986 income of $1,288,353,000. The college was responsible
for the creation of 625 jobs in the Midland MSA economy.
The college itself created 228 full-time and 247 part-time
jobs. Local economic sectors generated 274 positions due to
an increase in businesses which the college brought to the
Midland area. The data presented in Table 9 represent
Midland College's economic impact.
Midland College's economic impact was a function of the

45
following components as reported in Table 9: college
expenditures on local purchases and expenditures totaling
$7,409,276, employee expenditures totaling $3,520,556,
student expenditures totaling $9,673,713, and the MSA's
TABLE 9
MIDLAND COLLEGE ECONOMIC IMPACT
Economic Components Value
Total college expenditures $7,409,276
Total employee expenditures + $3,520,556
Total student expenditures $9,673,713
T 0 T A L $20,603,545
Multiplied by the economic multiplier 1.86
= Midland College economic impact $38,322,594
economic multiplier of 1.86. The total expenditures of the
351 equivalent full-time employees consisted of $2,971,901
for nonhousing items and $548,655 for rent. The 874 full-
time students spent $3,295,866 for living expenses,
excluding tuition and fees, and the more than 2,500 part-
time students spent $6,377,847 in the Midland Metropolitan
Statistical Area (MSA).
Economic analysis of the Midland MSA indicated that its
1.86 economic multiplier was a function of 29,214 basic and
24,394 service jobs. The calculated Location Quotients
indicated that most of the MSA's basic jobs (see Appendix)

46
were concentrated in the following economic sectors: 12,291
in oil and gas, 1,636 in manufacturing, 2,100 in gas
services and pipeline industries, 3,018 in the trade sector,
2,527 in the finance sector, and 5,701 in the service
sector.
Odessa College Economic Impact
The total economic impact of Odessa College on the
Odessa Metropolitan Statistical Area (MSA), which includes
Ector county only, was $33,318,478. This amount represents
approximately 2.3 percent of the MSA's reported 1986 income
$1'439,774,000. Odessa college was responsible for
creating 1,150 equivalent full-time jobs in the Odessa
Metropolitan Statistical Area (MSA). The college generated
330 full-time and 760 part-time jobs directly, and local
economic sectors created 440 jobs due to the multiplier
effect. Data reflecting Odessa College's economic impact
components are presented in Table 10.
Odessa College's economic impact of $33,318,478
consisted of a number of components. The first component
was $4,699,800 paid by the college to finance its purchases
and expenses.
The second component was employee expenditures totaling
$6,671,295, which consisted of $5,684,423 in employee
nonhousing expenditures and $986,872 spent on rent by 283
full-time equivalent employees. The third component was
student expenditures totaling $9,195,867. This component

47
was composed of $5,489,036 annually in expenditures by the
1,300 full-time students in the Odessa MSA, and of
TABLE 10
ODESSA COLLEGE ECONOMIC IMPACT
Economic Components Value
Total college expenditures $4,699,800
Total employee expenditures + $6,671,295
Total student expenditures + $9,195,867
T 0 T A L $20,566,962
Multiplied by the economic multiplier 1.62
= Odessa College economic impact $33,318,478
$5,599,713 annually in expenditures by the 2,400 part-time
students.
An Ector county economic analysis indicated that the
31,034 basic and 18,320 service jobs determined the county's
economic multiplier of 1.62 (see Appendix). The county's
oil-based economy had 5,077 basic jobs in the oil and gas
sector. The remaining basic positions were distributed
between the following economic sectors: 4,106 in the
construction sector; 4,418 in the manufacturing sector, such
as fabric, machinery, rubber, and chemicals; 1,404 in the
transportation sector; 13,037 in the trade; and 1,918 in the
services sector.

48
Texarkana Community College
Economic Impact
The total economic impact of Texarkana Community
College on the Texarkana Metropolitan Statistical Area
(MSA), which includes Bowie county only, was $33,367,491.
This amount represents 5.2 percent of the Texarkana MSA's
income. Texarkana Community College generated 608
employment opportunities in the MSA. The college itself
hired 226 full-time and 225 part-time employees, and,
indirectly, the college increased the local economy by 272
jobs, due to the effect of the economic multiplier. Table
11 represents Texarkana Community College's economic impact
components. Texarkana Community College economic impact, as
reported in Table 11, was a function of several factors:
college purchases and expenditures totaled $2,110,210,
employee expenditures totaled $4,979,287, student
expenditures totaled $11,345,581, and the MSA economic
multiplier of 1.81.
Employee expenditures consisted of $4,550,000 for
nonhousing items and $429,287 for rent by 336 equivalent
full-time college employees. Student expenditures consisted
of $7,638,750 for 1,950 full-time students, and $3,706,831
for 1,348 part-time students in the 1985-86 academic year.
Economic analysis of the Texarkana Metropolitan Area
(MSA) indicated the area economic multiplier at 1.81. The
economic analysis used Location Quotient ratios to classify

49
the MSA's labor force into 17,453 basic and 13,803 service
workers (see Appendix).
TABLE 11
TEXARKANA COMMUNITY COLLEGE ECONOMIC IMPACT
Economic Components Valu
Total college expenditures $2,110,210
Total employee expenditures + $4,979,287
Total student expenditures + $11,345,581
T 0 T A L $18,435,078
Multiplied by the economic multiplier 1.81
= Texarkana Comm. College Economic Impact $33,367,491
Federal employment is the largest category of basic
workers in Bowie county with 7,346 positions. The rest of
the basic jobs are located in the following sectors: 448 in
food manufacturing, 669 in lumber manufacturing, 1,827 in
fabric manufacturing, 729 in transportation services, 3,448
in the trade sector, and 3,051 in the services sector.
Temple Junior College Economic Impact
In 1986, the economic impact of Temple Junior College
on the Killeen-Temple Metropolitan Statistical Area (MSA)
which includes Bell and Coryell counties was $17,044,317.
This amount represents .88 percent of the MSA's reported
1986 income of $1,931,715,000.

50
Employment in the MSA was affected both directly and
indirectly by the college. Directly, the college initiated
169 job opportunities. Indirectly 102 jobs were created in
the MSA's economic sector due to the effect of the economic
multiplier.
Data presented in Table 12 represent the economic
impact of Temple Junior College.
TABLE 12
TEMPLE JUNIOR COLLEGE ECONOMIC IMPACT
Econmic Components Value
Total college expenditures $1,779,054
Total employee expenditures + $2,054,107
Total student expenditures + $6,819,537
TOTAL $10,652,698
Multiplied by the economic multiplier 1.60
= Temple Junior college economic Impact . . . $17,044,317
Temple Junior College's economic impact, as illustrated
in Table 12, was a function of different factors: college
expenditures on purchases and expenses totaled $1,779,054;
employee expenditures totaled $2,054,107; and total student
expenditures were $6,819,537. The MSA economic multiplier
1.60. College employee expenditures were composed of
$1,822,367 for nonhousing items and $231,740 for rent. The
student expenditures were the largest component of the

51
college's economic impact. The 894 full-time students spent
$3,687,649, and the 1,351 part-time students spent
$3,131,888 annually on living expenses, excluding tuition
and fees.
The Killeen-Temple Metropolitan Statistical Area's
(MSA) estimated economic multiplier of 1.60 was a function
of basic and service workers for both Bell and Coryell
counties (see Appendix). Economic analysis of the counties'
labor forces indicated that Bell county's 37,153 basic jobs
and 21,150 service jobs determined the county economic
multiplier at 1.59. The manufacturing sector captured 6,451
basic positions, located in lumber, furniture, paper, stone,
rubber, fabrics, and miscellaneous production. Other basic
jobs were centered in the following economic sectors:
construction 3,731, transportation 487, trade 12,053,
services 6,013, and government 8,407.
Coryell County's economic analysis categorized its
labor force into 4,692 basic and 2,764 service workers. The
analysis shows that the county was poor in manufacturing,
with only 398 basic jobs. The government sector provided
most of its basic positions with 2,242. The rest of the
county's basic jobs were captured by the trade and finance
sectors, with 1,315 and 149, respectively.
Tyler Junior College Economic Impact
In 1986, the economic impact of Tyler Junior College on
the Tyler Metropolitan Statistical Area (MSA), which

52
includes Smith County only, was $83,384,542. Such an
economic impact represents approximately 5.6 percent of the
MSA's $1,482,102,000 reported income in 1986. The college
was responsible for creating 525 equivalent full-time
positions: 273 jobs were directly related to the college's
hiring, and 252 jobs were created by the local economic
sectors due to the economic multiplier effect. The local
economy expanded its employments as a result of the economic
advantages brought by the college.
The data presented in Table 13 display Tyler Junior
College's economic impact.
TABLE 13
TYLER JUNIOR COLLEGE ECONOMIC IMPACT
Economic Components Value
Total college expenditures $16,571,686
Total employee expenditures + $6,636,464
Total student expenditures + $20,221,299
TOTAL $43,429,449
Multiplied by the economic multiplier 1.92
= Tyler Junior College economic impact $83,384,542
Tyler Junior College's economic impact, as seen in
Table 13, was a function of different factors: the

53
college's expenditures of $16,571,686 on purchases and
expenses from the local MSA; the employee expenditures of
$6,636,464; the student expenditures of $20,221,299; and the
MSA's economic multiplier of 1.92. The college employee
expenditures were composed of $6,237,841 spent on nonhousing
items and $398,623 spent on rent. A total of 3,226 full-
time students spent $13,187,538 in the academic year
1985-86. Part-time students spent $7,033,761 during the
same period.
The economic analysis of the Tyler Metropolitan
Statistical Area (MSA) computed the economic multiplier at
1.92. The analysis categorized the local labor force into
basic and service workers. The MSA's 32,901 basic jobs and
26,565 service jobs were determined the economic multiplier
(see Appendix).
Approximately 26 percent of the MSA's basic workers
were concentrated in the manufacturing sector, such as
furniture, paper, metal, machinery, and rubber. The Tyler
MSA is known for producing building materials, aircraft
parts, and consumer electronics. The rest of the basic
workers are captured by the following economic sectors:
mining and oil with 2,863, transportation sector with 1,583,
trade with 6,879, finance with 1,715, and service with
8,998.

54
Texas Financial Appropriations and
the Assumed Budget Cuts
The State of Texas' financial appropriations for
selected community colleges are usually used to finance
portion of their expenses regardless of whether such
expenses are in-MSA or out-of-MSA. The data displayed in
Table 14 represent the financial appropriations for the
eight selected community colleges represented in this study.
TABLE 14
College
FINANCIAL APPROPRIATION 1985-86
Financial Appropriation
Amarillo College $9,303,804
Galveston College . . . . 2,902,547
Grayson County College . . . 5,369,021
Midland College . 4,827,688
Odessa College . 6,751,939
Temple Junior College . . . 3,545,244
Texarkana Comm. College . . 6,261,077
Tyler Junior College . . . 10,273,516
TOTAL $49,234,836
Source: Dallas County Community Colleges District

55
On the average, the estimated amount of the state
appropriations used to finance in-the-Metropolitan-
Statistical-Area (MSA) colleges' expenses and salaries is
74.4 percent. Therefore, 25.6 percent of the appropriations
for expenses and salaries were spent outside of the various
MSAs. The data displayed in Table 15 represent the MSAs' dollar
loss as a result of a 10 percent state appropriation cut.
TABLE 15
MSA DOLLAR LOSS FROM A 10 PERCENT CUT
MSA
Appropriation Multiplied Total
Loss from a 10 By The MSA MSA
MSA Percent Cut Multiplier Dollar Loss
Amarillo $692,203 1.44 $0,996,772
Galveson-Tx-•city 215,950
IT)
OO
rH 399,507
Sherman-Denison 399,455 1.77 707,035
Midland 359,180 1.86 668,075
Odessa 502,344 1.62 813,797
Killeen-Temple 263,766 1.60 422,026
Texarkana 465,824 1.81 843,141
Tyler 764,350 1.92 1,467,552
TOTAL $3,663,072 $6,317,905

56
An examination of the data in Table 15 shows the
consequences of the alternative state budget cuts. An MSA
will bear 74.4 percent of the cuts in state appropriations
to a community college located in that MSA. Every one
dollar cut in appropriations to a community college means a
loss of $.744 of that dollar to the MSA. In aggregate, the
MSAs direct loss, without including the multiplier effect,
will be $3,663,072 if the state reduces its appropriations
by 10 percent. The MSAs' total loss, including the effect
of the economic multiplier, will be $6,317,905.
The dollar loss of the selected Metropolitan
Statistical Areas (MSAs) if the state reduces its
appropriations by 15 percent is shown in Table 16. The
selected MSAs will lose $9,476,860 in income if the state
reduces its appropriations by 15 percent, as demonstrated in
Table 16. Each MSA's total loss is a function of the loss
in a college's expenditures and the MSA's economic
multiplier.
An examination of the data in Table 17 shows the dollar
loss of selected Metropolitan Statistical Areas (MSAs) if
the state reduces its appropriations by 20 percent.

57
TABLE 16
MSA DOLLAR LOSS FROM A 15 PERCENT CUT
MSA
Appropriation Multiplied Total
Loss from a 15 By the MSA MSA
MSA Percent Cut Multiplier Dollar Loss
Amarillo $1,038,305 1.44 $1,495,159
Galveson-Tx-city 323,924 1.85 599,259
Sherman-Denison 599,183 1.77 1,060,554
Midland 538,770 1.86 1,002,112
Odessa 753,516 1.62 1,220,696
Killeen-Temple 395,650 1.60 633,040
Texarkana 698,737 1.81 1,264,714
Tyler 1,146,524 1.92 2,201,326
TOTAL $5,494,609 $9,476,860
Examination of the data in Table 17 reveals that
a state appropriation cut of 20 percent will cause a
loss of $12,635,811 to the selected MSAs' local economies.
Tyler Metropolitan Statistical Area will lose more than
others, while Galveston-Texas-City will lose less. The
difference in state appropriations and the difference in MSA

58
TABLE 17
MSA DOLLAR LOSS FROM A 20 PERCENT CUTS
MSA
MSA
Appropriation Multiplied
Loss from a 20 By the MSA
Percent Cut Multiplier
Total
MSA
Dollar Loss
Amarillo $1,384,406 1. 44 $1,993,545
Galveson-Tx-city 431,899 1. 85 799,013
Sherman-Denison 798,910 1. 77 1,414,071
Midland 718,360 1. 86 1,336,150
Odessa 1,004,689 1. 62 1,627,596
Killeen-Temple 527,532 1. 60 844,051
Texarkana 931,648 1. 81 1,686,283
Tyler 1,528,699 1. 92 2,935,102
TOTAL $7,326,143 $12,635,811
economic multipliers are responsible for differences in
losses for each MSA.
Individually the reduction in state appropriations for
each of the selected community colleges will reduce the
income of the MSA local economy in which a college is
located by a function of the loss in a college's
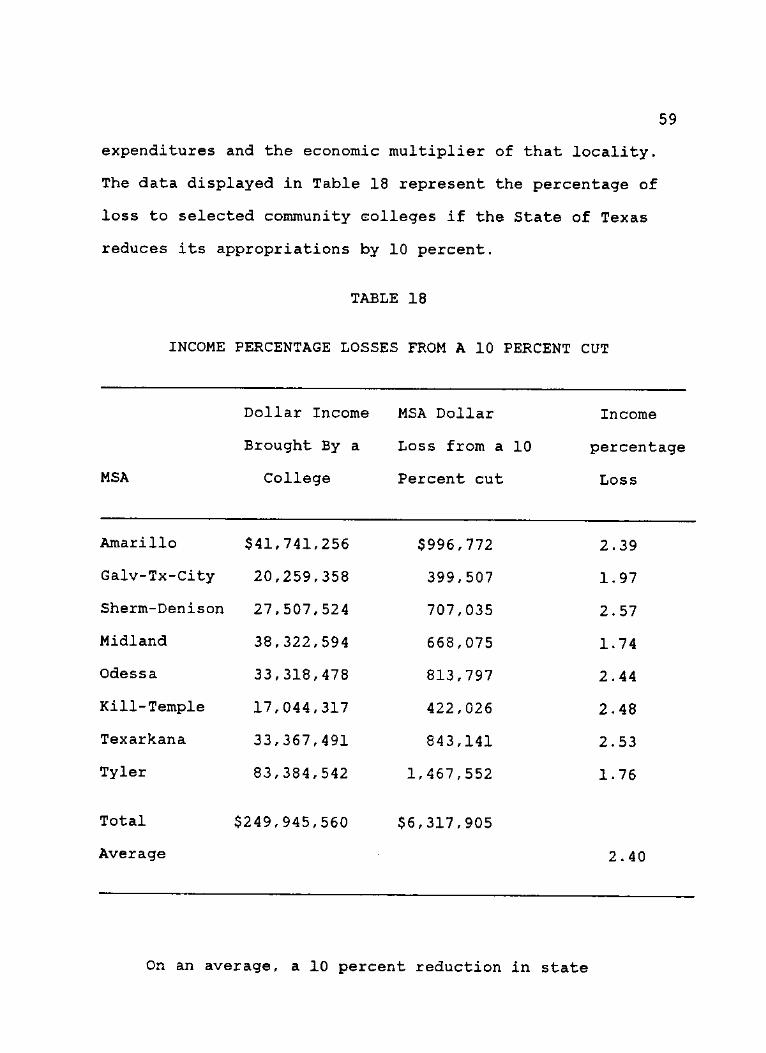
59
expenditures and the economic multiplier of that locality.
The data displayed in Table 18 represent the percentage of
loss to selected community colleges if the State of Texas
reduces its appropriations by 10 percent.
TABLE 18
INCOME PERCENTAGE LOSSES FROM A 10 PERCENT CUT
Dollar Income MSA Dollar Income
Brought By a Loss from a 10 percentage
MSA College Percent cut Loss
Amarillo $41,741,256 $996,772 2.39
Galv-Tx-City 20,259,358 399,507 1.97
Sherm-Denison 27,507,524 707,035 2.57
Midland 38,322,594 668,075 1.74
Odessa 33,318,478 813,797 2.44
Kill-Temple 17,044,317 422,026 2.48
Texarkana 33,367,491 843,141 2.53
Tyler 83,384,542 1,467,552 1.76
Total $249,945,560 $6,317,905
Average 2.40
On an average, a 10 percent reduction in state

60
appropriations will cause a loss of 2.24 percent in the
selected community colleges' economic impact. In other
words, the local economy of the Metropolitan Statistical
Areas (MSAs) will lose 2.24 percent of the income which
community colleges would bring, if the State of Texas
reduces its appropriations by 10 percent.
The percentage of income losses of income to the MSAs
from selected community colleges, if the state
appropriations are reduced by 15 percent, is demonstrated in
Table 19. The local economy of the selected Metropolitan
Statistical Areas (MSAs) will lose 3.35 percent of the
income brought by community colleges if the State of Texas
reduces its appropriations by 15 percent. The data in Table
20 represent the percentage of income losses to the MSAs
from selected community colleges if the state appropriations
are reduced by 20 percent.
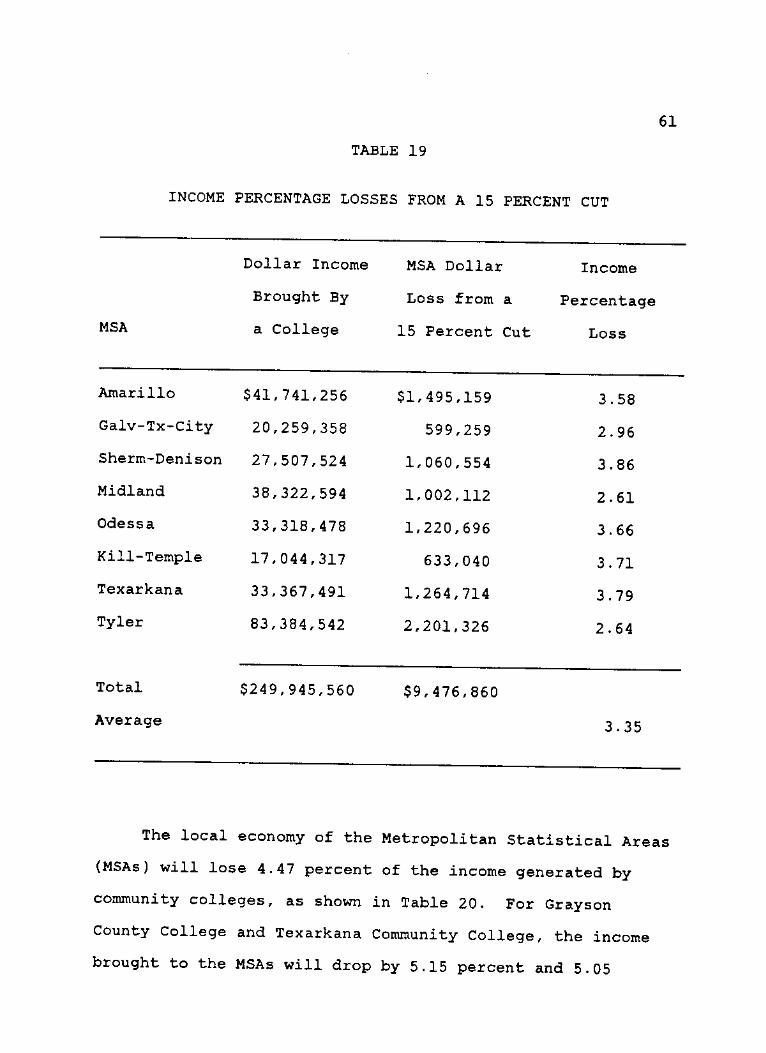
61
TABLE 19
INCOME PERCENTAGE LOSSES FROM A 15 PERCENT CUT
Dollar Income MSA Dollar Income
Brought By Loss from a Percentage
MSA a College 15 Percent Cut Loss
Amarillo $41,741,256 $1,495,159 3.58
Galv-Tx-City 20,259,358 599,259 2.96
Sherm-Denison 27,507,524 1,060,554 3.86
Midland 38,322,594 1,002,112 2.61
Odessa 33,318,478 1,220,696 3.66
Kill-Temple 17,044,317 633,040 3.71
Texarkana 33,367,491 1,264,714 3.79
Tyler 83,384,542 2,201,326 2.64
Total $249,945,560 $9,476,860
Average 3.35
The local economy of the Metropolitan Statistical Areas
(MSAs) will lose 4.47 percent of the income generated by
community colleges, as shown in Table 20. For Grayson
County College and Texarkana Community College, the income
brought to the MSAs will drop by 5.15 percent and 5.05

62
percent under the appropriation cuts of 20 percent. Such a
drop will be the highest between the selected community
colleges.
TABLE 20
INCOME PERCENTAGE LOSSES FROM A 20 PERCENT CUT
Dollar Income MSA Dollar Income
Brought By Loss From a 20 Percentage
MSA a College Percent Cut Loss
Amarillo $41,741,256 $1,993,545 4.78
Galv-Tx-City 20,259,358 799,013 3.94
Sherm-Denison 27,507,524 1,414,071 5.14
Midland 38,322,594 1,336,150 3.49
Odessa 33,318,478 1,627,596 4.88
Kill-Temple 17,044,317 844,051 4.95
Texarkana 33,367,491 1,686,283 5.05
Tyler 83,384,542 2,935,102 3.52
Total $294,945,560 $12,635,811
Average 4.47
Chapter Summary
This Chapter determined the economic impact of eight

63
selected community colleges upon the local economy in which
these colleges are located and assessed the changes in
economic impact which would result from alternative state
budget cuts. Each community college brought income and jobs
to the local economy. The selected community colleges were
responsible for increasing the income of the local economy
of their Metropolitan Statistical Areas (MSAs) by
$294,945,560 and for creating 5,129 jobs.
The reduction in state appropriations to the selected
community colleges will reduce their economic impact by more
than the state cuts. A state appropriation cuts of 10
percent means that selected community colleges will lose
$4,923,484 from their financial sources and that the local
economy of these colleges will lose $6,153,961. A 15
percent reduction in state appropriations means that these
colleges will lose $7,385,225 in financial sources and the
local economy will lose $9,230,943. Under a 20 percent
reduction, these colleges will lose $9,846,967 in financial
sources and the local economy will lose $12,307,920.
Whenever the State of Texas' financial support to the
selected colleges is reduced by one dollar, the local
economy in which these colleges are located will lose an
additional $.25.

CHAPTER V
SUMMARY, FINDINGS, CONCLUSIONS,
AND RECOMMENDATIONS
The purpose of this study was to investigate the economic
impact of reduced appropriations to Texas community colleges
on the Metropolitan Statistical Areas (MSAs) in which these
colleges are located. An introduction to the study is
presented in Chapter I, and Chapter II includes a review of
related literature. A description of research methods is
found in Chapter III, and the results of the study are
presented in Chapter IV. Chapter V contains a summary of the
research findings, research conclusions, and suggestions for
future research.
Summary
The State of Texas' appropriation pattern is changing.
Other social programs are competing for the limited funds
available. In response to this pattern of decreased support,
colleges have increased tuition and fees, reduced
expenditures, and made major efforts to raise private funds.
Such actions, however, are not without costs to the
communities. Further increases in student fees and tuitions
may limit access to higher education. The proposed
expenditure cuts would probably have a detrimental effect upon
64

65
equipment, plant maintenance, and perhaps even the
institutions' human resources.
The local economies in which colleges are located will be
the losers in the event of funding cuts. The major purpose of
this study was to perform an economic base analysis on eight
Metropolitan Statistical Areas (MSAs) in Texas, measuring
their economic impact and the effect of reduced state
appropriations to these colleges.
Colleges circulate funds into the economy through
expenditures, salary payments, purchases of goods and
services, and capital construction. Each component of
circulated funds represents an input for a local economy. The
economic impact associated with each component of input is due
to its size and the local multiplier.
An economic impact study, by its nature, forces the
investigator to view the college from many perspectives. Each
college's impact is computed using its expenditures, which are
composed of the college's expenditures, employee expenditures,
student expenditures, and the economic multiplier of the MSA
in which the college is located. The sum of the first three
parts equals the direct impact, and this sum multiplied by the
economic multiplier is equal to the direct and the indirect
impact.
A number of steps were taken to compute the Direct
Economic Impact Model. Data on college expenditures were
collected from the colleges. The total employee expenditures

66
in the MSA were divided into two major parts: expenditures on
nonhousing items, and rental expenditures. Student
expenditures were composed of full-time and part-time student
expenditures. Every two part-time students were considered to
be equivalent to one full-time student.
The publications of the United States Bureau of Labor
Statistics and the Texas Census of Housing were used to
collect secondary data. The average annual nonhousing
expenditures, the percentage of nonhousing expenditures from
disposable income, and average monthly rents were obtained
through these publications.
The economic multiplier was measured by classifying the
labor forces in each MSA into basic and service workers. Any
economic sector with a Location Quotient of less than 1 was
classified as service labor, and any with a Location Quotient
greater than one was classified as basic employment.
There are approximately sixty-seven publications which
deal with the economic impact of community colleges in the
United States. The economic benefits received by colleges'
communities were confirmed by these studies, but none
investigated the effect of state appropriation cuts on
colleges' economic impact.
As participants in the development of local areas,
community colleges are vulnerable to reductions in state
funding. Across-the-board state financial reductions have
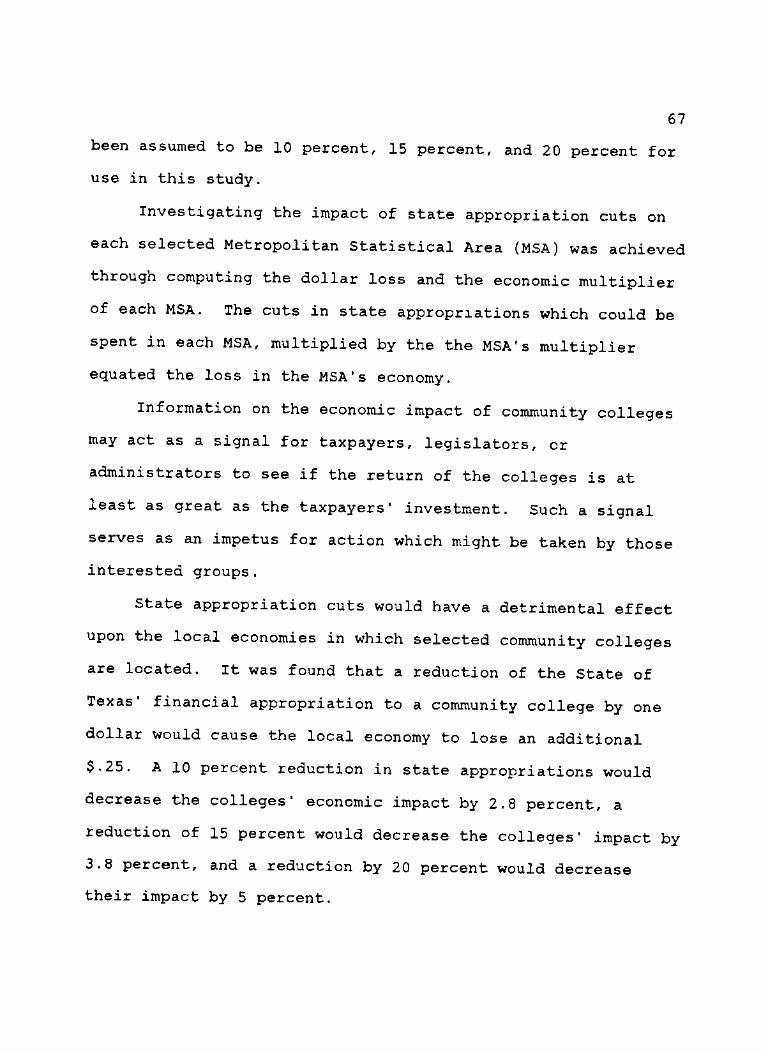
67
been assumed to be 10 percent, 15 percent, and 20 percent for
use in this study.
Investigating the impact of state appropriation cuts on
each selected Metropolitan Statistical Area (MSA) was achieved
through computing the dollar loss and the economic multiplier
of each MSA. The cuts in state appropriations which could be
spent in each MSA, multiplied by the the MSA's multiplier
equated the loss in the MSA's economy.
Information on the economic impact of community colleges
may act as a signal for taxpayers, legislators, or
administrators to see if the return of the colleges is at
least as great as the taxpayers' investment. Such a signal
serves as an impetus for action which might be taken by those
interested groups.
State appropriation cuts would have a detrimental effect
upon the local economies in which selected community colleges
are located. It was found that a reduction of the State of
Texas' financial appropriation to a community college by one
dollar would cause the local economy to lose an additional
$.25. A 10 percent reduction in state appropriations would
decrease the colleges' economic impact by 2.8 percent, a
reduction of 15 percent would decrease the colleges' impact by
3.8 percent, and a reduction by 20 percent would decrease
their impact by 5 percent.
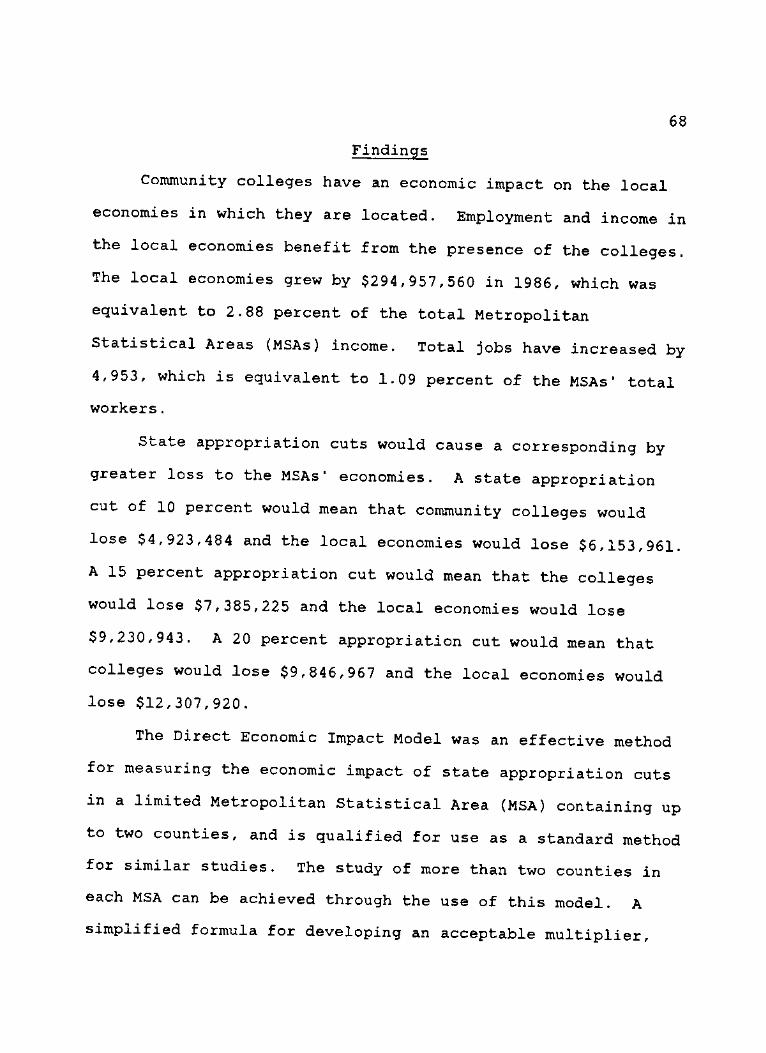
68
Findings
Community colleges have an economic impact on the local
economies in which they are located. Employment and income in
the local economies benefit from the presence of the colleges.
The local economies grew by $294,957,560 in 1986, which was
equivalent to 2.88 percent of the total Metropolitan
Statistical Areas (MSAs) income. Total jobs have increased by
4,953, which is equivalent to 1.09 percent of the MSAs' total
workers.
State appropriation cuts would cause a corresponding by
greater loss to the MSAs' economies. A state appropriation
cut of 10 percent would mean that community colleges would
lose $4,923,484 and the local economies would lose $6,153,961.
A 15 percent appropriation cut would mean that the colleges
would lose $7,385,225 and the local economies would lose
$9,230,943. A 20 percent appropriation cut would mean that
colleges would lose $9,846,967 and the local economies would
lose $12,307,920.
The Direct Economic Impact Model was an effective method
for measuring the economic impact of state appropriation cuts
in a limited Metropolitan Statistical Area (MSA) containing up
to two counties, and is qualified for use as a standard method
for similar studies. The study of more than two counties in
each MSA can be achieved through the use of this model. A
simplified formula for developing an acceptable multiplier,

69
recommended in the past, has been developed through this
study.
Labor force economic analysis using county workers as a
unit of multiplier measurement has been achieved successfully.
The MSAs' economic multiplier values were found to vary from
1.44, in the case of Amarillo's economic multiplier, up to
1.92 in the case of Tyler's economic multiplier.
Conclusions
As a result of the findings of this study, the following
conclusions were reached:
1. Each of the selected community colleges has an economic
impact on the local economy in which it is located, as
represented by increased income and employment.
2. Stable appropriations for these colleges are essential
to maintain the economic benefits for the local economies.
3. State appropriation cuts of 10 percent, 15 percent,
and 20 percent, would reduce the local economies by
$6,153,951, $9,230,943, and $12,307,920, respectively. A 10
percent reduction in state appropriations would cause a
drop of 2.8 percent in the selected colleges' economic
impact, a 15 percent reduction would cause a drop
of 3.55 percent, and a 20 percent reduction would cause
a drop of 4.47 percent.
4. If the State of Texas cuts its appropriations to
community colleges by one dollar, the local economy in
which these colleges are located would lose $1.25.
70
Recommendations
1. Further research should be conducted to determine what
should be done to restore the community colleges' economic
impact if the state should reduce its appropriations.
2. Further research should evaluate alternative sources of
funding for community colleges in order that they might
become more financially independent.
3. Further research on the economic impact of community
colleges should be conducted to include those which are
located in Metropolitan Statistical Areas with more than
two counties and a larger population, such as the Dallas
Metropolitan Statistical Area which includes the Dallas
County Community College District.

APPENDIX A
71
72
N O R T H T E X A S S T A T E U N I V E R S I T Y P . O . B O * 1 3 8 5 7
D E N T O N . T E X A S 7 6 2 0 3 - 3 8 S 7
O R R I C C O F P O L I C Y S T U D I E S
I N H L G H C * E D U C A T I O N
July 1, 1987
Dear :
In May, materials were sent to you relative to a study of the economic impact of your community college on the Metropolitan Statistical Area* (MSA) in which your college is located. Your responses are vital to the study, and your willingness to assist me is greatly appreciated.
Please find enclosed additional copies of the materials sent to you. Will you please complete and return them in the enclosed envelope by July 15?
Please consider me ready to come to your college to assist you if you find it is necessary. If you have already completed and mailed the materials, please disregard this letter. Thank you.
*Your college MSA includes
Sincerely,
Howard W. Smith, Jr. Meadows Honor Professor and Director, Office of Policy
Studies in Higher Education
jm
Enclosures
C O L L c c c o r E D U C A T I O N • A C 8 I 7 . 5 6 5 - 2 9 5 2

N O R T H T E X A S S T A T E U N I V E R S I T Y ^ P O B o x I 3 8 5 7
D E N T O N . T E X A S 7 6 2 0 3 - 3 8 5 7
O F F I C E O F P O L I C Y S T U D I E S
IN H l C M t i E O U C A T I O N
October 5, 1987
Dear :
I appreciate your willingness to examine the attached questionnaire. Not all of the questions are easy to answer, but we hope that you can give us your best figures. We know the procedures vary from institution to institution and do not expect that your responses would be as precise as an audit of some kind. Your best estimate is the best data that we could expect.
( 3 u e s t i o n s about any particular item please call Mr. Abdel Saleh at (817) 387-0331. I am sure that Mr. Saleh will be very anxious to assist you in any way that he can.
Thank you for your assistance in this matter.
Sincerely,
Howard W. Smith, Jr. Professor and Director Office of Policy Studies
in Higher Education
jm
Attachment
C O L L E G E O F E D U C A T I O N • A C 8 1 7 / 5 6 5 - 2 9 5 2

74
INSTITUTIONAL ECONOMIC IMPACT COMPONENTS
Institution:
Name Of Respondent:
If you would like to receive a copy of the results of this project, please so indicate yes no.
Please respond to the following items from records for the academic year beginning September, 1985 and ending August, 1986. Thank you.
1. Total college expenditures including student activities expenditures, and excluding salaries, taxes, and interfund transfer in billings*. $
2. Disposable net pay to all employees excluding taxes and retirement. This figure is the money paid directly to staff.
3. What is the total number of college employees' (a) Full-time
(b) Part-time
4. Using address information on payroll or college directory, what is the number of full-time college employees living in the Metropolitan Statistical Area (MSA)?**
Interfund transfer in billings is the fund transfered from one department to another.
Please note that your college is located in MSA which includes the following counties:

75
5. What is the total number of full-time students (headcounts)? Full—time students aire those students taking 12 credit hours or more per semester.
In Fall 1985
In Spring 1986
In Summer 1986
6. What is the total number of part-time students? Part-time students are those students taking 9 credit hours or less per semester.
In Fall 1985
In Spring 1985
In Summer 1986
What is the average annual college-related expenditures for full-time students? This figure excludes tuition and fees. Full-time students are those students taking 12 credit hours or more per semester.
8. What is the average annual college related expenditures of part-time students? This figure excludes tuition and fees .
9. By reviewing the last 200 payments of fiscal 1986 which paid for "purchasing orders" or other "expenses" described in item No. 1.***
(a) What was the value out of the money spent inside the Metropolitan Statistical Area (MSA)?
(b) What was the value out of the money spent outside the Metropolitan Statistical Area (MSA)?
* * * If reviewing last 200 payments is difficult please
review 100 payments, and mention that.

APPENDIX B
76

77
Basic and Service Employment
Bell County
Business Location quotient
Basic employ
Service employ
1.Agriculture 2.Mining 3.Construction -General contract -Special contract
4.Manufacturing -Lumber -Furniture -Paper -Stone -Fabrics -Misc. -Rubber
5. Transportation -Local -Administrative
6.Wholesale trade 7.Retail trade -Building -Food -Apparel -Eating -Misc. -Furniture -Automotive -General merchandise
8.Finance 9.Service -Personal -Motion picture -Health
10.Nonclassified -Government
<1 <1 <1 1.26 1,229 1.11 2,502 <1 2.71 956 7.88 1,231 3.54 717 1.23 495 1.12 1,248 1.04 131
93.82 1,673 <1 4.18 301 1.20 186 <1 <1 1.09 430 1.07 1,962 1.13 799 1.14 3,662 1.11 1,309
1.26 486 1.32 1,618 1.35 1,787 <1 <1 1.22 854 1.27 94 1.55 5,065 >1 782
8,467
110 109 136
1,002
1,714
1,952 436
2,167 4,199
9,258

78
Business
Coryell County
Location Basic quotient employ
Service employ
1.Agriculture <1 2.Mining <1 3.Construction <1 4.Manufacturing -Apparel 2.39 199 -Transportation 2.28 199
5.Transportation <1 6.Wholesale trade <1 7.Retail trade <1 -General 1.41 238 -Food 1.55 361 -Automotive 1.32 206 -Furniture 1.52 75 -Eating 1.06 435
8.Finance <1 -Banking 1.22 149
9.Service <1 -Health 1.05 435
10.Nonclassified 1.40 139 11.Govnt 2,242
28 5
389
90 148 139
73
509
1,405

79
Business
Bowie County
Location quotient
Basic employ-
Service employ
1.Agriculture 2.Mining 3.Construction 4.Manufacturing -Food -Lumber -Furniture -Fabricated
5.Transportation -Communication
6.Wholesale trade -Nondurable
7.Retail trade -Merchandise -Automotive -Apparel -Furniture
8.Finance 9.Service -Miscellaneous -Health
10.Nonclassified 11.Government
-Fed and State
<1 <1 <1 <1 1.10 3.55 2.15 4.33 <1
1.64 <1 1.04 <1 1.46 1.33 1.20 1.54 <1 <1 1.22 1.65 <1
local
468 669 179
1,827
729
722
1,036 872 451 317
183 2,868
7,346
70 70
1,218 674
542
977
3,293
1,148 2,421
343 3,041

80
Business
Ector County
Location quotient
Basic employ-
Service employ
1.Agriculture 2.Mining 3.Construction -Heavy -Special
4.Manufacturing -Fabrics -Machinery -Rubber -Chemical
5.Transportation -Trucking -Pipeline
6.Wholesale trade -Durable
7.Retail trade -Building -Food stores -Automotive -Apparel -Merchandise -Furniture -Eating
8.Finance 9.Service -Personal -Auto -Miscellaneous .Nonclassified -Government -Federal and State
<1 53 3.46 5,077 <1 475 1.96 1,767 1.22 2,339 <1 1,358 1.66 1,120 2.42 2,289 6.53 99 1.65 910 <1 1,088 1.80 1,249 3.90 155 <1 978 1.89 3,703 <1 1,319 1.13 377 1.05 1,631 1.01 1,053 1.13 677 1.38 1,559 1.32 434 1.33 3,643 <1 1,866 <1 5,403 1.30 770 1.34 502 2.70 646 1.08 715 local
1,098 5,780

81
Galveston County
Location Basic Service Business quotient employ employ
1.Agriculture <1 165 2.Mining <1 351 3.Construction <1 3, 948 4.Manufacturing <1 2, 834 -Rubber 3.08 68 -Chemical 4.99 4, 008 -Petroleum 7.40 3, 119
5.Transportation <1 967 -Service 1.25 254 -Communication 1.29 1, 337 -Electric & gas 1 789 -Water 9.03 2, 286
6.Wholesale trade <1 1, 843 7.Retail trade <1 906 -Building materal 1.26 611
906
-General material 1.07 1, 754 -Food 1.25 2, 833 -Automotive 1.01 1, 539 -Eating 1.12 4, 477 -Apparel 1.23 1, 074
8.Finance <1 2, 632 -Insurance 2.12 1, 975
9.Service <1 9, 116 -Hotels 1.52 1, 348 -Social 1.24 873
10.Nonclassified <1 757 11.Government local 9, 776
-State and Fed 10, 264

82
Business
Grayson County
Location quotient
Basic employ
Service employ
1.Agriculture 2.Mining 3.Construction 4.Manufacturing -Food -Textile -Apparel -Lumber -Furniture -Paper -Leather -Stone -Metal -Fabrics -Electric -Instrument
5.Transportation -Electric & gas
6.Wholesale trade 7.Retail trade -Building materials -Merchandise -Food -Automotive -Furniture -Apparel -Misc.
8-Miscellaneous 8.Finance -Auto
9. Service -Health -Education -Membership
10.Nonclassified -Government -Federal and State
<1 65 <1 190 <1 1,533 <1 1,048 3.97 1,841
31.78 646 1.91 622 1.49 307 1.17 107 1.77 209 1.45 65 2.75 646 5.04 872 1.59 735 5.45 3,230 6.25 646 <1 940 1.13 419 <1 1,312 <1 1,806 1.48 340 1.28 995 1.24 1,327 1.28 918 1.25 282 1.06 437 1.31 905
1.31 905 <1 1,254 1.02 263 <1 1,814 1.36 2,583 1.24 344 1.17 612 <1 439 Local 4,164
499

83
Midland County
Business
1.Agriculture 2.Mining 3.Construction -Heave
4.Manufacturing -Instruments -Administrative
5.Transportation -services -Electric and Gas -Pipeline
6.Wholesale trade -Nondurable
7.Retail trade -Apparel -Furniture
8.Finance -Real estate -Banking -Holding -Securities
9.Service -Business -Misc. -Amusement -Legal -Membership
10.Nonclassified 11.Government
-State and Fed
Location quotient
Basic employ-
Service employ
<1 148 7.77 12,291
<1 2,581 2.09 2,036 <1 2,479 1.08 176 1.35 753
<1 896 1.15 883
896
1.54 898 7.44 319
<1 1,850 1.56 1,981 <1 7,139 1. 02 659
7,139
1.06 378 <1 858 1.00 812 1.27 1,114 1.19 199 3.02 402
<1 3,966 1. 02 2,235 1.13 916
1.47 516 1.03 347 1.10 904 1.22 868 local
889 4,392

84
Business
Potter County-
Location quotient
Basic employ
Service employ
1.Agriculture 2.Mining 3.Construction 4.Manufacturing -Food -Apparel -Lumber -Printing -Stone -Metal -Administrative -Petroleum
5.Transportation -Trucking -Local -Electrical & Gas -Administrative
6.Wholesale trade -Durable -Nondurable
7.Retail trade -General -Auto -Furniture -Eating -Apparel -Misc.
8.Finance -Banking -Insurance -Securities
9.Service -Hotels -Personal -Amusement -Legal -Membership -Auto -Health -Social -Picture
10.Nonclassified 11.Government
-Federal and State
1.39 384 <1 1,795 <1 3,543 <1 833 3.67 3,176 1.39 845 1.98 762 1.00 693 2.33 1,023 2.61 845 1.28 844 2.27 844 <1 565 1.41 1,252 1.95 153 2.66 1,848 2.35 396 <1 78 1.25 3,143 1.48 2,235 <1 1,606 1.13 1,629 1.07 1,434 1.10 462 1.03 3,609 1.40 1,076 1.05 1,362 <1 1,690 1.23 1,285 1.01 397 1.09 172 <1 2,651 1.07 836 1.16 887 1.12 468 1.02 406 1.07 1,043 1.26 606 1.12 4,692 1.57 980 1.20 97 <1 644 Local
3,138 7,447

85
Business
Randall County
Location Basic quotient employ
Service employ
1.Agriculture 4. 45 2.Mining <1 3.Construction <1 -Heavy 3 .11 -Special 1 .36
4.Manufacturing <1 .36
-Food 1 .19 -Machinery 1 .68
5.Transportation <1 -Communication 1. .43
6.Wholesale trade <1 .43
-Nondurable 2. ,08 7.Retail trade <1
,08
-Building materials 2. 28 -Merchandise 1. 11 -Food 2. 03 -Automotive 1. 69 -Apparel 1. 99 -Furniture 2. 90 -Eating 1. 88 -Miscellaneous 1. 31
9.Services -Hotel -Personal -Auto -Amusement -Social -Membership
10.Nonclassified 11.Government
-State and Federal
<1 <1 1.22 1.87 1.09 1.16 1.10 2.05 1.83 Local >1
290
849 789
244 483
362
742
231 380 960 535 363 289
1,558 399
227 337 124 114 162 474 367
1,356
57 198
311
160
586
96
438 1,051
870

86
Business
Smith County
Location quotient
Basic employ-
Service employ
1.Agriculture 2.Mining 3.Construction 4.Manufacturing -Furniture -Paper -Metal -Machinery -Rubber i
5.Transportation -Communication -Pipeline
6.Wholesale trade 7.Retail trade -Building materials -Merchandise -Automotive -Apparel -Furniture -Administrative
8.Finance -Credit agencies -Insurance -Real estate
9.Services -Personal -Health -Social -Membership -Miscellaneous -Motion pictures
10.Nonclassified 11.Government
-State and Federal
<1
1.55 <1
<1 1.87 2.25 9.82 2 . 6 2 76.16
<1 1.57 3.50 <1 <1 1.48 1.23 1.24 1.35 1.23 1
<1
1 1 1
<1 1 1
.97
18 07 14
21 32
1.15 1.66 1.18 1.25 1.20 Local
312 487
3,116 3,116 1,454
1,408 175
625 1,749 1,633 1,023
511 1,338
627 865 223
905 4,625
705 1,549 1,115
99 997
3,089
127 2,863 3,271 3,396
1,134
3,442 6,286
2,015
4,214
5,359

BIBLIOGRAPHY
Ammer'n(:hJistin? a n d D e a n s- Ammer. Dictionary of Business
and Economics. New York: The Free Press, 1984.
Andrew, Loyd D. and Norval L. Wellsfry. "Community Colleae System Pays its Way." Community and Junior Col 1 *»rr«a Journal 47 (March 1977)1 28-317 icuieqe
Bendavid-val, Aurom. Regional and Local Economic Analvsi.
1983 " e r S' Y ° r k : P r a e 9 ® r Special Stidies.
Bess, Raymond. A Study of the Economic six Community Colleges in Illinois. Spriimfi.lH s. Illinois Community College Board, 1980.
Bidder, Patricia. A Graphic View of the Caffrey and Isaar^ Cranlord, New Jersey: UnioS
Breslin, T. P. The Economic Impact of Trenton s t m - . A
college on the Local Community! Fiscal 1978. Tr^fnn New Jersy: Trenton State College, 1979; 2 Benton,
Caffrey John and Herbert Isaacs. Estimating the Impact of a College or University on the Local Economy. Washington, D.C.: American Council on Education, 1971.
Crandall Robert H. "Information Economics and its
ThSor$a^°?>LfAr the. T u r t h e r Development of Accounting 457-466 -The Accounting Review. 44 (July 1969):
Doucette, Donald S., Richard C. Richardson, Jr., and Robert of E ? t M Defining Institutional Mission." Journal of Higher Education 56 (April/March 1985): 189-2051
Duea, Jerry. President's Views on Current and Future
S E X ^8?)?h"8f-588ti0n-' P h l D e l t* K*PPa" 6 2
Eaton. Judith^ -The challenge for change at the Community College. Educational Record 66 (Fall 1985): 4-11.
Economic Research and Analysis Department. Labor Force
87

88
Estimates For Texas Counties DecembPr-^ T e x a s
Employment Commision. 1985. ~~
Evans, Thomas. 'congress Embraces a Draconian Cure for the
1985)t 18-21 0 n T e x a s ' " Time 126 (23 December
" ^ " s f - s e 0 1 1 M U S t S h r i n k ' " T h e Economist 299 (April 1986):
Gordon -Shirley B. "A National Risk, Community College to < & £ £ £ J " n i ° r C ° 1 1 6 ^
G r i t Z ; p,;hlf; " A "°^ e l f o r Measuring the Economic Impact of Ph S 5 ? « u r a i C o r n m u ,? l ty College on the Local Economy • Ph.D. diss.. University of Northern Colorado, 1983.
Office of _ Institutional Research. The Economic Imnart-. nf
" ' " T -
Sg.VS» K S f t : -
the0Interior?gjuly, Di985! S t * t e S D e P " t m e „ t of
" " ^ e a ^ h e D a n f T " h i t e ' L e W i s D i s c u " Hike • Dallas Morning News 28 August 1986, p. 1.
H 0 r t 0 S ; J h 0 m a S A "T r a i n i n <? : A Key to Productivity Growth." Management Review 72 (September 1983): 2-3.
Isard Walter Methods of Regional Analyst- An Introduction to Regional Science. Cambridge Massachusetts: Technology Press of the Massachusetts Institute of Technology and John Wiley and Sons Inc.,
Isserman, Andrew N. "Estimating Export Activity in a Regional Economy: A Theoretical and Empirical Analvsis ° f , A l t e r ? a t i v e ^thods." International R e o i o n * ? 7
Science Review 5 (winter 1980): 155-184.
Jaschik, Scott. "A 9 Percent Increase." The Chronicle of Higher Education 29 (July 1987): 15. o f
Jaschiick, Scott "Colleges in Oil-Producing Areas." The Chronicle of Higher Education 31 (February 1986):—21.
J a S C h £ ' r K C O t t , i "Expected Cuts in U.S. Funds." The Chronicle of Higher Education 31 (February 1986):

89
Jean, William H. and Billy P. Helms. "Geometric Mean
A n a l ^ s i ^ ^ S ^ S e p t e m b e r ^ g s f ) ° U * n t i
diss., St. Louis University, 1979 OJ"Le9es- ' '
Kang, Moon H. "The Unit of Measurement." The Community
l — ° ! a S S M u l t i p l i e r - Business Research Bulletin No. 63, Lincoln, Nebraska, University of Nebraska Publications, 1958: 47.
K S y ' ? 0 C U p i j i 1986) a S ° nr0 i ^ ? l i C k ' " T e X a S Business 1.U ^April 1986). 63-76. Linthicum, Dorothy S
ommunity Colleges Mean Big Bucks in Maryland" Community and Junior College Journal 49 (April, 1979):
Manning Sherry Economic Impact of the Metropolitan Community College on the Kansas Citv Region; Final
f f f l K u t eK a S r f C i t Y % M i S S ° U r l : M i * w e s * R e s e a t
institute, September 3, 1975.
Marilyn, Esco. The Impact of Rockland Com m„ nity College on the Economy ot Rockland County.Sutfern N Y • Rockland Community College, 1978.
McClelland, Edward. "Lower Oil Prices in Texas " E r n m m i v Perspective 5 (April 1986): 2-3 Economic
McNeedy, Dave. "state Financing: Apocalypse Soon." Texas Business 10 (May 1986): 23-25. S
Mllon'1,jr- , W a l J e r ' w* David Mulkey, and Michael J.
Multipliers " R | g i o n a l ^ P a c t Analysis and Recreation 1982)? 11-21 R e v i e w o f Regional Studies 12 (Winter,
Owings, Thomas G. "Economic Impact Studies- A Method and an Expanded Approach. • C ^ u n i ^ / J ^ ™ * 1
2°1-!H R e s e a r c h Quarterly. 6 (April-June 1977)1
P a l m e I i r f ™ a r •TheG?o^^-l?C,n,?SOn' " Y r ° n K a n 9 ' a n d W i l l i m B , ' „ T h e Community Economic Base and Multiplier " Business Research Bulletin Hn 6 3, L i n c o l "
U Nebraska-university ot Nebraska PublicatlSKs, 1958 N e b r a s k a -
Rabin.^avid.^IIhe State Folly.- Texas'Business 9 (April
Rafter, Robert Lee. The Economic: Impact of th. University

90
of Texas at Arlington on the City of Arlington. Arlington, Texas: Center for Business and Economic Research at the University of Texas at Arlington, 1973.
Richardson, Harry W. Regional Growth Theory. New York: John Wiley and Sons, 1973. ~
Robert, F.Murdick. Business Research: Concepts and Practice. Pennsylvania: International Textbook Company, 1969.
Ryan, G. Jeremiah. "A Shortcut to Estimating Economic 1985)^' ' . ^ u n i t y / J u n i o r College Quarterly 9 (October
Students Service Division Director, Austin, Texas. Telephone interviews. 11 September 1987.
Terry, Edwin F. ^'Linear Estimaters of the Export Employment Multiplier. Journal of Regional Science Off 6 (October 1965)1 17-34. —
Texas Legislative Council. "The Community Colleges nf Texas." Austin, Texas, 1959, p. 79^
Thomson, Gerald E. "The Multiplier in Lancaster County, Nebraska." The Community Economic Base and MnlHniior Business Research Bulletin No. 63, Lincoln, Nebraska:' University of Nebraska Publications, 1958.
Wattenbarger, James L. "Dealing with New Competition for Public Funds: Guidelines for Financing Community Colleges." Renewing the American Community ed. William L . D e e g a n , Dalle Tillery and Associates, San Francisco: Jossey-Bass Publishers, 1985, 255.
Wattenbarger,_James L. and P. M. Starnes. Financial Support Patterns for Community Colleges 1976. Gainesville, Florida: University of Florida Press, 1976, 127 (ED 123994).
Weiss, Stephen J. and Edwin C. Gooding. Estimation of Differential Employment Multipliers in a Small Regional Economy. Boston, Massachusetts: Federal Reserve Bank ot Boston, 1966.