Embed Size (px)
Citation preview
Certificates I and II in post-school VET:
some preliminary work
Tom Karmel
2019
PO Box 42, Holmesglen, Victoria 3148, AustraliaEmail: [email protected]: holmesglen.edu.au/MRI

Certificates I and II in post-school VET: some preliminary work
Introduction
This report is in two parts. The first part provides a description of what certificates I and II purport to be, and undertakes a brief survey of the literature. The second provides a statistical overview, looking at numbers of commencements across qualification levels classified by available characteristics such as field of education, mode of study, whether part of an apprenticeship or traineeship, and a range of demographic and socio-economic characteristics. The statistics are restricted to those who are not attending school – our interest is in the post-school VET sector. Time series data are also included, covering the period 2003 to 2017. The statistical picture is completed with data on completion rates.
A brief survey of the literature
Certificates I and II lie within the Australian Qualifications Framework, the national policy for regulated qualifications in Australian education and training. It incorporates the qualifications from each education and training sector into a single comprehensive national qualification framework (https://www.aqf.edu.au/).
Certificates I and II are categories of qualifications, in the same way as the Senior Secondary Certificate of Education or a Bachelor Degree.
Each AQF qualification type includes the requirements for AQF qualifications. The qualifications are defined by level criteria and descriptors, shown below (from https://www.aqf.edu.au/).
AQF Level 1 – Certificate I
The purpose of the Certificate I qualification type is to qualify individuals with basic functional knowledge and skills to undertake work, further learning and community involvement.
Certificate I qualifications are located at level 1 of the Australian Qualifications Framework.
Certificate I qualifications must be designed and accredited to enable graduates to demonstrate the learning outcomes expressed as knowledge, skills and the application of knowledge and skills specified in the level 1 criteria and the Certificate I descriptor.
AQF level 1 criteria
Summary
Graduates at this level will have knowledge and skills for initial work, community involvement and/or further learning.
Knowledge
Graduates at this level will have foundational knowledge for everyday life, further learning and preparation for initial work.
Skills
Graduates at this level will have foundational cognitive, technical and communication skills to:
undertake defined routine activities
1
identify and report simple issues and problems
Application of knowledge and skills
Graduates at this level will apply knowledge and skills to demonstrate autonomy in highly structured and stable contexts and within narrow parameters
AQF Level 2 – Certificate II
The purpose of the Certificate II qualification type is to qualify individuals to undertake mainly routine work and as a pathway to further learning.
Certificate II qualifications are located at level 2 of the Australian Qualifications Framework.
Certificate II qualifications must be designed and accredited to enable graduates to demonstrate the learning outcomes expressed as knowledge, skills and the application of knowledge and skills Specified in the level 2 criteria and the Certificate II descriptor.
AQF level 2 criteria
Summary
Knowledge
Graduates at this level will have basic factual, technical and procedural knowledge of a defined area of work and learning.
Skills
Graduates at this level will have basic cognitive, technical and communication skills to apply appropriate methods, tools, materials and readily available information to:
undertake defined activities provide solutions to a limited range of predictable problems
Application of knowledge and skills
Graduates at this level will apply knowledge and skills to demonstrate autonomy and limited judgement in structured and stable contexts and within narrow parameters.
As shown above, these certificates are clearly lower level. They are defined using words such as ‘foundational’ and ‘basic’ and are designed to allow graduates to work in relatively low skilled jobs, possibly with autonomy but within “structured and stable contexts and within narrow parameters’. They have multiple roles (Shah et al 2015) ‘designed to meet both industry needs and social goals’.
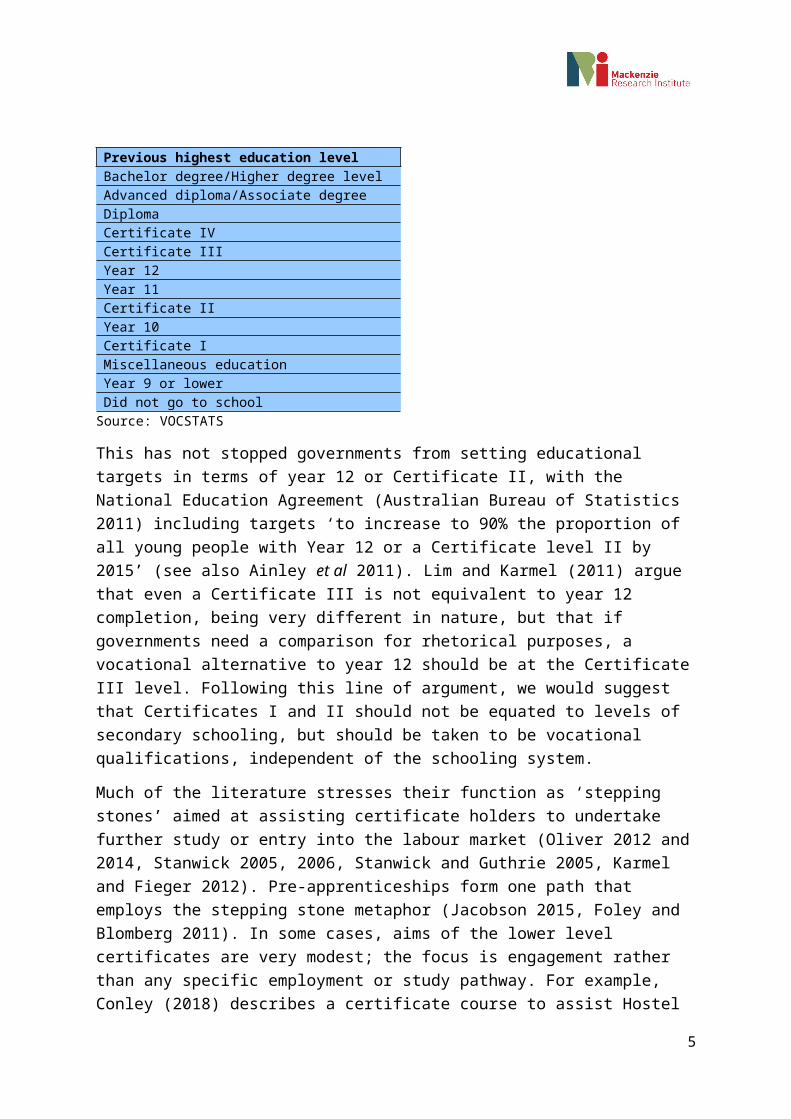
Their relationship to Year 12 completion has been a little vexed. NCVER’s statistical classification places Certificate II lower than year 11 and Certificate I lower than year 10.
2
Previous highest education levelBachelor degree/Higher degree levelAdvanced diploma/Associate degreeDiplomaCertificate IVCertificate IIIYear 12Year 11Certificate IIYear 10Certificate IMiscellaneous educationYear 9 or lowerDid not go to school
Source: VOCSTATS
This has not stopped governments from setting educational targets in terms of year 12 or Certificate II, with the National Education Agreement (Australian Bureau of Statistics 2011) including targets ‘to increase to 90% the proportion of all young people with Year 12 or a Certificate level II by 2015’ (see also Ainley et al 2011). Lim and Karmel (2011) argue that even a Certificate III is not equivalent to year 12 completion, being very different in nature, but that if governments need a comparison for rhetorical purposes, a vocational alternative to year 12 should be at the Certificate III level. Following this line of argument, we would suggest that Certificates I and II should not be equated to levels of secondary schooling, but should be taken to be vocational qualifications, independent of the schooling system.
Much of the literature stresses their function as ‘stepping stones’ aimed at assisting certificate holders to undertake further study or entry into the labour market (Oliver 2012 and 2014, Stanwick 2005, 2006, Stanwick and Guthrie 2005, Karmel and Fieger 2012). Pre-apprenticeships form one path that employs the stepping stone metaphor (Jacobson 2015, Foley and Blomberg 2011). In some cases, aims of the lower level certificates are very modest; the focus is engagement rather than any specific employment or study pathway. For example, Conley (2018) describes a certificate course to assist Hostel residents ‘develop their personal vision and gain confidence to re-engage with learning, employment and community life’. Similarly, the NSW Department of Education and Training, 2005 describes a Certificate II Aboriginal and Performing Arts which is intended to boost confidence and improving literacy, among other things.
While much of the literature is focussed on the individual, one issue is acceptability to employers. At a global level, industry supports these lower level qualifications with Shah et al 2015 noting that stakeholders (including industry) agree that lower level qualifications will continue to meet industry needs and social goals in the medium term. However, they point out that ‘enrolment patterns, do, however, demonstrate the sensitivity of enrolments to changes in funding arrangement.’ Thus it appears that industry supports the qualifications but prefers government to pay for them.
3

The Retail and Personal Services Training Council (2014) provides a rather different view, arguing that ‘a certificate II traineeship that lasts 12 months’ provides a way of finding staff willing to commit to employment for a longer period. Perhaps this lack of commitment is not surprising given the low wages paid to pharmacy assistants. While the pharmacy industry may have been in favour of a Certificate II traineeship, more generally Cully (2005 p.53) argues that ‘…Certificate I and II qualification, in general, have not found favour with employers. These qualifications are not sought after in recruiting new staff, and the labour market outcomes of those holding qualifications are mixed’.
The possession of a certificate I or II (at least as the highest educational qualification) is seen as a marker of disadvantage. For example, Buddelmeyer and Polidano (2016) find that ‘those without Year 12 or, at most, Certificate II qualifications, are much less socially included than those who have completed Year 12 or at least a Certificate III qualification’ (see also Buddelmeyer et al 2012). Similarly, Guenther et al 2008, in examining the role of vocational education in training in moving people from welfare to work, point to lone parents as a group who are over- represented among Certificate I and II qualifications. Cavallaro et al (2005) note that people with a disability are less likely to undertake higher level AQF qualifications and more likely to undertake Certificate I or II qualifications.
An important strand of the literature is the extent to which undertaking a certificate I or II has benefits. In this regard, the low completion rates of the Certificates I and II are of concern, and are significantly lower than the completion rates of higher-level qualifications (see NCVER 2017 and Table 10 and Figure 5 below). An important consideration here is the extent to which individuals wish to complete the qualifications, rather than merely undertake certain elements. NCVER’s survey of student intentions (NCVER 2011) estimates that 85.7% of those undertaking a certificate I intend to complete it, with the corresponding figure of 86.7% for certificate II. These, while not quite as high the corresponding figures for higher level qualifications, are very high, suggesting that low completion is a concern because, despite intending to complete the qualification, many fail to do so.
In terms of benefits of completion - which we equate to the pay-off to the qualification - the findings are mixed. Oliver (2012, 2014) finds immediate benefits (in terms of employment or undertaking an apprenticeship or traineeship) from a certificate I or II, compared to outcomes for similar young people without these qualifications. By the age of 26, benefits are still apparent for males but have disappeared for females. Stanwick (2005) finds that ‘vocational and further study outcomes for young people from Certificate I and II qualifications could be described as fair, at best’. A key finding was that only a minority of young people were projected to enrol in further study at a higher level (under a quarter) or to complete a further qualification. Stanwick (2006) also looked at outcomes for people over 25 and found that ‘overall, the study found that there were no major employment related or further study outcomes for prime and mature-aged students who had undertaken Certificate I and II courses. Woods (2008), in summarising the Australian research on the impact of vocational education and training on transitions to work for young people, was generally positive about VET’s impact, particularly programs linked to the workplace, but observed that ‘other VET programs, such as Certificate I and II courses, often require further study at a higher level in order for students to achieve their desired jobs’. This theme is
4
echoed by Karmel and Liu (2011) who looked at the various pathways young people took in their transition to work. Their analysis suggested that, on average, completing Year 12 is no longer sufficient; rather, young people today need to have Year 12 plus further study to get them on a path to success. This finding suggests that Certificates I and II by themselves have limited utility, except as an entry into further training. Karmel et al (2009) looked at the group of individuals targeted by the ‘Welfare to work’ initiative and found that the completion of a Certificate I or II is not likely to assist employment prospects.
Karmel and Fieger (2012) emphasise the pay-off to completion of qualifications for some groups in particular. They compared the outcomes – employment and further study- of those who completed their qualification and those who did not. The ratios provide a measure of the value of completion – clearly pertinent to the value of the qualification. The study did not focus on outcomes for lower level qualifications specifically, but one group benefiting greatly from completion in terms of going onto further study was the group of individuals who were not in the labour force and were undertaking a certificate I or II.
In looking at the value of a certificate I or II we need to take account of the previous educational experience of the individual. Karmel and Nguyen 2006 make the point that there is little value (at least in terms of higher wages) in completing a VET qualification, if it is at a lower level than the qualifications already possessed by the individual. In this regard, Table is 9 below is pertinent. Of those undertaking a certificate II in 2017, 49.4 per cent had an educational qualification at a middle level or higher (that is, year 12 or a Certificate III or higher), with the corresponding figure for certificates I being 38.6 per cent. Whilst not knowing the personal circumstances of these individuals, it is difficult to anticipate a substantial benefit from these qualifications for such individuals.
To sum up, qualifications at the level of certificate 1 and certificate II are low level in nature, and are at an educational level lower than the completion of school. Often their possession is a marker of disadvantage. Mostly, they are thought of as stepping stones to higher level qualifications, although they have some role in industry. Outcomes for those who complete them are mixed - they are not qualifications which can generally be taken to be ‘a good thing’ without a clear understanding of the individual person and what they are likely to achieve from the qualification.
Statistical survey of lower level qualifications
In this section we present data on certificates I and II, drawn from the data published by the NCVER. We use commencements as the measure of activity, with annual data representing a new cohort of students. In presenting these data we have made a number of decisions regarding the scope of the data. First, we include only students who are not at school, because our policy focus is post-school VET. Table 1 shows the impact of this restriction.
5
Table 1: Share of government funded commencements by whether attending school ,within qualification levels, 2017
Diploma or higher
Certificate IV
Certificate III
Certificate II
Certificate I
Non AQF qualification Total
Not attending school 97.5 96.7 89.3 60.6 81.6 93.7 85.5Still attending school 0.6 0.6 8.0 37.0 15.7 5.0 12.1Not known 1.9 2.7 2.7 2.4 2.7 1.3 2.4Total 100.0 100.0 100.0 100.0 100.0 100.0 100.0
Source: Derived from VOCSTATS
We see that this restriction is of some importance, particularly for Certificate II. The decision to exclude those for whom school status is ‘unknown’ is of little consequence with less than three per cent of those commencing a certificate falling in this category.
We also focus on government funded commencements. This is for two reasons. First, NCVER has only collected data on all VET activity in recent years, while government funded activity is readily extracted from VOCSTATS for the years 2003 to 2017. Second, arguably, public policy’s primary consideration revolves around funding, and hence it is government funded students that are our main concern. To provide context, though, we show the importance of government funded activity by field of education and qualification level in Table 2.
Table 2: Government funded commencements as a proportion of all commencements, by qualification level and field of study, not at school (per cent), 2017
Diploma or higher
Certificate IV
Certificate III
Certificate II
Certificate I
Non AQF qualification Total
01 - Natural and physical sciences 52.4 85.0 59.7 73.1 na 7.3 59.602 - Information technology 30.3 72.6 82.1 92.2 92.0 26.2 62.203 - Engineering and related technologies 42.3 53.3 55.0 35.0 59.2 0.3 43.904 - Architecture and building 49.2 64.2 62.9 85.3 11.8 2.1 40.305 - Agriculture, environmental and related studies 63.9 75.4 71.5 61.6 36.3 8.7 61.706 - Health 43.6 45.3 65.0 46.0 25.0 1.2 24.607 - Education 69.4 18.9 78.8 0.0 99.8 35.0 43.208 - Management and commerce 14.4 35.1 49.6 44.4 79.5 2.8 30.609 - Society and culture 27.3 53.2 56.4 28.1 69.6 8.4 45.510 - Creative arts 46.9 72.1 83.5 81.5 81.7 6.6 60.211 - Food, hospitality and personal services 28.6 35.9 67.9 64.3 55.8 3.3 53.512 - Mixed field programmes 93.7 57.0 55.0 70.4 69.6 48.5 60.0Not known na na na na na 40.3 40.3 30.9 43.6 58.5 51.2 55.5 28.7 43.4
Source: Derived from VOCSTATS1.
We now describe government funded commencements (for those not at school) in terms of the characteristics provided in VOCSTATS. While our interest is in lower level certificates, wherever feasible we include the other VET qualification levels for comparative purposes. We begin with field of study.1 The filter we used was: vocational program; a commencing course; 2017; not attending school. The data were extracted in June 2019
6
Field of study
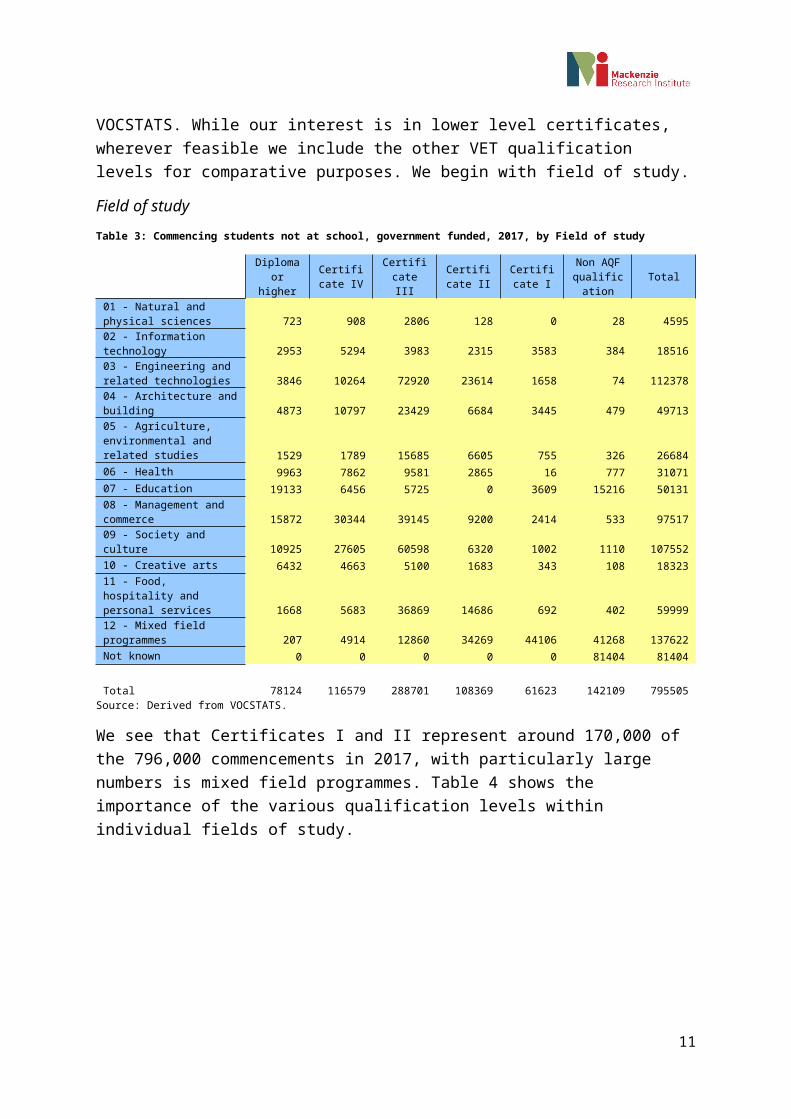
Table 3: Commencing students not at school, government funded, 2017, by Field of study
Diploma or higher
Certificate IV
Certificate III
Certificate II
Certificate I
Non AQF qualification Total
01 - Natural and physical sciences 723 908 2806 128 0 28 459502 - Information technology 2953 5294 3983 2315 3583 384 1851603 - Engineering and related technologies 3846 10264 72920 23614 1658 74 112378
04 - Architecture and building4873 10797 23429 6684 3445 479 49713
05 - Agriculture, environmental and related studies 1529 1789 15685 6605 755 326 2668406 - Health 9963 7862 9581 2865 16 777 3107107 - Education 19133 6456 5725 0 3609 15216 5013108 - Management and commerce 15872 30344 39145 9200 2414 533 9751709 - Society and culture 10925 27605 60598 6320 1002 1110 10755210 - Creative arts 6432 4663 5100 1683 343 108 1832311 - Food, hospitality and personal services 1668 5683 36869 14686 692 402 5999912 - Mixed field programmes 207 4914 12860 34269 44106 41268 137622Not known 0 0 0 0 0 81404 81404
Total 78124 116579 288701 108369 61623 142109 795505Source: Derived from VOCSTATS.
We see that Certificates I and II represent around 170,000 of the 796,000 commencements in 2017, with particularly large numbers is mixed field programmes. Table 4 shows the importance of the various qualification levels within individual fields of study.
7
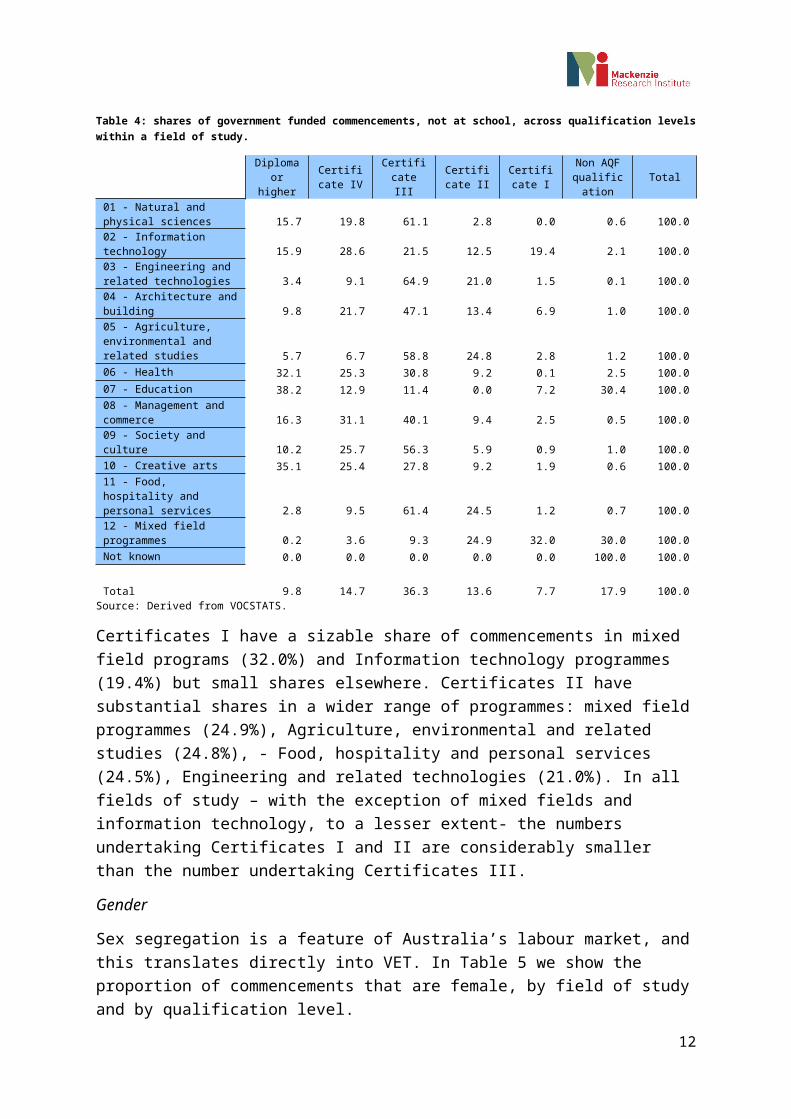
Table 4: shares of government funded commencements, not at school, across qualification levels within a field of study.
Diploma or higher
Certificate IV
Certificate III
Certificate II
Certificate I
Non AQF qualification Total
01 - Natural and physical sciences 15.7 19.8 61.1 2.8 0.0 0.6 100.002 - Information technology 15.9 28.6 21.5 12.5 19.4 2.1 100.003 - Engineering and related technologies 3.4 9.1 64.9 21.0 1.5 0.1 100.004 - Architecture and building 9.8 21.7 47.1 13.4 6.9 1.0 100.005 - Agriculture, environmental and related studies 5.7 6.7 58.8 24.8 2.8 1.2 100.006 - Health 32.1 25.3 30.8 9.2 0.1 2.5 100.007 - Education 38.2 12.9 11.4 0.0 7.2 30.4 100.008 - Management and commerce 16.3 31.1 40.1 9.4 2.5 0.5 100.009 - Society and culture 10.2 25.7 56.3 5.9 0.9 1.0 100.010 - Creative arts 35.1 25.4 27.8 9.2 1.9 0.6 100.011 - Food, hospitality and personal services 2.8 9.5 61.4 24.5 1.2 0.7 100.012 - Mixed field programmes 0.2 3.6 9.3 24.9 32.0 30.0 100.0Not known 0.0 0.0 0.0 0.0 0.0 100.0 100.0
Total 9.8 14.7 36.3 13.6 7.7 17.9 100.0Source: Derived from VOCSTATS.
Certificates I have a sizable share of commencements in mixed field programs (32.0%) and Information technology programmes (19.4%) but small shares elsewhere. Certificates II have substantial shares in a wider range of programmes: mixed field programmes (24.9%), Agriculture, environmental and related studies (24.8%), - Food, hospitality and personal services (24.5%), Engineering and related technologies (21.0%). In all fields of study – with the exception of mixed fields and information technology, to a lesser extent- the numbers undertaking Certificates I and II are considerably smaller than the number undertaking Certificates III.
Gender
Sex segregation is a feature of Australia’s labour market, and this translates directly into VET. In Table 5 we show the proportion of commencements that are female, by field of study and by qualification level.
8
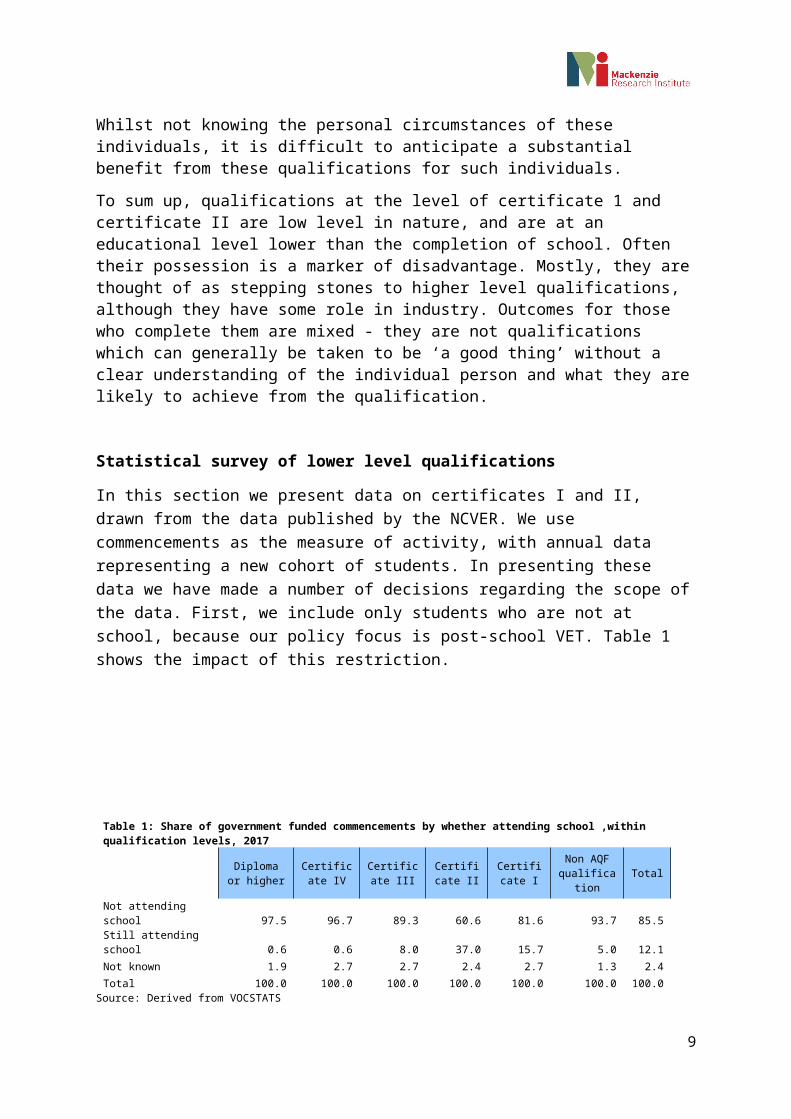
Table 5: Females' share of government funded commencements, not at school, by field of education and qualification level, 2017 (per cent)
Diploma or higher
Certificate IV
Certificate III
Certificate II
Certificate I
Non AQF qualification Total
01 - Natural and physical sciences 57.1 52.8 75.1 65.6 na 57.1 67.5
02 - Information technology12.4 15.8 17.9 39.2 50.1 70.1 26.4
03 - Engineering and related technologies 10.0 11.7 10.3 10.6 21.2 2.7 10.6
04 - Architecture and building 26.6 9.4 1.6 6.1 15.8 2.3 7.4
05 - Agriculture, environmental and related studies 38.7 40.1 21.7 22.9 27.5 36.8 24.606 – Health 81.0 70.0 77.9 81.1 100.0 15.4 75.607 – Education 93.7 79.2 89.4 8.9 48.3 71.4
08 - Management and commerce 62.1 66.3 69.4 53.7 41.3 48.4 65.009 - Society and culture 72.8 73.9 75.4 40.9 50.8 74.2 72.510 - Creative arts 57.4 54.6 61.5 45.3 19.0 50.0 56.0
11 - Food, hospitality and personal services 99.0 65.7 64.1 43.1 38.7 72.1 59.8
12 - Mixed field programmes65.2 59.5 70.7 53.4 46.8 53.5 53.2
Not known 50.0 50.0
Total 67.0 55.4 46.9 37.5 41.7 50.7 49.1Source: Derived from VOCSTATS.
Overall, women and men are evenly balanced, with women being over-represented in diplomas (and higher) and Certificates IV, and under-represented in Certificates I and II. By field of study, women dominate the Natural and physical sciences, Health and Education, management and commerce and society and culture. One interesting point is that women in Information technology (heavily dominated by men) are concentrated in Certificates I and II and non-AQF qualifications.
Mode of study.
In Table 6 we see that part-time study is the dominant mode in the VET sector. The proportion studying part-time does vary by field of education and by qualification level. In particular, Certificates I and II have the highest share of part-time students of all the qualification levels, with 81.5% of those undertaking certificates II and 83.9% of those undertaking Certificate I. This compares to 73.8% of those undertaking a Certificate III.
9
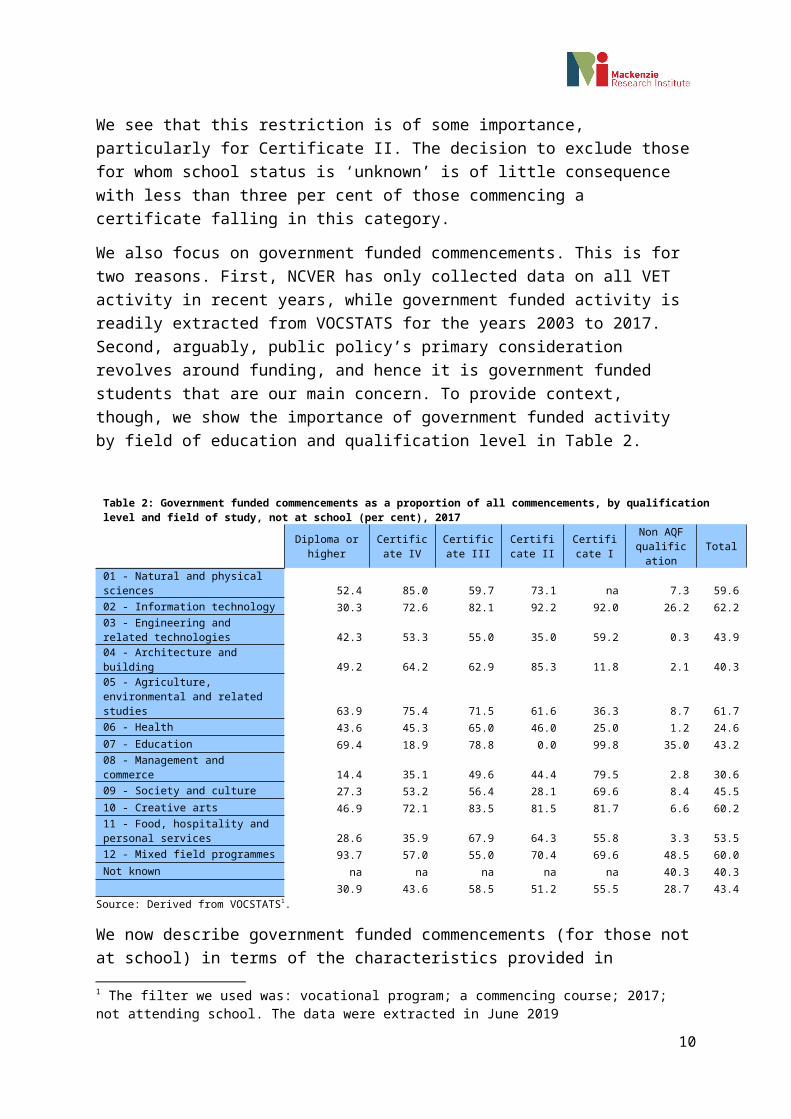
Table 6: Part-time study as share of government funded commencements (not at school), by field of study and level of qualification, 2017 (per cent)
Diploma or higher
Certificate IV Certificate III Certificate II Certificate I
Non AQF qualificatio
nTotal
01 - Natural and physical sciences 34.3 49.6 44.4 85.2 89.3 45.2
02 - Information technology39.3 43.9 55.0 80.1 88.6 83.9 59.6
03 - Engineering and related technologies 49.7 69.7 80.4 86.2 90.8 78.4 79.7
04 - Architecture and building51.9 65.8 88.8 72.7 92.2 97.7 78.3
05 - Agriculture, environmental and related studies 53.4 62.1 63.6 79.2 94.2 88.0 67.906 – Health 51.8 69.2 65.4 85.8 100.0 95.0 64.607 – Education 64.2 72.8 53.6 98.2 52.1 62.9
08 - Management and commerce 68.6 81.9 85.2 89.7 89.9 99.4 82.109 - Society and culture 60.4 56.1 57.6 72.8 89.5 92.8 59.110 - Creative arts 29.2 38.5 59.2 83.7 98.3 100.0 46.7
11 - Food, hospitality and personal services 38.3 59.8 83.3 92.7 90.6 96.8 82.3
12 - Mixed field programmes59.9 57.1 68.6 74.5 80.6 69.0 73.6
Not known 84.7 84.7
Total 56.6 65.7 73.8 81.5 83.9 76.9 73.3Source: Derived from VOCSTATS.
Age
We see (Table 7) that the age spread in all qualifications is quite broad. On average, those undertaking a certificate I or II are older but all age groups are represented in all qualification levels.
Table 7: Age distribution by sex by qualification level, commencing students not at school, 2017
Diploma or higher
Certificate IV
Certificate III
Certificate II
Certificate I
Non AQF qualification Total
Male
24 years and younger 43.2 33.3 54.4 46.7 31.0 40.0 45.125 to 49 years 49.3 55.0 37.5 44.4 54.5 44.8 44.450 years and over 7.4 11.7 8.1 8.9 14.5 15.2 10.4Total 100.0 100.0 100.0 100.0 100.0 100.0 100.0Female
24 years and younger 37.6 29.5 42.0 34.8 20.1 28.8 34.725 to 49 years 54.4 56.6 47.2 49.9 53.4 49.1 50.750 years and over 8.0 13.9 10.8 15.2 26.5 22.2 14.5Total 100.0 100.0 100.0 100.0 100.0 100.0 100.0
Source: Derived from VOCSTATS.
10
Apprenticeships and traineeships
We also note that relatively few undertaking a Certificate I or II are doing so as part of an apprenticeship or traineeship (Table 8), although there are pockets of apprenticeships or traineeships within certain fields of study. Overall, a little more than a third of those undertaking a Certificate III are in an apprenticeship or traineeship, compared to 4.8% of those doing a Certificate I and 8.9 % of those doing a Certificate II.
Table 8: Share of commencements (government funded, not at school) undertaking and apprenticeship or traineeship
Diploma or higher
Certificate IV
Certificate III Certificate II Certificate I Total No. of
apprentices01 - Natural and physical sciences 3.3 29.8 6.2 0.0 10.3 47302 - Information technology 0.5 3.9 7.4 0.3 0.0 2.8 51803 - Engineering and related technologies 3.8 15.5 58.7 4.1 0.0 40.5 4553304 - Architecture and building 0.2 1.0 83.1 2.2 22.2 41.2 2048505 - Agriculture, environmental and related studies 0.0 8.6 26.3 8.2 71.8 20.1 536106 - Health 0.6 3.0 8.3 0.6 0.0 3.6 110407 - Education 12.4 2.9 4.3 0.0 5.6 279508 - Management and commerce 3.5 10.8 33.7 17.1 15.9 19.5 1899909 - Society and culture 3.5 3.5 8.0 1.1 0.0 5.9 629510 - Creative arts 0.0 0.1 3.6 0.0 0.0 1.1 19311 - Food, hospitality and personal services 0.0 16.5 44.6 20.2 0.0 33.9 2035312 - Mixed field programmes 0.0 0.0 0.0 10.0 2.9 3.4 4717Not known 0.0 0Total 4.6 6.8 35.6 8.9 4.8 15.9 126826
Source: Derived from VOCSTATS.
11
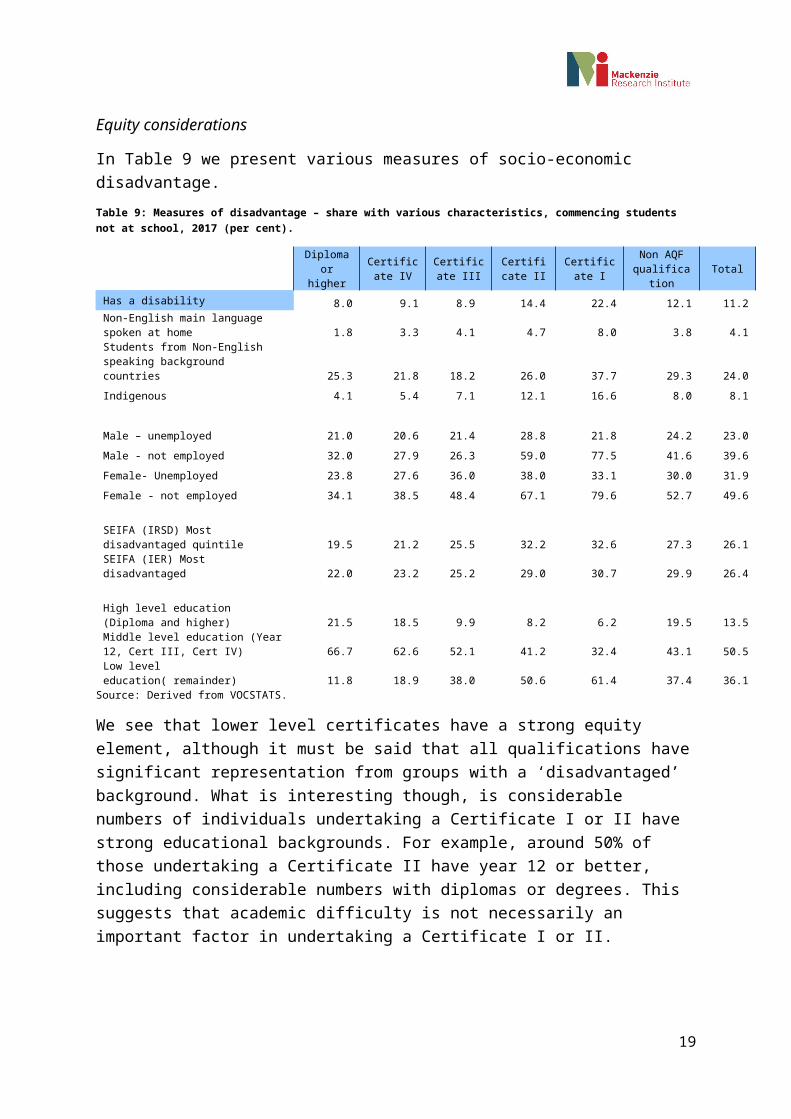
Equity considerations
In Table 9 we present various measures of socio-economic disadvantage.
Table 9: Measures of disadvantage – share with various characteristics, commencing students not at school, 2017 (per cent).
Diploma or higher
Certificate IV
Certificate III
Certificate II
Certificate I
Non AQF qualification Total
Has a disability 8.0 9.1 8.9 14.4 22.4 12.1 11.2Non-English main language spoken at home 1.8 3.3 4.1 4.7 8.0 3.8 4.1Students from Non-English speaking background countries 25.3 21.8 18.2 26.0 37.7 29.3 24.0
Indigenous 4.1 5.4 7.1 12.1 16.6 8.0 8.1
Male – unemployed 21.0 20.6 21.4 28.8 21.8 24.2 23.0
Male - not employed 32.0 27.9 26.3 59.0 77.5 41.6 39.6
Female- Unemployed 23.8 27.6 36.0 38.0 33.1 30.0 31.9
Female - not employed 34.1 38.5 48.4 67.1 79.6 52.7 49.6
SEIFA (IRSD) Most disadvantaged quintile 19.5 21.2 25.5 32.2 32.6 27.3 26.1
SEIFA (IER) Most disadvantaged 22.0 23.2 25.2 29.0 30.7 29.9 26.4
High level education (Diploma and higher) 21.5 18.5 9.9 8.2 6.2 19.5 13.5Middle level education (Year 12, Cert III, Cert IV) 66.7 62.6 52.1 41.2 32.4 43.1 50.5
Low level education( remainder) 11.8 18.9 38.0 50.6 61.4 37.4 36.1Source: Derived from VOCSTATS.
We see that lower level certificates have a strong equity element, although it must be said that all qualifications have significant representation from groups with a ‘disadvantaged’ background. What is interesting though, is considerable numbers of individuals undertaking a Certificate I or II have strong educational backgrounds. For example, around 50% of those undertaking a Certificate II have year 12 or better, including considerable numbers with diplomas or degrees. This suggests that academic difficulty is not necessarily an important factor in undertaking a Certificate I or II.
12

Time series
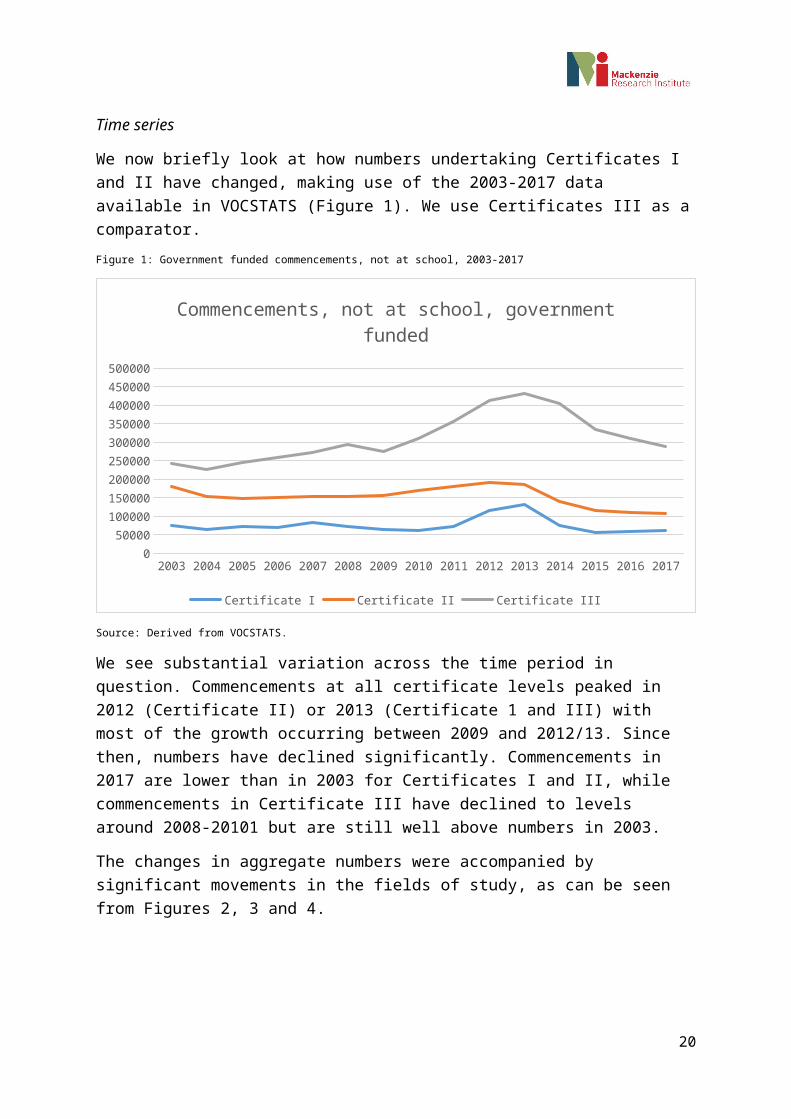
We now briefly look at how numbers undertaking Certificates I and II have changed, making use of the 2003-2017 data available in VOCSTATS (Figure 1). We use Certificates III as a comparator.
Figure 1: Government funded commencements, not at school, 2003-2017
2003 2004 2005 2006 2007 2008 2009 2010 2011 2012 2013 2014 2015 2016 20170
50000
100000
150000
200000
250000
300000
350000
400000
450000
500000
Commencements, not at school, government funded
Certificate I Certificate II Certificate III
Source: Derived from VOCSTATS.
We see substantial variation across the time period in question. Commencements at all certificate levels peaked in 2012 (Certificate II) or 2013 (Certificate 1 and III) with most of the growth occurring between 2009 and 2012/13. Since then, numbers have declined significantly. Commencements in 2017 are lower than in 2003 for Certificates I and II, while commencements in Certificate III have declined to levels around 2008-20101 but are still well above numbers in 2003.
The changes in aggregate numbers were accompanied by significant movements in the fields of study, as can be seen from Figures 2, 3 and 4.
13
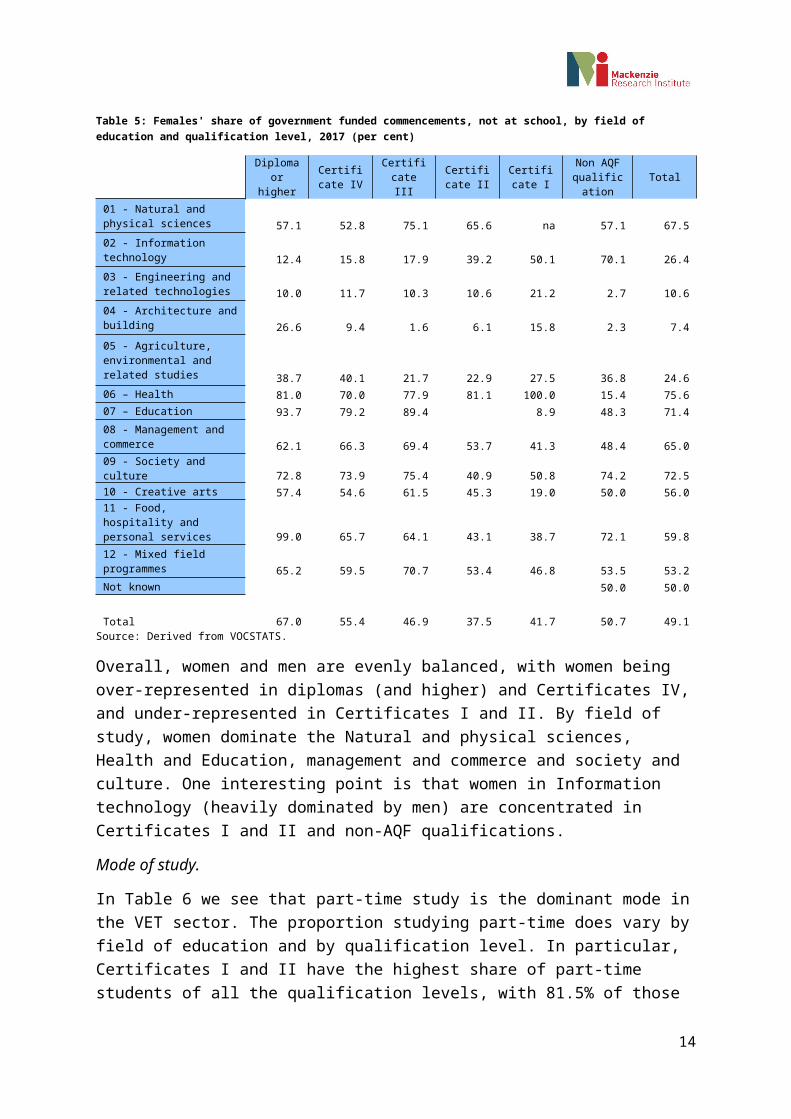
Figure 2: Commencements in Certificates I, not at school, government funded
2003 2004 2005 2006 2007 2008 2009 2010 2011 2012 2013 2014 2015 2016 20170
20000
40000
60000
80000
100000
120000
140000
Certificate I commencements, not at school, government funded
01 - Natural and physical sciences 02 - Information technology03 - Engineering and related technologies 04 - Architecture and building05 - Agriculture, environmental and related studies 06 - Health07 - Education 08 - Management and commerce09 - Society and culture 10 - Creative arts11 - Food, hospitality and personal services 12 - Mixed field programmes
Source: Derived from VOCSTATS.
14

Figure 3: Commencements in Certificates II, not at school, government funded
2003 2004 2005 2006 2007 2008 2009 2010 2011 2012 2013 2014 2015 2016 20170
50000
100000
150000
200000
250000
Certificate II commencements, not at school, government funded
01 - Natural and physical sciences 02 - Information technology03 - Engineering and related technologies 04 - Architecture and building05 - Agriculture, environmental and related studies 06 - Health07 - Education 08 - Management and commerce09 - Society and culture 10 - Creative arts11 - Food, hospitality and personal services 12 - Mixed field programmes
Source: Derived from VOCSTATS.
15
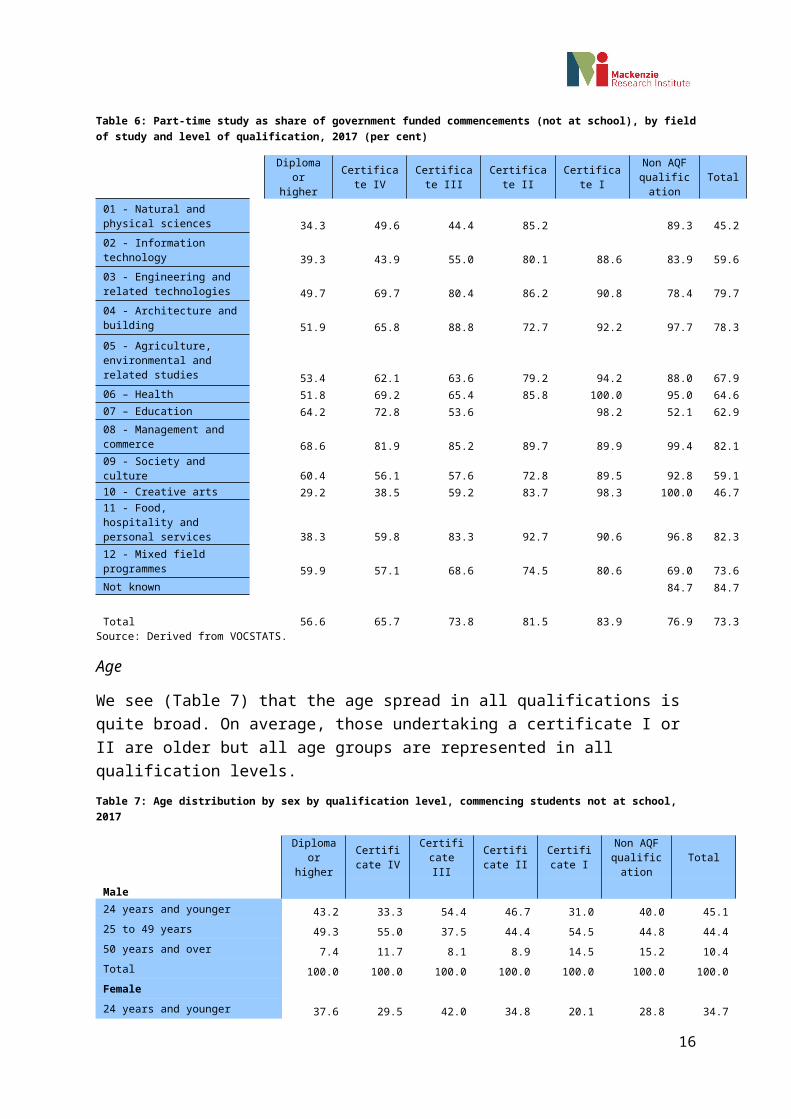
Figure 4: Commencements in Certificates III, not at school, government funded
2003 2004 2005 2006 2007 2008 2009 2010 2011 2012 2013 2014 2015 2016 20170
50000100000150000200000250000300000350000400000450000500000
Certificate III commencements, not at school, governemtn funded
01 - Natural and physical sciences 02 - Information technology03 - Engineering and related technologies 04 - Architecture and building05 - Agriculture, environmental and related studies 06 - Health07 - Education 08 - Management and commerce09 - Society and culture 10 - Creative arts11 - Food, hospitality and personal services 12 - Mixed field programmes
We note that the size of the fields of study are a lot more stable in Certificates III compared to those of certificates I and II. Among Certificates I mixed fields is the dominant field of study, and numbers in this field are still substantial but have declined from levels in 2012 and 2013. Management and commerce were of considerable importance between 2003 and 2011 but have declined considerably in recent years. Among Certificates II Engineering and related technology has been important over the whole period and numbers have been relatively stable. However, we have seen considerable declines in the numbers in Management and commerce and Food, hospitality and personal services.
16

Completion rates
In recent years, NCVER has published completion rates obtained by tracking students, and project rates based on current patterns of completion. Table 10 below provides these for 2012 to 2016
Table 10: Observed actual and projected program completion rates and subject load pass rates by program level for government-funded programs at Certificate I and above, commencing in 2012–16
Program level Program completion rate (%)
Observed actual Projected
2012 2013 2014 2015 2016
Diploma and above 49.6 50.5 52.2 54.3 52.9
Certificate IV 46.3 42.3 46.2 49.2 53.7
Certificate III 47.6 45.1 49.6 53.4 54.3
Certificate II 28.0 30.1 39.0 43.2 47.4
Certificate I 21.0 23.6 24.9 26.9 32.1
Total 39.8 38.9 44.8 48.3 49.4Source: Table 8, VET program completion rates 2016, NCVER Statistical report, August 2018.
We see that completion rates for Certificates I and II are lower than for other qualification levels, with the rates for Certificate I being particularly low. However, it seems that over time, these rates are increasing.
We can examine this trend further by calculating ‘completion ratios’ which are simply the ratio of completions in a year to commencements. If all courses were commenced and completed in the same year then the completion ratio would be the actual completion rate. To the extent that this is not the case, the ratio will be a proxy for the completion rate if we invoke a ‘steady state’ assumption. That is, the completion ratio will be the completion rate if the overall commencement numbers do not change, even if not all complete within a year.
These ratios also have the advantage relative to the NCVER publication that we can restrict the completion ratios to those not attending school.
17
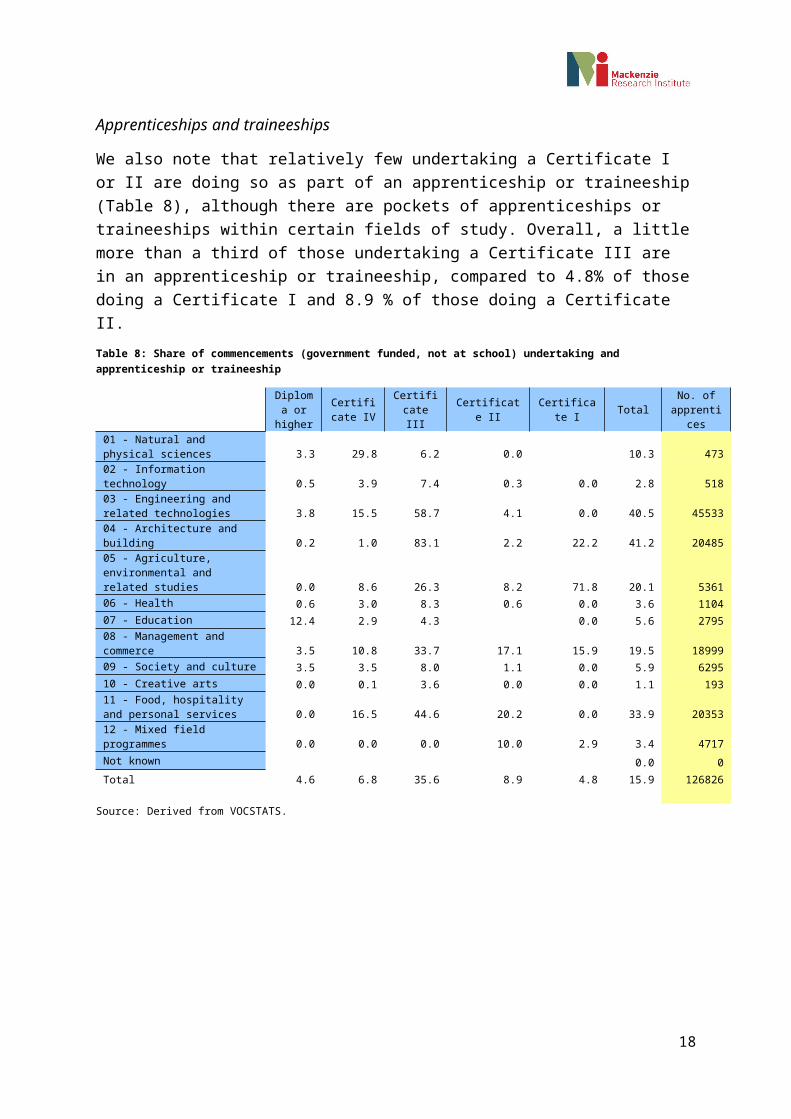
Figure 5: Ratio of completions to commencements, not at school, government funded.
20032004
20052006
20072008
20092010
20112012
20132014
20152016
2017 (prelim
)0
102030405060
Completion ratios, not at school, government funded
Certificate I Certificate II Certificate III
Source: Derived from VOCSTATS.
We see that these simple ratios are broadly consistent with those published by the NCVER, noting that the 2017 observation should be ignored because it is based on a preliminary (and therefore incomplete) count of completions in that year. These ratios reflect the relativities of the completion rates of the NCVER (i.e. completion rates of certificates III are greater than those of certificate II which in turn are greater than those of certificate I). The main point of difference with projected completion rates of NCVER are that the ratios show a decline in completion rates between 2015 and 2016 rather than an increase. However, putting that to one side it appears that completion rates are improving over time. That said, completion rates of Certificates I and II remain very low (especially Certificates I).
18
References
Ainley, J, Buckley, S, Beavis, A, Rothman, S & Tovey, A 2011, Analysis of Year 12 or Certificate II attainment of Indigenous young people - stage 1: a report prepared for the Council of Australian Governments Reform Council, COAG Reform Council, Sydney, viewed 12 Jun 2019, <http://research.acer.edu.au/indigenous_education/25/>.
Australian Bureau of Statistics 2011, Education and Indigenous wellbeing, Australian social trends March 2011, Australian Bureau of Statistics, Sydney, viewed 12 Jun 2019, <http://www.ausstats.abs.gov.au/ausstats/subscriber.nsf/LookupAttach/4102.0Publication23.03.116/$File/41020_Indigenouseducation_Mar2011.pdf>.
Buddelmeyer, H, Leung, F & Scutella, R 2012, Educating oneself out of social exclusion, Promoting social inclusion for disadvantaged groups through education and training, NCVER, Adelaide.
Buddelmeyer, H, Polidano, C 2016, Can VET help create a more inclusive society?, Promoting social inclusion for disadvantaged groups through education and training, NCVER, Adelaide.
Cavallaro, T, Foley, P, Saunders, J & Bowman, K 2005, People with a disability in vocational education and training: a statistical compendium, NCVER VET provider collection, NCVER, Adelaide.
Conley, L, 2018, Push and pull: increasing student engagement in Developing Independence, Brotherhood of St Laurence, Fitzroy, viewed 12 Jun 2019, <https://www.bsl.org.au/research/browse-publications/push-and-pull-increasing-student-engagement-in-developing-independence/>.
Cully, M, 2005, What it’s worth: establishing the value of vocational qualifications to employers, NCVER, Adelaide.
Foley, P, Blomberg, D 2011, Pre-apprenticeship training activity, NCVER, Adelaide, viewed 12 Jun 2019, <https://www.ncver.edu.au/research-and-statistics/publications/all-publications/pre-apprenticeship-training-activity>.
Guenther, J, Falk, I & Arnott, A 2008, The role of vocational education and training in welfare to work, NCVER, Adelaide.
Jacobson, P, 2015, Reinvigorating VET: best practice in trade apprenticeships, International Specialised Skills Institute Fellowship report, International Specialised Skills Institute, Carlton, viewed 12 Jun 2019, <http://www.issinstitute.org.au/wp-content/media/2015/11/Report-Jacobson-Final-LowRes.pdf>.
Karmel T & and Liu S 2011, Which paths work for which young people? NCVER
Karmel T and Nguyen, N 2006, The value of completing a vocational education and training qualification, NCVER
19
Karmel, T & Fieger, P 2012, The value of completing a VET qualification, NCVER, Adelaide
Lim P & Karmel, T 2011, The vocational equivalent to Year 12, NCVER.
National Centre for Vocational Education Research 2011, Australian vocational education and training statistics: student intentions 2011, NCVER, Adelaide.
National Centre for Vocational Education Research 2017, Australian vocational education and training statistics: VET program completion rates 2011-15, NCVER, Adelaide.
Oliver, D, 2012, Lower-level qualifications as a stepping stone for young people, NCVER occasional paper, NCVER, Adelaide.
Oliver, D, 2014, 'Lower level qualifications as a stepping stone for young people', Australian Journal of Labour Economics, vol.17, no.1, pp.15–33, viewed 12 Jun 2019, <http://business.curtin.edu.au/wp-content/uploads/sites/5/2016/04/AJLE-v17n1-Oliver.pdf>.
Retail and Personal Services Training Council 2014, Retail, floristry, fast food: traineeship survey 2014, RAPS Training Council, [Osborne Park].
Shah, C, Long, M, Perkins, K & Brown, J 2015, Role of lower-level qualifications in Australia’s vocational education and training system, CEET, Melbourne, viewed 12 Jun 2019, <https://web.archive.org/web/20170301012203/http://www.vista.org.au/documents/item/2768>.
Stanwick, J, 2006, Australian Qualifications Framework lower-level qualifications: outcomes for people over 25, NCVER, Adelaide.
Stanwick, J, Guthrie, H 2005, 'AQF lower level qualifications: pathways to where?', AVETRA, [Nowra]. paper presented at the 8th Australian Vocational Education and Training Research Association Conference.
Stanwick, J, National Centre for Vocational Education Research 2005, Australian Qualifications Framework lower-level qualifications: pathways to where for young people?, NCVER, Adelaide.
Training Agenda 2005, 'Cultural qualifications lift educational opportunities', Training Agenda, vol.12, no.4, pp.21–22.
Woods, D, 2008, 'The impact of VET on transition to work for young people in Australia', Education + Training, vol.50, no.6, pp.465–473.
20