Embed Size (px)
Citation preview
Martin O’Malley, Governor | Anthony G. Brown, Lt. Governor | Robert M. Summers, Ph.D., Acting Secretary
Changes in Regional Ozone Patterns
Duc Nguyen, Senior Meteorologist
Presented at:MARAMA Data Analysis Workshop
College Park, MDJanuary 19-20, 2011

p. 2
OBJECTIVEDeliver Good
News on Regional Ozone Trends.
Seek Help on Surrogates to Represent Mobile Emissions.
OUTLINE Air Quality Cycle EGU Emissions Mobile-Source Emissions Pre/Post NOx Controls
Comparison Impact of Bermuda High
& Polar Jet Patterns Outlook for 2011 Summary

p. 3
Maryland 8-Hour Ozone Exceedances vs. 90° Days at BWI
90 D
egre
e D
ays
0
20
40
60
80
100
1980 1982 1984 1986 1988 1990 1992 1994 1996 1998 2000 2002 2004 2006 2008 2010
Num
ber o
f Day
s
Ozo
ne E
xcee
danc
e D
ays
0
20
40
60
80
100
1980 1982 1984 1986 1988 1990 1992 1994 1996 1998 2000 2002 2004 2006 2008 2010
Num
ber o
f Day
sMaryland 8-Hour Ozone Exceedances Days
vs. 90° Days at BWI
3 years 5 years 3 years 4 years 4 years 3 years 5 years 3+ years
2010 data are preliminary.

p. 4
Ozone Exceedance Days
-2.5
-1.5
-0.5
0.5
1.5
2.5
1980 1982 1984 1986 1988 1990 1992 1994 1996 1998 2000 2002 2004 2006 2008 2010
Sta
ndar
dize
d D
epar
ture
90 Degree Days
-2.5
-1.5
-0.5
0.5
1.5
2.5
1980 1982 1984 1986 1988 1990 1992 1994 1996 1998 2000 2002 2004 2006 2008 2010
Sta
ndar
dize
d D
epar
ture
Ozone Exceedance Days and 90° Day Cycle
Maryland’s 8-hour ozone exceedance days (OEDs) and 90° F days at BWI follow a periodic cycle through 2002 (R = 0.68).
OEDs below normal since 2002 regardless of temperature data. Air quality improvements have bee driven by effective control strategies
Nguyen & Wooodman (2008).

p. 5
Controls in Action …Ozone Season NOx Emissions
Figures extracted from EPA’s Clean Air Interstate Rule 2009 Progress Reports.
Compared to 1990 emissions, ozone season NOx emissions cut by 61% in 2003-2004.
NOx emissions decreased 77% by 2008 and 82% by 2009 (for units covered by CAIR).
p. 6
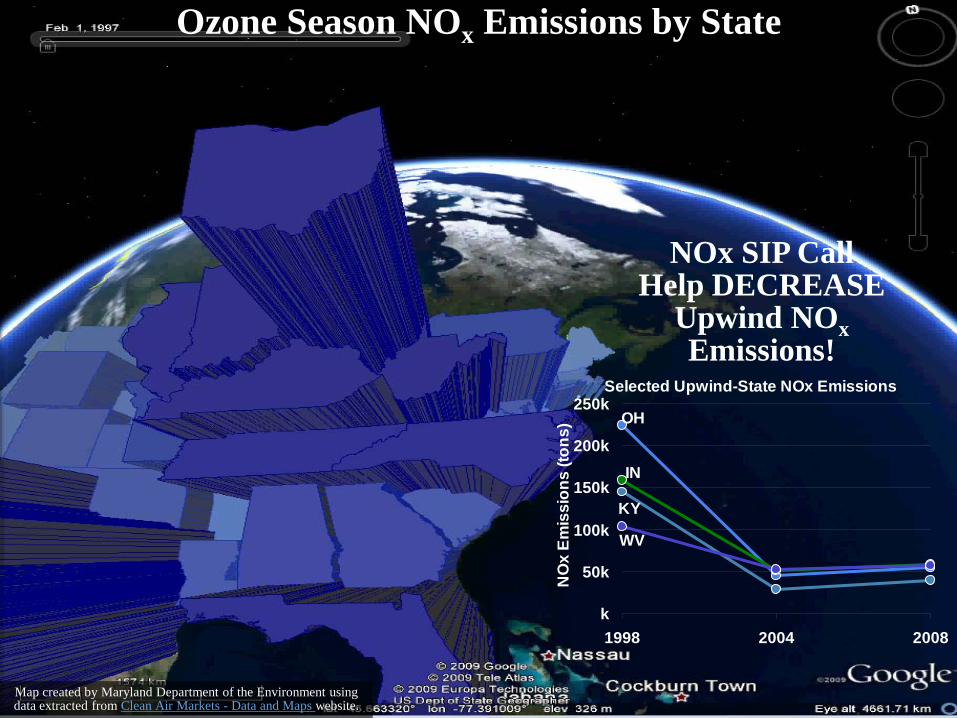
NOx SIP CallHelp DECREASE
Upwind NOxEmissions!
Ozone Season NOx Emissions by State
Map created by Maryland Department of the Environment using data extracted from Clean Air Markets - Data and Maps website.
Selected Upwind-State NOx Emissions
OH
IN
KY
WV
k
50k
100k
150k
200k
250k
1998 2004 2008
NO
x Em
issi
ons
(tons
)

p. 7
Characteristics of AQ Cycle
EXCEEDANCE TENDENCY
More Days(Orange and Red)
Above Normal(Shades of Red) Warmer Weather
Near Average(Gray)
Near Normal(White) Near Normal
Less Days(Green and Blue)
Below Normal(Shades of Blue) Cooler Weather
UPPER-LEVELPRESSURE/HEIGHT
CORESSPONDINGSFC TEMPERATURE
Rem
ark These characteristics can be observed
spatially and temporally.
p. 8
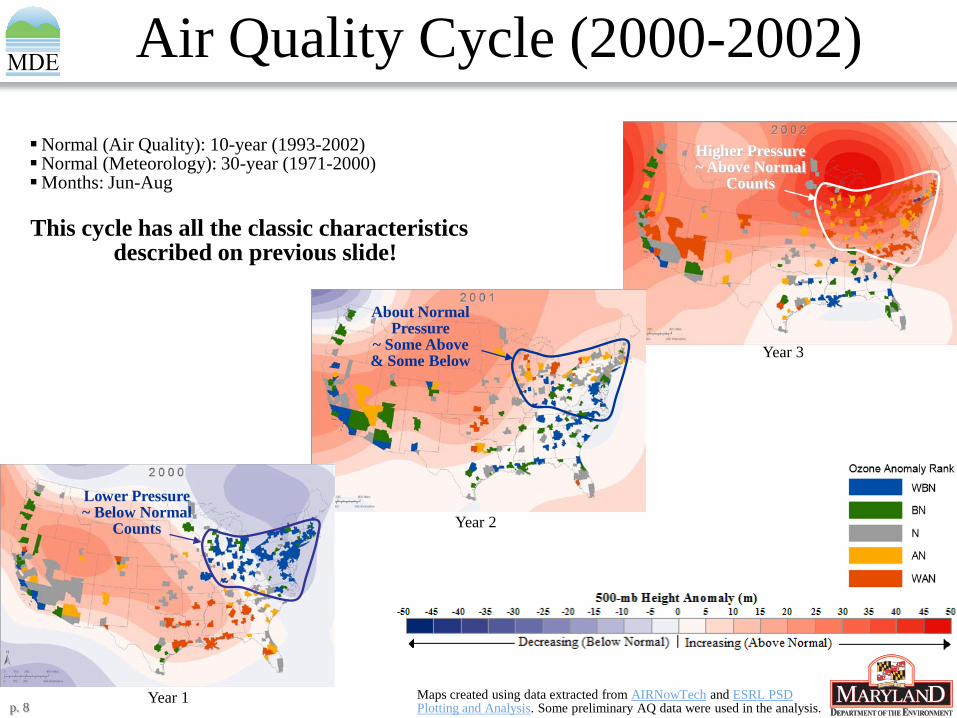
Higher Pressure~ Above Normal
Counts
Year 3
Air Quality Cycle (2000-2002)Normal (Air Quality): 10-year (1993-2002)Normal (Meteorology): 30-year (1971-2000)Months: Jun-Aug
Year 2
About Normal Pressure
~ Some Above& Some Below
Year 1
Lower Pressure~ Below Normal
Counts
This cycle has all the classic characteristics described on previous slide!
Maps created using data extracted from AIRNowTech and ESRL PSDPlotting and Analysis. Some preliminary AQ data were used in the analysis.

p. 9
Slightly Below Normal &
Normal PressureBUT Many Below
Normal CountsHigher Pressure
BUT Many Below Normal Counts
Lower Pressure~ Below Normal
Counts
Air Quality Cycle (2003-2007)
Relationshipstarting
to break …
Relationship broke down …
Slightly Lower Pressure
~ Below Normal Counts
Normal & Higher Pressure
BUT Many Below Normal Counts
Analysis in 2008 indicated that air quality improvements have been driven by effective control strategies (e.g. NOx SIP Call)!
Maps created using data extracted from AIRNowTech and ESRL PSDPlotting and Analysis. Some preliminary AQ data were used in the analysis.

p. 10
Pre/Post NOx SIP Call OEDs(Baltimore, MD MSA)
8-Hour Ozone Exceedance Days (Jun-Aug)
0
10
20
30
40
50
60
1993 1994 1995 1996 1997 1998 1999 2000 2001 2002 2003 2004 2005 2006 2007 2008 2009 2010
Num
ber o
f Day
s
Pre NOx SIP Call OEDs
Post NOx SIP Call OEDs
Some preliminary data are included.

p. 11
Pre/Post NOx SIP Call OEDs(Washington, DC-MD-VA-WV MSA)
8-Hour Ozone Exceedance Days (Jun-Aug)
0
10
20
30
40
50
60
1993 1994 1995 1996 1997 1998 1999 2000 2001 2002 2003 2004 2005 2006 2007 2008 2009 2010
Num
ber o
f Day
s
Pre NOx SIP Call OEDs
Post NOx SIP Call OEDs
Some preliminary data are included.

p. 12
Pre/Post NOx SIP Call OEDs(Philadelphia, PA-NJ MSA)
8-Hour Ozone Exceedance Days (Jun-Aug)
0
10
20
30
40
50
60
1993 1994 1995 1996 1997 1998 1999 2000 2001 2002 2003 2004 2005 2006 2007 2008 2009 2010
Num
ber o
f Day
s
Pre NOx SIP Call OEDs
Post NOx SIP Call OEDs
Some preliminary data are included.

p. 13
Pre/Post NOx SIP Call OEDs(Boston, MA-NH MSA)
8-Hour Ozone Exceedance Days (Jun-Aug)
0
10
20
30
40
50
60
1993 1994 1995 1996 1997 1998 1999 2000 2001 2002 2003 2004 2005 2006 2007 2008 2009 2010
Num
ber o
f Day
s
Pre NOx SIP Call OEDsPost NOx SIP Call OEDs
Periphery of I-95 Ozone Plume
Some preliminary data are included.

p. 14
Pre/Post NOx SIP Call OEDs(Columbus, OH MSA)
8-Hour Ozone Exceedance Days (Jun-Aug)
0
10
20
30
40
50
60
1993 1994 1995 1996 1997 1998 1999 2000 2001 2002 2003 2004 2005 2006 2007 2008 2009 1020
Num
ber o
f Day
s Pre NOx SIP Call OEDs
Post NOx SIP Call OEDs
Upwind of Maryland and OTC States
Some preliminary data are included.

p. 15
Higher Pressure~ Above Normal
Counts
Lower Pressure~ Below Normal
Counts
Slightly Lower Pressure
but Some Normal& Above Normal
Counts
Slightly Below Normal & Above Normal
Pressure~ Normal and Above
Normal Counts
Air Quality Cycle (2003-2007)(Adjusted for Recent Data)
Relationshipis now intact!
Relationship is restored after adjustments for recent data …
Normal & Above Normal Pressure~ Normal/BelowNormal (North)
Above Normal (South)
Next Step: Compare ozone exceedances pre/post NOx SIP Call to estimate its effectiveness.
Maps created using data extracted from AIRNowTech and ESRL PSDPlotting and Analysis. Some preliminary AQ data were used in the analysis.
p. 16
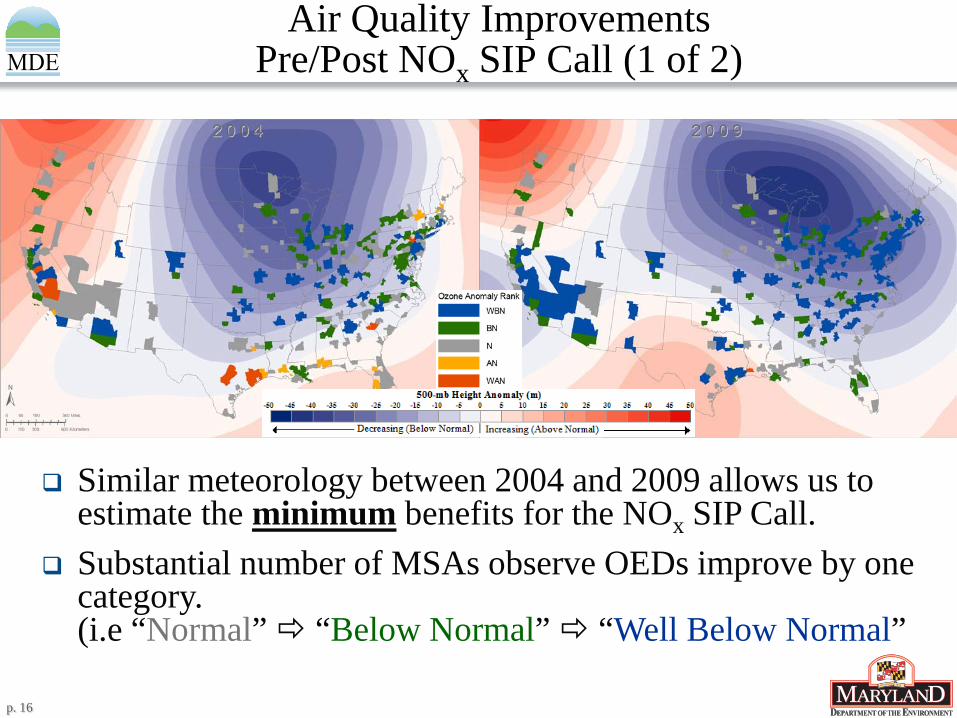
Air Quality ImprovementsPre/Post NOx SIP Call (1 of 2)
Similar meteorology between 2004 and 2009 allows us to estimate the minimum benefits for the NOx SIP Call.
Substantial number of MSAs observe OEDs improve by one category.(i.e “Normal” “Below Normal” “Well Below Normal”

p. 17
Air Quality ImprovementsPre/Post NOx SIP Call (2 of 2)
East of Mississippi experienced reduction of 30% or more in OEDs (highest reductions in rural settings). 7 MSAs increase in OEDs but small averages and mainly located west of Mississippi. Need another round of EMISSION REDUCTIONS to help OTC states and major cities attain
new stringent ozone standard.Maps were created using preliminary data extracted from AIRNowTech.

p. 18
Cycle Since 2008Below Normal Pressure
~ Normal/BelowNormal Counts
Well Below Normal Pressure~ Below Normal Counts
Data suggest that 2008 and 2009 were the beginning of a new cycle consisting of 2 beginning low years.
2010 data were below normal despite of ozone conducive meteorology.
More research needed!Under estimation benefits of controls?Changes in mobile source emissions?
Above Normal PressureYET
Below Normal Counts

p. 19
US Vehicle-Miles Traveled (VMT)(Surrogate #1 for Mobile Emissions)Monthly VMT
0
40
80
120
160
200
240
280
1990 1992 1994 1996 1998 2000 2002 2004 2006 2008 2010
Billions
Steady Increase 1990-2003Fairly Constant
Post-2004
VMT During Summer Months (April - September)
0
200
400
600
800
1000
1200
1400
1600
1990 1992 1994 1996 1998 2000 2002 2004 2006 2008 2010
Billions
Steady Increase 1990-2003Fairly Constant
Post-2004
Steady increase 1990-2003Fairly constant post-2004 period.No significant differences in VMT
post-2004 summers.Tier 2 Vehicle and Gasoline
Program implemented 2004 (reduced mobile emissions should have occurred by 2010).
More DATA & research needed!
VMT Post-2004
200
225
250
275
300
Apr May Jun Jul Aug Sep
2004 2005 2006 2007 2008 2009 2010
Billions
Data Source: RITA
p. 20
GSV for East Coast (April - September)
East Coast Total
Cental Atlantic
Lower Atlantic
New England20
40
60
80
100
120
140
1994 1996 1998 2000 2002 2004 2006 2008 2010
Million Gallons
Post-2004Tier 2 Vehicle & Gas
Gas Price HikedEconomy
Monthly GSV
U.S. Total
East Coast
Midwest
Gulf CoastRocky Mountain
West Coast10
20
30
40
50
60
70
1983 1985 1987 1989 1991 1993 1995 1997 1999 2001 2003 2005 2007 2009
Million Gallons
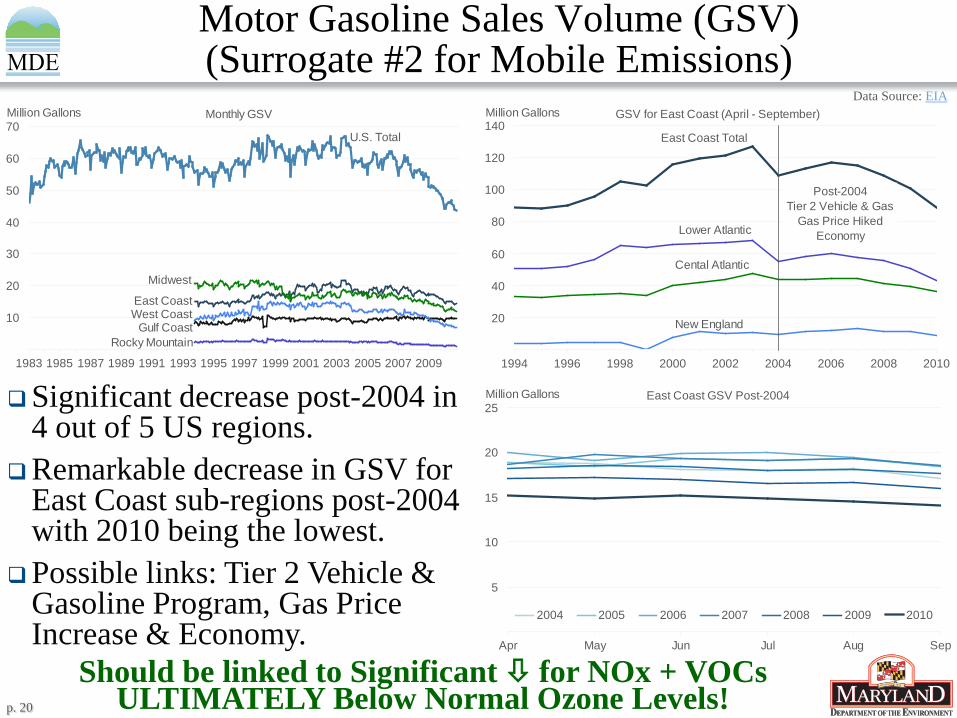
Motor Gasoline Sales Volume (GSV)(Surrogate #2 for Mobile Emissions)
East Coast GSV Post-2004
5
10
15
20
25
Apr May Jun Jul Aug Sep
2004 2005 2006 2007 2008 2009 2010
Million GallonsSignificant decrease post-2004 in 4 out of 5 US regions.
Remarkable decrease in GSV for East Coast sub-regions post-2004 with 2010 being the lowest.
Possible links: Tier 2 Vehicle & Gasoline Program, Gas Price Increase & Economy.
Should be linked to Significant for NOx + VOCsULTIMATELY Below Normal Ozone Levels!
Data Source: EIA

p. 21
Large-Scale Circulations
Source: http://www.suu.edu/faculty/colberg/Hazards/Weather/04_GlobalWind.swf
Large-scale circulation creates strong subsidence around 30 N.
Subsidence creates semi-permanent Subtropical highs at the surface around the globe.
Over the Atlantic Ocean, it’s referred to as “Azores / Bermuda High.”
Strength of High increases with height.

p. 22
Bermuda High: Classic Mid-AtlanticAir Pollution Weather

p. 23
Shifting of Bermuda HighDuring Low vs High Ozone Seasons
Bermuda Highis Responsible for Wind
Flow & PollutionTransport Patterns
in Marylandand the Mid-Atlantic.

p. 24
Outlook for 2011
ENCEP coupled forecast system model (CFS) predicts strong Cool ENSO (La Niña) conditions to persist through 2011 summer.
Other dynamical & statistical models favor Cool ENSO (La Niña) for 2011 summer. If forecast verifies, the Mid-Atlantic region will likely be experiencing below normal
temperatures and/or wet conditions during the 2011 summer air quality season.
Sources: CFS Seasonal Climate Forecasts | IRI ENSO Quicklook
Tendency for (normal or below normal)ozone exceedance days for summer 2011.
p. 25
Summary (1 of 2)Maryland OEDs can be broken down into 3-5 year periods, trending
with the 90 degree days cycle to minimize the year-to-year fluctuations in meteorology. OEDs by each period showed continuous improvements. Significant improvements are observed after implementation of a large-scale multi-state NOx control program (NOxSIP Call). As much as 30-90% reductions in OEDs are observed in MSAs
across the eastern U.S post NOx SIP Call. Significant AQ improvements require that AQ Cycle post 2002 be
adjusted for trends in regional ozone patterns.Shifting of the Bermuda high creates fluctuations in seasonal weather
patterns and combined with reduced emissions causes changes in regional ozone patterns. At the surface, the Appalachian lee-side trough is enhanced along the
I-95 corridor during high pollution years, indicating short and mid-range transport patterns from south/southwest are pronounced.
The enhanced trough line is associated with Maryland OEDs and potentially the development of the Nocturnal Low Level Jet (NLLJ).

p. 26
Summary (2 of 2)Shifting of the Bermuda high creates an anomalous high over
the upwind states (Plains, Great Lakes and Midwest) during high pollution years. On average, the anomalous high is 3.5 deg F warmer for a column of
air from the surface to 850-mb level and results in high ozone production in upwind states.
The enhanced ozone concentrations during high pollution years in the Mid-Atlantic and Northeast are driven by local pollutant sources and to a greater extend transported pollution.
Below normal ozone exceedance days in the East in 2010 despite the conducive ozone weather conditions are likely linked to low mobile source emissions (possibly the lowest on record since motor gasoline sale volume [MGV] was at its lowest) and lowest power plants emissions to date.
Need NATIONAL control programs on top of local controls to attain a more stringent 8-hour standard!

p. 27
Contact
Duc NguyenSenior Meteorologist
Ambient Air Monitoring ProgramAir and Radiation Management Administration
Maryland Department of the Environment1800 Washington Boulevard | Baltimore, MD 21230
410-537-3000 | TTY Users: 1-800-735-2258www.mde.state.md.us
Martin O’Malley, Governor | Anthony G. Brown, Lt. Governor | Robert M. Summers, Ph.D., Acting Secretary

p. 28
References1. AIRNowTech | National real-time repository of real-time air quality data provided by EPA AIRNow
program (http://www.airnowtech.org).2. CFS Seasonal Climate Forecasts web site
(http://www.cpc.noaa.gov/products/people/wwang/cfs_fcst/).3. Clean Air Interstate Rule 2009 Progress Reports
(http://www.epa.gov/airmarkets/progress/CAIR_09/CAIR09.html).4. Clean Air Markets | Data and Maps web site (http://camddataandmaps.epa.gov/gdm/).5. Global wind animation (http://www.suu.edu/faculty/colberg/Hazards/Weather/04_GlobalWind.swf).6. IRI ENSO Quicklook web site (http://iri.columbia.edu/climate/ENSO/currentinfo/QuickLook.html).7. Interactive plotting and analysis pages by ESRL / PSD / CDC (http://www.esrl.noaa.gov/psd/cgi-
bin/data/getpage.pl).8. Nguyen & Woodman (2008). Air Quality Variability in Maryland due to Climate Cycles and
Emissions. Retrieved from AIRNow NAQ web site: http://www.epa.gov/airnow/2008conference/Forecasting/Tuesday/nguyen_aqvariability.pdf.
9. RITA | BTS | U.S. Highway Vehicle-Miles Traveled (http://www.bts.gov/publications/key_transportation_indicators/december_2010/html/highway_vehicle_miles_traveled.html).
10. U.S. Energy Information Administration | Prime Supplier Sales Volumes (http://www.eia.gov/dnav/pet/pet_cons_prim_a_EPM0_P00_Mgalpd_m.htm).
11. U.S. Energy Information Administration | Refined Motor Gasoline Sales Volumes (http://www.eia.doe.gov/dnav/pet/pet_cons_refmg_a_EPM0_VTR_mgalpd_m.htm).
12. U.S. Energy Information Administration | Retail Gasoline Historical Prices (http://www.eia.doe.gov/petroleum/data_publications/wrgp/mogas_history.html).

p. 29
Extra Slides
Extra slides related to mobile emissions.

p. 30
Weekly Gas PricesWeekly Gas Price (All Grades)
0
1
2
3
4
5
1993 1995 1997 1999 2001 2003 2005 2007 2009
Total U.S.East CoastMidWestRocky MountainWest Coast
$
Gas Price Hiked!
Data Source: EIA

p. 31
Motor Gasoline Sales Volume (GSV)for Selected States
Monthly GSV
1
2
3
4
1994 1996 1998 2000 2002 2004 2006 2008 2010Delaware District of Columbia MarylandNew Jersey New York Pennsylvania
Million GallonsData Source: EIA

p. 32
PSV for East Coast (April - September)
East Coast Total
Central Atlantic
Lower Atlantic
New England100
200
300
400
500
600
700
800
900
1983 1985 1987 1989 1991 1993 1995 1997 1999 2001 2003 2005 2007 2009
Million GallonsMonthly PSV
U.S. Total
East Coast
Midwest
Gulf CoastRocky Mountain
West Coast50
100
150
200
250
300
350
400
1983 1985 1987 1989 1991 1993 1995 1997 1999 2001 2003 2005 2007 2009
Million Gallons
Prime Supplier Sales Volumes of Motor Gasoline (PSV)Data Source: EIA
PSV for Selected States (April - September)
DEDC
MD
NJ
PA
VA
WV
25
50
75
100
1983 1985 1987 1989 1991 1993 1995 1997 1999 2001 2003 2005 2007 2009
Million Gallons East Coast PSV Post-2004
25
50
75
100
125
150
Apr May Jun Jul Aug Sep
2004 2005 2006 2007 2008 2009 2010
Million Gallons