Embed Size (px)
Citation preview

ABSTRACT: As a follow-up activity to the APS 2015 Statement on Earth’s Changing Climate, the Society is conducting this internal analysis of its greenhouse gas inventory. As the first professional scientific society to broadly evaluate its emissions for public posting, APS provides leadership on climate change and establishes a precedent for other societies to follow.
APS GHG Inventory
2015 Assessment
Scopes 1 & 2
1
APS 2015 Carbon Inventory Assessment
Overview: Thousands of companies annually report their greenhouse gas (GHG) emissions with goals of improving transparency, increasing efficiencies, reducing costs, and helping manage risks that arise from climate change. As an initial follow-up activity to the American Physical Society (APS)’s 2015 Statement on Earth’s Changing Climate, the Society is conducting an internal analysis of its daily operations and select associated activities to determine its 2015 GHG inventory, which is also often referred to as a carbon footprint. This assessment is the first by APS and is intended to be an ongoing activity. As the first professional scientific society to broadly evaluate its GHG inventory, APS has the opportunity to provide leadership on climate change and establish a precedent for other societies to follow. Process: The GHG Inventory Advisory Committee, which includes Bill McCurdy (chair), Bill Barletta, Robert Jaffe, Dan Dahlberg, James Taylor (APS COO), Mark Doyle (APS CTO), Francis Slakey (Director of the APS Office of Public Affairs), and Mark Elsesser (Senior Policy Analyst at the APS Office of Public Affairs), manages APS’s 2015 GHG Inventory project. The Committee is overseen by the Panel on Public Affairs – an APS Council-elected body – and reports directly to the APS CEO, Kate Kirby. During the project, the Committee has been supported by Anthesis, a global specialist consultancy skilled in GHG inventory development. Anthesis is assisting APS in determining its 2015 GHG inventory and is helping develop the tools and institutional knowledge necessary for APS to conduct its own GHG inventory going forward. APS’s 2015 GHG inventory is being developed according to The Climate Registry (TCR)’s well-established and industry-recognized standards. The Climate Registry is a community of nearly 300 public and private organizations and 60 states and provinces from across North America bound by a common goal – to measure and manage GHG inventories in a high quality, consistent way in order to lessen the impacts of climate change. Background: In recent years, corporations and organizations have begun determining the environmental impact of their businesses by measuring their GHG inventory – the total sets of greenhouse gas emissions caused by an organization, event, product or person. TCR has drawn from existing GHG programs and protocols, including the World Resources Institute and the World Business Council for Sustainable Development’s GHG Protocol Corporate Accounting and Reporting Standard, to develop its General Reporting Protocol (GRP), which embodies GHG accounting best practices. GRP divides GHG emissions into three
2
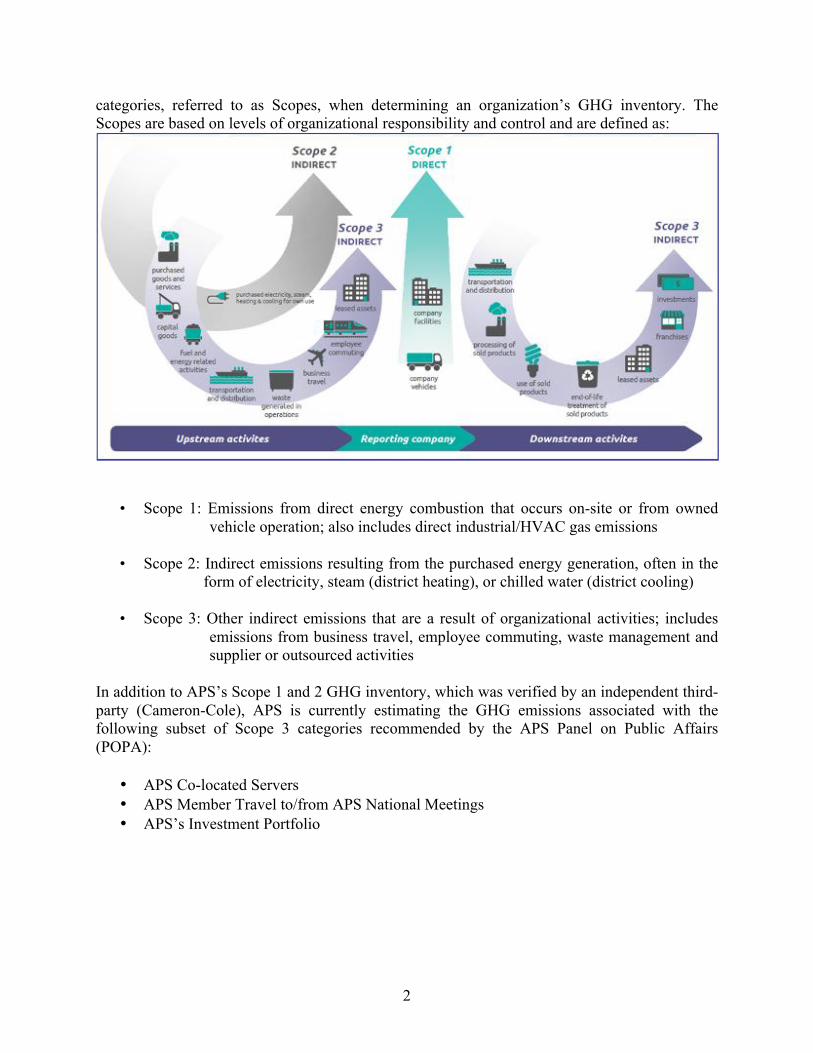
categories, referred to as Scopes, when determining an organization’s GHG inventory. The Scopes are based on levels of organizational responsibility and control and are defined as:
• Scope 1: Emissions from direct energy combustion that occurs on-site or from owned vehicle operation; also includes direct industrial/HVAC gas emissions
• Scope 2: Indirect emissions resulting from the purchased energy generation, often in the form of electricity, steam (district heating), or chilled water (district cooling)
• Scope 3: Other indirect emissions that are a result of organizational activities; includes emissions from business travel, employee commuting, waste management and supplier or outsourced activities
In addition to APS’s Scope 1 and 2 GHG inventory, which was verified by an independent third-party (Cameron-Cole), APS is currently estimating the GHG emissions associated with the following subset of Scope 3 categories recommended by the APS Panel on Public Affairs (POPA):
• APS Co-located Servers • APS Member Travel to/from APS National Meetings • APS’s Investment Portfolio
3
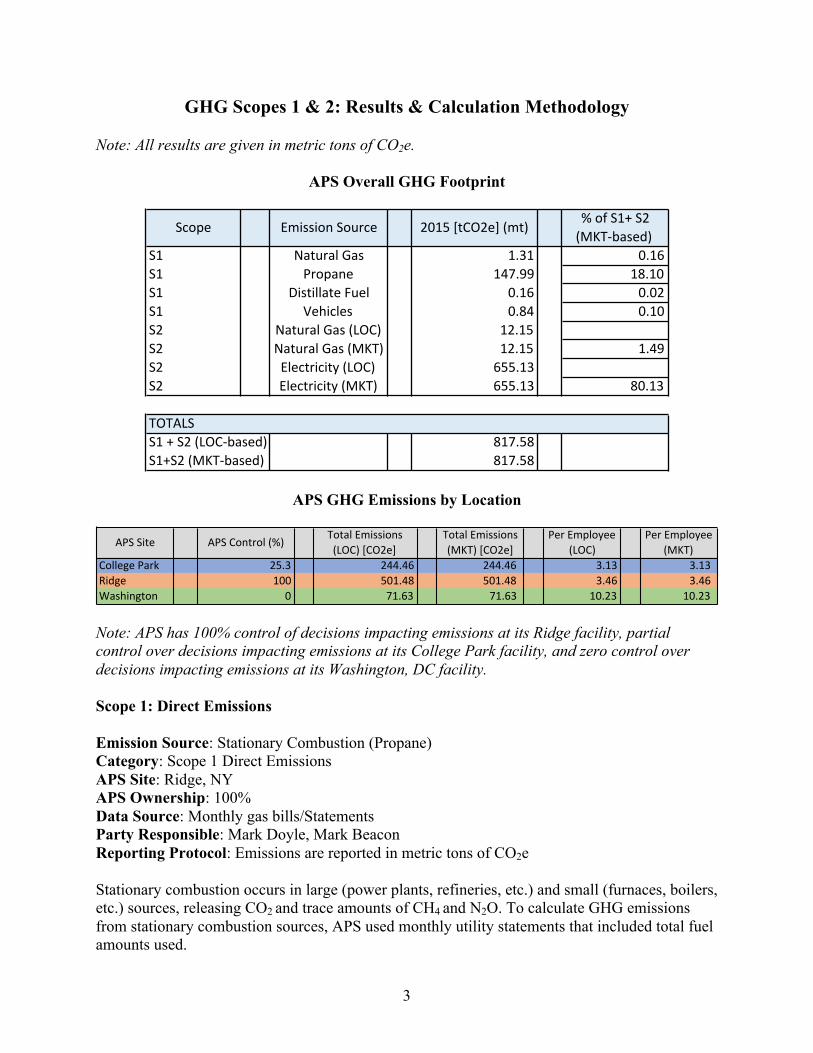
GHG Scopes 1 & 2: Results & Calculation Methodology Note: All results are given in metric tons of CO2e.
APS Overall GHG Footprint
APS GHG Emissions by Location
Note: APS has 100% control of decisions impacting emissions at its Ridge facility, partial control over decisions impacting emissions at its College Park facility, and zero control over decisions impacting emissions at its Washington, DC facility. Scope 1: Direct Emissions Emission Source: Stationary Combustion (Propane) Category: Scope 1 Direct Emissions APS Site: Ridge, NY APS Ownership: 100% Data Source: Monthly gas bills/Statements Party Responsible: Mark Doyle, Mark Beacon Reporting Protocol: Emissions are reported in metric tons of CO2e Stationary combustion occurs in large (power plants, refineries, etc.) and small (furnaces, boilers, etc.) sources, releasing CO2 and trace amounts of CH4 and N2O. To calculate GHG emissions from stationary combustion sources, APS used monthly utility statements that included total fuel amounts used.
Scope EmissionSource 2015[tCO2e](mt) %ofS1+S2(MKT-based)
S1 NaturalGas 1.31 0.16S1 Propane 147.99 18.10S1 DistillateFuel 0.16 0.02S1 Vehicles 0.84 0.10S2 NaturalGas(LOC) 12.15S2 NaturalGas(MKT) 12.15 1.49S2 Electricity(LOC) 655.13S2 Electricity(MKT) 655.13 80.13
TOTALSS1+S2(LOC-based) 817.58S1+S2(MKT-based) 817.58
APSSite APSControl(%) TotalEmissions(LOC)[CO2e]
TotalEmissions(MKT)[CO2e]
PerEmployee(LOC)
PerEmployee(MKT)
CollegePark 25.3 244.46 244.46 3.13 3.13Ridge 100 501.48 501.48 3.46 3.46Washington 0 71.63 71.63 10.23 10.23
4
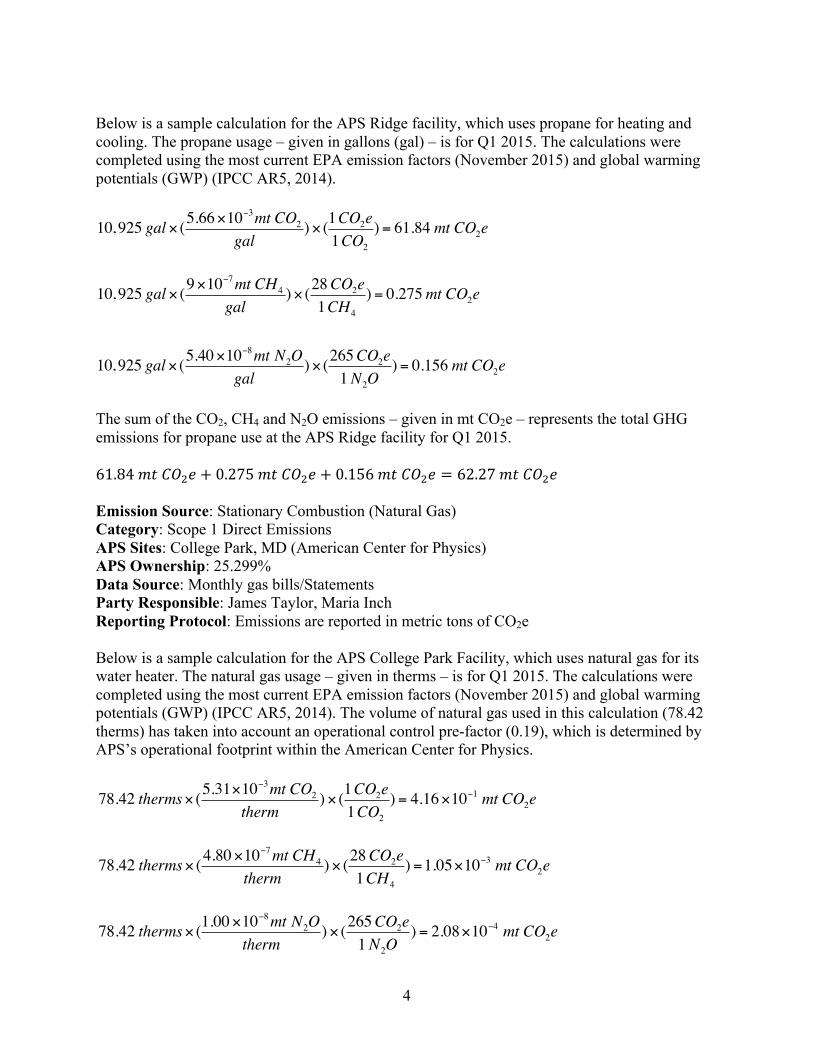
Below is a sample calculation for the APS Ridge facility, which uses propane for heating and cooling. The propane usage – given in gallons (gal) – is for Q1 2015. The calculations were completed using the most current EPA emission factors (November 2015) and global warming potentials (GWP) (IPCC AR5, 2014).
10,925 gal × (5.66×10−3mt CO2
gal)× (1CO2e
1CO2
) = 61.84 mt CO2e
10,925 gal × (9×10−7mt CH4
gal)× (28CO2e
1CH4
) = 0.275mt CO2e
10,925 gal × (5.40×10−8mt N2Ogal
)× (265CO2e1N2O
) = 0.156 mt CO2e
The sum of the CO2, CH4 and N2O emissions – given in mt CO2e – represents the total GHG emissions for propane use at the APS Ridge facility for Q1 2015. 61.84 𝑚𝑡 𝐶𝑂!𝑒 + 0.275 𝑚𝑡 𝐶𝑂!𝑒 + 0.156 𝑚𝑡 𝐶𝑂!𝑒 = 62.27 𝑚𝑡 𝐶𝑂!𝑒 Emission Source: Stationary Combustion (Natural Gas) Category: Scope 1 Direct Emissions APS Sites: College Park, MD (American Center for Physics) APS Ownership: 25.299% Data Source: Monthly gas bills/Statements Party Responsible: James Taylor, Maria Inch Reporting Protocol: Emissions are reported in metric tons of CO2e Below is a sample calculation for the APS College Park Facility, which uses natural gas for its water heater. The natural gas usage – given in therms – is for Q1 2015. The calculations were completed using the most current EPA emission factors (November 2015) and global warming potentials (GWP) (IPCC AR5, 2014). The volume of natural gas used in this calculation (78.42 therms) has taken into account an operational control pre-factor (0.19), which is determined by APS’s operational footprint within the American Center for Physics.
78.42 therms× (5.31×10⁻³mt CO2
therm)× (1CO2e
1CO2
) = 4.16×10⁻¹ mt CO2e
78.42 therms× (4.80×10⁻⁷mt CH4
therm)× (28CO2e
1CH4
) =1.05×10⁻³ mt CO2e
78.42 therms× (1.00×10⁻⁸mt N2O
therm)× (265CO2e
1N2O) = 2.08×10⁻⁴ mt CO2e
5
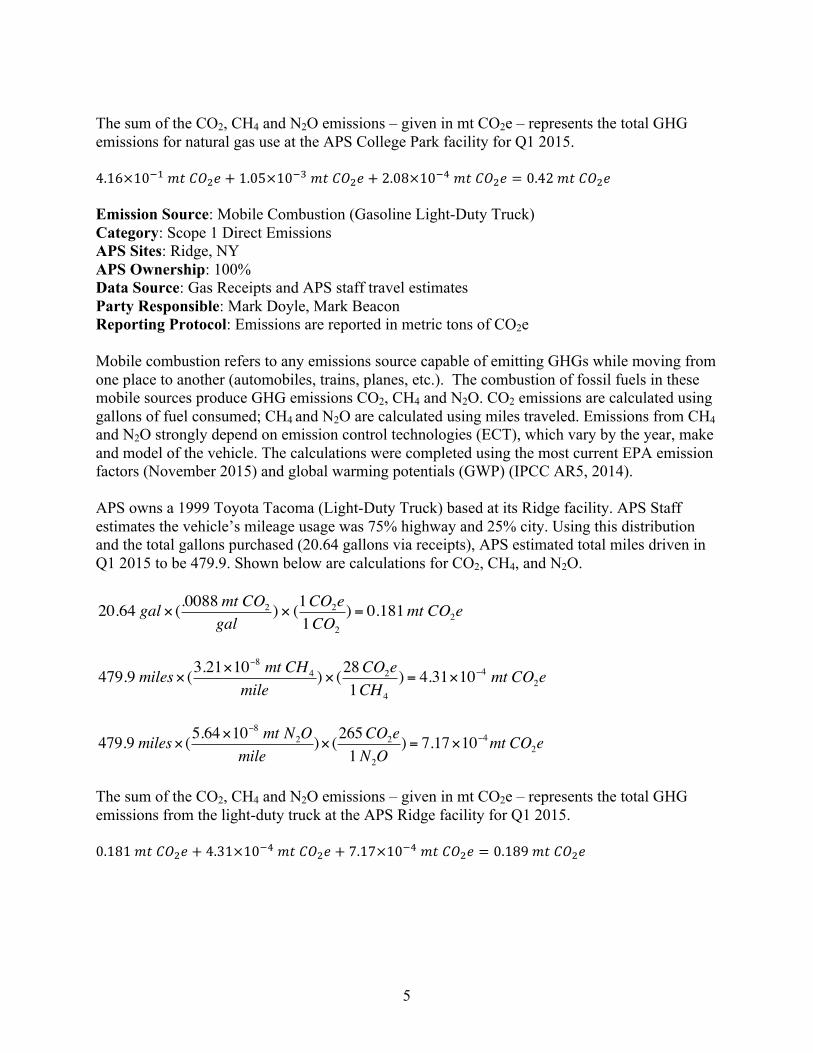
The sum of the CO2, CH4 and N2O emissions – given in mt CO2e – represents the total GHG emissions for natural gas use at the APS College Park facility for Q1 2015. 4.16×10!! 𝑚𝑡 𝐶𝑂!𝑒 + 1.05×10!! 𝑚𝑡 𝐶𝑂!𝑒 + 2.08×10!! 𝑚𝑡 𝐶𝑂!𝑒 = 0.42 𝑚𝑡 𝐶𝑂!𝑒 Emission Source: Mobile Combustion (Gasoline Light-Duty Truck) Category: Scope 1 Direct Emissions APS Sites: Ridge, NY APS Ownership: 100% Data Source: Gas Receipts and APS staff travel estimates Party Responsible: Mark Doyle, Mark Beacon Reporting Protocol: Emissions are reported in metric tons of CO2e Mobile combustion refers to any emissions source capable of emitting GHGs while moving from one place to another (automobiles, trains, planes, etc.). The combustion of fossil fuels in these mobile sources produce GHG emissions CO2, CH4 and N2O. CO2 emissions are calculated using gallons of fuel consumed; CH4 and N2O are calculated using miles traveled. Emissions from CH4 and N2O strongly depend on emission control technologies (ECT), which vary by the year, make and model of the vehicle. The calculations were completed using the most current EPA emission factors (November 2015) and global warming potentials (GWP) (IPCC AR5, 2014). APS owns a 1999 Toyota Tacoma (Light-Duty Truck) based at its Ridge facility. APS Staff estimates the vehicle’s mileage usage was 75% highway and 25% city. Using this distribution and the total gallons purchased (20.64 gallons via receipts), APS estimated total miles driven in Q1 2015 to be 479.9. Shown below are calculations for CO2, CH4, and N2O.
20.64 gal × (.0088mt CO2
gal)× (1CO2e
1CO2
) = 0.181mt CO2e
479.9 miles× (3.21×10⁻⁸ mt CH4
mile)× (28CO2e
1CH4
) = 4.31×10⁻⁴ mt CO2e
479.9 miles× (5.64×10⁻⁸ mt N2O
mile)× (265CO2e
1N2O) = 7.17×10⁻⁴mt CO2e
The sum of the CO2, CH4 and N2O emissions – given in mt CO2e – represents the total GHG emissions from the light-duty truck at the APS Ridge facility for Q1 2015. 0.181 𝑚𝑡 𝐶𝑂!𝑒 + 4.31×10!! 𝑚𝑡 𝐶𝑂!𝑒 + 7.17×10!! 𝑚𝑡 𝐶𝑂!𝑒 = 0.189 𝑚𝑡 𝐶𝑂!𝑒
6
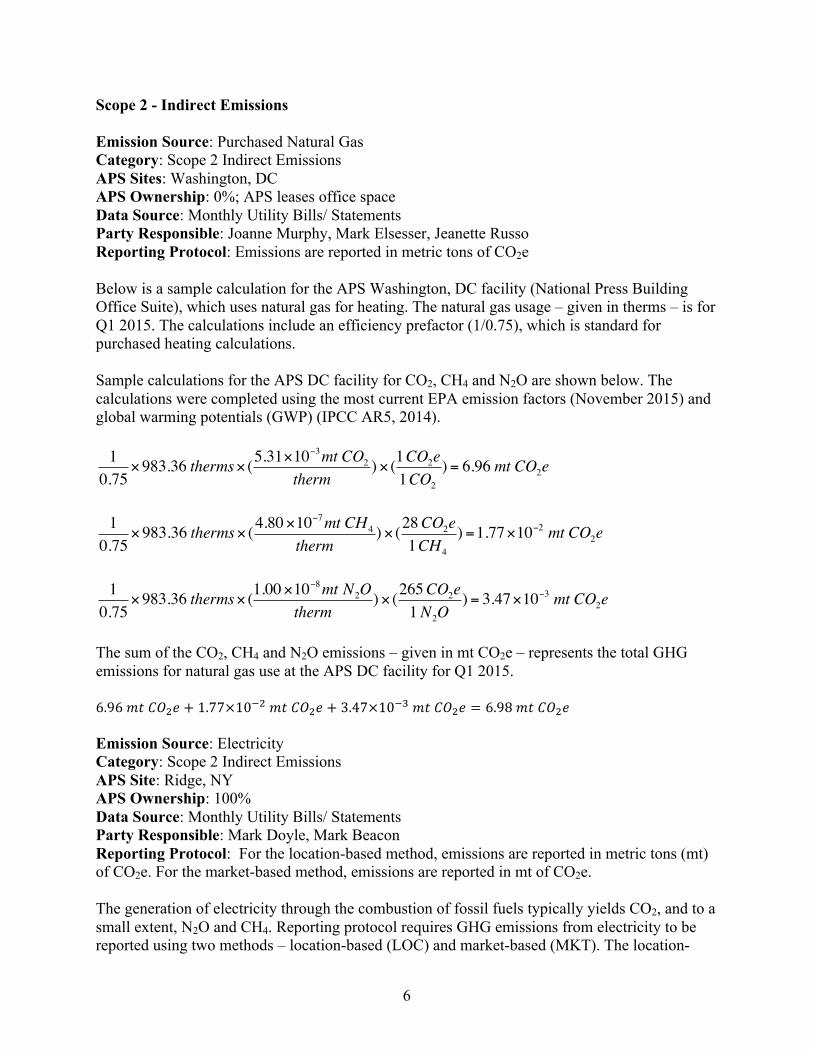
Scope 2 - Indirect Emissions Emission Source: Purchased Natural Gas Category: Scope 2 Indirect Emissions APS Sites: Washington, DC APS Ownership: 0%; APS leases office space Data Source: Monthly Utility Bills/ Statements Party Responsible: Joanne Murphy, Mark Elsesser, Jeanette Russo Reporting Protocol: Emissions are reported in metric tons of CO2e Below is a sample calculation for the APS Washington, DC facility (National Press Building Office Suite), which uses natural gas for heating. The natural gas usage – given in therms – is for Q1 2015. The calculations include an efficiency prefactor (1/0.75), which is standard for purchased heating calculations. Sample calculations for the APS DC facility for CO2, CH4 and N2O are shown below. The calculations were completed using the most current EPA emission factors (November 2015) and global warming potentials (GWP) (IPCC AR5, 2014). 10.75
×983.36 therms× (5.31×10⁻³mt CO2
therm)× (1CO2e
1CO2
) = 6.96 mt CO2e
10.75
×983.36 therms× (4.80×10⁻⁷mt CH4
therm)× (28CO2e
1CH4
) =1.77×10⁻² mt CO2e
10.75
×983.36 therms× (1.00×10⁻⁸mt N2O
therm)× (265CO2e
1N2O) = 3.47×10⁻³ mt CO2e
The sum of the CO2, CH4 and N2O emissions – given in mt CO2e – represents the total GHG emissions for natural gas use at the APS DC facility for Q1 2015. 6.96 𝑚𝑡 𝐶𝑂!𝑒 + 1.77×10!! 𝑚𝑡 𝐶𝑂!𝑒 + 3.47×10!! 𝑚𝑡 𝐶𝑂!𝑒 = 6.98 𝑚𝑡 𝐶𝑂!𝑒 Emission Source: Electricity Category: Scope 2 Indirect Emissions APS Site: Ridge, NY APS Ownership: 100% Data Source: Monthly Utility Bills/ Statements Party Responsible: Mark Doyle, Mark Beacon Reporting Protocol: For the location-based method, emissions are reported in metric tons (mt) of CO2e. For the market-based method, emissions are reported in mt of CO2e. The generation of electricity through the combustion of fossil fuels typically yields CO2, and to a small extent, N2O and CH4. Reporting protocol requires GHG emissions from electricity to be reported using two methods – location-based (LOC) and market-based (MKT). The location-
7
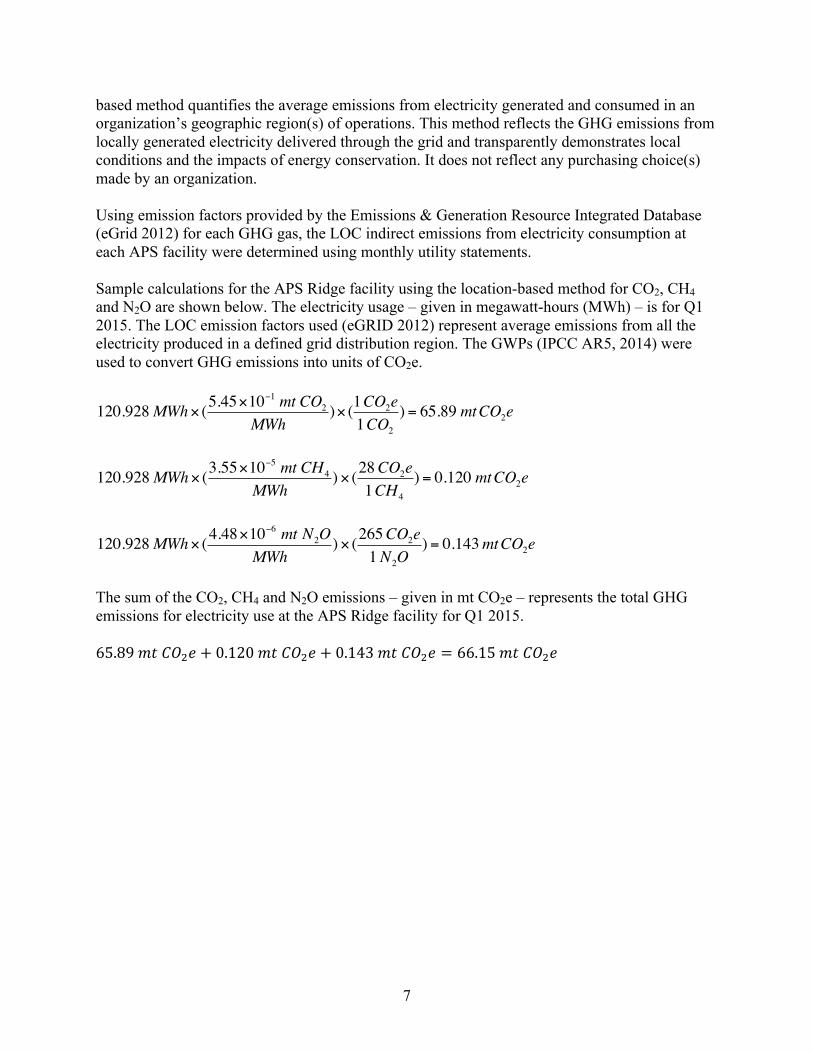
based method quantifies the average emissions from electricity generated and consumed in an organization’s geographic region(s) of operations. This method reflects the GHG emissions from locally generated electricity delivered through the grid and transparently demonstrates local conditions and the impacts of energy conservation. It does not reflect any purchasing choice(s) made by an organization. Using emission factors provided by the Emissions & Generation Resource Integrated Database (eGrid 2012) for each GHG gas, the LOC indirect emissions from electricity consumption at each APS facility were determined using monthly utility statements. Sample calculations for the APS Ridge facility using the location-based method for CO2, CH4 and N2O are shown below. The electricity usage – given in megawatt-hours (MWh) – is for Q1 2015. The LOC emission factors used (eGRID 2012) represent average emissions from all the electricity produced in a defined grid distribution region. The GWPs (IPCC AR5, 2014) were used to convert GHG emissions into units of CO2e.
120.928MWh× (5.45×10−1 mt CO2
MWh)× (1CO2e
1CO2
) = 65.89 mtCO2e
120.928MWh× (3.55×10−5 mt CH4
MWh)× (28CO2e
1CH4
) = 0.120 mtCO2e
120.928MWh× (4.48×10−6 mt N2O
MWh)× (265CO2e
1N2O) = 0.143mtCO2e
The sum of the CO2, CH4 and N2O emissions – given in mt CO2e – represents the total GHG emissions for electricity use at the APS Ridge facility for Q1 2015. 65.89 𝑚𝑡 𝐶𝑂!𝑒 + 0.120 𝑚𝑡 𝐶𝑂!𝑒 + 0.143 𝑚𝑡 𝐶𝑂!𝑒 = 66.15 𝑚𝑡 𝐶𝑂!𝑒
8
Emission Source: Electricity Category: Scope 2 Indirect Emissions APS Sites: College Park, MD (American Center for Physics) APS Ownership: 25.299% Data Source: Monthly Utility Bills/ Statements Party Responsible: James Taylor, Maria Inch Reporting Protocol: For the location-based method, emissions are reported in metric tons (mt) of CO2e. For the market-based method, emissions are reported in mt of CO2. The calculation methodologies for Scope 2 indirect emissions from electricity use at APS’s College Park facility (American Institute of Physics) were similar to those used for APS’s Ridge facility, with an additional pre-factor to reflect the facility’s co-operators. Because of its co-operation of the American Institute for Physics, APS is responsible for 19% of the electricity use for the facility, and this operational percentage is entered as an “operational control pre-factor” for the College Park facility’s electricity emission calculations. Sample calculations for the APS College Park facility using the location-based method for CO2, CH4 and N2O are shown below. The electricity usage – given in megawatt-hours (MWh) – is for Q1 2015. The pre-factor used reflects APS’s co-ownership of the facility. The LOC emission factors used (eGRID 2012) represent average emissions from all the electricity produced in a defined grid distribution region. The GWPs (IPCC AR5, 2014) were used to convert GHG emissions into units of CO2e.
0.19×1,122 MWh× (3.89×10−1 mt CH4
MWh)× (1CO2e
1CO2
) = 83.15mtCO2e
0.19×1,122 MWh× (1.20×10−5 mt CH4
MWh)× (28CO2e
1CH4
) = 0.072 mtCO2e
0.19×1,122 MWh× (5.21×10−6 mt N2O
MWh)× (265CO2e
1N2O) = 0.29 mtCO2e
The sum of the CO2, CH4 and N2O emissions – given in mt CO2e – represents the total GHG emissions for electricity use at the APS College Park facility for Q1 2015. 83.15 𝑚𝑡 𝐶𝑂!𝑒 + 0.072 𝑚𝑡 𝐶𝑂!𝑒 + 0.29 𝑚𝑡 𝐶𝑂!𝑒 = 83.51 𝑚𝑡 𝐶𝑂!𝑒 Emission Source: Electricity Category: Scope 2 Indirect Emissions APS Sites: Washington, DC Ownership: 0%; APS leases office space Data Source: Monthly Utility Bills/ Statements Party Responsible: Joanne Murphy, Mark Elsesser, Jeanette Russo Reporting Protocol: For the location-based method, emissions are reported in metric tons (mt) of CO2e. For the market-based method, emissions are reported in mt of CO2.
9
The calculation methodologies for Scope 2 indirect emissions from electricity use at APS’s Washington, DC facility (National Press Building Office Suite) were similar to those used for APS’s Ridge facility, with an additional pre-factor to reflect that office space is leased from another owner. Because it leases space, APS is responsible for its share of the building’s electricity used based on the fraction of the building its offices occupy and the building’s occupancy rate. The calculation of this pre-factor is shown below. 4,582 ft2 (APS Office)÷354,617 ft2 (Building)÷.7889 (Occupancy) =1.64×10⁻² Sample calculations for the APS DC facility using the location-based method for CO2, CH4 and N2O are shown below. The electricity usage – given in kilowatt-hours (MWh) – is for Q1 2015. The LOC emission factors used (eGRID 2012) represent average emissions from all the electricity produced in a defined grid distribution region. The Global Warming Potentials (GWPs) (from IPCC’s Fifth Assessment Report (AR5), 2014) are used to convert GHG emissions into units of CO2e.
1.64×10−2 ×1,805MWh× (3.89×10−1 mt CO2
MWh) × (1CO2e
1CO2
) =11.51mtCO2e
1.64×10−2 ×1,805MWh× (1.20×10−5 mt CH4
MWh)× (28CO2e
1CH4
) = 9.92×10⁻³ mtCO2e
1.64×10−2 ×1,805MWh× (5.21×10−6 mt N2O
MWh)× (265CO2e
1N2O) = 4.08×10⁻² mtCO2e
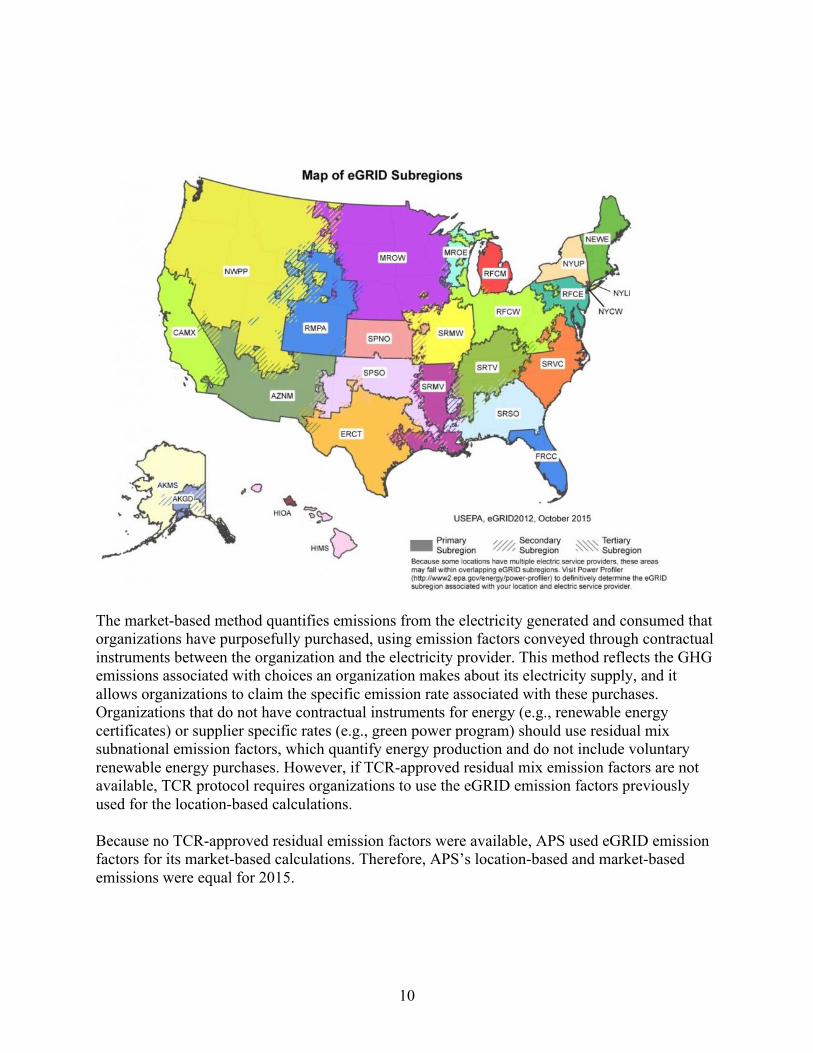
The sum of the CO2, CH4 and N2O emissions – given in mt CO2e – represents the total GHG emissions for electricity use at the APS Washington, DC facility for Q1 2015. 11.51 𝑚𝑡 𝐶𝑂!𝑒 + 0.00992 𝑚𝑡 𝐶𝑂!𝑒 + 0.0408 𝑚𝑡 𝐶𝑂!𝑒 = 11.6 𝑚𝑡 𝐶𝑂!𝑒 Location-based vs. Market-based The location-based method quantifies the average emissions from electricity generated and consumed in an organization’s geographic region(s) of operations, primarily using grid-averaged emission factors. This method reflects the GHG emissions from locally generated electricity delivered through the grid and transparently demonstrates local conditions and the impacts of energy conservation. Please note that it does not reflect any electricity purchasing choices made by the organization. APS used the U.S. EPA Power Profiler tool to determine its facilities’ Emissions & Generation Resource Integrated Database (eGRID) subregions (shown below). Please note that the APS Ridge facility is located in the NYLI subregion. This region does not include the hydroelectric power generated in other parts of New York state, which is reflected in its emission factor.
10
The market-based method quantifies emissions from the electricity generated and consumed that organizations have purposefully purchased, using emission factors conveyed through contractual instruments between the organization and the electricity provider. This method reflects the GHG emissions associated with choices an organization makes about its electricity supply, and it allows organizations to claim the specific emission rate associated with these purchases. Organizations that do not have contractual instruments for energy (e.g., renewable energy certificates) or supplier specific rates (e.g., green power program) should use residual mix subnational emission factors, which quantify energy production and do not include voluntary renewable energy purchases. However, if TCR-approved residual mix emission factors are not available, TCR protocol requires organizations to use the eGRID emission factors previously used for the location-based calculations. Because no TCR-approved residual emission factors were available, APS used eGRID emission factors for its market-based calculations. Therefore, APS’s location-based and market-based emissions were equal for 2015.