Embed Size (px)
Citation preview
APS Debugger
TRACE32 Online Help
TRACE32 Directory
TRACE32 Index
TRACE32 Documents ......................................................................................................................
ICD In-Circuit Debugger ................................................................................................................
Processor Architecture Manuals ..............................................................................................
APS ...........................................................................................................................................
APS Debugger ...................................................................................................................... 1
Brief Overview of Documents for New Users ................................................................. 3
Warning .............................................................................................................................. 4
Quick Start ......................................................................................................................... 5
Troubleshooting ................................................................................................................ 7
FAQ ..................................................................................................................................... 8
CPU specific SYStem Settings ......................................................................................... 9
SYStem.CONFIG.state Display target configuration 9
SYStem.CONFIG Configure debugger according to target topology 10
Multicore Example 12
SYStem.CPU Select the used CPU 13
SYStem.CpuAccess Run-time memory access (intrusive) 14
SYStem.JtagClock Define JTAG clock 15
SYStem.MemAccess Real-time memory access (non-intrusive) 15
SYStem.Mode Establish the communication with the target 16
SYStem.LOCK Lock and tristate the debug port 16
SYStem.Option IMASKASM Disable interrupts while single stepping 17
SYStem.Option IMASKHLL Disable interrupts while HLL single stepping 18
SYStem.Option IntelSOC Slave core is part of Intel® SoC 18
SYStem.Option MonType Selects monitor type 19
Cortus monitor vs. built-in monitor 20
SYStem.Option MonBase Register base address 20
Built-In Monitor 21
Custom Monitor 21
Breakpoints ........................................................................................................................ 22
Software breakpoints 22
On-chip breakpoints for instructions 22
Onchip Trace ..................................................................................................................... 23
APS Debugger 1 ©1989-2020 Lauterbach GmbH
Onchip.Mode Type of trace records 23
Quickstart 23
Memory Classes ................................................................................................................ 24
JTAG Connector ................................................................................................................ 25
JTAG Connector for ARM-like Designs 25
JTAG Connector for Atom-like Designs 26
Support ............................................................................................................................... 27
Available Tools 27
Compilers 27
Realtime Operating System 28
3rd-Party Tool Integrations 28
Products ............................................................................................................................. 30
Product Information 30
Order Information 30
APS Debugger 2 ©1989-2020 Lauterbach GmbH
APS Debugger
Version 21-Feb-2020
Brief Overview of Documents for New Users
Architecture-independent information:
• “Debugger Basics - Training” (training_debugger.pdf): Get familiar with the basic features of a TRACE32 debugger.
• “T32Start” (app_t32start.pdf): T32Start assists you in starting TRACE32 PowerView instances for different configurations of the debugger. T32Start is only available for Windows.
• “General Commands” (general_ref_<x>.pdf): Alphabetic list of debug commands.
Architecture-specific information:
• “Processor Architecture Manuals”: These manuals describe commands that are specific for the processor architecture supported by your debug cable. To access the manual for your processor architecture, proceed as follows:
- Choose Help menu > Processor Architecture Manual.
• “OS Awareness Manuals” (rtos_<os>.pdf): TRACE32 PowerView can be extended for operating system-aware debugging. The appropriate OS Awareness manual informs you how to enable the OS-aware debugging.
APS Debugger 3 ©1989-2020 Lauterbach GmbH
Warning
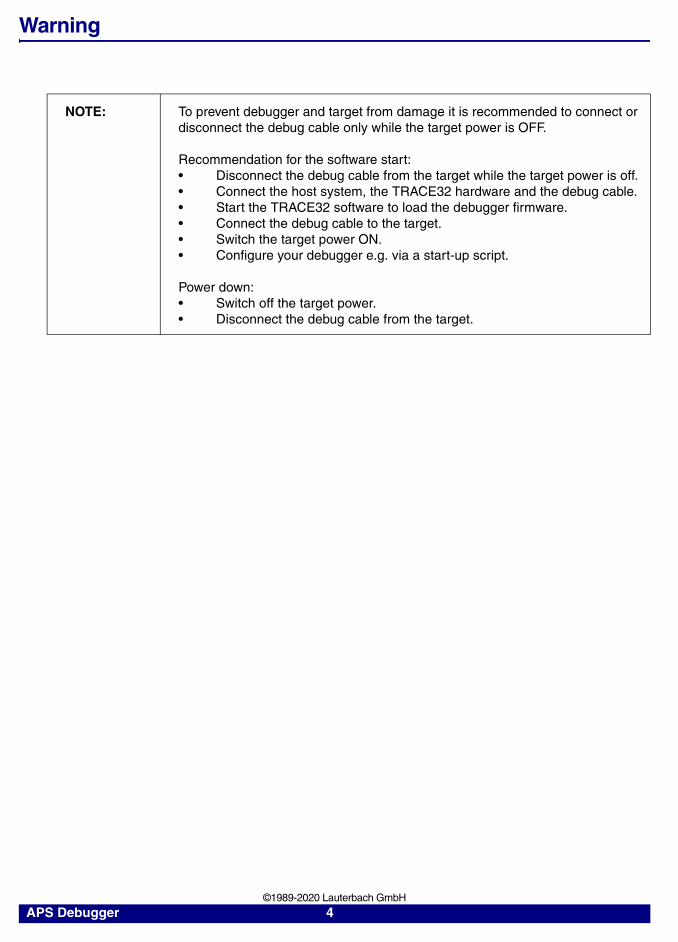
NOTE: To prevent debugger and target from damage it is recommended to connect or disconnect the debug cable only while the target power is OFF.
Recommendation for the software start:• Disconnect the debug cable from the target while the target power is off.• Connect the host system, the TRACE32 hardware and the debug cable.• Start the TRACE32 software to load the debugger firmware.• Connect the debug cable to the target.• Switch the target power ON.• Configure your debugger e.g. via a start-up script.
Power down:• Switch off the target power.• Disconnect the debug cable from the target.
APS Debugger 4 ©1989-2020 Lauterbach GmbH
Quick Start
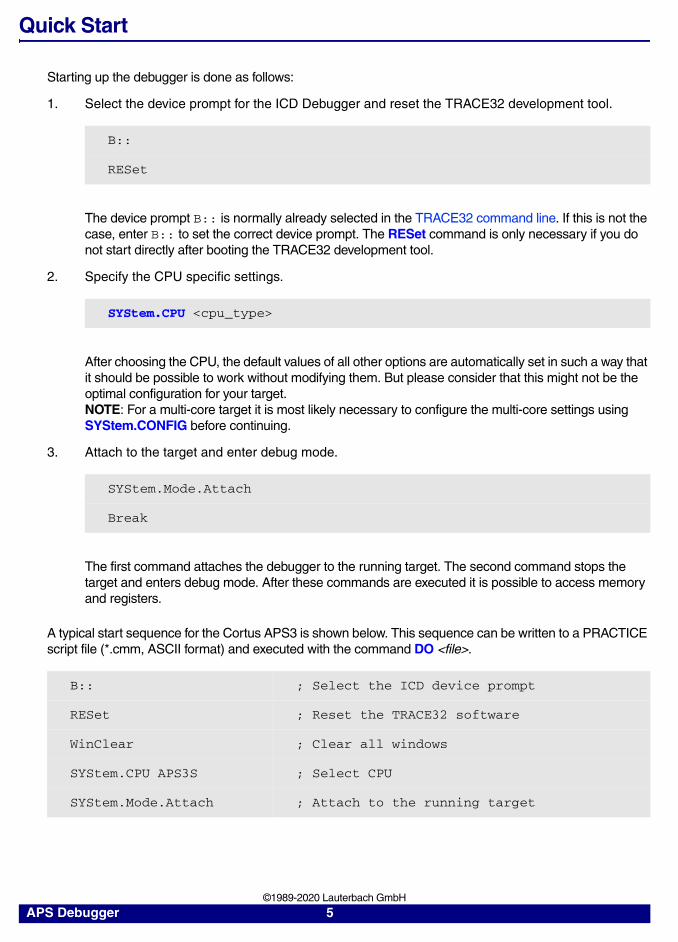
Starting up the debugger is done as follows:
1. Select the device prompt for the ICD Debugger and reset the TRACE32 development tool.
The device prompt B:: is normally already selected in the TRACE32 command line. If this is not the case, enter B:: to set the correct device prompt. The RESet command is only necessary if you do not start directly after booting the TRACE32 development tool.
2. Specify the CPU specific settings.
After choosing the CPU, the default values of all other options are automatically set in such a way that it should be possible to work without modifying them. But please consider that this might not be the optimal configuration for your target.NOTE: For a multi-core target it is most likely necessary to configure the multi-core settings using SYStem.CONFIG before continuing.
3. Attach to the target and enter debug mode.
The first command attaches the debugger to the running target. The second command stops the target and enters debug mode. After these commands are executed it is possible to access memory and registers.
A typical start sequence for the Cortus APS3 is shown below. This sequence can be written to a PRACTICE script file (*.cmm, ASCII format) and executed with the command DO <file>.
B::
RESet
SYStem.CPU <cpu_type>
SYStem.Mode.Attach
Break
B:: ; Select the ICD device prompt
RESet ; Reset the TRACE32 software
WinClear ; Clear all windows
SYStem.CPU APS3S ; Select CPU
SYStem.Mode.Attach ; Attach to the running target
APS Debugger 5 ©1989-2020 Lauterbach GmbH
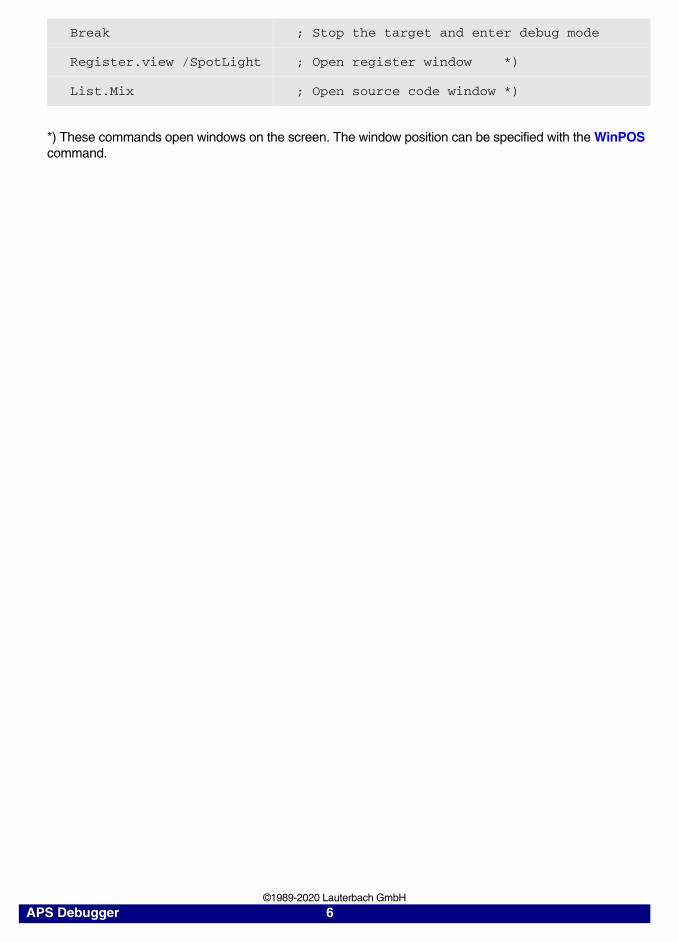
*) These commands open windows on the screen. The window position can be specified with the WinPOS command.
Break ; Stop the target and enter debug mode
Register.view /SpotLight ; Open register window *)
List.Mix ; Open source code window *)
APS Debugger 6 ©1989-2020 Lauterbach GmbH
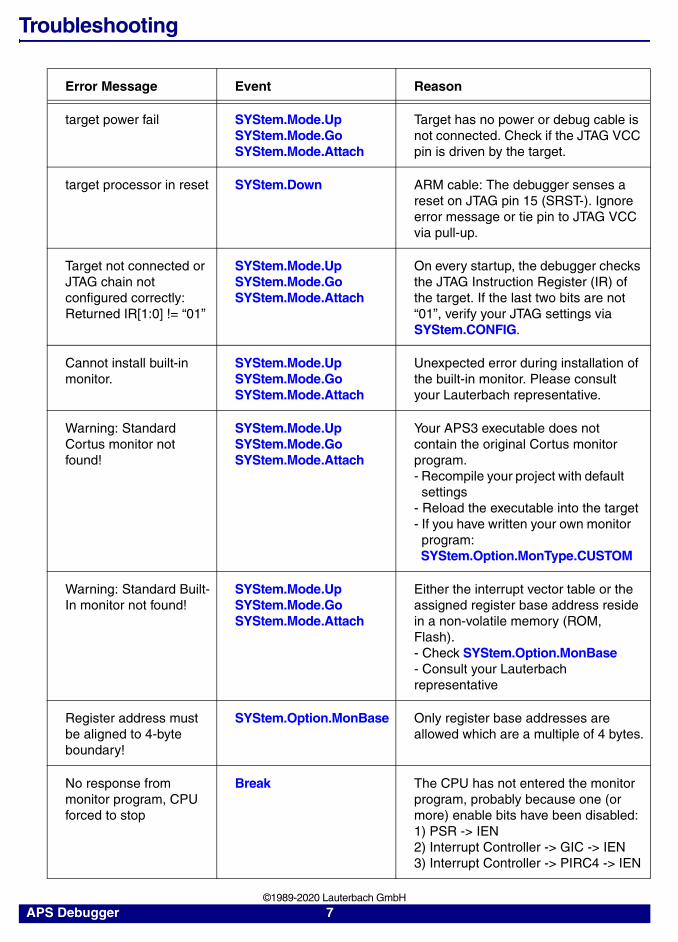
Troubleshooting
Error Message Event Reason
target power fail SYStem.Mode.UpSYStem.Mode.GoSYStem.Mode.Attach
Target has no power or debug cable is not connected. Check if the JTAG VCC pin is driven by the target.
target processor in reset SYStem.Down ARM cable: The debugger senses a reset on JTAG pin 15 (SRST-). Ignore error message or tie pin to JTAG VCC via pull-up.
Target not connected or JTAG chain not configured correctly: Returned IR[1:0] != “01”
SYStem.Mode.UpSYStem.Mode.GoSYStem.Mode.Attach
On every startup, the debugger checks the JTAG Instruction Register (IR) of the target. If the last two bits are not “01”, verify your JTAG settings via SYStem.CONFIG.
Cannot install built-in monitor.
SYStem.Mode.UpSYStem.Mode.GoSYStem.Mode.Attach
Unexpected error during installation ofthe built-in monitor. Please consultyour Lauterbach representative.
Warning: Standard Cortus monitor not found!
SYStem.Mode.UpSYStem.Mode.GoSYStem.Mode.Attach
Your APS3 executable does not contain the original Cortus monitor program. - Recompile your project with default settings- Reload the executable into the target- If you have written your own monitor program: SYStem.Option.MonType.CUSTOM
Warning: Standard Built-In monitor not found!
SYStem.Mode.UpSYStem.Mode.GoSYStem.Mode.Attach
Either the interrupt vector table or the assigned register base address reside in a non-volatile memory (ROM, Flash).- Check SYStem.Option.MonBase- Consult your Lauterbach representative
Register address must be aligned to 4-byte boundary!
SYStem.Option.MonBase Only register base addresses are allowed which are a multiple of 4 bytes.
No response from monitor program, CPU forced to stop
Break The CPU has not entered the monitor program, probably because one (or more) enable bits have been disabled:1) PSR -> IEN2) Interrupt Controller -> GIC -> IEN3) Interrupt Controller -> PIRC4 -> IEN
APS Debugger 7 ©1989-2020 Lauterbach GmbH
FAQ
Please refer to our Frequently Asked Questions page on the Lauterbach website.
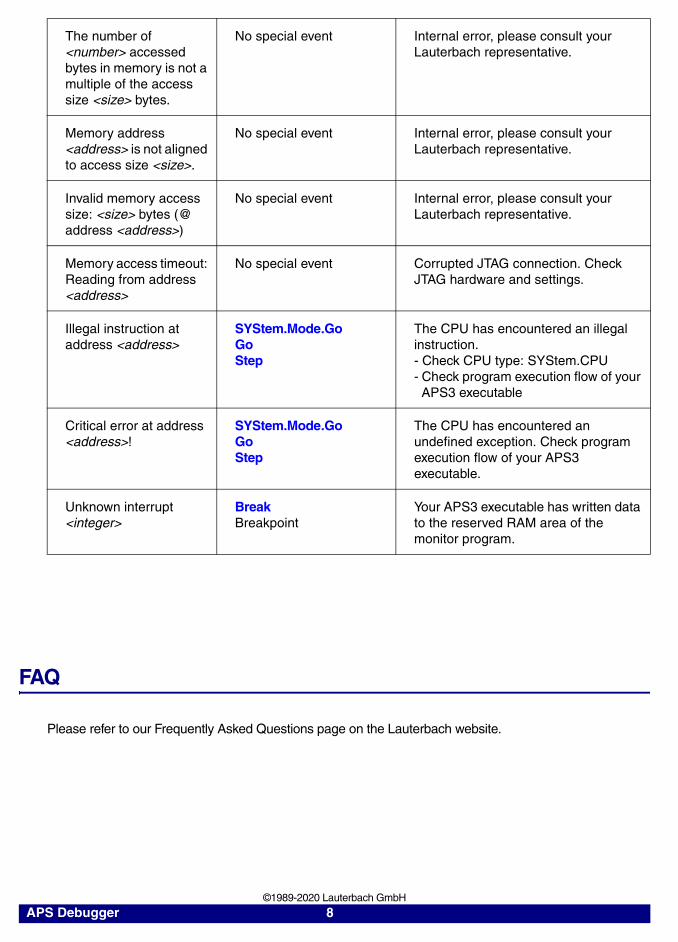
The number of <number> accessed bytes in memory is not a multiple of the access size <size> bytes.
No special event Internal error, please consult your Lauterbach representative.
Memory address <address> is not aligned to access size <size>.
No special event Internal error, please consult your Lauterbach representative.
Invalid memory access size: <size> bytes (@ address <address>)
No special event Internal error, please consult your Lauterbach representative.
Memory access timeout: Reading from address <address>
No special event Corrupted JTAG connection. Check JTAG hardware and settings.
Illegal instruction at address <address>
SYStem.Mode.GoGoStep
The CPU has encountered an illegal instruction.- Check CPU type: SYStem.CPU- Check program execution flow of your APS3 executable
Critical error at address <address>!
SYStem.Mode.GoGoStep
The CPU has encountered an undefined exception. Check program execution flow of your APS3 executable.
Unknown interrupt <integer>
BreakBreakpoint
Your APS3 executable has written data to the reserved RAM area of the monitor program.
APS Debugger 8 ©1989-2020 Lauterbach GmbH
CPU specific SYStem Settings
SYStem.CONFIG.state Display target configuration
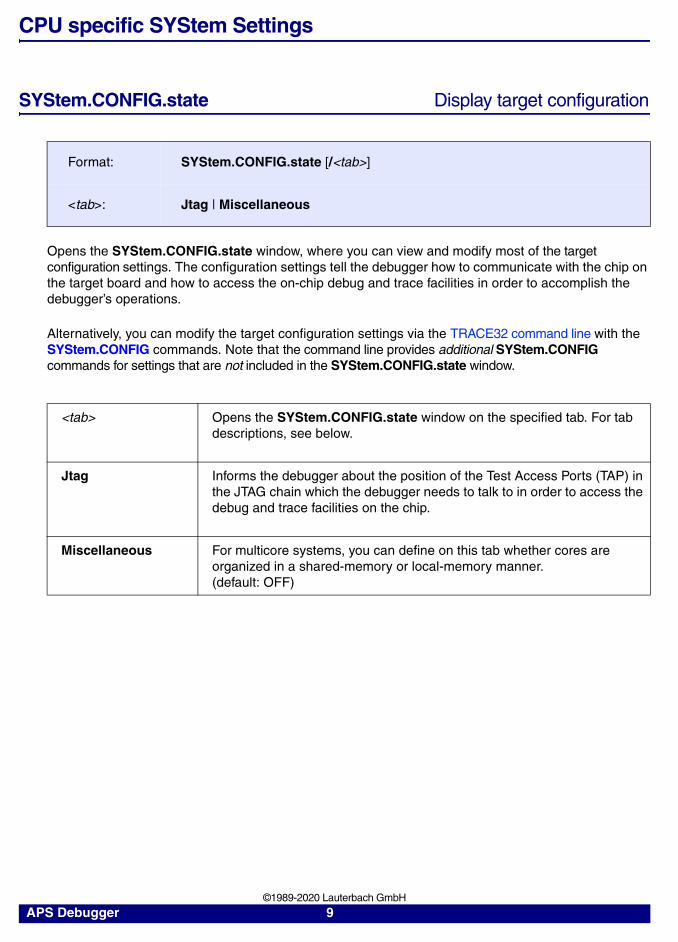
Opens the SYStem.CONFIG.state window, where you can view and modify most of the target configuration settings. The configuration settings tell the debugger how to communicate with the chip on the target board and how to access the on-chip debug and trace facilities in order to accomplish the debugger’s operations.
Alternatively, you can modify the target configuration settings via the TRACE32 command line with the SYStem.CONFIG commands. Note that the command line provides additional SYStem.CONFIG commands for settings that are not included in the SYStem.CONFIG.state window.
Format: SYStem.CONFIG.state [/<tab>]
<tab>: Jtag | Miscellaneous
<tab> Opens the SYStem.CONFIG.state window on the specified tab. For tab descriptions, see below.
Jtag Informs the debugger about the position of the Test Access Ports (TAP) in the JTAG chain which the debugger needs to talk to in order to access the debug and trace facilities on the chip.
Miscellaneous For multicore systems, you can define on this tab whether cores are organized in a shared-memory or local-memory manner. (default: OFF)
APS Debugger 9 ©1989-2020 Lauterbach GmbH
SYStem.CONFIG Configure debugger according to target topology
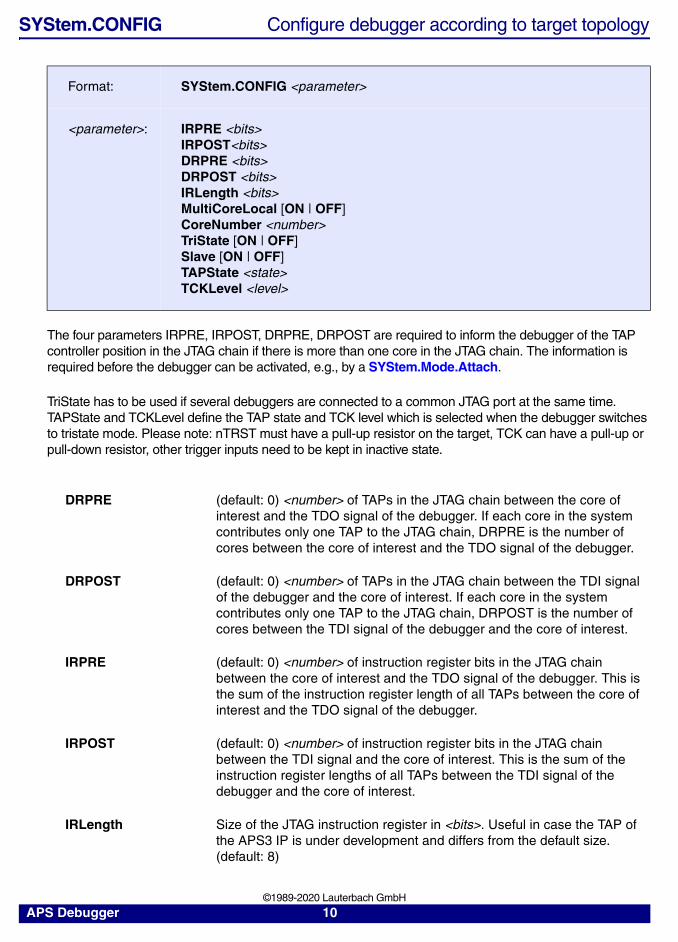
The four parameters IRPRE, IRPOST, DRPRE, DRPOST are required to inform the debugger of the TAP controller position in the JTAG chain if there is more than one core in the JTAG chain. The information is required before the debugger can be activated, e.g., by a SYStem.Mode.Attach.
TriState has to be used if several debuggers are connected to a common JTAG port at the same time. TAPState and TCKLevel define the TAP state and TCK level which is selected when the debugger switches to tristate mode. Please note: nTRST must have a pull-up resistor on the target, TCK can have a pull-up or pull-down resistor, other trigger inputs need to be kept in inactive state.
Format: SYStem.CONFIG <parameter>
<parameter>: IRPRE <bits> IRPOST<bits> DRPRE <bits> DRPOST <bits> IRLength <bits> MultiCoreLocal [ON | OFF]CoreNumber <number> TriState [ON | OFF]Slave [ON | OFF]TAPState <state> TCKLevel <level>
DRPRE (default: 0) <number> of TAPs in the JTAG chain between the core of interest and the TDO signal of the debugger. If each core in the system contributes only one TAP to the JTAG chain, DRPRE is the number of cores between the core of interest and the TDO signal of the debugger.
DRPOST (default: 0) <number> of TAPs in the JTAG chain between the TDI signal of the debugger and the core of interest. If each core in the system contributes only one TAP to the JTAG chain, DRPOST is the number of cores between the TDI signal of the debugger and the core of interest.
IRPRE (default: 0) <number> of instruction register bits in the JTAG chain between the core of interest and the TDO signal of the debugger. This is the sum of the instruction register length of all TAPs between the core of interest and the TDO signal of the debugger.
IRPOST (default: 0) <number> of instruction register bits in the JTAG chain between the TDI signal and the core of interest. This is the sum of the instruction register lengths of all TAPs between the TDI signal of the debugger and the core of interest.
IRLength Size of the JTAG instruction register in <bits>. Useful in case the TAP of the APS3 IP is under development and differs from the default size. (default: 8)
APS Debugger 10 ©1989-2020 Lauterbach GmbH
MultiCoreLocal For multicore systems this option defines whether cores are organized in a shared-memory or local-memory manner. (default: OFF)
CoreNumber <number> of cores in a shared-memory or local-memory multicore system. (default: 1)
TriState [ON | OFF] The debugger switches to tristate mode after each debug port access. If several debuggers share the same debug port, this option is required. Then other debuggers can access the port. (default: OFF)
Slave [ON | OFF] Defines the master in a multicore chip. Only one core can be the master of the chip reset, the TAP reset and the chip initialization features. All other cores are slave cores. (default: OFF)
TAPState This is the state of the TAP controller when the debugger switches to tristate mode. All states of the JTAG TAP controller are selectable. (default: 7 = Select-DR-Scan)
TCKLevel [0 | 1] Level of TCK signal when all debuggers are tristated. (default: 0)
APS Debugger 11 ©1989-2020 Lauterbach GmbH
Multicore Example
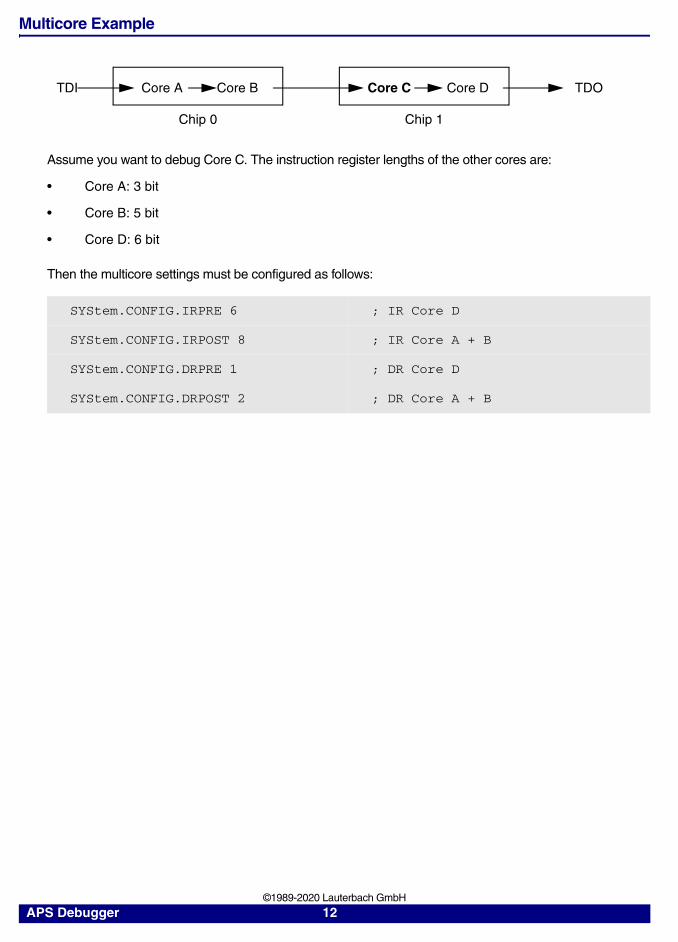
Assume you want to debug Core C. The instruction register lengths of the other cores are:
• Core A: 3 bit
• Core B: 5 bit
• Core D: 6 bit
Then the multicore settings must be configured as follows:
SYStem.CONFIG.IRPRE 6 ; IR Core D
SYStem.CONFIG.IRPOST 8 ; IR Core A + B
SYStem.CONFIG.DRPRE 1 ; DR Core D
SYStem.CONFIG.DRPOST 2 ; DR Core A + B
Core A Core B Core C Core D TDOTDI
Chip 0 Chip 1
APS Debugger 12 ©1989-2020 Lauterbach GmbH
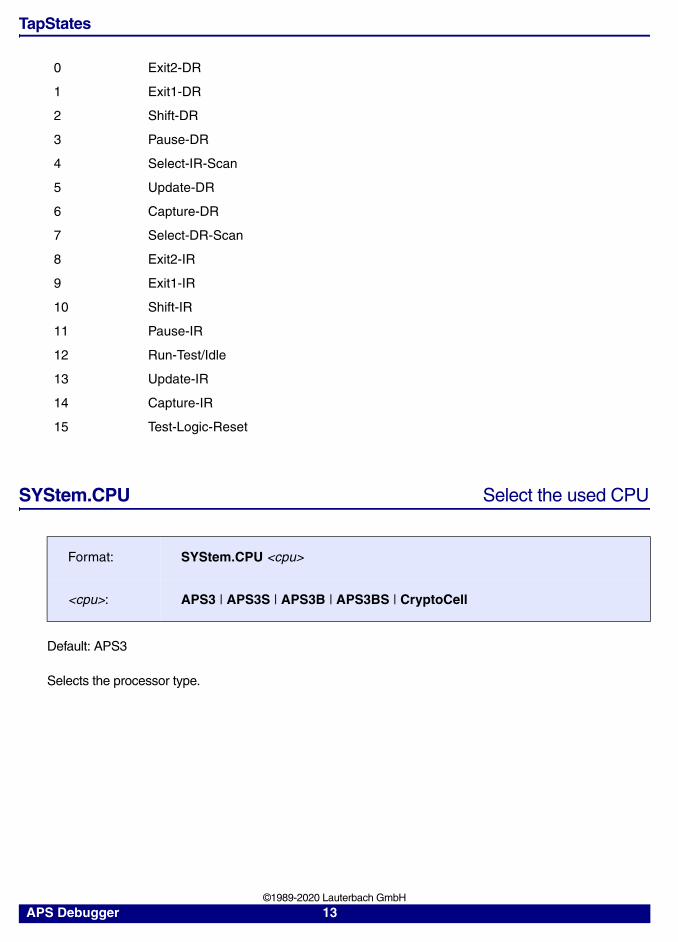
TapStates
SYStem.CPU Select the used CPU
Default: APS3
Selects the processor type.
0 Exit2-DR
1 Exit1-DR
2 Shift-DR
3 Pause-DR
4 Select-IR-Scan
5 Update-DR
6 Capture-DR
7 Select-DR-Scan
8 Exit2-IR
9 Exit1-IR
10 Shift-IR
11 Pause-IR
12 Run-Test/Idle
13 Update-IR
14 Capture-IR
15 Test-Logic-Reset
Format: SYStem.CPU <cpu>
<cpu>: APS3 | APS3S | APS3B | APS3BS | CryptoCell
APS Debugger 13 ©1989-2020 Lauterbach GmbH
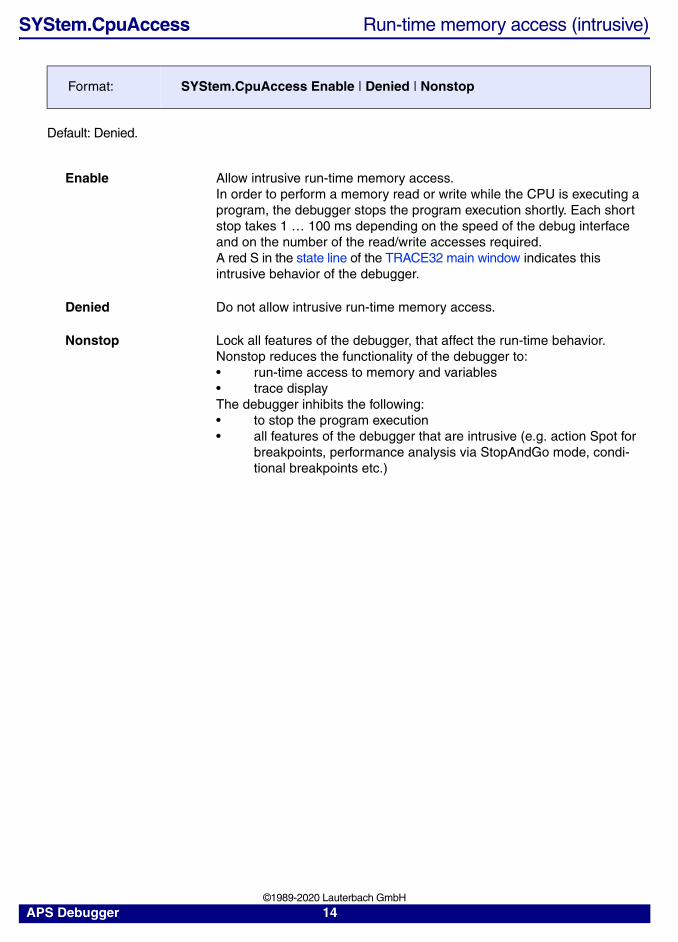
SYStem.CpuAccess Run-time memory access (intrusive)
Default: Denied.
Format: SYStem.CpuAccess Enable | Denied | Nonstop
Enable Allow intrusive run-time memory access.In order to perform a memory read or write while the CPU is executing a program, the debugger stops the program execution shortly. Each short stop takes 1 … 100 ms depending on the speed of the debug interface and on the number of the read/write accesses required.A red S in the state line of the TRACE32 main window indicates this intrusive behavior of the debugger.
Denied Do not allow intrusive run-time memory access.
Nonstop Lock all features of the debugger, that affect the run-time behavior.Nonstop reduces the functionality of the debugger to:• run-time access to memory and variables• trace displayThe debugger inhibits the following:• to stop the program execution• all features of the debugger that are intrusive (e.g. action Spot for
breakpoints, performance analysis via StopAndGo mode, condi-tional breakpoints etc.)
APS Debugger 14 ©1989-2020 Lauterbach GmbH
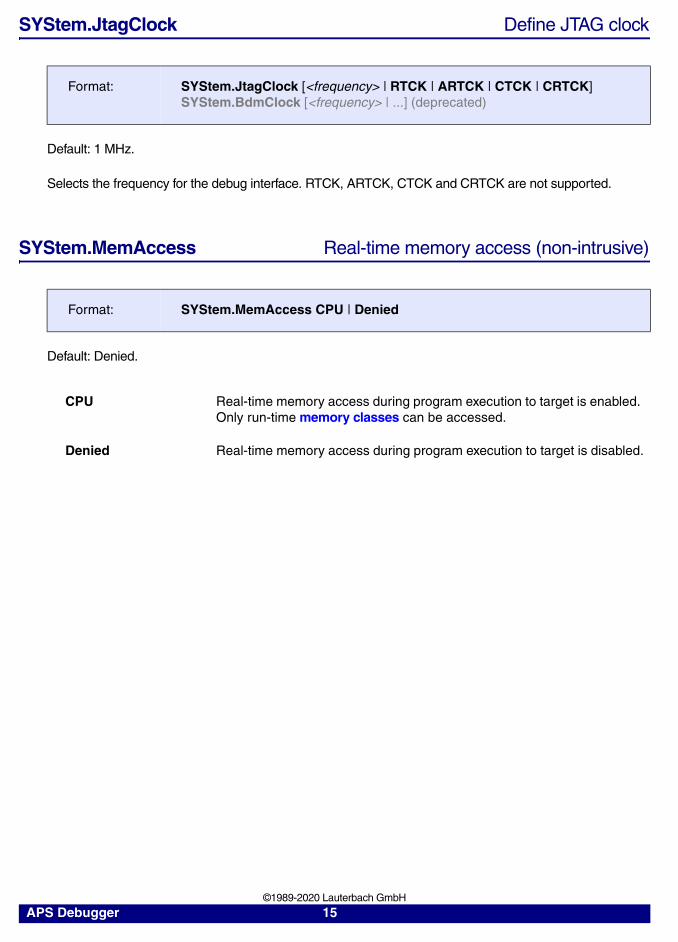
SYStem.JtagClock Define JTAG clock
Default: 1 MHz.
Selects the frequency for the debug interface. RTCK, ARTCK, CTCK and CRTCK are not supported.
SYStem.MemAccess Real-time memory access (non-intrusive)
Default: Denied.
Format: SYStem.JtagClock [<frequency> | RTCK | ARTCK | CTCK | CRTCK]SYStem.BdmClock [<frequency> | ...] (deprecated)
Format: SYStem.MemAccess CPU | Denied
CPU Real-time memory access during program execution to target is enabled. Only run-time memory classes can be accessed.
Denied Real-time memory access during program execution to target is disabled.
APS Debugger 15 ©1989-2020 Lauterbach GmbH
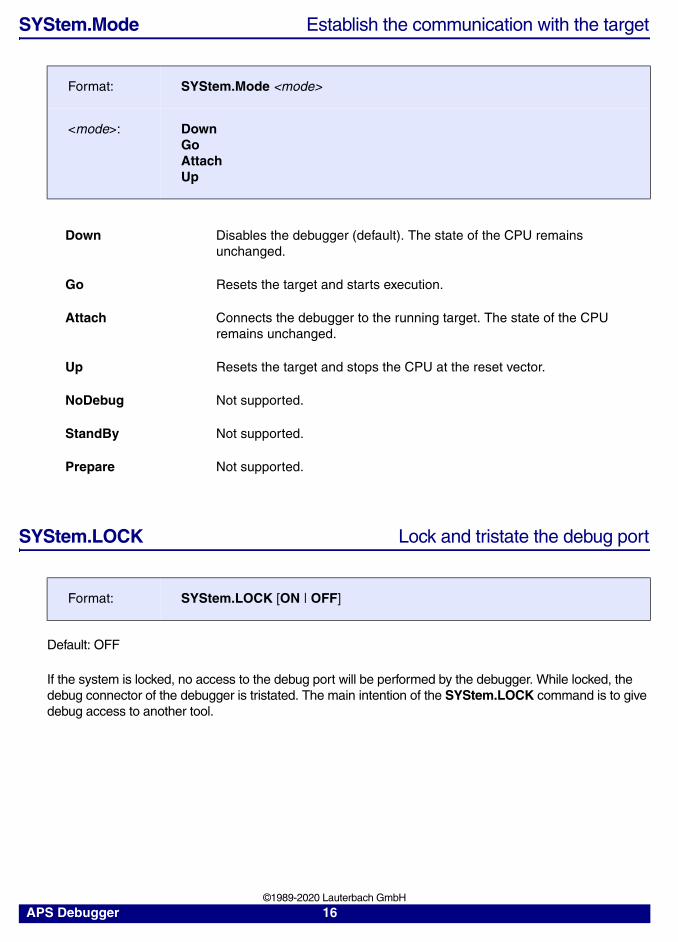
SYStem.Mode Establish the communication with the target
SYStem.LOCK Lock and tristate the debug port
Default: OFF
If the system is locked, no access to the debug port will be performed by the debugger. While locked, the debug connector of the debugger is tristated. The main intention of the SYStem.LOCK command is to give debug access to another tool.
Format: SYStem.Mode <mode>
<mode>: DownGoAttachUp
Down Disables the debugger (default). The state of the CPU remains unchanged.
Go Resets the target and starts execution.
Attach Connects the debugger to the running target. The state of the CPU remains unchanged.
Up Resets the target and stops the CPU at the reset vector.
NoDebug Not supported.
StandBy Not supported.
Prepare Not supported.
Format: SYStem.LOCK [ON | OFF]
APS Debugger 16 ©1989-2020 Lauterbach GmbH
SYStem.Option IMASKASM Disable interrupts while single stepping
Default: OFF.
If enabled, the interrupt enable flag of the EFLAGS register will be cleared during assembler single-step operations. After the single step, the interrupt enable flag is restored to the value it had before the step.
Format: SYStem.Option IMASKASM [ON | OFF]
APS Debugger 17 ©1989-2020 Lauterbach GmbH
SYStem.Option IMASKHLL Disable interrupts while HLL single stepping
Default: OFF.
If enabled, the interrupt enable flag of the EFLAGS register will be cleared during HLL single-step operations. After the single step, the interrupt enable flag is restored to the value it had before the step.
SYStem.Option IntelSOC Slave core is part of Intel® SoC
Default: OFF.
Informs the debugger that the core is part of an Intel® SoC. When enabled, all IR and DR pre/post settings are handled automatically, no manual configuration is necessary.
Requires that the debugger for this core is slave in a multicore setup with x86 as the master debugger and that SYStem.Option.CLTAPOnly is enabled in the x86 debugger.
Format: SYStem.Option IMASKHLL [ON | OFF]
Format: SYStem.Option IntelSOC [ON | OFF]
APS Debugger 18 ©1989-2020 Lauterbach GmbH
SYStem.Option MonType Selects monitor type
Default: Cortus
Format: SYStem.Option MonType <type>
<type>: CortusBuilt-InCUSTOM
Cortus The standard monitor stub provided by Cortus.Usually the Cortus monitor program is part of the startup code of the APS3 toolchain. It can be found in file crt0.c, which will be included in every APS3 executable by default.
Built-In A small monitor program dynamically loaded into the target.If this option is selected, TRACE32 loads a small monitor program into the RAM of the target. It will completely be removed from the target’s memory after a power down.In contrast to the Cortus monitor, no dedicated startup code is required. However it must be ensured, that the built-in monitor does not interfere with application data (also see SYStem.Option.MonBase)!
CUSTOM A custom defined monitor program.Please refer to SYStem.Option.MonBase for how to write your own monitor program.
APS Debugger 19 ©1989-2020 Lauterbach GmbH
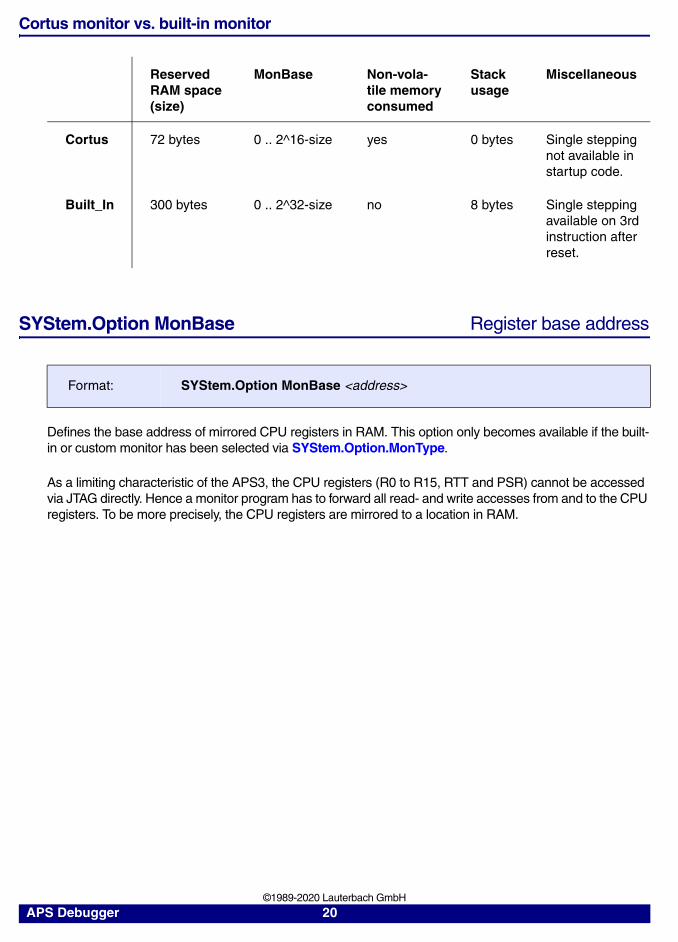
Cortus monitor vs. built-in monitor
SYStem.Option MonBase Register base address
Defines the base address of mirrored CPU registers in RAM. This option only becomes available if the built-in or custom monitor has been selected via SYStem.Option.MonType.
As a limiting characteristic of the APS3, the CPU registers (R0 to R15, RTT and PSR) cannot be accessed via JTAG directly. Hence a monitor program has to forward all read- and write accesses from and to the CPU registers. To be more precisely, the CPU registers are mirrored to a location in RAM.
Reserved RAM space (size)
MonBase Non-vola-tile memory consumed
Stack usage
Miscellaneous
Cortus 72 bytes 0 .. 2^16-size yes 0 bytes Single stepping not available in startup code.
Built_In 300 bytes 0 .. 2^32-size no 8 bytes Single stepping available on 3rd instruction after reset.
Format: SYStem.Option MonBase <address>
APS Debugger 20 ©1989-2020 Lauterbach GmbH
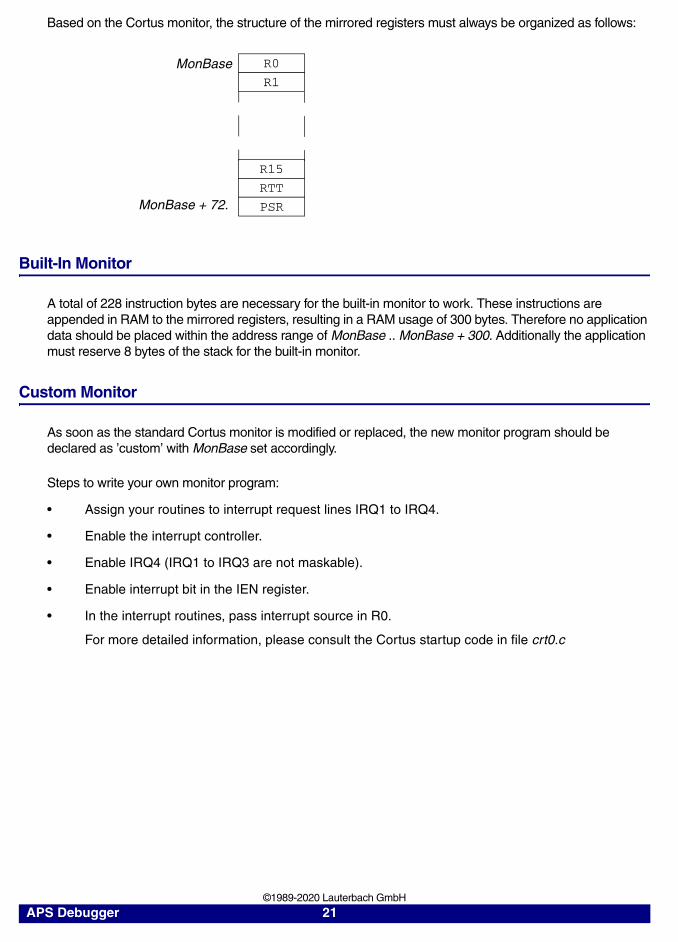
Based on the Cortus monitor, the structure of the mirrored registers must always be organized as follows:
Built-In Monitor
A total of 228 instruction bytes are necessary for the built-in monitor to work. These instructions are appended in RAM to the mirrored registers, resulting in a RAM usage of 300 bytes. Therefore no application data should be placed within the address range of MonBase .. MonBase + 300. Additionally the application must reserve 8 bytes of the stack for the built-in monitor.
Custom Monitor
As soon as the standard Cortus monitor is modified or replaced, the new monitor program should be declared as ’custom’ with MonBase set accordingly.
Steps to write your own monitor program:
• Assign your routines to interrupt request lines IRQ1 to IRQ4.
• Enable the interrupt controller.
• Enable IRQ4 (IRQ1 to IRQ3 are not maskable).
• Enable interrupt bit in the IEN register.
• In the interrupt routines, pass interrupt source in R0.
For more detailed information, please consult the Cortus startup code in file crt0.c
MonBase
MonBase + 72.
R0
R1
R15
RTT
PSR
APS Debugger 21 ©1989-2020 Lauterbach GmbH
Breakpoints
Software breakpoints
If a software breakpoint is set, the corresponding program code is replaced by a trap instruction. Thus software breakpoints can only be applied to program code residing in a RAM.
There is no restriction in the number of software breakpoints.
On-chip breakpoints for instructions
The APS3 breakpoint module provides three on-chip breakpoints for instructions. These can be located either in a volatile or non-volatile memory.
APS Debugger 22 ©1989-2020 Lauterbach GmbH
Onchip Trace
This trace method can only be used if the APS3 core features a trace module and trace buffer. Otherwise the activation of the onchip trace might result in an undefined behavior of the APS3.
Onchip.Mode Type of trace recordsDe
Default: PcOnly
Quickstart
• The onchip trace is automatically initialized on activation and is ready for use instantly.
• If the onchip mode is changed, the trace must be reset via Onchip.RESet.
• Every Onchip.RESet must be followed by an Onchip.Init.
• Onchip.List displays the reconstructed program flow. If the trace mode is PcOnly, interrupt addresses cannot be determined exactly. Interrupt labels in the trace window then are placed right before the next branch, jump, call, etc. instruction, which will be incorrect in most cases.
• Onchip.List /BusTrace displays the decoded content of the trace buffer.
Format: Onchip.Mode <mode>
<mode>: PcOnlyPcRegs
PcOnly Records the PC only.A trace record is written to the trace buffer whenever the CPU is interrupted from its straightforward program execution. Events that cause an interruption are: Calls, jumps, (un)conditional breaks, traps, interrupts and returns from interrupts. This option currently only works for the built-in monitor!
PcRegs Records PC and register writes.In addition to writes to the PC, also writes to registers R0-R15, RTT and PSR are recorded. Read accesses are not traced.For this reason the trace buffer is filled with data more quickly and the program execution flow cannot be traced back as far as in PcOnly mode. However interrupts can be detected properly in PCRegs mode only.
APS Debugger 23 ©1989-2020 Lauterbach GmbH
Memory Classes
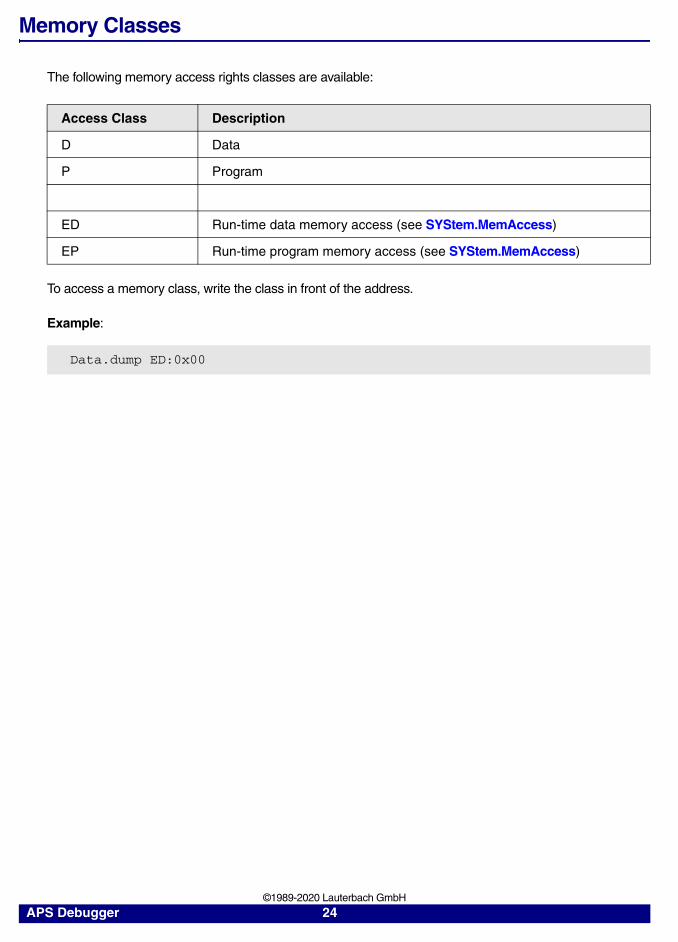
The following memory access rights classes are available:
To access a memory class, write the class in front of the address.
Example:
Access Class Description
D Data
P Program
ED Run-time data memory access (see SYStem.MemAccess)
EP Run-time program memory access (see SYStem.MemAccess)
Data.dump ED:0x00
APS Debugger 24 ©1989-2020 Lauterbach GmbH
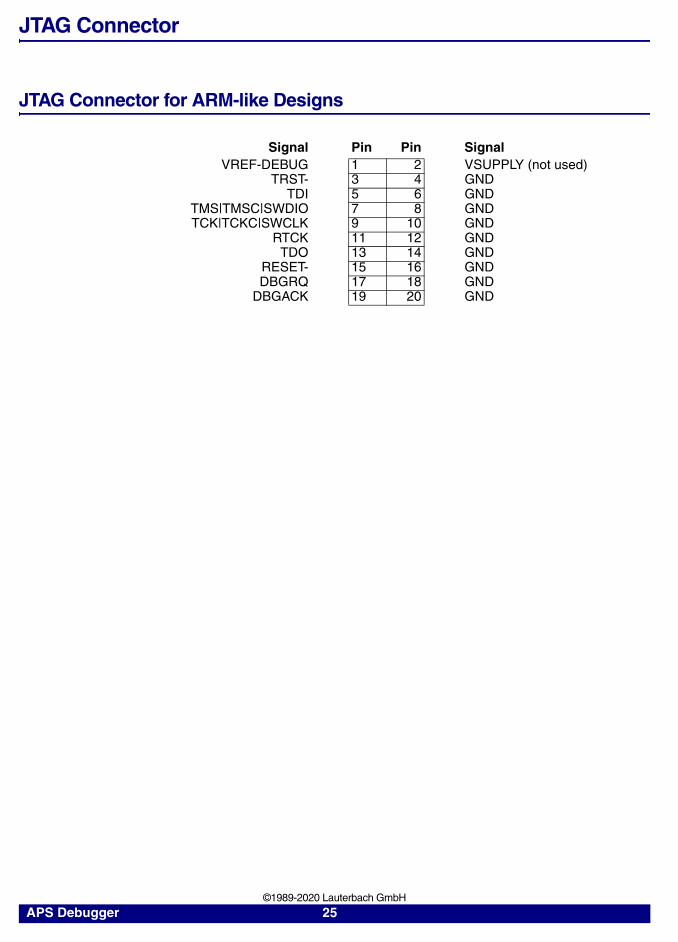
JTAG Connector
JTAG Connector for ARM-like Designs
Signal Pin Pin SignalVREF-DEBUG 1 2 VSUPPLY (not used)
TRST- 3 4 GNDTDI 5 6 GND
TMS|TMSC|SWDIO 7 8 GNDTCK|TCKC|SWCLK 9 10 GND
RTCK 11 12 GNDTDO 13 14 GND
RESET- 15 16 GNDDBGRQ 17 18 GND
DBGACK 19 20 GND
APS Debugger 25 ©1989-2020 Lauterbach GmbH
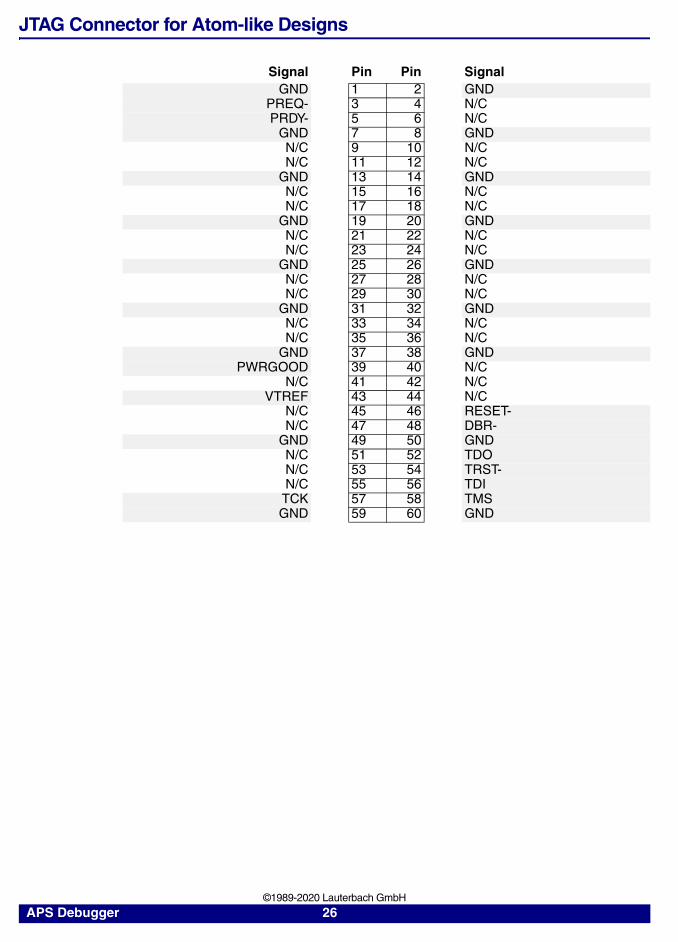
JTAG Connector for Atom-like Designs
Signal Pin Pin SignalGND 1 2 GND
PREQ- 3 4 N/CPRDY- 5 6 N/C
GND 7 8 GNDN/C 9 10 N/CN/C 11 12 N/C
GND 13 14 GNDN/C 15 16 N/CN/C 17 18 N/C
GND 19 20 GNDN/C 21 22 N/CN/C 23 24 N/C
GND 25 26 GNDN/C 27 28 N/CN/C 29 30 N/C
GND 31 32 GNDN/C 33 34 N/CN/C 35 36 N/C
GND 37 38 GNDPWRGOOD 39 40 N/C
N/C 41 42 N/CVTREF 43 44 N/C
N/C 45 46 RESET-N/C 47 48 DBR-
GND 49 50 GNDN/C 51 52 TDON/C 53 54 TRST-N/C 55 56 TDITCK 57 58 TMSGND 59 60 GND
APS Debugger 26 ©1989-2020 Lauterbach GmbH
Support
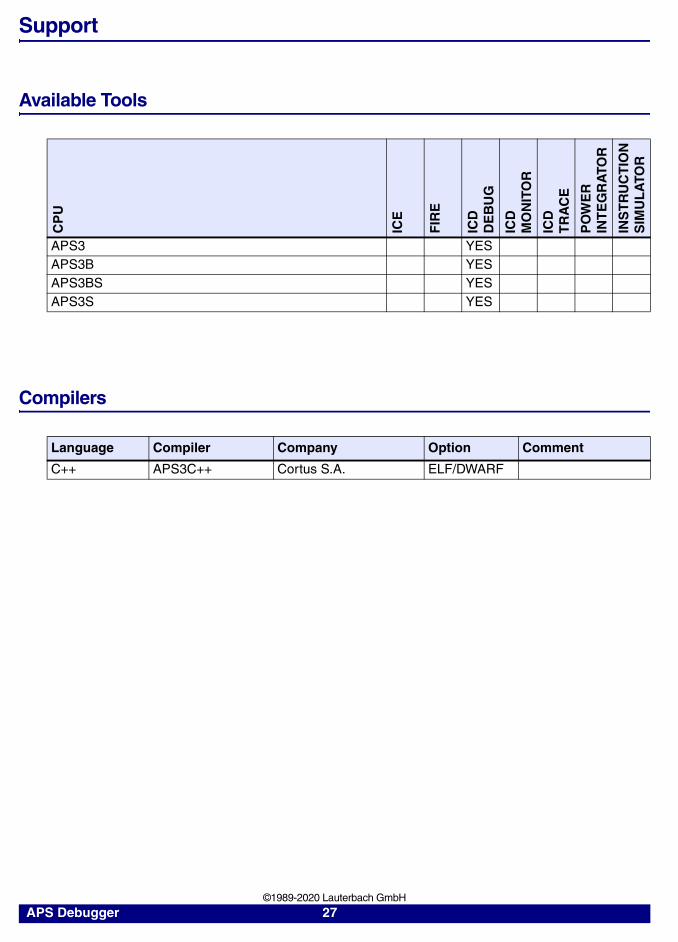
Available Tools
Compilers
CP
U
ICE
FIR
E
ICD
DE
BU
G
ICD
MO
NIT
OR
ICD
TR
AC
E
PO
WE
RIN
TE
GR
ATO
R
INS
TR
UC
TIO
NS
IMU
LA
TOR
APS3 YESAPS3B YESAPS3BS YESAPS3S YES
Language Compiler Company Option Comment
C++ APS3C++ Cortus S.A. ELF/DWARF
APS Debugger 27 ©1989-2020 Lauterbach GmbH
Realtime Operating System
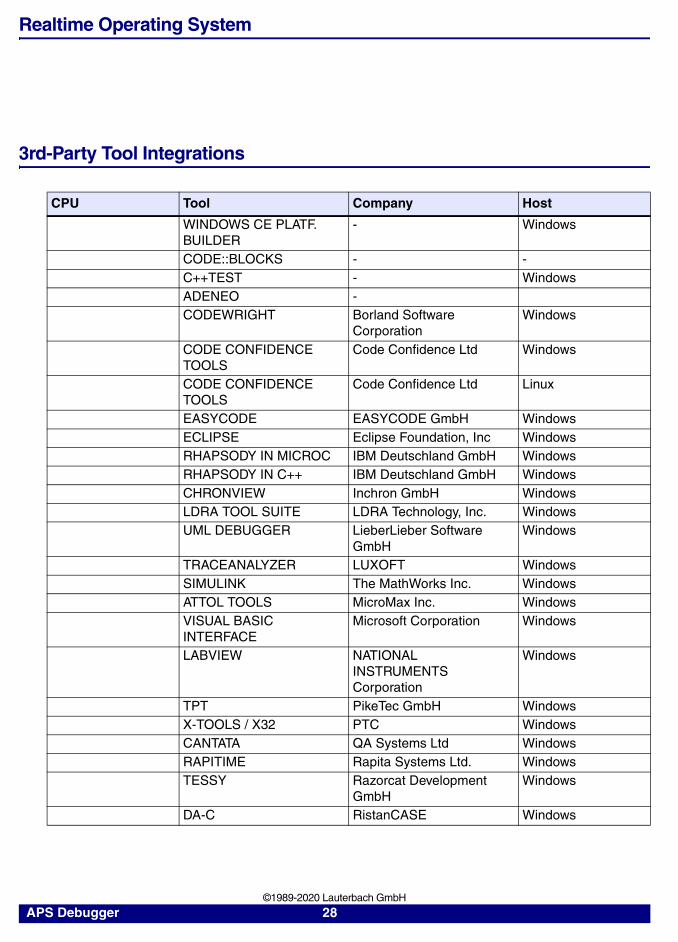
3rd-Party Tool Integrations
CPU Tool Company Host
WINDOWS CE PLATF. BUILDER
- Windows
CODE::BLOCKS - -C++TEST - WindowsADENEO -CODEWRIGHT Borland Software
CorporationWindows
CODE CONFIDENCE TOOLS
Code Confidence Ltd Windows
CODE CONFIDENCE TOOLS
Code Confidence Ltd Linux
EASYCODE EASYCODE GmbH WindowsECLIPSE Eclipse Foundation, Inc WindowsRHAPSODY IN MICROC IBM Deutschland GmbH WindowsRHAPSODY IN C++ IBM Deutschland GmbH WindowsCHRONVIEW Inchron GmbH WindowsLDRA TOOL SUITE LDRA Technology, Inc. WindowsUML DEBUGGER LieberLieber Software
GmbHWindows
TRACEANALYZER LUXOFT WindowsSIMULINK The MathWorks Inc. WindowsATTOL TOOLS MicroMax Inc. WindowsVISUAL BASIC INTERFACE
Microsoft Corporation Windows
LABVIEW NATIONAL INSTRUMENTS Corporation
Windows
TPT PikeTec GmbH WindowsX-TOOLS / X32 PTC WindowsCANTATA QA Systems Ltd WindowsRAPITIME Rapita Systems Ltd. WindowsTESSY Razorcat Development
GmbHWindows
DA-C RistanCASE Windows
APS Debugger 28 ©1989-2020 Lauterbach GmbH
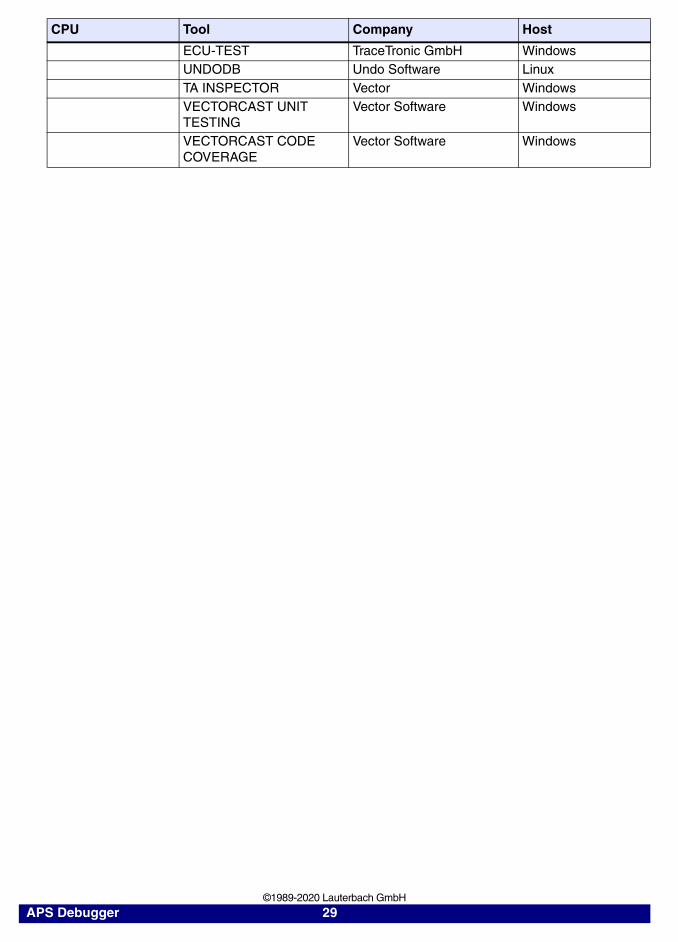
ECU-TEST TraceTronic GmbH WindowsUNDODB Undo Software LinuxTA INSPECTOR Vector WindowsVECTORCAST UNIT TESTING
Vector Software Windows
VECTORCAST CODE COVERAGE
Vector Software Windows
CPU Tool Company Host
APS Debugger 29 ©1989-2020 Lauterbach GmbH
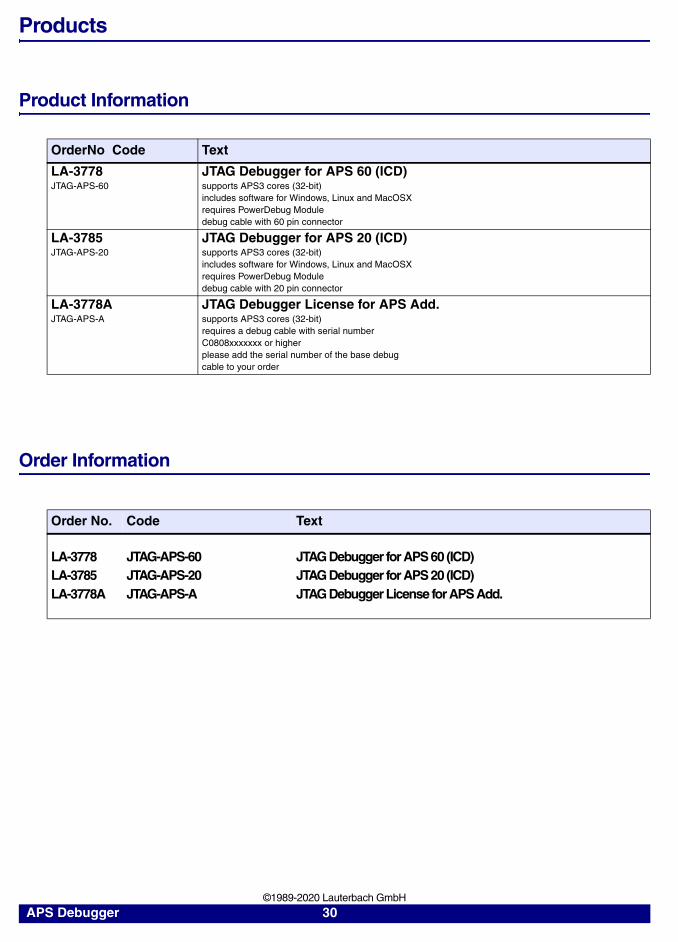
Products
Product Information
Order Information
OrderNo Code Text
LA-3778 JTAG-APS-60
JTAG Debugger for APS 60 (ICD)supports APS3 cores (32-bit)includes software for Windows, Linux and MacOSXrequires PowerDebug Moduledebug cable with 60 pin connector
LA-3785 JTAG-APS-20
JTAG Debugger for APS 20 (ICD)supports APS3 cores (32-bit)includes software for Windows, Linux and MacOSXrequires PowerDebug Moduledebug cable with 20 pin connector
LA-3778A JTAG-APS-A
JTAG Debugger License for APS Add.supports APS3 cores (32-bit)requires a debug cable with serial numberC0808xxxxxxx or higherplease add the serial number of the base debugcable to your order
Order No. Code Text
LA-3778 JTAG-APS-60 JTAG Debugger for APS 60 (ICD)LA-3785 JTAG-APS-20 JTAG Debugger for APS 20 (ICD)LA-3778A JTAG-APS-A JTAG Debugger License for APS Add.
APS Debugger 30 ©1989-2020 Lauterbach GmbH