Embed Size (px)
Citation preview
Highlights from our April Fact Book
The SEC is scheduled to make a decision regarding its controversial “tick size pilot program” on May 6th. We provide a refresher on the details of the program and which securities could be affected.
Traditionally equity volumes in the U.S. and abroad surrounding Memorial Day have been abysmal… We shed some light on what to expect for the upcoming holiday using historical data.
Read all about these things, ETF volumes, U.S. equity market structure changes, major factor performance, upcoming index reviews and more in our Market Fact Book…
April Market Fact Book Weeden & Co.
Weeden Special Situations Group
April 2015
Disclosure: This publication is prepared by Weeden & Co.'s trading department, and not its research department. This publication is for
information purposes only and is based on information and data from sources considered to be reliable, but it is not guaranteed as to accuracy and
does not purport to be complete and are subject to change without notice. This publication is neither intended nor should be considered as an offer or the solicitation of an offer to sell or buy any security or other financial product. Nothing contained herein is intended to be, nor shall it be
construed as, investment advice. Information contained herein provides insufficient information upon which to base an investment decision. Any
comments or statements made herein do not necessarily reflect those of Weeden & Co. LP or its affiliates. 2015 Weeden & Co. LP. Sources: See Contact Page

2
Tick Size & Trade-At Pilot Program Refresher
After extending its preliminary ruling date in March the SEC is due to make a decision on its
controversial tick size pilot program this Wednesday, May 6th
. As of February, the SEC had received
over 70 letters commenting on the proposed new program. Below we provide a summary of the
previously announced rules outlined by the SEC, which could be implemented as soon as this summer.
Eligible Pilot Securities & Test Group Selection
Eligibility Criteria:
1) Market cap below $5Bln,
2) Consolidated Average Daily Volume of one million shares or less
3) Price of at least $2
Stratified Random Sampling Selection o Eligible securities will be broken into 27 groups based on liquidity, market cap, and price
(VWAP). Four hundred securities will then be randomly selected from each of these sub-
groups, and the remaining securities will constitute the control group.
Test Groups
In order to test the effectiveness of wider tick sizes and the “trade-at” rule the program will consist of
three test groups and one control group. Each group will be subject the following rules:
Test Group I: o Stocks will be quoted in $0.05 minimum increments
o May trade at any price increment that is currently permitted
o Orders entered into an exchange’s retail liquidity program may be accepted in increments
of less than $0.05
Test Group II: o Must be quoted and must trade in $0.05 minimum increments both on AND off
exchanges with a few exceptions: Midpoint, retail orders with price improvement of
$0.005 or better, and negotiated trades (tied to any pre-arranged benchmark)
Test Group III: o Same rules as Test Group II, plus the additional trade-at rule
Control Group
o Securities will continue to be quoted and traded in increments currently allowed
Trade-At Rule Exemptions
Orders of “block size”
Retail orders executed with at least $0.005 price improvement
The order is identified as an ISO
The order is executed by a venue that concurrently sent ISO orders to the venue with the best
displayed Bid or Offer against the full displayed size
The order is executed as part of a negotiated trade
Stopped orders for customers that are priced at the BBO when the stop is elected

3
-2.6%-1.2%
-5.4%
-25.2%
-7.1%-5.8% -5.3%
3.5%
-30%
-25%
-20%
-15%
-10%
-5%
0%
5%
%2
0D
AD
V
Total U.S. Volumes Drop Off Around After Memorial Day(2009-2014, excl. 2011)
-64% -61%
-54%
-26%-20%
-16%
-75%
-60%
-45%
-30%
-15%
0%
15%
T-1 Memorial Day T+1 T+2
%2
0D
AD
V
International Volumes Impacted on Memorial Day (2009-2014, excl. 2011)
Europe Mexico Canada Hong Kong Australia Japan
U.S. & Intl. Volumes Surrounding Memorial Day While most Americans are eager for the upcoming Memorial Day weekend, those relying on liquidity in
equity markets worldwide will have little to cheer about. In this study we review historical U.S. equity
volumes surrounding Memorial Day and also take a quick look at how international volumes have
traditionally been affected by the holiday.
Total U.S. Average Daily Volume
International Average Daily Volume
For those of you trading internationally on Memorial Day be prepared for a very slow day. This is
especially true in Europe (measured by Bloomberg’s BE500 Composite Index), Mexico, and Canada
where volumes have been down over the past five years 64%, 61%, and 54% respectively. Even Asian
markets, including Australia, whose volumes are generally less affected by U.S. market closures have
been adversely impacted by the holiday in the past.
It probably doesn’t come as much
of a surprise, but U.S. volumes
surrounding Memorial Day have
been significantly below average
over the past several years. As we
approach this year’s holiday, expect
total U.S. daily volumes to fall
precipitously beginning the Friday
before Memorial Day and to not
recover fully until the following
Friday. On average, over the past
five years U.S. volumes on the
Friday before Memorial Day have
been 25% below their average
levels.
4
Market Structure Recap & Outlook
April Market Structure Highlights
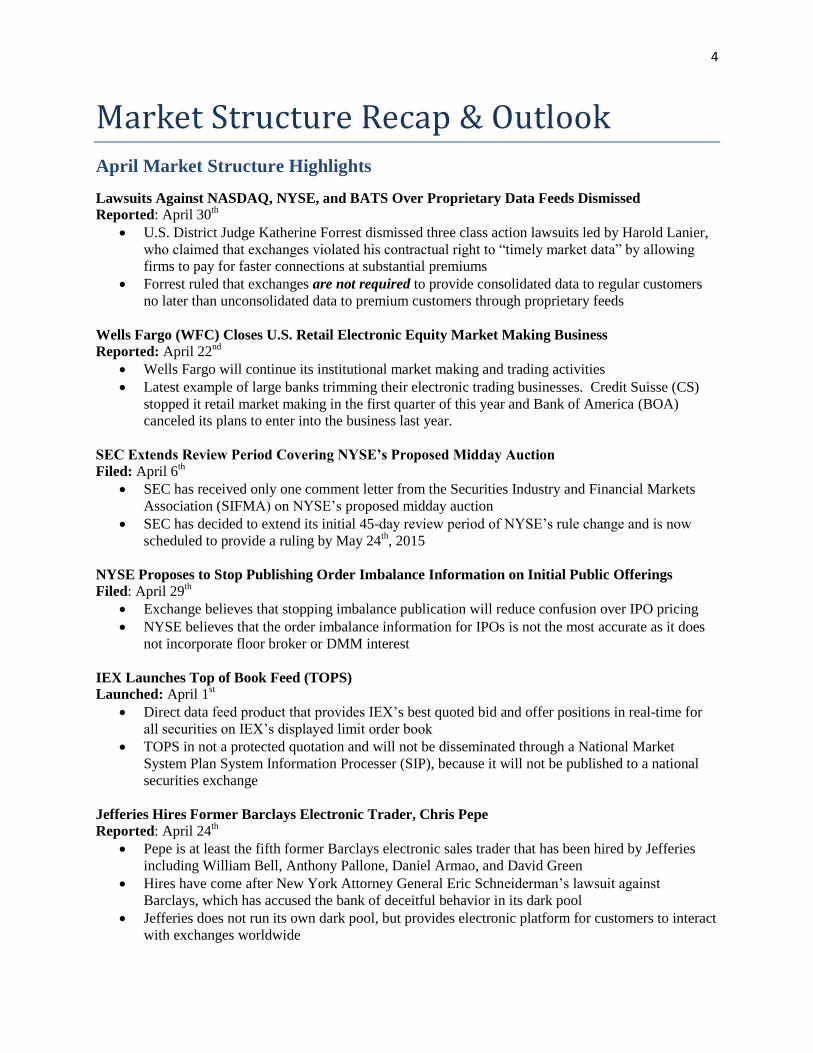
Lawsuits Against NASDAQ, NYSE, and BATS Over Proprietary Data Feeds Dismissed
Reported: April 30th
U.S. District Judge Katherine Forrest dismissed three class action lawsuits led by Harold Lanier,
who claimed that exchanges violated his contractual right to “timely market data” by allowing
firms to pay for faster connections at substantial premiums
Forrest ruled that exchanges are not required to provide consolidated data to regular customers
no later than unconsolidated data to premium customers through proprietary feeds
Wells Fargo (WFC) Closes U.S. Retail Electronic Equity Market Making Business
Reported: April 22nd
Wells Fargo will continue its institutional market making and trading activities
Latest example of large banks trimming their electronic trading businesses. Credit Suisse (CS)
stopped it retail market making in the first quarter of this year and Bank of America (BOA)
canceled its plans to enter into the business last year.
SEC Extends Review Period Covering NYSE’s Proposed Midday Auction
Filed: April 6th
SEC has received only one comment letter from the Securities Industry and Financial Markets
Association (SIFMA) on NYSE’s proposed midday auction
SEC has decided to extend its initial 45-day review period of NYSE’s rule change and is now
scheduled to provide a ruling by May 24th, 2015
NYSE Proposes to Stop Publishing Order Imbalance Information on Initial Public Offerings
Filed: April 29th
Exchange believes that stopping imbalance publication will reduce confusion over IPO pricing
NYSE believes that the order imbalance information for IPOs is not the most accurate as it does
not incorporate floor broker or DMM interest
IEX Launches Top of Book Feed (TOPS)
Launched: April 1st
Direct data feed product that provides IEX’s best quoted bid and offer positions in real-time for
all securities on IEX’s displayed limit order book
TOPS in not a protected quotation and will not be disseminated through a National Market
System Plan System Information Processer (SIP), because it will not be published to a national
securities exchange
Jefferies Hires Former Barclays Electronic Trader, Chris Pepe
Reported: April 24th
Pepe is at least the fifth former Barclays electronic sales trader that has been hired by Jefferies
including William Bell, Anthony Pallone, Daniel Armao, and David Green
Hires have come after New York Attorney General Eric Schneiderman’s lawsuit against
Barclays, which has accused the bank of deceitful behavior in its dark pool
Jefferies does not run its own dark pool, but provides electronic platform for customers to interact
with exchanges worldwide

5
Further Delay in FINRA’s Implementation of CARDS Wide Reaching Data Collection System Announced: April 30
th
FINRA Congressional Testimony
Details:
Motivation behind original CARDS proposal was to enhance FINRA’s monitoring capabilities to
identify fraud and abusive sales practices earlier
Financial industry raised serious concerns about availability of data, which if reverse engineered
could identify individual trades
FINRA has decided not to pursue CARDS in its present form and not to pursue revised versions
of a similar program until they have addressed industry concerns
T. Rowe Price (TROW) Experiments with HFT
Reported: May 1st
One of HFT’s biggest critics, T. Rowe, has reportedly launched a high frequency trading trial
through a partnership with Virtu Financial (VIRT)
The test began earlier this year and involves less than 1% of TROW’s orders
6
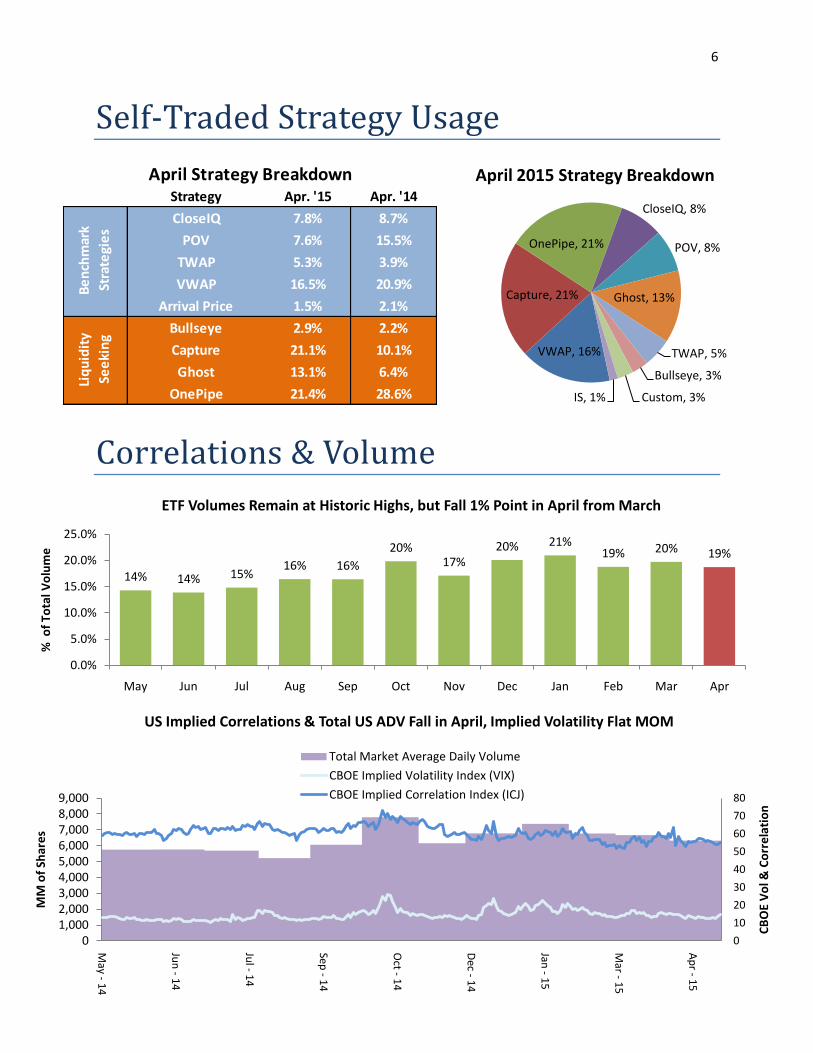
14% 14% 15%16% 16%
20%17%
20% 21%19% 20% 19%
0.0%
5.0%
10.0%
15.0%
20.0%
25.0%
May Jun Jul Aug Sep Oct Nov Dec Jan Feb Mar Apr
% o
f To
tal V
olu
me
ETF Volumes Remain at Historic Highs, but Fall 1% Point in April from March
01,0002,0003,0004,0005,0006,0007,0008,0009,000
May -
14
Jun
-1
4
Jul -
14
Sep -
14
Oct -
14
Dec -
14
Jan -
15
Mar -
15
Ap
r -1
5
0
10
20
30
40
50
60
70
80
MM
of
Shar
es
CB
OE
Vo
l & C
orr
ela
tio
n
US Implied Correlations & Total US ADV Fall in April, Implied Volatility Flat MOM
Total Market Average Daily Volume
CBOE Implied Volatility Index (VIX)
CBOE Implied Correlation Index (ICJ)
VWAP, 16%
Capture, 21%
OnePipe, 21%
CloseIQ, 8%
POV, 8%
Ghost, 13%
TWAP, 5%
Bullseye, 3%
Custom, 3%IS, 1%
April 2015 Strategy BreakdownStrategy Apr. '15 Apr. '14
CloseIQ 7.8% 8.7%
POV 7.6% 15.5%
TWAP 5.3% 3.9%
VWAP 16.5% 20.9%
Arrival Price 1.5% 2.1%
Bullseye 2.9% 2.2%
Capture 21.1% 10.1%
Ghost 13.1% 6.4%
OnePipe 21.4% 28.6%
Be
nch
mar
k
Stra
tegi
es
Liq
uid
ity
See
kin
g
April Strategy Breakdown
Self-Traded Strategy Usage
Correlations & Volume

7
12% 12%
8%7%
7%6% 5% 5%
4% 4% 4% 4% 3% 3% 3%2% 2% 1% 1% 1% 1% 1%
0%
2%
4%
6%
8%
10%
12%
14%
ATS Market Share (Apr. 6 - May 1)IEX Reclaims 50bps of Market Share in April
NYSE12.15%
NASDAQ15.24%
AMEX0.25%
PSX0.99%
Direct Edge9.10%
BATs BYX4.21%
ARCA10.91%
Boston1.76%
BATs BZX7.35%
B/D Internalized & Other ATS
38.06%
Venue April Break Down
2015 Venue Market Share Statistics1
1.8% 1.8%
1.2%1.1% 1.0%
.8% .8% .7% .6% .6% .6% .6% .5% .4% .4%.3% .3% .2% .2% .2% .1% .1%
0.0%
0.5%
1.0%
1.5%
2.0% ATS Market of Total Tier 1 NMS Volumes (Apr. 6 - May 1)
272 275 262
0
50
100
150
200
250
300
350
$B
ln (
USD
)
Average Daily Notional Turnover Falls in April MOM
8
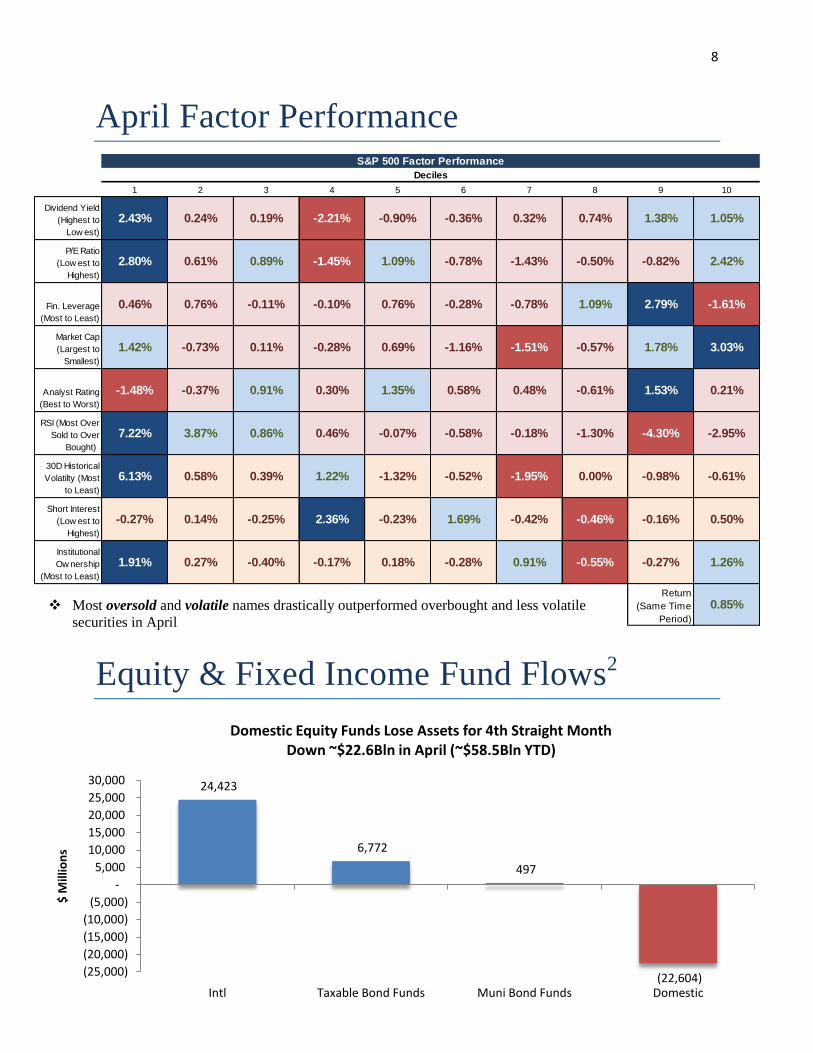
24,423
6,772
497
(22,604)(25,000)
(20,000)
(15,000)
(10,000)
(5,000)
-
5,000
10,000
15,000
20,000
25,000
30,000
Intl Taxable Bond Funds Muni Bond Funds Domestic
$ M
illio
ns
Domestic Equity Funds Lose Assets for 4th Straight Month Down ~$22.6Bln in April (~$58.5Bln YTD)
1 2 3 4 5 6 7 8 9 10
Dividend Yield
(Highest to
Low est)
2.43% 0.24% 0.19% -2.21% -0.90% -0.36% 0.32% 0.74% 1.38% 1.05%
P/E Ratio
(Low est to
Highest)
2.80% 0.61% 0.89% -1.45% 1.09% -0.78% -1.43% -0.50% -0.82% 2.42%
Fin. Leverage
(Most to Least)
0.46% 0.76% -0.11% -0.10% 0.76% -0.28% -0.78% 1.09% 2.79% -1.61%
Market Cap
(Largest to
Smallest)
1.42% -0.73% 0.11% -0.28% 0.69% -1.16% -1.51% -0.57% 1.78% 3.03%
Analyst Rating
(Best to Worst)
-1.48% -0.37% 0.91% 0.30% 1.35% 0.58% 0.48% -0.61% 1.53% 0.21%
RSI (Most Over
Sold to Over
Bought))
7.22% 3.87% 0.86% 0.46% -0.07% -0.58% -0.18% -1.30% -4.30% -2.95%
30D Historical
Volatilty (Most
to Least)
6.13% 0.58% 0.39% 1.22% -1.32% -0.52% -1.95% 0.00% -0.98% -0.61%
Short Interest
(Low est to
Highest)
-0.27% 0.14% -0.25% 2.36% -0.23% 1.69% -0.42% -0.46% -0.16% 0.50%
Institutional
Ow nership
(Most to Least)
1.91% 0.27% -0.40% -0.17% 0.18% -0.28% 0.91% -0.55% -0.27% 1.26%
S&P 500
Return
(Same Time
Period)
0.85%
Deciles
S&P 500 Factor Performance
April Factor Performance
Equity & Fixed Income Fund Flows2
Most oversold and volatile names drastically outperformed overbought and less volatile
securities in April
9
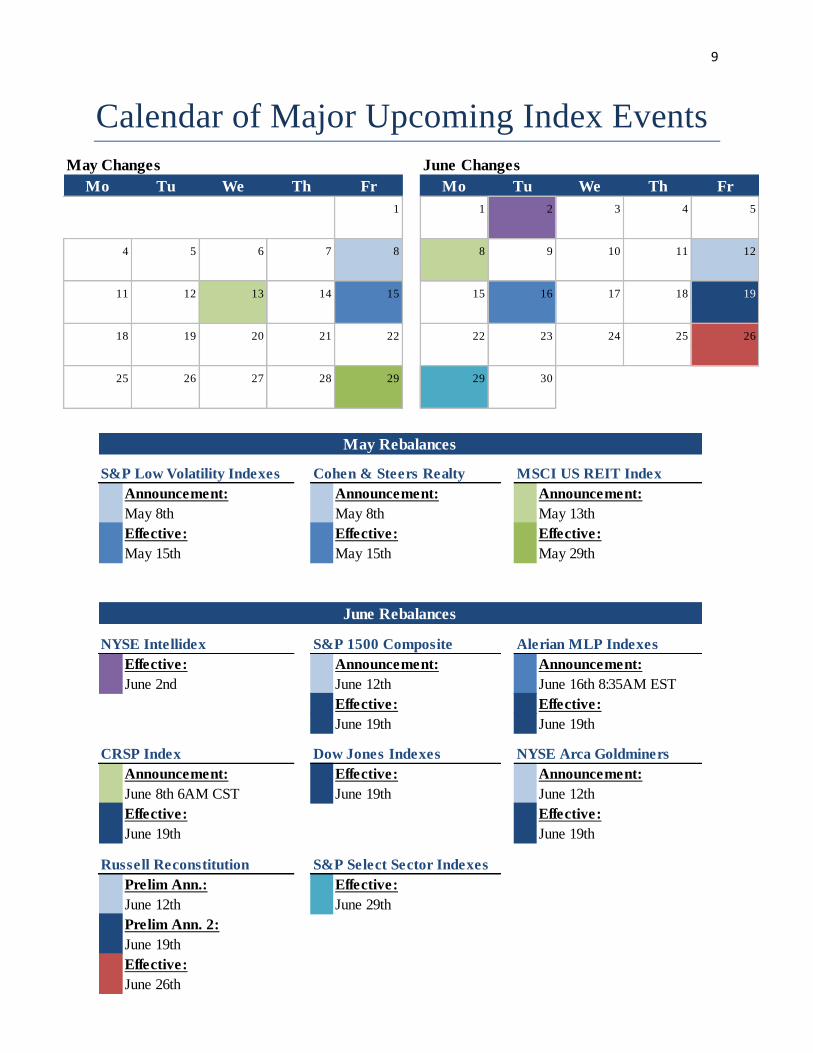
Announcement: Announcement: Announcement:
May 8th May 8th May 13th
Effective: Effective: Effective:
May 15th May 15th May 29th
Effective: Announcement: Announcement:
June 2nd June 12th June 16th 8:35AM EST
Effective: Effective:
June 19th June 19th
NYSE Arca Goldminers
Announcement: Effective: Announcement:
June 8th 6AM CST June 19th June 12th
Effective: Effective:
June 19th June 19th
Prelim Ann.: Effective:
June 12th June 29th
Prelim Ann. 2:
June 19th
Effective:
June 26th
June Rebalances
NYSE Intellidex Alerian MLP Indexes
Dow Jones Indexes
S&P 1500 Composite
CRSP Index
Russell Reconstitution
May Rebalances
S&P Low Volatility Indexes Cohen & Steers Realty MSCI US REIT Index
S&P Select Sector Indexes
May Changes June Changes
Mo Tu We Th Fr Mo Tu We Th Fr
1 1 2 3 4 5
4 5 6 7 8 8 9 10 11 12
11 12 13 14 15 15 16 17 18 19
18 19 20 21 22 22 23 24 25 26
25 26 27 28 29 29 30
Calendar of Major Upcoming Index Events

10
How to Read the Factor Analysis
Our factor analysis breaks down the S&P 500 into 100 groups based on the factors listed on the far left of the chart.
Each row takes a factor (e.g. Market Capitalization) and sorts the S&P 500 into 10 groups of 50 based on that factor
(called deciles). For example, the first row listed (Market Cap) is sorted from largest to smallest (as indicated) with
decile one consisting of the 50 largest stocks in the index and decile 10 consisting of the 50 smallest. It’s important
to note that a stock in decile one for Market Cap will likely not be in decile one for any other factor. For example,
GOOG is in decile one for Market Cap, but decile 10 for Dividend Yield, as it does not pay a dividend. Blue shading
means that decile outperformed the S&P, while red shading means the opposite. The growth vs. value decile ranks
the S&P 500 names based on their weights in the growth and value 500 indices as described in the figure.
Contacts
Judd Schwab Quantitative Desk Analyst Weeden Program Trading Group 203.861.9320 [email protected]
1 Venue market share reported by BATs, Direct Edge, BIDs, and Level Daily Trading summary
2All fund flows reported by Thomas Reuters Lipper Funds, formerly AMG
All Market Data is from Bloomberg or NYSE TAQ Disclosure: This publication is prepared by Weeden & Co.'s trading department, and not its research department. This
publication is for information purposes only and is based on information and data from sources considered to be reliable, but it
is not guaranteed as to accuracy and does not purport to be complete and are subject to change without notice. This
publication is neither intended nor should be considered as an offer or the solicitation of an offer to sell or buy any security or
other financial product. Nothing contained herein is intended to be, nor shall it be construed as, investment advice. Information
contained herein provides insufficient information upon which to base an investment decision. Any comments or statements
made herein do not necessarily reflect those of Weeden & Co. LP or its affiliates. 2015 Weeden & Co. LP.