Embed Size (px)
Citation preview
APRIL 2019 | RESEARCH BRIEF
The Challenges Facing CPS Administrators:
Roadblocks to School Improvement
Anna Bruzgulis, Holly Hart, and Christopher Young
Table of Contents
1 Introduction
3 Administrators’ Greatest Challenge
5 Challenges Removing and Hiring Teachers
7 Staffing Concerns in Charters vs. Non-Charters
8 Community Issues and Parent Connections
9 Three Categories of Roadblock Severity
11 Roadblocks and School Characteristics
14 Interpretive Summary
15 References
17 Appendix
20 Survey Results
24 Acknowledgements
Cite as:
Bruzgulis, A., Hart, H., & Young, C. (2019). The challenges facing CPS administrators: Roadblocks to school
improvement. Chicago, IL: University of Chicago Consortium on School Research.
This report reflects the interpretation of the authors. Although the UChicago Consortium’s Steering Committee
provided technical advice, no formal endorsement by these individuals or organizations, nor the full UChicago
Consortium should be assumed.
1The Challenges Facing CPS Administrators: Roadblocks to School Improvement
The academic leaders of schools—principals and assistant principals—play a critical
role in the success of their students. Both research and experience demonstrate that
an administrator’s job requires various skills to handle a broad scope of
responsibilities. The latest Professional Standards for Educational Leaders, released
in 2015, help illustrate the formidable complexity of this position.1
1 National Policy Board for Educational Administration (2015).
2 Hitt & Tucker (2016); Marzano, Waters, & McNulty (2005).
3 We also analyzed responses by responder position, years in position, school type (elementary/high school,
charter/non-charter), and school achievement level. Most differences were not noteworthy; those that were
are discussed in this brief.
The standards include 10 areas in which school
leaders must be proficient. These range broadly from
establishing a vision to managing operations,
cultivating relationships and a sense of relationships
to overseeing fundraising. Research has not
simplified, but has documented, the number of roles
successful leaders play. One recent review of
empirical evidence distinguished 28 practices of
effective school leaders; another identified 21—these
numbers illustrate the scope and complexity of the
principal’s role.2 Within schools, it seems that
principals choose practices that work best for them
and move forward, adjusting as necessary. However,
navigating these extensive and varied expectations
often creates many challenges for principals, and as
principals seek to improve their schools, some
challenges emerge as bigger roadblocks than others.
This brief provides insights into what administrators
in Chicago Public Schools (CPS) see as the greatest
roadblocks to school improvement, based on surveys
developed and administered by the University of
Chicago Consortium on School Research
(UChicago Consortium). Responses from the 2017
survey were analyzed and compared to previous
years to determine how such roadblocks have
changed over time.3 While no two administrators’
responses were the same, clear districtwide trends
surfaced: the emergence of financial concerns as
new top roadblocks for schools; the increased
saliency of roadblocks concerning human resources
in both charter and non-charter schools; and
increased concern over social challenges in the
community. In addition, patterns of administrators’
responses to roadblock items indicate that
respondents fell into three roughly equally-sized
groups that differ distinctly in breadth and depth of
concerns, from those facing limited roadblocks to
those facing considerable roadblocks. We identify
factors that increase a leader’s chances of falling into
the “Considerable Roadblocks” group, and conclude
by sharing what implications our findings may have
for practice and policy.
2 UChicago Consortium Research Brief
The Administrator Survey: An Overview
The UChicago Consortium’s Administrator Survey—different
from the 5Essentials Surveys given to teachers and students
annually in Chicago—has been administered in the spring
semester 14 times since 1992, in order to provide insights into
administrators’ perceptions on key aspects of their work.A
These surveys have provided insights for Consortium reports
on REACHB and the Common Core State Standards,c for
example, and have helped foster a deeper understanding of
administrators’ experiences across Chicago.
In the spring of 2017, the UChicago Consortium surveyed
1,363 principals, assistant principals, and other lead
administrators in 658 schools. Our response rate for the
survey was 51 percent. Slightly fewer administrators
responded to the questions specifically about roadblocks
(549), giving us a 40 percent response rate for that section.
(During analysis, we found no substantial response differences
between principals and other administrators, so we will refer
to administrators collectively in this report.) Further details
and bias analysis can be found in the Appendix.
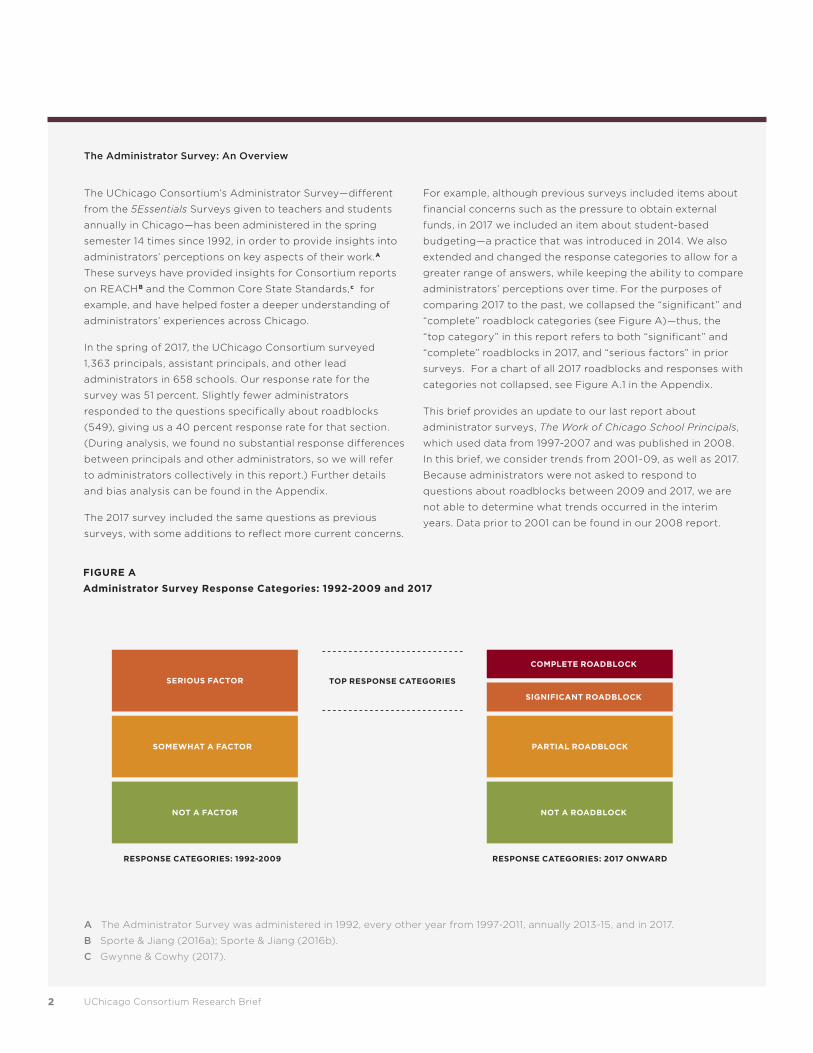
The 2017 survey included the same questions as previous
surveys, with some additions to reflect more current concerns.
For example, although previous surveys included items about
financial concerns such as the pressure to obtain external
funds, in 2017 we included an item about student-based
budgeting—a practice that was introduced in 2014. We also
extended and changed the response categories to allow for a
greater range of answers, while keeping the ability to compare
administrators’ perceptions over time. For the purposes of
comparing 2017 to the past, we collapsed the “significant” and
“complete” roadblock categories (see Figure A)—thus, the
“top category” in this report refers to both “significant” and
“complete” roadblocks in 2017, and “serious factors” in prior
surveys. For a chart of all 2017 roadblocks and responses with
categories not collapsed, see Figure A.1 in the Appendix.
This brief provides an update to our last report about
administrator surveys, The Work of Chicago School Principals,
which used data from 1997-2007 and was published in 2008.
In this brief, we consider trends from 2001-09, as well as 2017.
Because administrators were not asked to respond to
questions about roadblocks between 2009 and 2017, we are
not able to determine what trends occurred in the interim
years. Data prior to 2001 can be found in our 2008 report.
A The Administrator Survey was administered in 1992, every other year from 1997-2011, annually 2013-15, and in 2017.
B Sporte & Jiang (2016a); Sporte & Jiang (2016b).
C Gwynne & Cowhy (2017).
FIGURE A
Administrator Survey Response Categories: 1992-2009 and 2017
SERIOUS FACTOR
COMPLETE ROADBLOCK
SIGNIFICANT ROADBLOCK
PARTIAL ROADBLOCK
NOT A ROADBLOCK
SOMEWHAT A FACTOR
NOT A FACTOR
RESPONSE CATEGORIES: 1992-2009
TOP RESPONSE CATEGORIES
RESPONSE CATEGORIES: 2017 ONWARD
3The Challenges Facing CPS Administrators: Roadblocks to School Improvement
Administrators’ Greatest Challenge: Financial Concerns
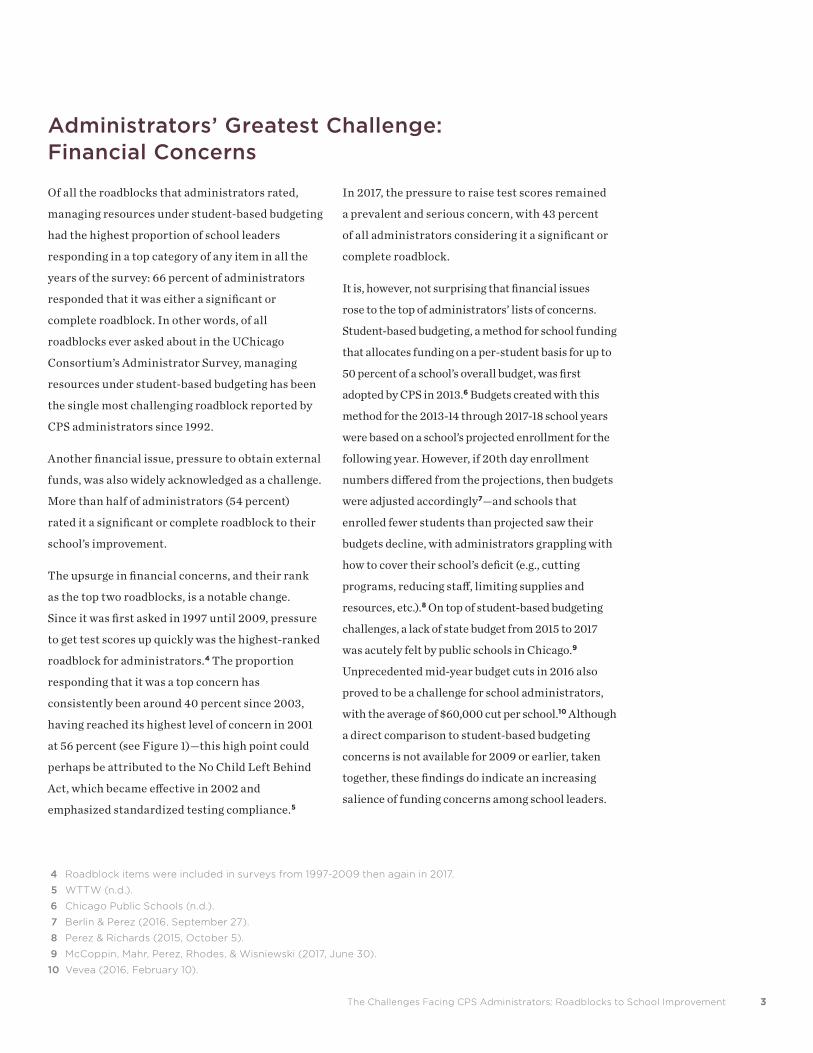
Of all the roadblocks that administrators rated,
managing resources under student-based budgeting
had the highest proportion of school leaders
responding in a top category of any item in all the
years of the survey: 66 percent of administrators
responded that it was either a significant or
complete roadblock. In other words, of all
roadblocks ever asked about in the UChicago
Consortium’s Administrator Survey, managing
resources under student-based budgeting has been
the single most challenging roadblock reported by
CPS administrators since 1992.
Another financial issue, pressure to obtain external
funds, was also widely acknowledged as a challenge.
More than half of administrators (54 percent)
rated it a significant or complete roadblock to their
school’s improvement.
The upsurge in financial concerns, and their rank
as the top two roadblocks, is a notable change.
Since it was first asked in 1997 until 2009, pressure
to get test scores up quickly was the highest-ranked
roadblock for administrators.4 The proportion
responding that it was a top concern has
consistently been around 40 percent since 2003,
having reached its highest level of concern in 2001
at 56 percent (see Figure 1)—this high point could
perhaps be attributed to the No Child Left Behind
Act, which became effective in 2002 and
emphasized standardized testing compliance.5
In 2017, the pressure to raise test scores remained
a prevalent and serious concern, with 43 percent
of all administrators considering it a significant or
complete roadblock.
It is, however, not surprising that financial issues
rose to the top of administrators’ lists of concerns.
Student-based budgeting, a method for school funding
that allocates funding on a per-student basis for up to
50 percent of a school’s overall budget, was first
adopted by CPS in 2013.6 Budgets created with this
method for the 2013-14 through 2017-18 school years
were based on a school’s projected enrollment for the
following year. However, if 20th day enrollment
numbers differed from the projections, then budgets
were adjusted accordingly7—and schools that
enrolled fewer students than projected saw their
budgets decline, with administrators grappling with
how to cover their school’s deficit (e.g., cutting
programs, reducing staff, limiting supplies and
resources, etc.).8 On top of student-based budgeting
challenges, a lack of state budget from 2015 to 2017
was acutely felt by public schools in Chicago.9
Unprecedented mid-year budget cuts in 2016 also
proved to be a challenge for school administrators,
with the average of $60,000 cut per school.10 Although
a direct comparison to student-based budgeting
concerns is not available for 2009 or earlier, taken
together, these findings do indicate an increasing
salience of funding concerns among school leaders.
4 Roadblock items were included in surveys from 1997-2009 then again in 2017.
5 WTTW (n.d.).
6 Chicago Public Schools (n.d.).
7 Berlin & Perez (2016, September 27).
8 Perez & Richards (2015, October 5).
9 McCoppin, Mahr, Perez, Rhodes, & Wisniewski (2017, June 30).
10 Vevea (2016, February 10).
4 UChicago Consortium Research Brief
FIGURE 1
In 2017, Financial Concerns Surpassed Pressure to Increase Test Scores as the Highest-Rated Roadblock
11 Karp (2018, April 17).
12 Perez (2018, March 7); FitzPatrick (2018, March 7).
13 The Chicago Public Education Fund (n.d.).
In 2018, the district’s new CEO, Dr. Janice Jackson,
made significant changes to the student-based
budgeting process. Principals received their 2018-19
budgets in April 2018, rather than July 2018.11 That
budget was based on actual enrollment for the
2017-18 school year, rather than a projection for the
2018-19 school year—and no funds were cut if student
enrollment decreased, but additional funds were
provided if enrollment increased.12 This may lessen
financial concerns in coming years. However, as of
spring of 2018 when the Chicago Public Education
Fund conducted their latest CPS principal survey,
funding concerns remained at the forefront of
principals’ minds. A question regarding what would
need to be improved for a principal to stay in their
role longer showed that “my school’s available
funding” was mentioned most frequently, followed
closely by “time and effort needed for compliance
requirements.” 13 Future surveys will continue to
provide insight on administrators’ perceptions of
financial concerns.
5The Challenges Facing CPS Administrators: Roadblocks to School Improvement
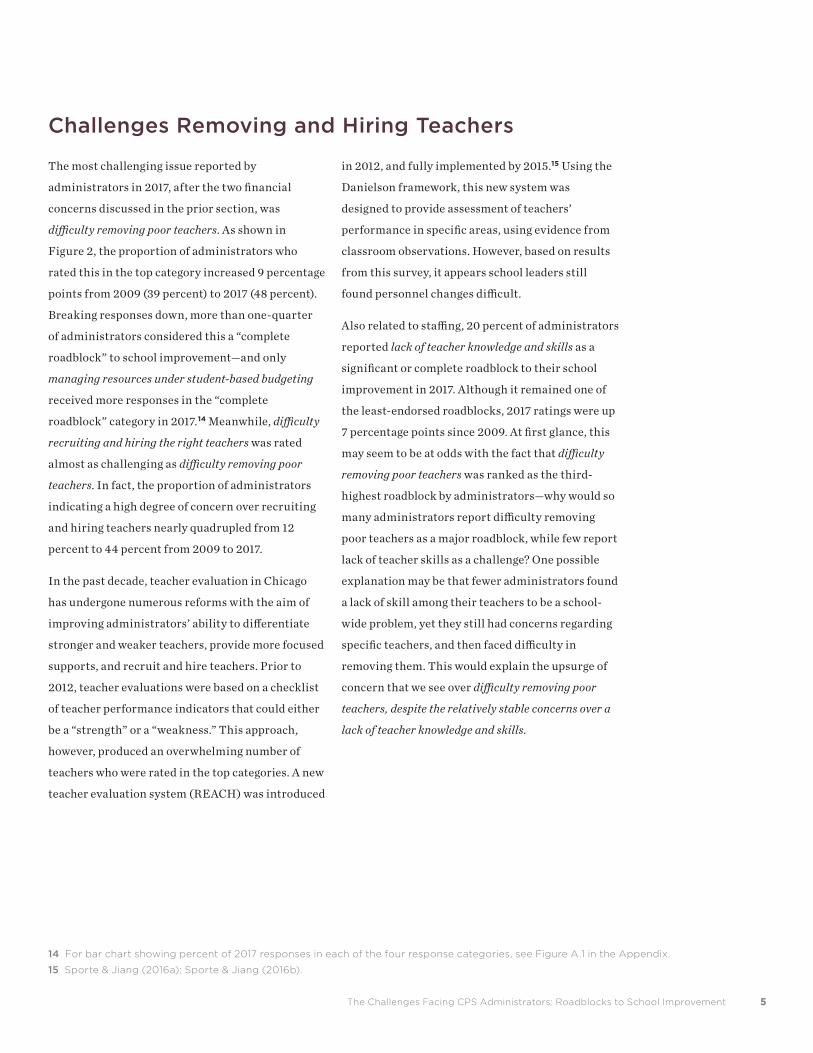
Challenges Removing and Hiring Teachers
The most challenging issue reported by
administrators in 2017, after the two financial
concerns discussed in the prior section, was
difficulty removing poor teachers. As shown in
Figure 2, the proportion of administrators who
rated this in the top category increased 9 percentage
points from 2009 (39 percent) to 2017 (48 percent).
Breaking responses down, more than one-quarter
of administrators considered this a “complete
roadblock” to school improvement—and only
managing resources under student-based budgeting
received more responses in the “complete
roadblock” category in 2017.14 Meanwhile, difficulty
recruiting and hiring the right teachers was rated
almost as challenging as difficulty removing poor
teachers. In fact, the proportion of administrators
indicating a high degree of concern over recruiting
and hiring teachers nearly quadrupled from 12
percent to 44 percent from 2009 to 2017.
In the past decade, teacher evaluation in Chicago
has undergone numerous reforms with the aim of
improving administrators’ ability to differentiate
stronger and weaker teachers, provide more focused
supports, and recruit and hire teachers. Prior to
2012, teacher evaluations were based on a checklist
of teacher performance indicators that could either
be a “strength” or a “weakness.” This approach,
however, produced an overwhelming number of
teachers who were rated in the top categories. A new
teacher evaluation system (REACH) was introduced
in 2012, and fully implemented by 2015.15 Using the
Danielson framework, this new system was
designed to provide assessment of teachers’
performance in specific areas, using evidence from
classroom observations. However, based on results
from this survey, it appears school leaders still
found personnel changes difficult.
Also related to staffing, 20 percent of administrators
reported lack of teacher knowledge and skills as a
significant or complete roadblock to their school
improvement in 2017. Although it remained one of
the least-endorsed roadblocks, 2017 ratings were up
7 percentage points since 2009. At first glance, this
may seem to be at odds with the fact that difficulty
removing poor teachers was ranked as the third-
highest roadblock by administrators—why would so
many administrators report difficulty removing
poor teachers as a major roadblock, while few report
lack of teacher skills as a challenge? One possible
explanation may be that fewer administrators found
a lack of skill among their teachers to be a school-
wide problem, yet they still had concerns regarding
specific teachers, and then faced difficulty in
removing them. This would explain the upsurge of
concern that we see over difficulty removing poor
teachers, despite the relatively stable concerns over a
lack of teacher knowledge and skills.
14 For bar chart showing percent of 2017 responses in each of the four response categories, see Figure A.1 in the Appendix.
15 Sporte & Jiang (2016a); Sporte & Jiang (2016b).
6 UChicago Consortium Research Brief
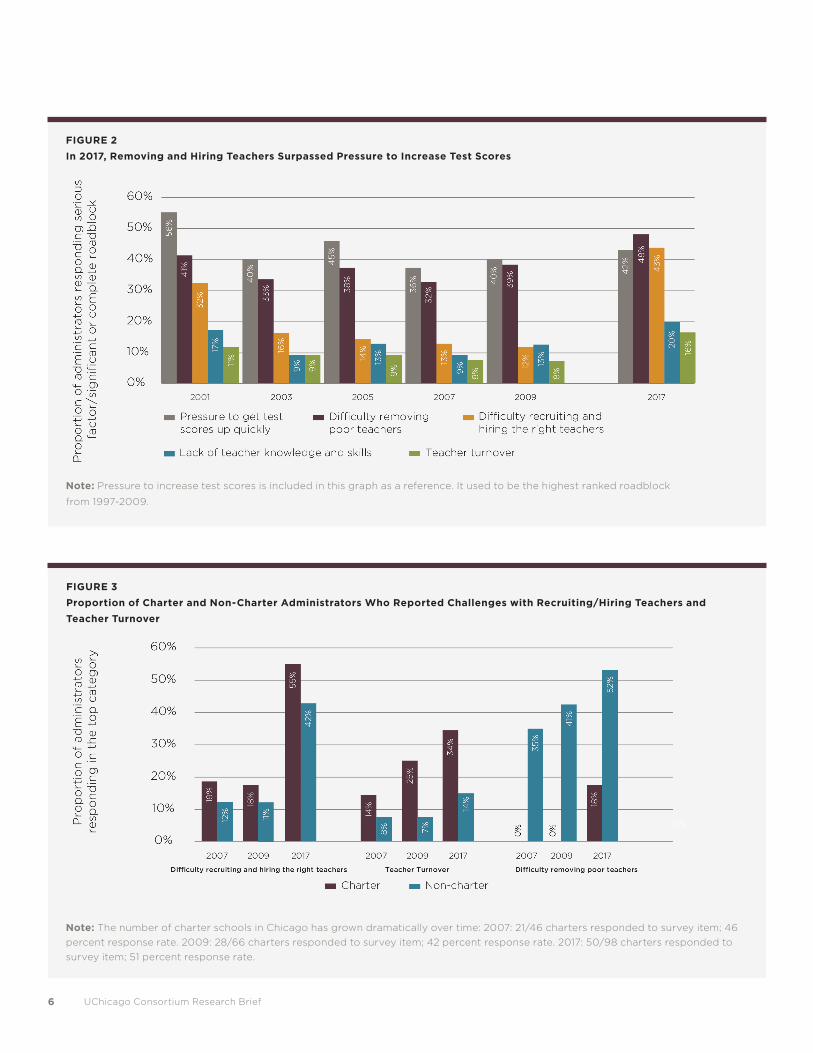
FIGURE 2
In 2017, Removing and Hiring Teachers Surpassed Pressure to Increase Test Scores
Note: Pressure to increase test scores is included in this graph as a reference. It used to be the highest ranked roadblock
from 1997-2009.
FIGURE 3
Proportion of Charter and Non-Charter Administrators Who Reported Challenges with Recruiting/Hiring Teachers and
Teacher Turnover
Note: The number of charter schools in Chicago has grown dramatically over time: 2007: 21/46 charters responded to survey item; 46
percent response rate. 2009: 28/66 charters responded to survey item; 42 percent response rate. 2017: 50/98 charters responded to
survey item; 51 percent response rate.
7The Challenges Facing CPS Administrators: Roadblocks to School Improvement
Staffing Concerns in Charters vs. Non-Charters
Overall, administrators in CPS reported facing
significant human resource challenges, as shown in
Figure 2. Looking more closely at charter and non-
charter administrators’ 2017 survey responses revealed
differences between the two groups (see Figure 3).
Charter administrators reported greater difficulties in
recruiting and hiring teachers. Although the challenge
of recruiting and hiring teachers has increased for both
charter and non-charter administrators, historically
more charter administrators have reported it as a top
roadblock. On average, since 2007, the proportion of
charter school administrators responding in the top
category for difficulty recruiting and hiring the right
teachers has been 9 percentage points higher than their
non-charter counterparts (see Figure 3). In 2017, more
than one-half of all charter school administrators
(55 percent) said that recruiting and hiring the right
teachers was a top roadblock in their schools, compared
to 42 percent of non-charter administrators.
Charter school administrators also found teacher
turnover to be a much larger issue than administrators
in non-charter schools (Figure 3). In 2017, more than
one-third of charter school administrators (34 percent)
said teacher turnover was a significant or complete
roadblock, while only 14 percent of non-charter
administrators had similar levels of concern.
This is part of a larger trend over time—starting in
2007, as the number of charters increased in the
district, the gap between charter and non-charter
administrators’ reports on the challenges of teacher
turnover grew larger as well. By 2017, the number
of charter school administrators who viewed teacher
turnover as a significant or complete roadblock
was 20 percentage points higher than non-charter
administrators.
Despite reporting challenges with both recruiting
and hiring teachers and teacher turnover, charter
school administrators reported that removing poor
teachers was much less difficult. In fact, from
2007-09, not a single charter school administrator
reported difficulty removing teachers as a serious
factor to their school’s improvement. In 2017,
difficulty removing poor teachers did become a top
roadblock to 18 percent of charter school
administrators. This proportion is three times higher
(54 percent) among non-charter administrators.
Research does not point to any conclusive evidence
that would explain these differences, and
determining the reasons for these differences is
beyond the scope of this report.
8 UChicago Consortium Research Brief
Community Issues and Parent Connections
Since 2009, there has been a steady increase in the
proportion of administrators reporting that social
problems in the school’s community (poverty, gangs,
drugs, etc.) are a top roadblock to school
improvement. Whereas slightly less than one-third
(31 percent) of administrators viewed social problems
as a top roadblock in 2009, by 2017 this number had
grown to include 43 percent of administrators.
Although the same proportion of administrators (43
percent) rated pressure to get test scores up quickly in
the top category in 2017, slightly more respondents
rated social problems a “complete” roadblock (17
percent) compared to test scores (13 percent).
Unfortunately, because the wording of this survey
item is very general, it is not possible to know which
aspect of social problems in the school’s community
administrators were referring to specifically. We also
lack respondent data for the years between 2009 and
2017. However, increased concerns about this
roadblock mirror a rise in crime rates during this
period, so the two may be correlated.16
In terms of the ties between parents and schools,
administrators reported that although mistrust
between teachers and parents remained a fairly low
level roadblock, a lack of parent support had grown
as a top roadblock for many. In 2017, 87 percent of
administrators said that mistrust between teachers
and parents was only a “partial roadblock” or
“not a roadblock” at all (a slight decrease from 2009,
when 93 percent of administrators responded that
teacher-parent trust was “not a factor” or only
“somewhat a factor” to school improvement). 17
However, a lack of parental support was a top
roadblock to almost one-third of administrators
in 2017. It is unclear, from this survey item alone,
in which areas administrators want parents to be
more supportive. For some, extra support may mean
additional funds brought to the school through
fundraisers and school events. For others, this may
mean parents supporting students at home with
homework and class projects. Still for others, the
parental support they may be seeking could be
social-emotional, in terms of supporting the school
mission and community. In the future, we intend
to include survey items that could better distinguish
among the support school administrators seek
from parents.
16 Bentle, Berlin, Marx, & Rumore (2018, January 9).
17 Response categories changed between 2009 and 2017—“Not a factor/Somewhat a factor/Serious factor”
changed to “Not a roadblock/Partial roadblock/Significant roadblock/Complete roadblock.”
9The Challenges Facing CPS Administrators: Roadblocks to School Improvement
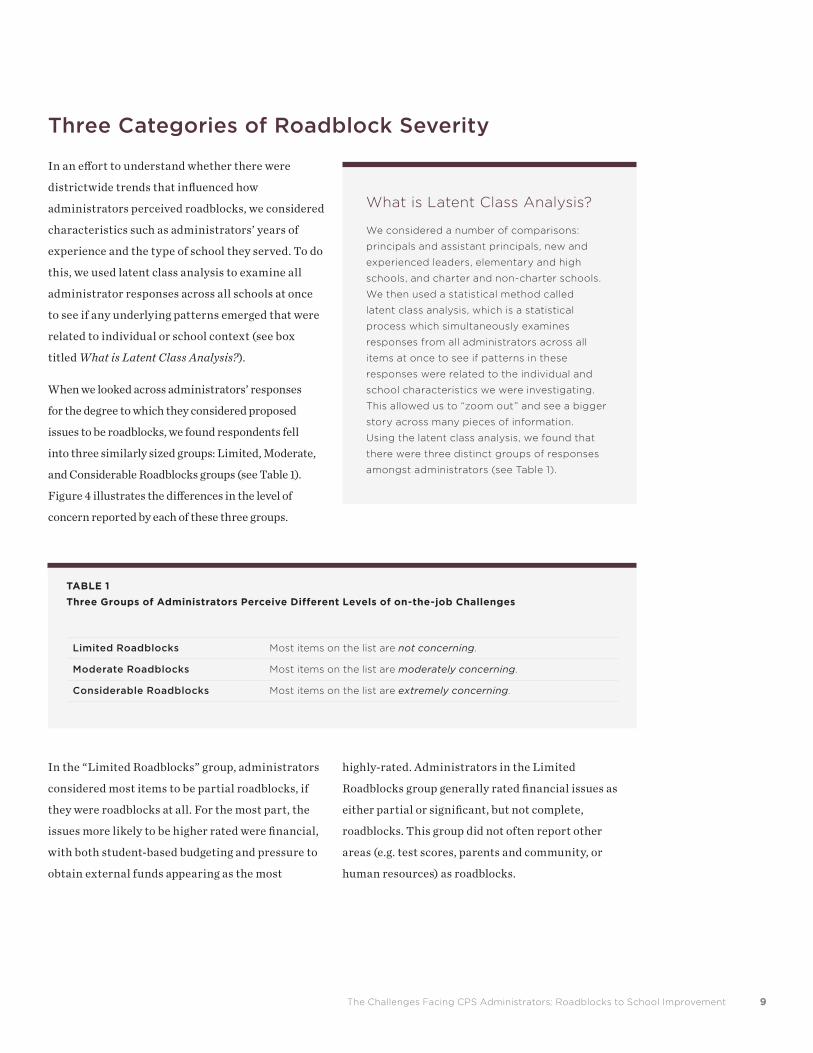
Three Categories of Roadblock Severity
In an effort to understand whether there were
districtwide trends that influenced how
administrators perceived roadblocks, we considered
characteristics such as administrators’ years of
experience and the type of school they served. To do
this, we used latent class analysis to examine all
administrator responses across all schools at once
to see if any underlying patterns emerged that were
related to individual or school context (see box
titled What is Latent Class Analysis?).
When we looked across administrators’ responses
for the degree to which they considered proposed
issues to be roadblocks, we found respondents fell
into three similarly sized groups: Limited, Moderate,
and Considerable Roadblocks groups (see Table 1).
Figure 4 illustrates the differences in the level of
concern reported by each of these three groups.
What is Latent Class Analysis?
We considered a number of comparisons:
principals and assistant principals, new and
experienced leaders, elementary and high
schools, and charter and non-charter schools.
We then used a statistical method called
latent class analysis, which is a statistical
process which simultaneously examines
responses from all administrators across all
items at once to see if patterns in these
responses were related to the individual and
school characteristics we were investigating.
This allowed us to “zoom out” and see a bigger
story across many pieces of information.
Using the latent class analysis, we found that
there were three distinct groups of responses
amongst administrators (see Table 1).
In the “Limited Roadblocks” group, administrators
considered most items to be partial roadblocks, if
they were roadblocks at all. For the most part, the
issues more likely to be higher rated were financial,
with both student-based budgeting and pressure to
obtain external funds appearing as the most
highly-rated. Administrators in the Limited
Roadblocks group generally rated financial issues as
either partial or significant, but not complete,
roadblocks. This group did not often report other
areas (e.g. test scores, parents and community, or
human resources) as roadblocks.
TABLE 1
Three Groups of Administrators Perceive Different Levels of on-the-job Challenges
Limited Roadblocks Most items on the list are not concerning.
Moderate Roadblocks Most items on the list are moderately concerning.
Considerable Roadblocks Most items on the list are extremely concerning.
10 UChicago Consortium Research Brief
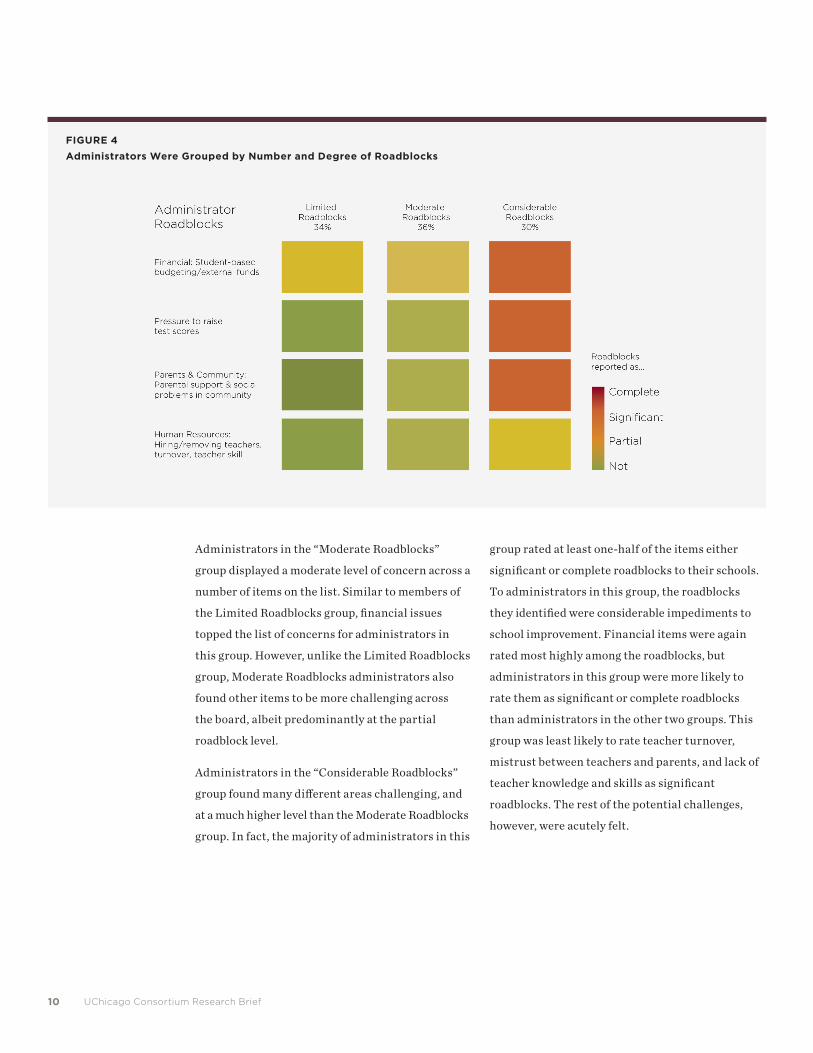
Administrators in the “Moderate Roadblocks”
group displayed a moderate level of concern across a
number of items on the list. Similar to members of
the Limited Roadblocks group, financial issues
topped the list of concerns for administrators in
this group. However, unlike the Limited Roadblocks
group, Moderate Roadblocks administrators also
found other items to be more challenging across
the board, albeit predominantly at the partial
roadblock level.
Administrators in the “Considerable Roadblocks”
group found many different areas challenging, and
at a much higher level than the Moderate Roadblocks
group. In fact, the majority of administrators in this
group rated at least one-half of the items either
significant or complete roadblocks to their schools.
To administrators in this group, the roadblocks
they identified were considerable impediments to
school improvement. Financial items were again
rated most highly among the roadblocks, but
administrators in this group were more likely to
rate them as significant or complete roadblocks
than administrators in the other two groups. This
group was least likely to rate teacher turnover,
mistrust between teachers and parents, and lack of
teacher knowledge and skills as significant
roadblocks. The rest of the potential challenges,
however, were acutely felt.
FIGURE 4
Administrators Were Grouped by Number and Degree of Roadblocks
11The Challenges Facing CPS Administrators: Roadblocks to School Improvement
Roadblocks and School Characteristics
In an effort to understand whether administrators’
level of concern with roadblocks was greater in
schools with particular characteristics, we analyzed
the data by looking at structural factors first.
Neither the type of school (charter vs. non-charter)
nor the overall number of students differed
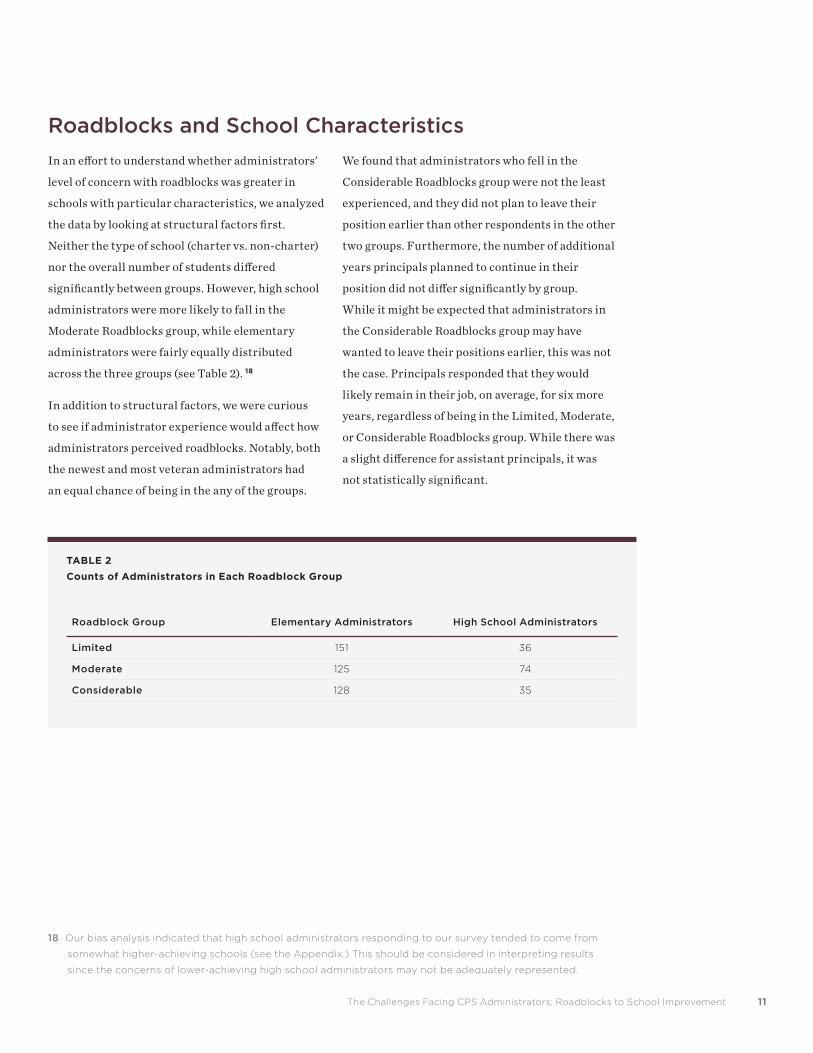
significantly between groups. However, high school
administrators were more likely to fall in the
Moderate Roadblocks group, while elementary
administrators were fairly equally distributed
across the three groups (see Table 2). 18
In addition to structural factors, we were curious
to see if administrator experience would affect how
administrators perceived roadblocks. Notably, both
the newest and most veteran administrators had
an equal chance of being in the any of the groups.
We found that administrators who fell in the
Considerable Roadblocks group were not the least
experienced, and they did not plan to leave their
position earlier than other respondents in the other
two groups. Furthermore, the number of additional
years principals planned to continue in their
position did not differ significantly by group.
While it might be expected that administrators in
the Considerable Roadblocks group may have
wanted to leave their positions earlier, this was not
the case. Principals responded that they would
likely remain in their job, on average, for six more
years, regardless of being in the Limited, Moderate,
or Considerable Roadblocks group. While there was
a slight difference for assistant principals, it was
not statistically significant.
TABLE 2
Counts of Administrators in Each Roadblock Group
Roadblock Group Elementary Administrators High School Administrators
Limited 151 36
Moderate 125 74
Considerable 128 35
18 Our bias analysis indicated that high school administrators responding to our survey tended to come from
somewhat higher-achieving schools (see the Appendix.) This should be considered in interpreting results
since the concerns of lower-achieving high school administrators may not be adequately represented.
12 UChicago Consortium Research Brief
Administrators Serving Students
with Greater Needs Tended to
Experience Roadblocks of Greater
Number and Intensity.
Next, we wondered whether administrators in the
Considerable Roadblocks group worked in schools
with the greatest needs for resources. In order to
examine this question, we included schools’
percentage of diverse learners and percentage of
students eligible for free/reduced-price lunch in
the latent class analysis (described in box on page 9).
We found that in schools with higher rates of
students in these categories, administrators
reported experiencing higher levels of roadblocks.
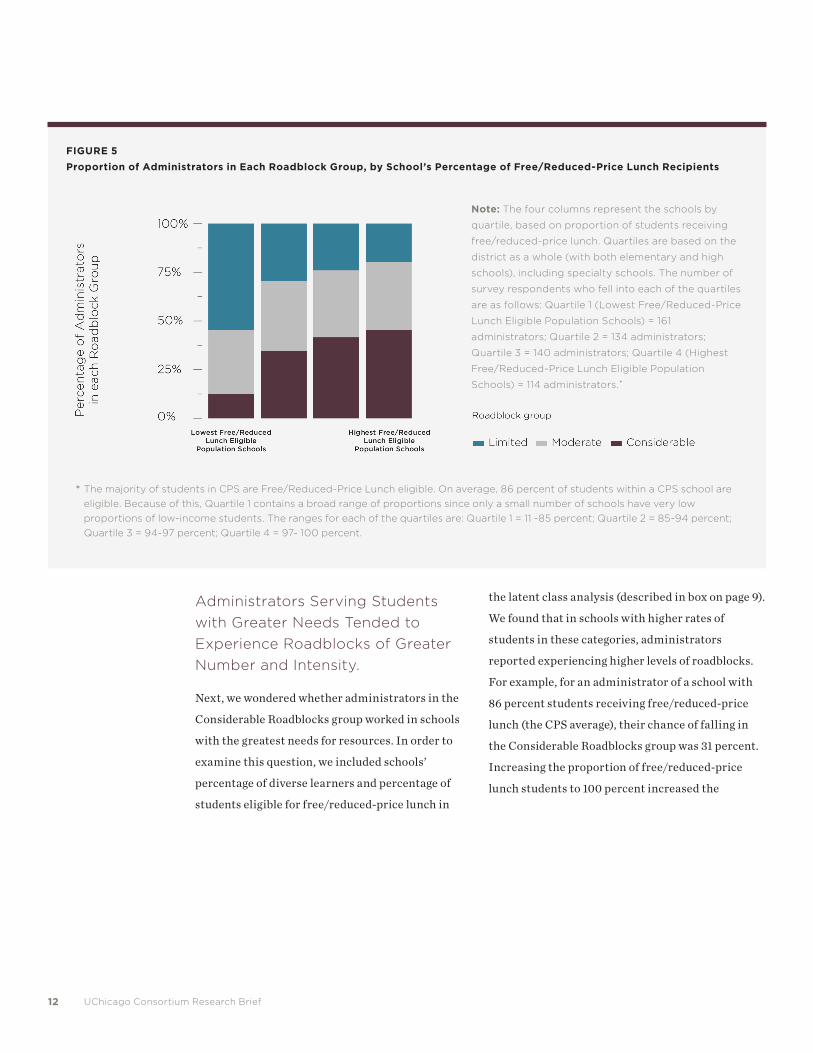
For example, for an administrator of a school with
86 percent students receiving free/reduced-price
lunch (the CPS average), their chance of falling in
the Considerable Roadblocks group was 31 percent.
Increasing the proportion of free/reduced-price
lunch students to 100 percent increased the
FIGURE 5
Proportion of Administrators in Each Roadblock Group, by School’s Percentage of Free/Reduced-Price Lunch Recipients
Note: The four columns represent the schools by
quartile, based on proportion of students receiving
free/reduced-price lunch. Quartiles are based on the
district as a whole (with both elementary and high
schools), including specialty schools. The number of
survey respondents who fell into each of the quartiles
are as follows: Quartile 1 (Lowest Free/Reduced-Price
Lunch Eligible Population Schools) = 161
administrators; Quartile 2 = 134 administrators;
Quartile 3 = 140 administrators; Quartile 4 (Highest
Free/Reduced-Price Lunch Eligible Population
Schools) = 114 administrators. *
* The majority of students in CPS are Free/Reduced-Price Lunch eligible. On average, 86 percent of students within a CPS school are
eligible. Because of this, Quartile 1 contains a broad range of proportions since only a small number of schools have very low
proportions of low-income students. The ranges for each of the quartiles are: Quartile 1 = 11 -85 percent; Quartile 2 = 85-94 percent;
Quartile 3 = 94-97 percent; Quartile 4 = 97- 100 percent.
13The Challenges Facing CPS Administrators: Roadblocks to School Improvement
administrator’s chances of being in the
Considerable Roadblock group to 45 percent, a
difference of 14 percentage points. Similarly,
increasing the proportion of diverse learners per
school by one standard deviation (from a CPS
average of 18.5 percent to 35 percent) increased the
chances of being in the Considerable Roadblock
group from 31 percent to 41 percent.
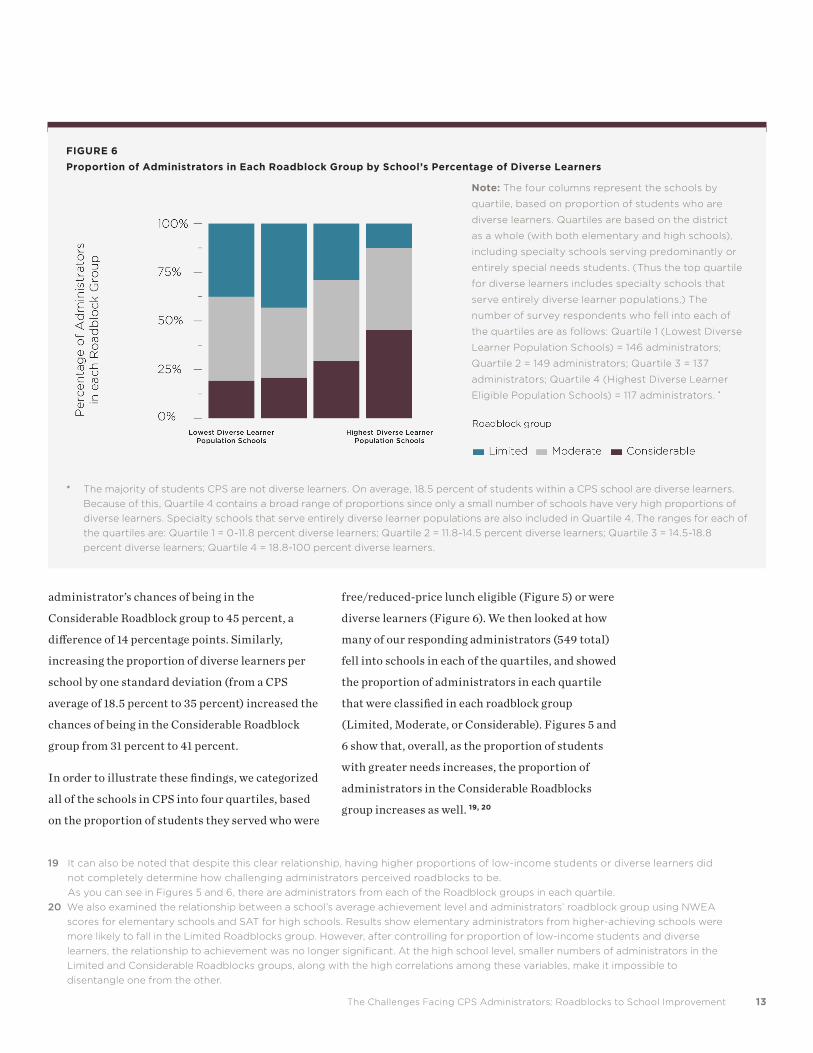
In order to illustrate these findings, we categorized
all of the schools in CPS into four quartiles, based
on the proportion of students they served who were
free/reduced-price lunch eligible (Figure 5) or were
diverse learners (Figure 6). We then looked at how
many of our responding administrators (549 total)
fell into schools in each of the quartiles, and showed
the proportion of administrators in each quartile
that were classified in each roadblock group
(Limited, Moderate, or Considerable). Figures 5 and
6 show that, overall, as the proportion of students
with greater needs increases, the proportion of
administrators in the Considerable Roadblocks
group increases as well. 19, 20
FIGURE 6
Proportion of Administrators in Each Roadblock Group by School’s Percentage of Diverse Learners
Note: The four columns represent the schools by
quartile, based on proportion of students who are
diverse learners. Quartiles are based on the district
as a whole (with both elementary and high schools),
including specialty schools serving predominantly or
entirely special needs students. (Thus the top quartile
for diverse learners includes specialty schools that
serve entirely diverse learner populations.) The
number of survey respondents who fell into each of
the quartiles are as follows: Quartile 1 (Lowest Diverse
Learner Population Schools) = 146 administrators;
Quartile 2 = 149 administrators; Quartile 3 = 137
administrators; Quartile 4 (Highest Diverse Learner
Eligible Population Schools) = 117 administrators. *
* The majority of students CPS are not diverse learners. On average, 18.5 percent of students within a CPS school are diverse learners.
Because of this, Quartile 4 contains a broad range of proportions since only a small number of schools have very high proportions of
diverse learners. Specialty schools that serve entirely diverse learner populations are also included in Quartile 4. The ranges for each of
the quartiles are: Quartile 1 = 0-11.8 percent diverse learners; Quartile 2 = 11.8-14.5 percent diverse learners; Quartile 3 = 14.5-18.8
percent diverse learners; Quartile 4 = 18.8-100 percent diverse learners.
19 It can also be noted that despite this clear relationship, having higher proportions of low-income students or diverse learners did
not completely determine how challenging administrators perceived roadblocks to be.
As you can see in Figures 5 and 6, there are administrators from each of the Roadblock groups in each quartile.
20 We also examined the relationship between a school’s average achievement level and administrators’ roadblock group using NWEA
scores for elementary schools and SAT for high schools. Results show elementary administrators from higher-achieving schools were
more likely to fall in the Limited Roadblocks group. However, after controlling for proportion of low-income students and diverse
learners, the relationship to achievement was no longer significant. At the high school level, smaller numbers of administrators in the
Limited and Considerable Roadblocks groups, along with the high correlations among these variables, make it impossible to
disentangle one from the other.
14 UChicago Consortium Research Brief
Interpretive Summary
In the eight years since the UChicago Consortium’s last Administrator Survey in
2009, CPS school administrators’ concerns about the pressure to raise test scores
have been surpassed by both financial and human resource worries, and is equaled
by worries over social and safety issues in their communities.
21 Sparks (2017, November 9).
During this period, administrators’ level of concern
over test scores remained consistent over time, even
though a recent study found that “across racial
groups…Chicago students learned significantly
faster from grades 3 to 8
than did students in nearly
all other U.S. districts—
gaining about six years’
worth of learning in five
years.” 21 However, despite
showing remarkable
improvements around test
scores, our results indicate
that challenges in this and other areas still persist
for many of Chicago’s administrators.
To ensure all schools are able to thrive,
policymakers and district staff may want to
consider which supports can best address
administrators’ and schools’ needs. Most pressing
are the one-third of administrators who reported
substantial roadblocks in nearly every category
included on the survey. Yet, regardless of the
number and intensity of roadblocks facing them,
school leaders demonstrate a willingness to stay
engaged and look for solutions—planning to stay an
additional six years on average in their leadership
roles. In thinking about these roles, it becomes
apparent just how much we expect from our schools’
administrators. We see them as educational leaders,
as role models for our students, as supporters for
teacher success, and as community partners. Each
one of these roles is already challenging, and
financial, human resource, and community
concerns present administrators with additional
challenges as well. This brief illuminates some of
these areas that may most benefit from additional
support. Although solutions may not be easy, this is
an opportunity for researchers, policymakers, and
the district to work together to provide supports
that empower administrators, their schools, and
their students to thrive.
CPS school administrators’
concerns about the pressure
to raise test scores has been
surpassed by both financial
and human resource worries
15The Challenges Facing CPS Administrators: Roadblocks to School Improvement
References
Bentle, K., Berlin, J., Marx, R., & Rumore, K. (2018, January 9)
39,000 homicides: Retracing 60 years of murder in Chicago. Chicago Tribune. Retrieved from
http://www.chicagotribune.com/news/local/breaking/ct-history-of-chicago-homicides-htmlstory.html
Berlin, J., & Perez Jr., J. (2016, September 27)
Search for your school: Revised 2017 CPS budgets. Chicago Tribune. Retrieved from
http://www.chicagotribune.com/news/local/breaking/ct-cps-2017-revised-school-budgets-htmlstory.html
Chicago Public Schools (n.d.)
fiscal year 2014 budget. Chicago Public Schools. Retrieved from
https://cps.edu/finance/FY14budget/pages/schoolsandnetworks.aspx
FitzPatrick, L. (2018, March 7)
CPS to principals: No cuts to schools in fall even if enrollment drops. Chicago Sun-Times. Retrieved from
https://chicago.suntimes.com/chicago-news/cps-to-principals-no-cuts-to-schools-in-fall-even-if-
enrollment-drops/
Gwynne, J.A., & Cowhy, J. (2017)
Getting ready for the Common Core State Standards: Experiences of CPS teachers and administrators preparing
for the new standards. Chicago, IL: University of Chicago Consortium on School Research.
Hitt, D., & Tucker, P. (2016)
Systematic review of key leader practices found to influence student achievement: A unified framework.
Sage Journals, 86(2), 531-569.
Karp, S. (2018, April 17)
Chicago school budgets arrive early but add little new. WBEZ. Retrieved from
https://www.wbez.org/shows/wbez-news/chicago-school-budgets-arrive-early-but-add-little-
new/15c7864c-3d2a-4d59-939d-aec04bb1fc82
Marzano, R.J., Waters, T., & McNulty, B.A. (2005).
School leadership that works: From research to results. Alexandria, VA: Association for Supervision and
Curriculum Development.
McCoppin, R., Mahr, J., Perez Jr., J., Rhodes, D., & Wisniewski, M. (2017, June 30)
What to expect if no Illinois state budget deal is reached. Chicago Tribune. Retrieved from
https://www.chicagotribune.com/news/local/breaking/ct-state-budget-stalemate-roundup-met-0630-
20170629-story.html
16 UChicago Consortium Research Brief
National Policy Board for Educational Administration. (2015)
Professional standards for education leaders 2015. Reston, VA: National Policy Board for Educational
Administration.
Perez Jr., J. (2018, March 7)
CPS plans to get budgets to principals next month, makes key change on per-pupil spending. Chicago Tribune.
Retrieved from http://www.chicagotribune.com/news/ct-met-chicago-school-spending-changes-plan-
20180307-story.html
Perez Jr., J., & Richards, J. (2015, October 5)
Chicago schools with enrollment declines face major budget cuts. Chicago Tribune. Retrieved from
http://www.chicagotribune.com/ct-chicago-school-enrollment-data-met-20151005-story.html
Sparks, S. (2017, November 9)
Chicago schools lead country in academic growth, study finds. Education Week. Retrieved from
http://blogs.edweek.org/edweek/inside-school-research/2017/11/chicago_schools_lead_country_in_
academic_growth.html?cmp=SOC-SHR-FB
Sporte, S., & Jiang, J. (2016a)
Teacher evaluation in practice: Year 3 teacher and administrator perceptions of REACH. Chicago, IL: University
of Chicago Consortium on School Research.
Sporte, S., & Jiang, J. (2016b)
Teacher evaluation in Chicago: Key findings from Consortium research. Chicago, IL: University of Chicago
Consortium on School Research.
The Chicago Public Education Fund. (n.d.)
Annual principal engagement survey. Retrieved from
https://thefundchicago.org/report/annual-principal-engagement-survey/
Vevea, B. (2016, February 10)
Principals react to middle of the school year budget cuts. WBEZ. Retrieved from
https://www.wbez.org/shows/wbez-news/principals-react-to-middle-of-the-school-year-budget-cuts/
fb7c8fcc-632c-4631-a4ff-0fc6f6a867b6
WTTW. (n.d.)
Selective enrollment schools and education reform. Retrieved from
https://interactive.wttw.com/centralstandard/selective-enrollment
17The Challenges Facing CPS Administrators: Roadblocks to School Improvement
Survey Administration
From March-April of 2017, the UChicago Consoritum surveyed 1,363 principals, assistant principals, and
other lead administrators in 658 schools. Overall, 51 percent of administrators completed the survey.
To determine eligible survey participants, we obtained a list of all non-charter principals and assistant
principals from CPS. For charter schools, the district provided a list which included one leader per school.
In order to include respondents in roles similar to assistant principals for charter schools, we then
contacted individual charter school leaders for the necessary information. Since the specific positions that
charter school leaders provided us varied, we refer to them here as “other top school administrators.”
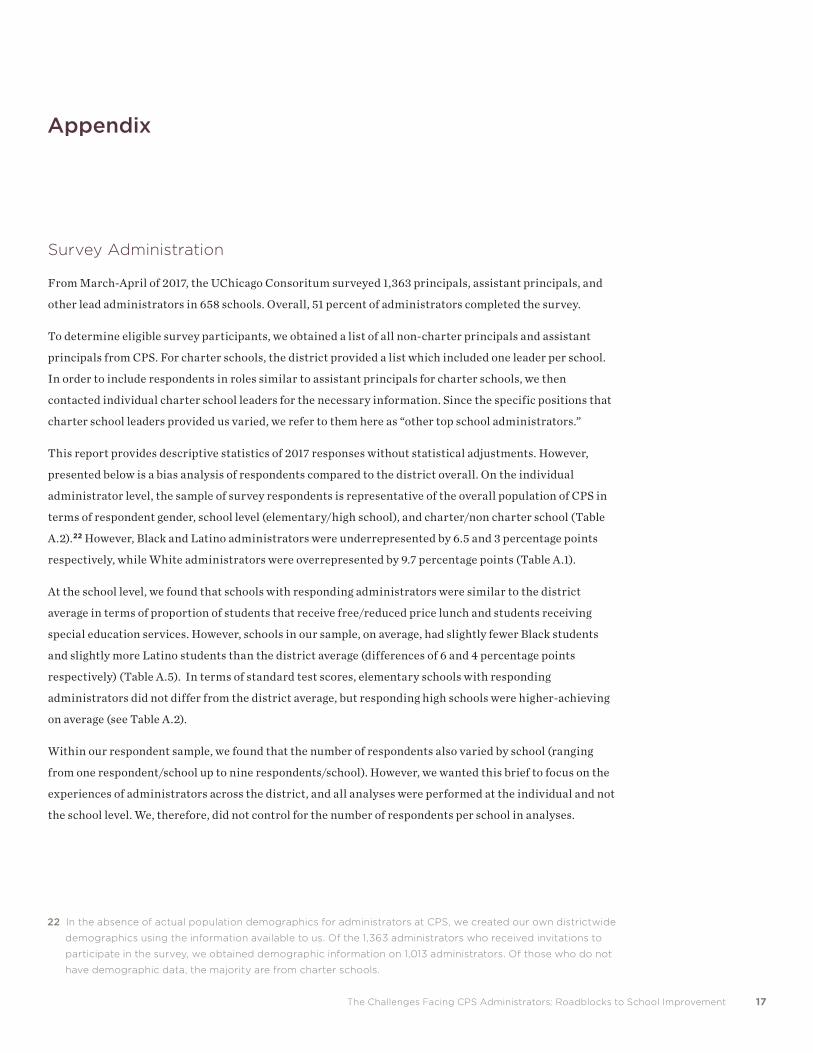
This report provides descriptive statistics of 2017 responses without statistical adjustments. However,
presented below is a bias analysis of respondents compared to the district overall. On the individual
administrator level, the sample of survey respondents is representative of the overall population of CPS in
terms of respondent gender, school level (elementary/high school), and charter/non charter school (Table
A.2).22 However, Black and Latino administrators were underrepresented by 6.5 and 3 percentage points
respectively, while White administrators were overrepresented by 9.7 percentage points (Table A.1).
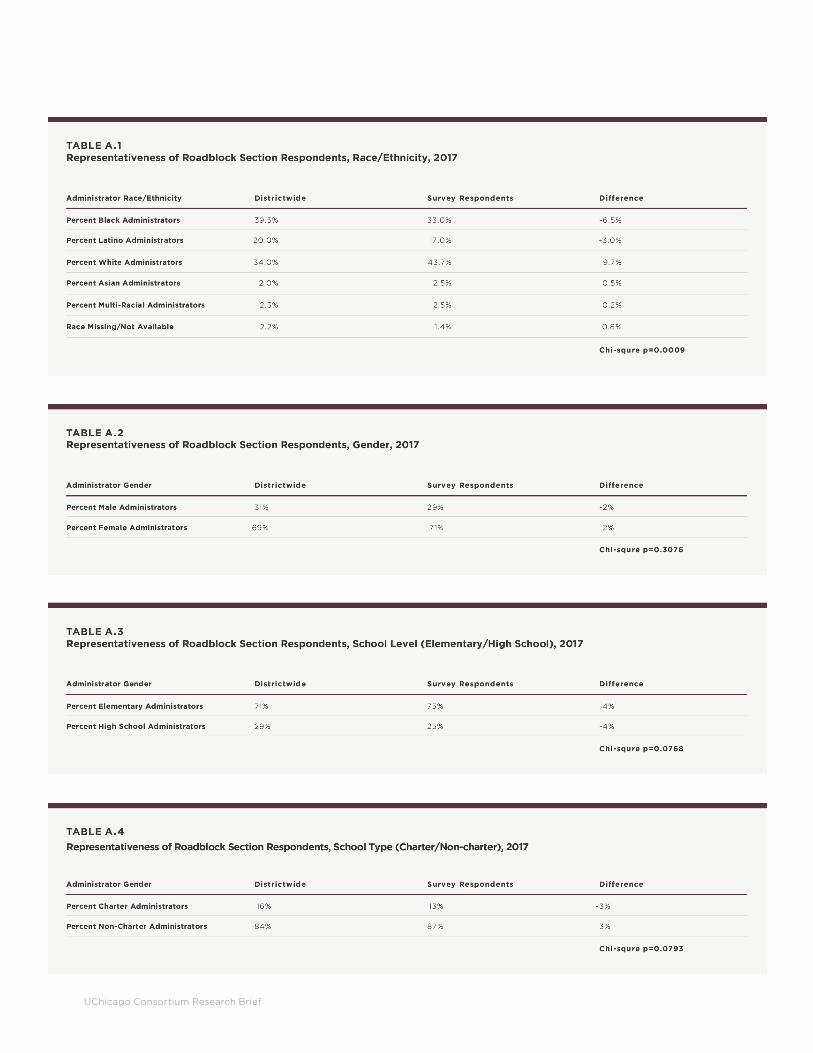
At the school level, we found that schools with responding administrators were similar to the district
average in terms of proportion of students that receive free/reduced price lunch and students receiving
special education services. However, schools in our sample, on average, had slightly fewer Black students
and slightly more Latino students than the district average (differences of 6 and 4 percentage points
respectively) (Table A.5). In terms of standard test scores, elementary schools with responding
administrators did not differ from the district average, but responding high schools were higher-achieving
on average (see Table A.2).
Within our respondent sample, we found that the number of respondents also varied by school (ranging
from one respondent/school up to nine respondents/school). However, we wanted this brief to focus on the
experiences of administrators across the district, and all analyses were performed at the individual and not
the school level. We, therefore, did not control for the number of respondents per school in analyses.
Appendix
22 In the absence of actual population demographics for administrators at CPS, we created our own districtwide
demographics using the information available to us. Of the 1,363 administrators who received invitations to
participate in the survey, we obtained demographic information on 1,013 administrators. Of those who do not
have demographic data, the majority are from charter schools.
UChicago Consortium Research Brief
19The Challenges Facing CPS Administrators: Roadblocks to School Improvement
20 UChicago Consortium Research Brief
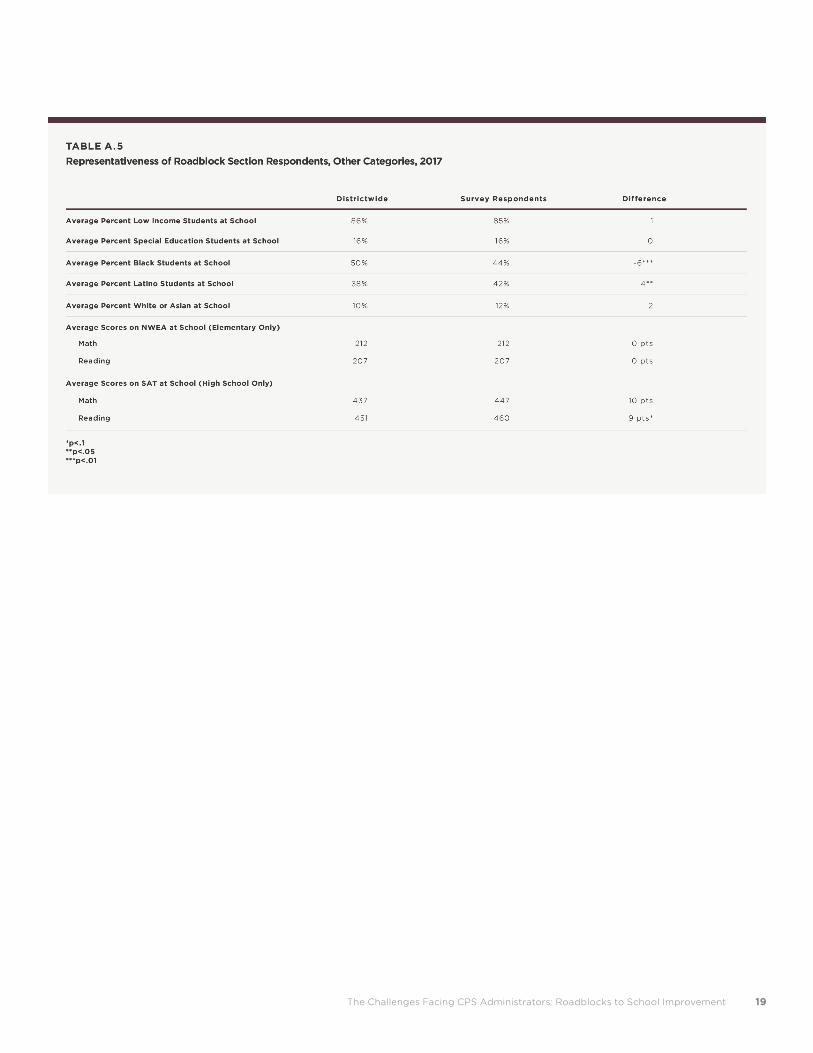
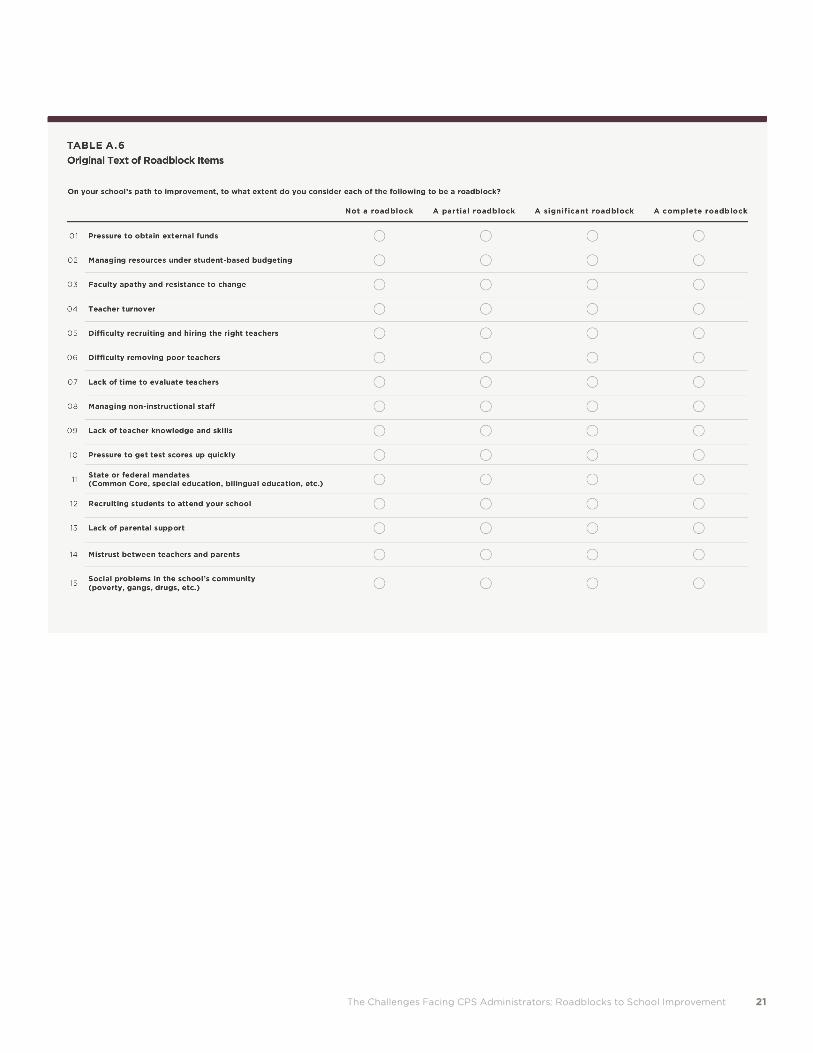
Survey Results
In this survey, we asked administrators to identify the challenges they faced. From a list of 15 potential
issues, school administrators indicated whether the challenge was “not a roadblock,” “a partial roadblock,”
“a significant roadblock,” or “a complete roadblock” on their path to school improvement. Figure A.1 shows
all 15 roadblocks and the percentage of administrators selecting each response. These are listed in the order
of most to least challenging, based on how often each item was chosen as a complete roadblock by
respondents. Table A.6 shows full text of items.
FIGURE A.1
Roadblock Rankings by Top Response Category, 2017
21The Challenges Facing CPS Administrators: Roadblocks to School Improvement

22 UChicago Consortium Research Brief
23The Challenges Facing CPS Administrators: Roadblocks to School Improvement
Authors
ANNA BRUZGULIS is the Survey Coordinator at the UChicago Consortium on School Research. In this
position, Anna facilitates survey use across research projects at the UChicago Consortium and conducts
analysis on 5Essentials survey data and school improvement trends in Chicago Public Schools. She also
supports new content development and testing, including conducting cognitive interviews and focus groups.
Anna also fields questions about survey usage and serves on the Consortium Equity Committee. Prior to
joining the UChicago Consortium, Anna was an intern guest writer at PunditFact and Politifact Illinois.
There, Anna wrote online fact checks on a variety of policy areas, including education, trade, and other current
topics. Anna also previously worked as a Jumpstart team leader, where she worked with preschool students on
the development of basic reading, writing, and math skills.
HOLLY HART is currently Survey Director at the UChicago Consortium. In this position she oversees survey
content development and research on 5Essentials and Early Education Essentials Surveys. Holly is a mixed-
methods researcher with a background in psychology and adult development. Before joining the UChicago
Consortium, Holly oversaw survey research on a variety of topics at the Survey Research Lab at UIC. As a
Senior Research Associate at the UChicago Consortium, she has conducted a number of studies focused on
teachers and principals at different points of their careers. Her teacher-focused work has included studies of
teacher training and coaching by the Urban Teacher Education Program and the Chicago New Teacher Center.
She has also studied Chicago’s REACH teacher evaluation system. Her research on principals ranges from
principal preparation in Chicago and Illinois, to an Institute of Education Sciences study of the key
mechanisms through which school leaders influence student achievement.
CHRISTOPHER YOUNG is the UChicago Consortium’s Psychometrician. In this role, he helps to create
informative survey items and to refine the quantitative feedback provided to practitioners so that it is
accurate and useful. Chris also provides support across UEI by advising researchers about applying analysis
techniques and providing an accurate interpretation of results for their particular audience. Chris’
background is in developmental psychology, a field where he has published on how to identify skills and choose
among competing theories of cognition by comparing statistical models. Prior to joining the UChicago
Consortium, he helped to develop an assessment system that pre-kindergarten teachers used to measure their
students’ proficiencies in mathematical and literacy skills through play, and improve them. Chris focuses on
using data to understand change over time. He hopes to build tools that measure and promote healthy schools
and that help students to grow beyond expectations of past trends.
24 UChicago Consortium Research Brief
Acknowledgements
The authors would like to thank the many people who contributed to this study. We would especially like to
thank those that provided feedback and suggestions throughout the process. We thank members of the
UChicago Consortium review group, particularly Penny Sebring, Elaine Allensworth, Jenny Nagoaka, Kylie
Klein, and Jennie Jiang, as well as our external reviewers from the Network of College Success, Eliza Moeller,
Cynthia Nambo, and James Schwartz. We are extremely grateful to the Consortium communications team,
including Bronwyn McDaniel, Jessica Tansey, Jessica Puller, and Alida Mitau, all of whom were instrumental in
the production of this brief. We are also extremely grateful for the feedback and guidance received from all of
our colleagues at the UChicago Consortium, in particular Molly Gordon and Lauren Sartain. We also thank our
Steering Committee members for their thoughtful feedback, especially Gina Caneva. Finally, we also are very
grateful to all of Chicago Public School’s administrators, without whose participation in the 2017 Administrator
Survey this brief would not be possible.
This work was generously funded by the Consortium Investor Council. The UChicago Consortium greatly
appreciates support from the Consortium Investor Council that funds critical work beyond the initial research:
putting the research to work, refreshing the data archive, seeding new studies, and replicating previous studies.
Members include: Brinson Family Foundation, CME Group Foundation, Crown Family Philanthropies, Lloyd
A. Fry Foundation, Joyce Foundation, Lewis-Sebring Family Foundation, McCormick Foundation, McDougal
Family Foundation, Osa Family Foundation, Polk Bros. Foundation, Spencer Foundation, Steans Family
Foundation, and The Chicago Public Education Fund.
25The Challenges Facing CPS Administrators: Roadblocks to School Improvement
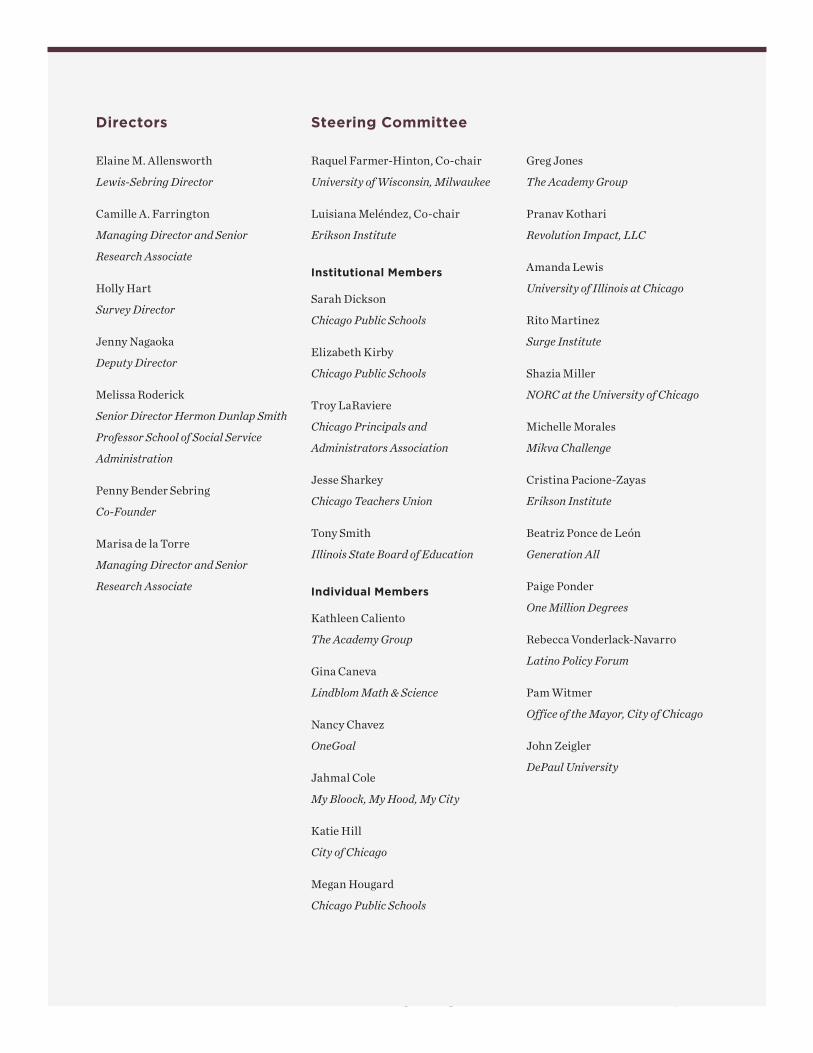
Elaine M. Allensworth
Lewis-Sebring Director
Camille A. Farrington
Managing Director and Senior
Research Associate
Holly Hart
Survey Director
Jenny Nagaoka
Deputy Director
Melissa Roderick
Senior Director Hermon Dunlap Smith
Professor School of Social Service
Administration
Penny Bender Sebring
Co-Founder
Marisa de la Torre
Managing Director and Senior
Research Associate
Raquel Farmer-Hinton, Co-chair
University of Wisconsin, Milwaukee
Luisiana Meléndez, Co-chair
Erikson Institute
Institutional Members
Sarah Dickson
Chicago Public Schools
Elizabeth Kirby
Chicago Public Schools
Troy LaRaviere
Chicago Principals and
Administrators Association
Jesse Sharkey
Chicago Teachers Union
Tony Smith
Illinois State Board of Education
Individual Members
Kathleen Caliento
The Academy Group
Gina Caneva
Lindblom Math & Science
Nancy Chavez
OneGoal
Jahmal Cole
My Bloock, My Hood, My City
Katie Hill
City of Chicago
Megan Hougard
Chicago Public Schools
Greg Jones
The Academy Group
Pranav Kothari
Revolution Impact, LLC
Amanda Lewis
University of Illinois at Chicago
Rito Martinez
Surge Institute
Shazia Miller
NORC at the University of Chicago
Michelle Morales
Mikva Challenge
Cristina Pacione-Zayas
Erikson Institute
Beatriz Ponce de León
Generation All
Paige Ponder
One Million Degrees
Rebecca Vonderlack-Navarro
Latino Policy Forum
Pam Witmer
Office of the Mayor, City of Chicago
John Zeigler
DePaul University
Directors Steering Committee
1313 East 60th Street
Chicago, IL 60637
consortium.uchicago.edu
T (773) 702-3364
@UChiConsortium
ABOUT THE UCHICAGO CONSORTIUM
The University of Chicago Consortium on School Research conducts research of high technical quality that can inform
and assess policy and practice in the Chicago Public Schools. We seek to expand communication among researchers,
policymakers, and practitioners as we support the search for solutions to the problems of school reform. The UChicago
Consortium encourages the use of research in policy action and improvement of practice, but does not argue for
particular policies or programs. Rather, we help to build capacity for school reform by identifying what matters for
student success and school improvement, creating critical indicators to chart progress, and conducting theory-driven
evaluation to identify how programs and policies are working. The UChicago Consortium is a unit of the Urban
Education Institute.


![18-4masglp.olemiss.edu/Water Log PDF/18-4.pdfcob-qoza_T ZApg1J cg1crqgg1JB cps cps aorupgw glgccgq co nag g rg4 cps cps g aorupgw co pgbgug]lxgq upla ÀggL' cps cowbg1JÀ pgcaug cps](https://img.pdfslide.us/doc/110x75/5e2f59f63318b957b5481e92/18-log-pdf18-4pdf-cob-qozat-zapg1j-cg1crqgg1jb-cps-cps-aorupgw-glgccgq-co-nag.jpg)