Embed Size (px)
Citation preview

Business ReportApril, 2015 to September, 2015
(2Q of FY ending March 31, 2016)
Wacom Co., Ltd.
(TSE Sec.1 6727)

All Rights Reserved. Copyright © 2015 Wacom Co., Ltd. 2
Contents Index3-4 2Q FY 03/16 (Apr. to Sep. 2015) Results Overview5-6 Consolidated P/L by Business Line
7-8 Consolidated Sales/Profit Comparison
9 Operating Expenses Comparison
10 Business Segment
11-18 Business Highlights
19-21 Sales by Product Line
22-24 Sales by Region, Sales Changes for Local Currencies
25-26 Consolidated B/S, C/F
27-29 FY 03/16 Business Strategies
30-38 FY 03/16 Financial Forecast
39-40 Dividend Forecast for FY 03/16
41-43 Our Branding
44 Disclaimer

All Rights Reserved. Copyright © 2015 Wacom Co., Ltd. 3
2Q FY 03/16 (Apr. to Sep. 2015) Results OverviewOperating environment The global economy maintained a slow recovery in the U.S., Europe, and Japan. The economy in
emerging countries decelerated, influenced by a slowdown in China. In currency markets, the euro depreciated against the yen despite the strong US dollar.
As cloud computing, mobile products, and SNS rapidly expand, the IT industry faces intensified competition and structural changes. Market trends related to our business are changing rapidly.
Performance overview Consolidated net sales reached a historic high owning to the steady expansion of Creative
Business products in Brand Business, and earlier than expected start of shipments for smartphones in Technology Solution Business. These also contributed to an increase in operating income and net profit.
Sales in Brand Business reached a record high, driven by strong sales of Display and Mobile products in Creative Business, particularly in China and other Asian markets.
Sales in Technology Solution Business increased owing to earlier than expected shipments of the new Galaxy Note model, and mass production of educational tablets. Sales of products for notebook PCs decreased due to inventory adjustments.

All Rights Reserved. Copyright © 2015 Wacom Co., Ltd. 4
2Q FY 03/16 (Apr. to Sep. 2015) Results Overview
Average Forex rate 2Q FY 03/16 YOY
1 USD 121.50 JPY +17.4% (Weak JPY)
1 EUR 134.60 JPY -3.2% (Strong JPY)
Business Performance 2Q FY 03/16 YOY
Net Sales 38,956 mil 21.7%
Operating Income 2,053mil 12.4%
Ordinary Income 2,098mil 19.1%
Net Profit (loss) aft. Tax 1,261mil 9.9%
Financial Indices 2Q FY 03/16 2Q FY 03/15
EPS 7.62JPY 6.89 JPY
BPS (Book Value per Share) 187 JPY 186 JPY
Financial Summary (JPY)
(For reference)
(Note) Net Profit (Loss) of FY 03/16 is equivalent to net profit attributable to shareholders of Wacom Co., Ltd.

All Rights Reserved. Copyright © 2015 Wacom Co., Ltd. 5
Consolidated P/L 2Q FY 03/15 2Q FY 03/16 YOY Change
04/14-09/14 04/15-09/15 Amount Ratio
Net Sales 32,011 38,956 6,945 21.7%
Gross Profit 13,081 15,057 1,976 15.1%
profit margin % 40.9% 38.7%
SG&A 11,254 13,003 1,749 15.5%
Operating Income 1,826 2,053 227 12.4%
profit margin % 5.7% 5.3%
Ordinary Income 1,761 2,098 337 19.1%
Net Profit (Loss) aft. Tax
1,147 1,261 114 9.9%
(Unit: Million JPY)
• Effects of forex fluctuations on 2QThe US dollar strengthened at JPY 17.99: Sales +3,980 mil JPY, OP +40 mil JPYThe euro weakened at JPY 4.47 JPY: Sales -220 mil JPY, OP -1.20 mil JPY

All Rights Reserved. Copyright © 2015 Wacom Co., Ltd. 6
Consolidated P/L by Business Line2Q FY 03/15 2Q FY 03/16 YOY Change
04/14-09/14 04/15-09/15 Amount Ratio
Net Sales 32,011 38,956 6,946 21.7%
Brand biz 19,502 22,853 3,351 17.2%
Tech. Solution Biz 12,165 15,788 3,623 29.8%
Other biz 344 315 -29 -8.4%
Operating Income 1,826 2,053 227 12.4%
Brand biz 2,505 3,642 1,137 45.4%
Tech. Solution Biz 1,250 2,114 864 69.1%
Other biz 69 34 -35 -50.4%
Corp. and others -1,998 -3,737 -1,739 87.1%
profit margin % 5.7% 5.3%
(Unit: Million JPY)
(Note) Corp. and others Operating Income decrease includes approx. -1,2b JPY due to the reassignment of SG&A
items from Brand Business to Corporate functions reflecting the new global organization started from April, 2015.

All Rights Reserved. Copyright © 2015 Wacom Co., Ltd. 7
Consolidated Sales Comparison
19,50222,853
12,165
15,788344
315
0
5,000
10,000
15,000
20,000
25,000
30,000
35,000
40,000
2Q FY 03/15 2Q FY 03/16
Brand biz Tech. Solution biz Other biz
-8.4%
+17.2%
+29.8%
+21.7%
32,011
38,956(Unit: Million JPY)
Change
Ratio

All Rights Reserved. Copyright © 2015 Wacom Co., Ltd. 8
Consolidated Profit Comparison
1,826
2,053
1,761
2,098
1,147 1,261
0
500
1,000
1,500
2,000
2Q FY 03/15 2Q FY 03/16
Operating Income Ordinary Income Net Profit
+12.4%
+19.1%
+9.9%
(Unit: Million JPY)

All Rights Reserved. Copyright © 2015 Wacom Co., Ltd. 9
Key changes in SG&A
SG&A increased by ¥610 million due to the weaker yen for SG&A incurred at subsidiaries.
Headcount including temporary employees increased (1,188 in previous 2Q, 1,250 in current 2Q)
R&D expenses increased due to development of new products to be released in the current FY.
Other expenses increased due to subcontract expenses for global IT infrastructure development.
Operating Expenses Comparison
2Q FY 03/15 2Q FY 03/16 YOY Change
04/14-09/14 04/15-09/15 Amount Ratio
Personnel 4,110 4,705 595 14.5%
R&D 1,494 2,033 539 36.1%
Ad. & Promo. 1,464 1,716 252 17.2%
Others 4,186 4,548 362 8.7%
Total 11,254 13,003 1,749 15.5%
SG&A ratio % 35.2% 33.4%
(Unit: Million JPY)
(Note) Headcount excluding temporary employees: 1,038 (previous 2Q), 1,056 (current 2Q)

All Rights Reserved. Copyright © 2015 Wacom Co., Ltd. 10
Business Segment for FY 03/16
Technology Solution Business Pen sensor systems for Smartphones and Tablets EMR, AES pen components & modules (feelTM)
Other Business Engineering Solution・ECAD dio
Consumer Business Makes daily lives more creative and enjoyable
Product Lines: Stylus, Mobile Accessories, etc.
Business Solution Serves society by providing innovative solutions
Product lines: Display, Signature Tablet, etc.
Creative Business Serves the passion of professional and consumer creativity
Product Lines: Pen Tablet, Mobile, Display
Bra
nd
Bu
sin
es
s
Platform &applications
Provides
technology,
apps and
platforms
Cloud Apps
& Services
WILL (digital
Ink solution)
All Rights Reserved. Copyright © 2015 Wacom Co., Ltd. 11
Business Highlights:
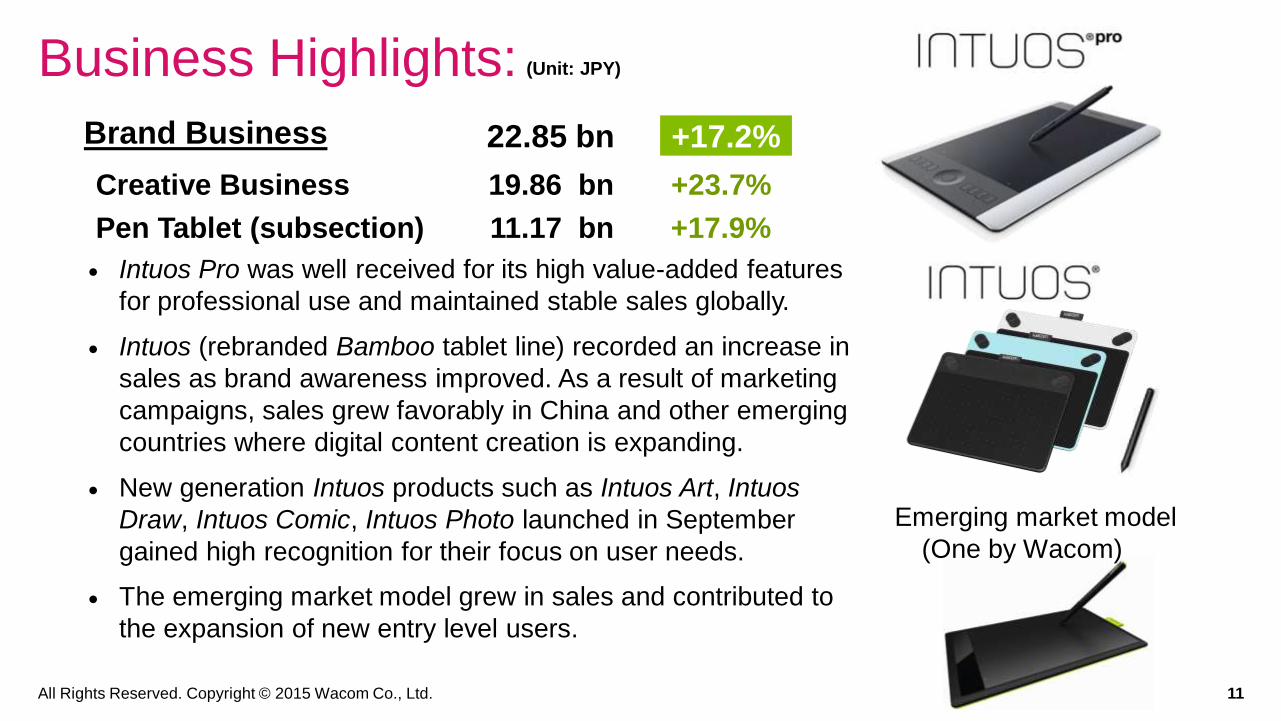
Brand Business
Creative Business 19.86 bn +23.7%
Pen Tablet (subsection) 11.17 bn +17.9%
Intuos Pro was well received for its high value-added features
for professional use and maintained stable sales globally.
Intuos (rebranded Bamboo tablet line) recorded an increase in
sales as brand awareness improved. As a result of marketing
campaigns, sales grew favorably in China and other emerging
countries where digital content creation is expanding.
New generation Intuos products such as Intuos Art, Intuos
Draw, Intuos Comic, Intuos Photo launched in September
gained high recognition for their focus on user needs.
The emerging market model grew in sales and contributed to
the expansion of new entry level users.
22.85 bn +17.2%
Emerging market model
(One by Wacom)
(Unit: JPY)

All Rights Reserved. Copyright © 2015 Wacom Co., Ltd. 12
Brand Business
Creative Business
Mobile (subsection) 2.57 bn +45.3%
Wacom’s mobile tablet, Cintiq Companion 2, was highly
appraised for its QHD display, light body, and wide range of
model lines. Sales significantly exceeded that of the previous
model.
Sales channel expansion contributed to sales growth (previous
sales channel was limited to online “Wacom Store”; now
expanded to include certain wholesale retailers).
Inutos Creative Stylus 2 for iPads launched last September
gained a positive reputation and maintained stable sales.
Business Highlights: (Unit: JPY)
companion 2
All Rights Reserved. Copyright © 2015 Wacom Co., Ltd. 13
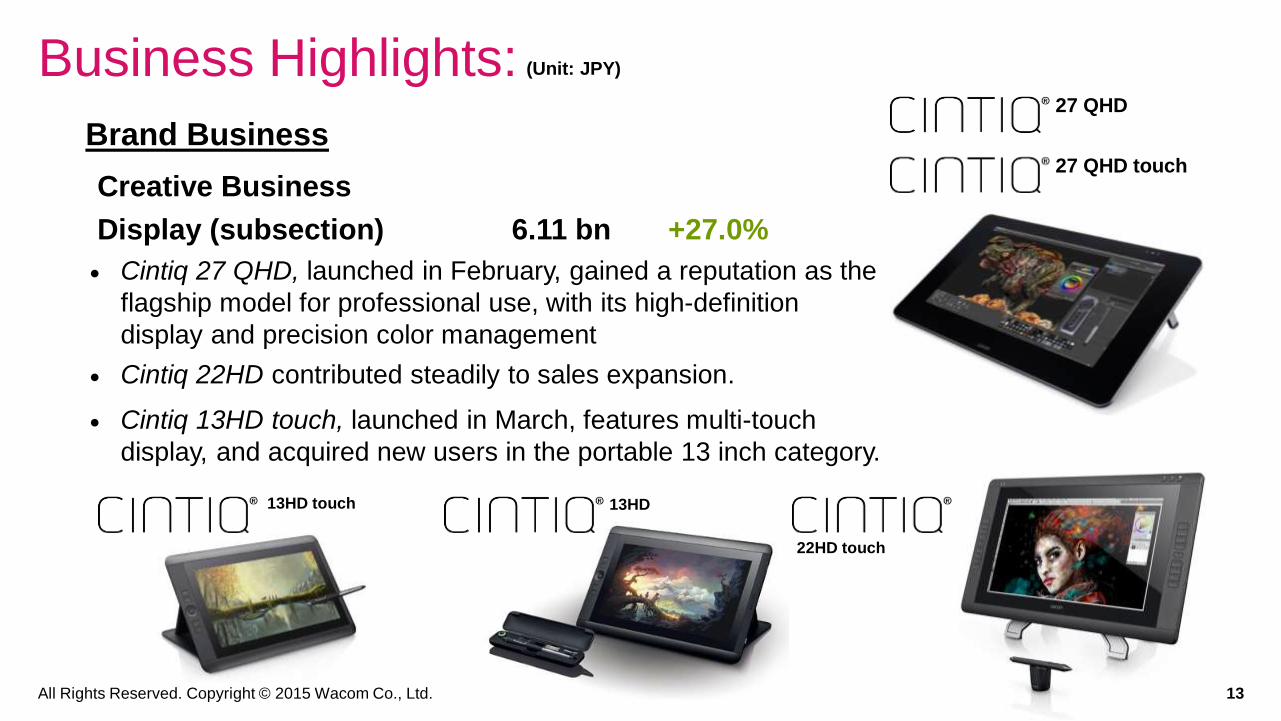
Brand Business
Creative Business
Display (subsection) 6.11 bn +27.0%
Cintiq 27 QHD, launched in February, gained a reputation as the
flagship model for professional use, with its high-definition
display and precision color management
Cintiq 22HD contributed steadily to sales expansion.
Cintiq 13HD touch, launched in March, features multi-touch
display, and acquired new users in the portable 13 inch category.
13HD
Business Highlights:
27 QHD touch
22HD touch
13HD touch
27 QHD
(Unit: JPY)
All Rights Reserved. Copyright © 2015 Wacom Co., Ltd. 14
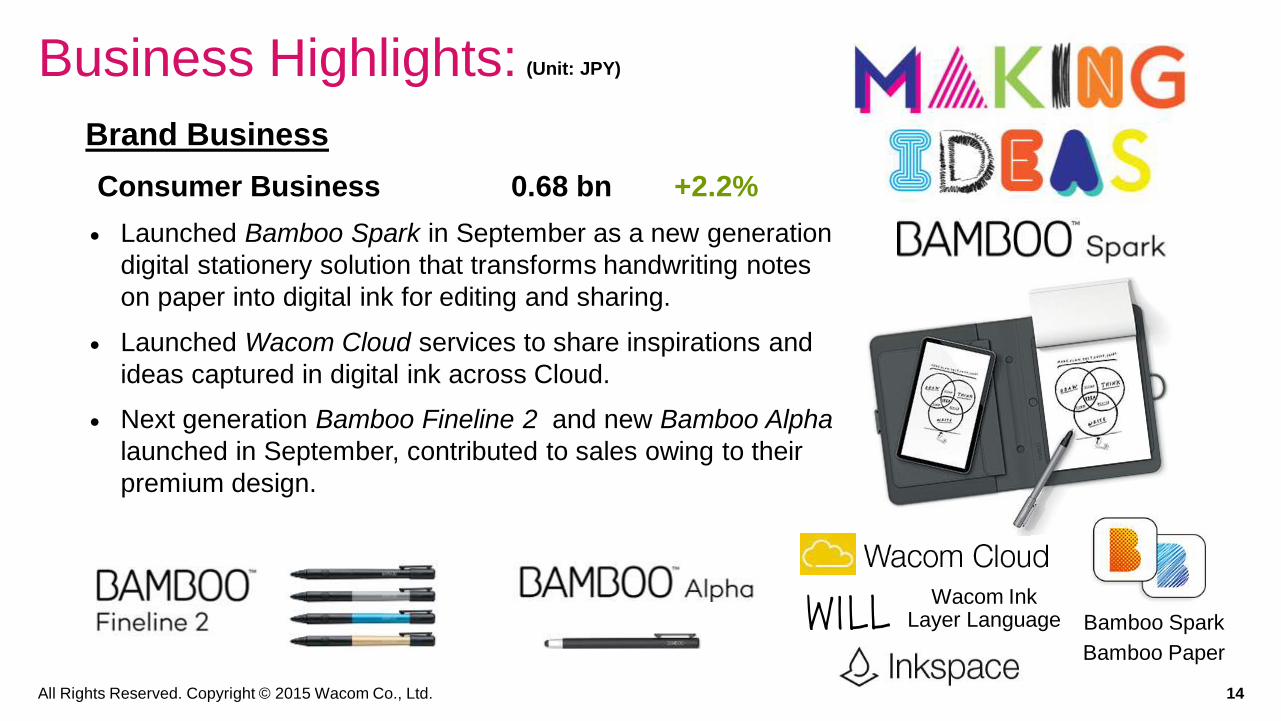
Brand Business
Consumer Business 0.68 bn +2.2%
Launched Bamboo Spark in September as a new generation
digital stationery solution that transforms handwriting notes
on paper into digital ink for editing and sharing.
Launched Wacom Cloud services to share inspirations and
ideas captured in digital ink across Cloud.
Next generation Bamboo Fineline 2 and new Bamboo Alpha
launched in September, contributed to sales owing to their
premium design.
Business Highlights: (Unit: JPY)
Wacom InkLayer Language Bamboo Spark
Bamboo Paper

All Rights Reserved. Copyright © 2015 Wacom Co., Ltd. 15
DTU-1141
Business Highlights:
STU Series
DTH-2242
(Unit: JPY)
Brand Business
Business Solution 2.32 bn -16.6%
Sales dropped in the Eurozone due to the absence of large-scale
orders that boosted results in the previous FY. Meanwhile,
demand for digital signature and paperless workflow and
improvement of data security has been expanding in China and
other Asian markets.
The STU series was well received in credit card transaction and
over-the-counter services in the financial industry. The latest
models, STU-530 and STU-430, contributed to sales growth.
DTU-1031 was widely adopted for financial over-the-counter use.
Launched DTU-1141 with data encryption in May.
DTU-1031All Rights Reserved. Copyright © 2015 Wacom Co., Ltd.

All Rights Reserved. Copyright © 2015 Wacom Co., Ltd. 16
Business Highlights:
Tech. Solution Business
Pen Sensor System
for Smartphones 9.42 bn +49.2%
Sales significantly increased owning to earlier than expected
start of shipments for Samsung’s Galaxy Note 5.
Pen Sensor System
for Tablets 5.15 bn +31.2%
Large-scale order of educational tablets for a Turkish
government project contributed to sales expansion.
Promoted Active ES pen solution and started commercial
production of new models on Windows 10 OS.
15.79 bn +29.8%
Tablet models
Smartphone models
(Unit: JPY)
General Mobileetab5
All Rights Reserved. Copyright © 2015 Wacom Co., Ltd. 17
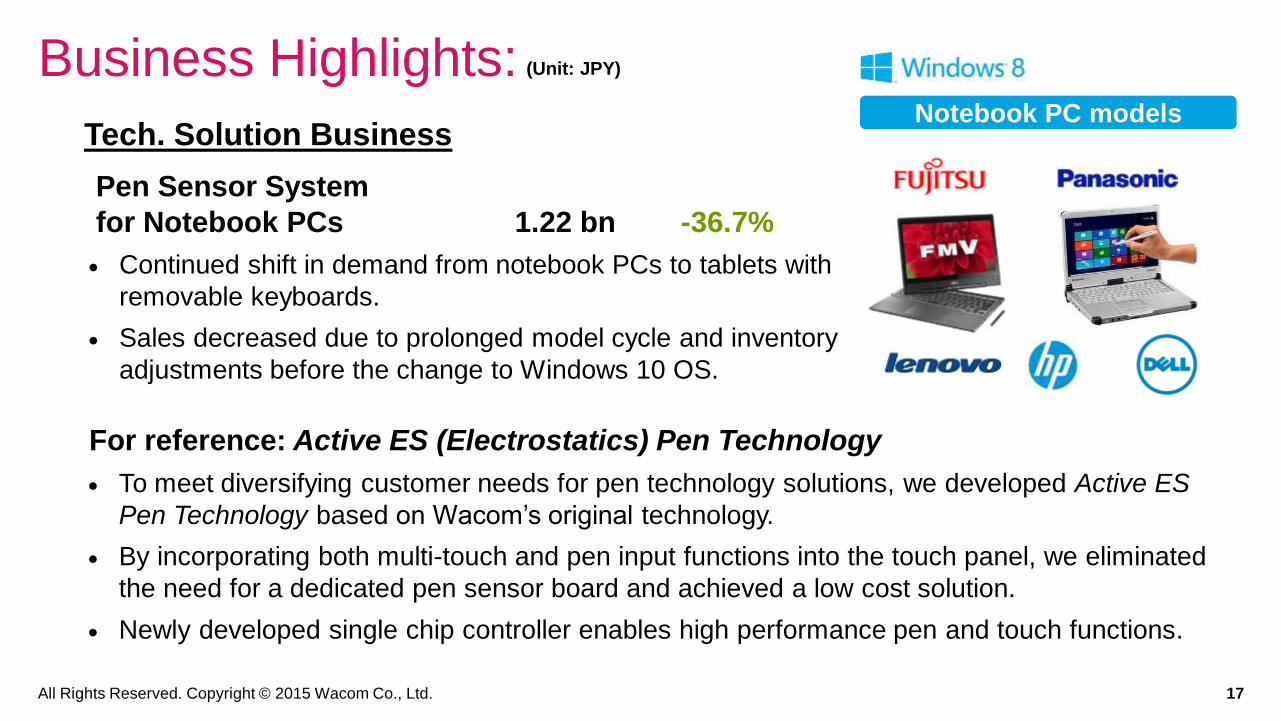
Business Highlights:Notebook PC models
For reference: Active ES (Electrostatics) Pen Technology
To meet diversifying customer needs for pen technology solutions, we developed Active ES
Pen Technology based on Wacom’s original technology.
By incorporating both multi-touch and pen input functions into the touch panel, we eliminated
the need for a dedicated pen sensor board and achieved a low cost solution.
Newly developed single chip controller enables high performance pen and touch functions.
(Unit: JPY)
Tech. Solution Business
Pen Sensor System
for Notebook PCs 1.22 bn -36.7%
Continued shift in demand from notebook PCs to tablets with
removable keyboards.
Sales decreased due to prolonged model cycle and inventory
adjustments before the change to Windows 10 OS.

All Rights Reserved. Copyright © 2015 Wacom Co., Ltd. 18
Business Highlights:
Other Business
CAD software and others 0.32 bn -8.4%
Sales dropped due to a slowdown in PC replacement demand from the last FY.
Started expanding market into robotics and machinery design with ECAD dio DCX R2
launched in June, in addition to promoting sales of ECAD dio 2015 launched last December.
0.32 bn
F&A (Corporate)
Shifted the region-based organization to a customer-centric global organization. New
global HR system started in April.
Continued to invest in business infrastructure for growth and operational efficiency. Major
projects include new SCM system, IT infrastructure, e-commerce, etc. in global operations.
Promoted WILL (Wacom Ink Layer Language) as a new framework to standardize digital
ink, and engaged in partnership development activities.
Submitted a Corporate Governance Report to the TSE on September 29 in compliance
with the Corporate Governance Code in Japan.
(Unit: JPY)
-8.4%

All Rights Reserved. Copyright © 2015 Wacom Co., Ltd. 19
Sales by Product Line in Brand Business
9,47311,172
1,769
2,5714,812
6,112663
677
2,785
2,321
0
5,000
10,000
15,000
20,000
2Q FY 03/15 2Q FY 03/16
Creative・Pen tablet Creative・Mobile Creative・DisplayConsumer Business Solution
+2.2%
+45.3%
+17.9%
+27.0%
-16.6%
22,853
19,502
+17.2%
Creative
biz
16,054
Creative
biz
19,855
+23.7%
(Unit: Million JPY)
Change
Ratio

All Rights Reserved. Copyright © 2015 Wacom Co., Ltd. 20
Sales by Product Line in Tech. Solution Business
6,312
9,419
3,926
5,1501,927
1,219
0
5,000
10,000
15,000
2Q FY 03/15 2Q FY 03/16
Pen for Smartphone Pen for Tablet Pen for Notebook PC, etc.
-36.7%
+31.2%
+49.2%
15,788
12,165
+29.8%(Unit: Million JPY)
Change
Ratio
All Rights Reserved. Copyright © 2015 Wacom Co., Ltd. 21
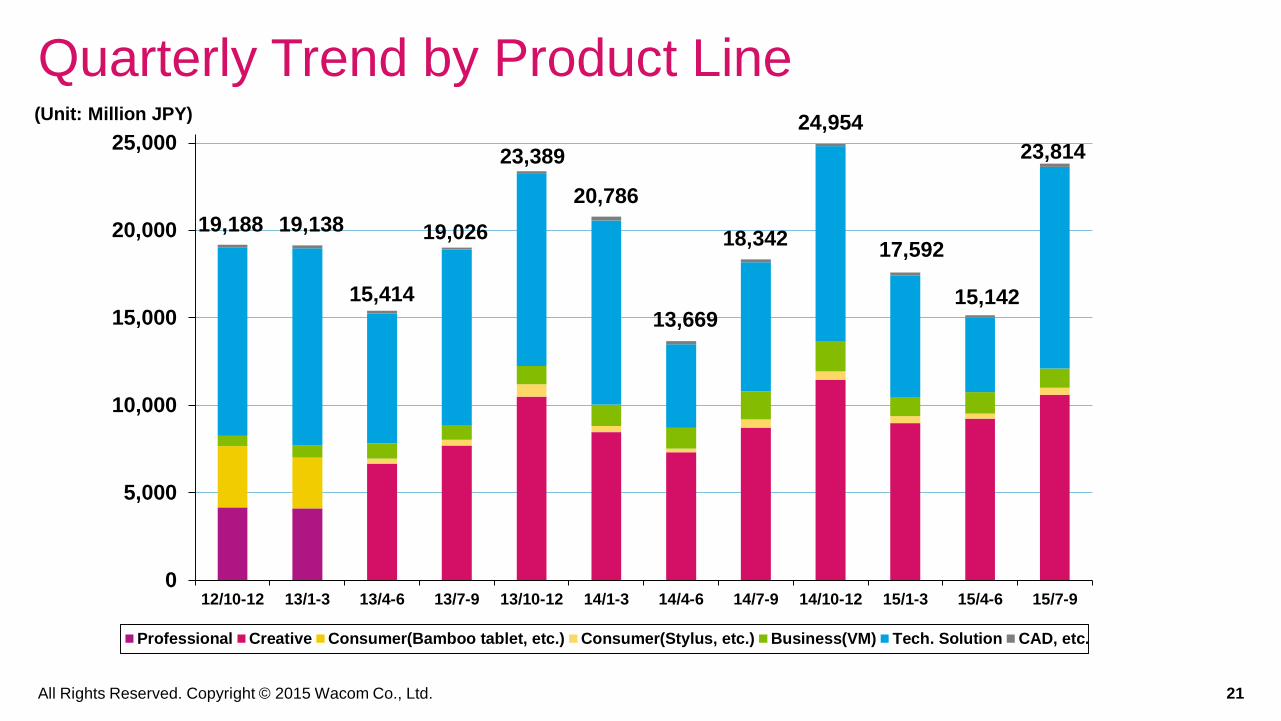
0
5,000
10,000
15,000
20,000
25,000
12/10-12 13/1-3 13/4-6 13/7-9 13/10-12 14/1-3 14/4-6 14/7-9 14/10-12 15/1-3 15/4-6 15/7-9
Professional Creative Consumer(Bamboo tablet, etc.) Consumer(Stylus, etc.) Business(VM) Tech. Solution CAD, etc.
Quarterly Trend by Product Line
19,188 19,138
15,414
19,026
23,389
20,786
13,669
18,342
24,954
17,592
15,142
23,814
(Unit: Million JPY)

All Rights Reserved. Copyright © 2015 Wacom Co., Ltd. 22
Sales by Region
12,16515,788
3,152
3,5846,297
7,3876,204
6,4744,193
5,723
0
5,000
10,000
15,000
20,000
25,000
30,000
35,000
40,000
2Q FY 03/15 2Q FY 03/16
Tech. Solution Japan U.S. Germany Asia Oceania
(-0.2%)
(+7.2%)
+36.5%
+17.3%
+13.7%
+29.8%
+4.4%
+21.7%
32,011
38,956
( ) % growth based
on local currency
(Unit: Million JPY)Change
Ratio
(Note) There are no regional segments in the Tech. Solution Biz.

All Rights Reserved. Copyright © 2015 Wacom Co., Ltd. 23
(For reference) Sales Changes in Local Currency Base
Region CurrencyYOY
Change Ratio
Japan(excluding Component biz)
JPY 13.7%
U.S. USD -0.2%
Europe EUR 7.2%
China CNY 37.1%
Korea KRW 12.9%
Australia AUD 33.9%
Singapore USD 4.5%
Hong Kong USD 30.6%
Taiwan NTD -6.6%
(Note) The figure of Singapore is including the sales of India.
All Rights Reserved. Copyright © 2015 Wacom Co., Ltd. 24
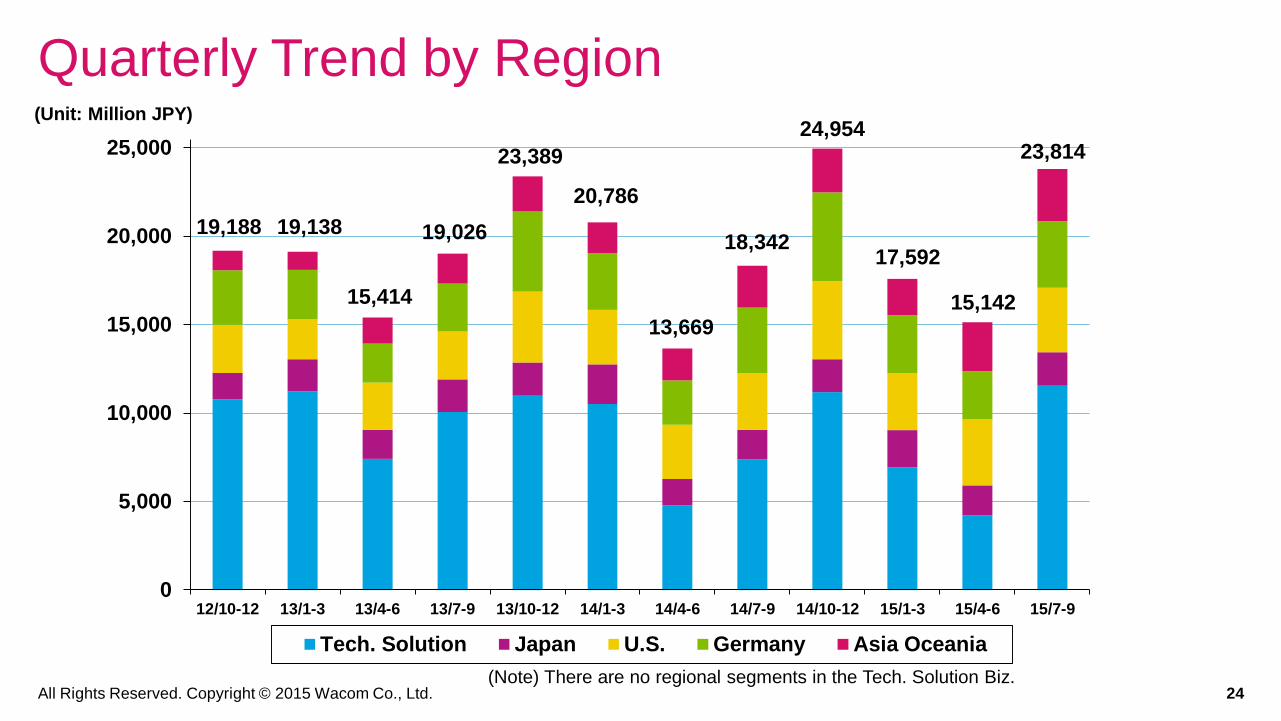
0
5,000
10,000
15,000
20,000
25,000
12/10-12 13/1-3 13/4-6 13/7-9 13/10-12 14/1-3 14/4-6 14/7-9 14/10-12 15/1-3 15/4-6 15/7-9
Tech. Solution Japan U.S. Germany Asia Oceania
Quarterly Trend by Region
19,188 19,138
15,414
19,026
23,389
20,786
13,669
18,342
24,954
17,592
15,142
23,814
(Unit: Million JPY)
(Note) There are no regional segments in the Tech. Solution Biz.

All Rights Reserved. Copyright © 2015 Wacom Co., Ltd. 25
Consolidated B/S Key Changes
Assets
・ Increase in notes and accounts 3,895receivable(sales increase in Tech. Solution biz)
・ Increase in other current assets 2,308(production increase in Tech. Solution biz)
・ Increase in intangible fixed assets 1,342(increase in software suspense account for
global IT infrastructure, etc.)
・ Increase in inventories 1,314(production increase in Tech. Solution biz)
・ Decrease in cash and cash equivalents
-2,252Liabilities
・ Increase in short-term loans 5,400
・ Increase in notes and accountspayable-trade 3,607
Net Assets
・ Decrease in shareholders’ equity -2,901(decrease in retained earnings, buy back, etc.)
End of Mar. 2015
End of Sep. 2015
Change
Current Assets 40,188 45,413 5,225
Noncurrent Assets 11,269 12,275 1,006
Total Assets 51,457 57,688 6,231
Current Liabilities 15,880 24,892 9,012
Noncurrent Liabilities 1,718 1,855 137
Total Liabilities 17,598 26,747 9,149
Minority Interest in
Subsidiaries0 0 0
Net Assets 33,859 30,941 -2,918
Total Liabilities and Net Assets 51,457 57,688 6,231
Equity Ratio 65.4% 53.4% -12.0%
(Unit: Million JPY)

All Rights Reserved. Copyright © 2015 Wacom Co., Ltd. 26
Consolidated C/F Major Activities in 2Q FY 03/16
C/F from operating activities
・Increase in notes and accountsreceivable-trade -6,012
・ Increase in inventories -1,329
・ Income tax paid -865
・ Increase in notes and accountspayable-trade 3,668
・ Depreciation 968
C/F from investing activities
・ Purchase of fixed assets -2,747(global IT infrastructure, etc.)
C/F from financing activities
・ Increase in short-term loans payable 5,400
・ Cash dividends paid -2,987
・ Purchase of treasury stock -1,245
2Q FY 03/15 2Q FY 03/16YoY
Change
04/14
-0914
04/15
-09/15Amount
C/F from operating
activities-791 -1,014 -223
C/F from investing
activities-1,433 -2,360 -927
C/F from financing
activities-900 1,210 2,110
Effect of change in
exchange rate 198 -88 -286
Increase-decrease of
cash & cash equivalent-2,926 -2,252 674
Beginning balance of
cash & cash equivalent15,394 16,687 1,293
Ending balance of cash
and cash equivalent12,468 14,435 1,967
(Unit: Million JPY)

FY 03/2016
Basic Strategies and
Business Focus

All Rights Reserved. Copyright © 2015 Wacom Co., Ltd. 28
Business Environment for FY 03/16
Despite some uncertainties, the global economy is expected to maintain a recovery trend, led by US economic expansion, financial policies in major countries and low oil price. While Asian countries are expected to maintain their growth rate, the LATAM region is expected to show no growth.
The creative market is expected to continue to expand with acceleration in the mobile product category, 3D design and 3D printing evolution in advanced countries and digital design expansion in emerging markets.
In the UI field, Pen & Ink is expected to gain momentum as the need for personal digital contents increases among mobile consumers.
Integration of Consumer stylus, application and starts to offer new user values.
Mobile workflow and security will become critical in enterprise markets, anddigital signature is expected to expand to the mobile space.
Wearables will start creating a new ecosystem for our products.
All Rights Reserved. Copyright © 2015 Wacom Co., Ltd. 29
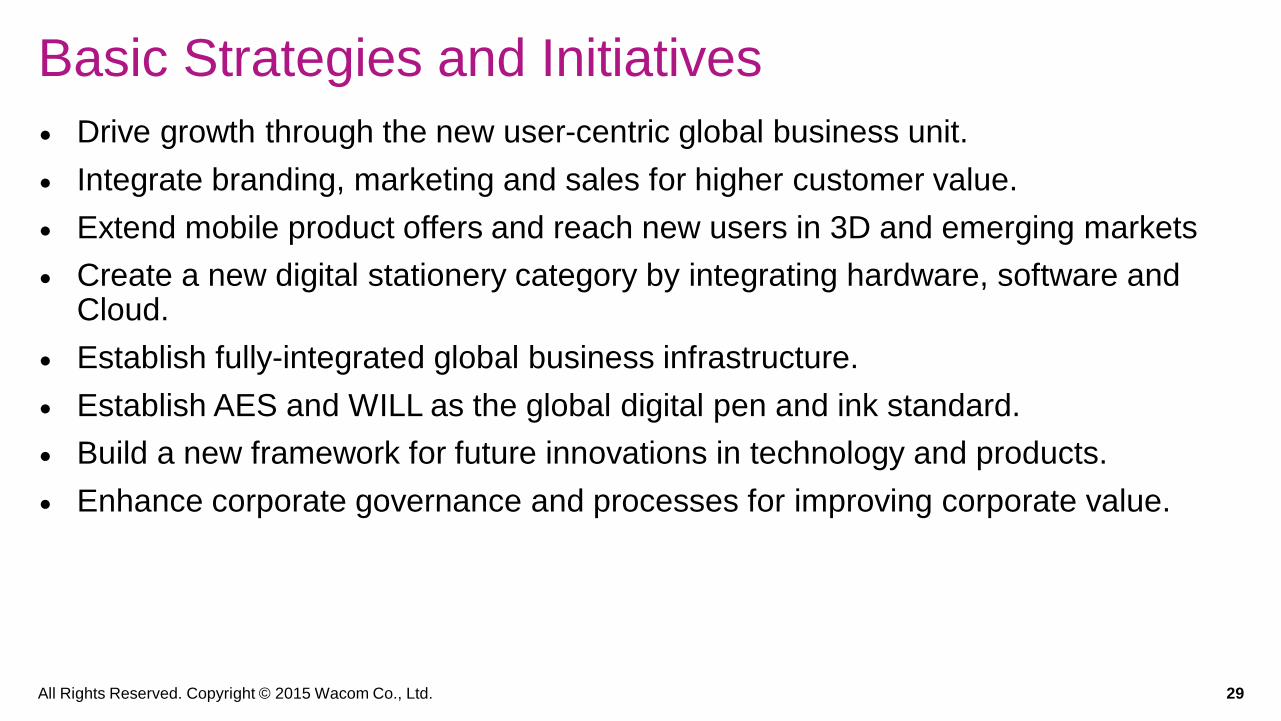
Basic Strategies and Initiatives
Drive growth through the new user-centric global business unit.
Integrate branding, marketing and sales for higher customer value.
Extend mobile product offers and reach new users in 3D and emerging markets
Create a new digital stationery category by integrating hardware, software and Cloud.
Establish fully-integrated global business infrastructure.
Establish AES and WILL as the global digital pen and ink standard.
Build a new framework for future innovations in technology and products.
Enhance corporate governance and processes for improving corporate value.

All Rights Reserved. Copyright © 2015 Wacom Co., Ltd. 30
Assumptions for FY 03/16 Financial Forecast Market demand for Brand Business based on further review of trend in October 2015.
Reflected the customers demand forecast and market trends in Technology Solution Business. We recognize that risks and uncertainties in the business are still considerable and actual results may materially differ from our latest financial forecast in the short term.
Forex rate assumptions for FY 03/16 (revised USD/JPY only)
1USD = 120 JPY (previous assumption 110JPY)1EUR = 130 JPY
Forex exchange sensitivity: 12-month forecast
Currency USD EUR
Unit of sensitivity JPY 1 JPY 1
Net Sales 470 (550) 120
Operating Income 0 80 (90)
(Note) A stronger yen has a negative effect while a weaker yen has a positive effect.
(Unit: Million JPY)
(previous assumption)

All Rights Reserved. Copyright © 2015 Wacom Co., Ltd. 31
Summary for FY 03/16 Forecast
vs. initialFY 3/16 (initial) FY 3/16 (revised)
04/14-03/15 04/15-03/16 Change
Net Sales 84,000 81,000 -3.6%
Operating Income 5,500 6.5% 4,800 5.9% -12.7%
Ordinary Income 5,350 6.4% 4,780 5.9% -10.7%
Net Profit 3,540 4.2% 3,050 3.8% -13.6%
Y on YFY 3/15 (actual) FY 3/16 (revised)
04/14-03/15 04/15-03/16 Change
Net Sales 74,557 81,000 8.6%
Operating Income 6,143 8.2% 4,800 5.9% -21.9%
Ordinary Income 6,065 8.1% 4,780 5.9% -21.2%
Net Profit 3,473 4.7% 3,050 3.8% -12.2%
ROE 10.5% 9.2% -1.3%
(Unit: Million JPY)

All Rights Reserved. Copyright © 2015 Wacom Co., Ltd. 32
(Note) Due to risks and uncertainties involved in the forecast of market and customer trends in Technology Solution Business,
actual results may materially differ from forward-looking statements in the short term.
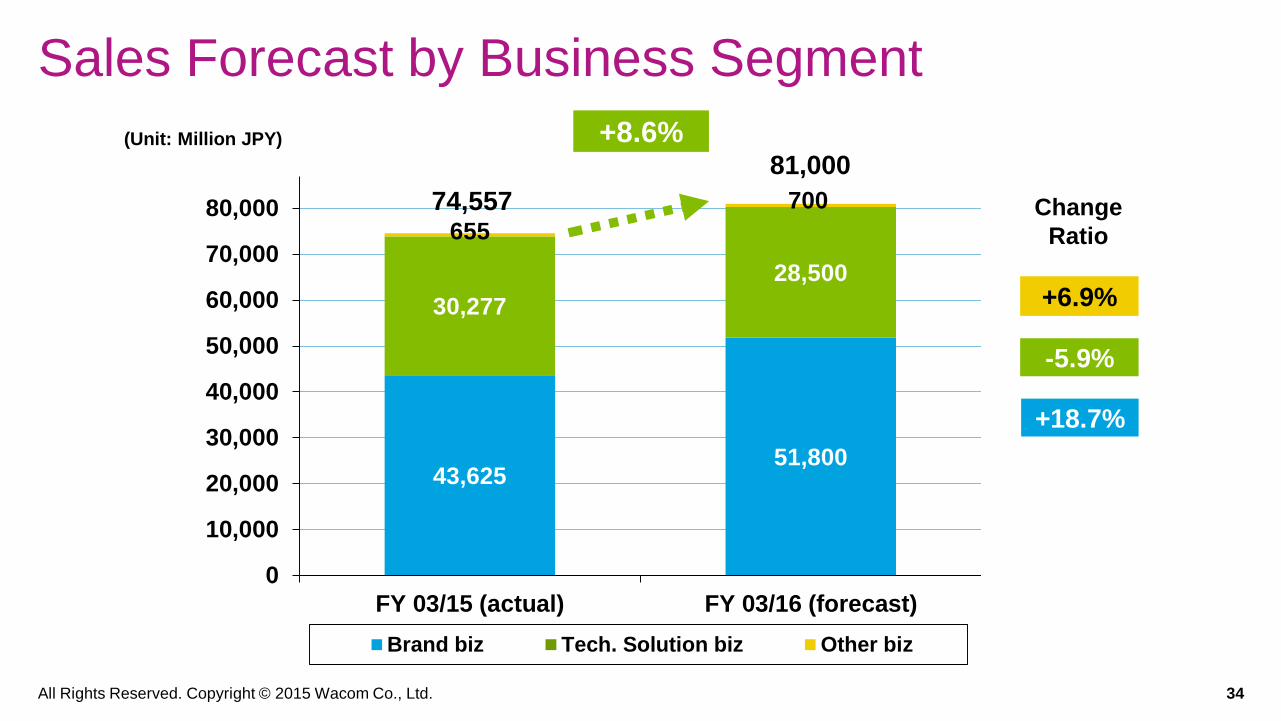
Forecast of Results by Business Segment
FY 3/15(act.) FY 3/16(fcst) YOY Change
04/14-03/15 04/15-03/16 Amount Ratio
Net Sales 74,557 81,000 6,443 8.6%
Brand biz 43,625 51,800 8,175 18.7%
Tech. Solution biz 30,277 28,500 -1,777 -5.9%
Other biz 655 700 45 6.9%
Operating Income 6,143 4,800 -1,343 -21.9%
Brand biz 5,965 9,040 3,075 51.6%
Tech. Solution biz 4,642 3,260 -1,382 -29.8%
Other biz 55 60 5 8.8%
Corp. and others -4,519 -7,560 -3,041 67.3%
profit margin % 8.2% 5.9%
(Unit: Mil JPY)
All Rights Reserved. Copyright © 2015 Wacom Co., Ltd. 33
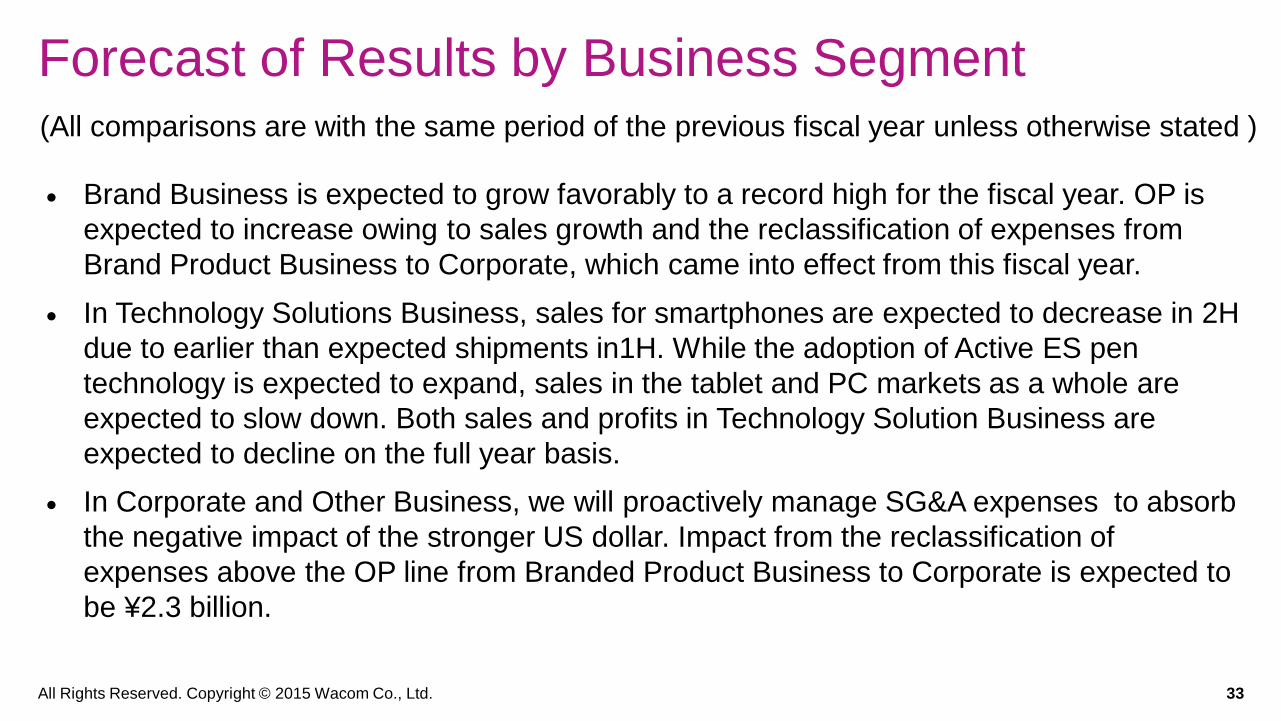
Forecast of Results by Business Segment
Brand Business is expected to grow favorably to a record high for the fiscal year. OP is
expected to increase owing to sales growth and the reclassification of expenses from
Brand Product Business to Corporate, which came into effect from this fiscal year.
In Technology Solutions Business, sales for smartphones are expected to decrease in 2H
due to earlier than expected shipments in1H. While the adoption of Active ES pen
technology is expected to expand, sales in the tablet and PC markets as a whole are
expected to slow down. Both sales and profits in Technology Solution Business are
expected to decline on the full year basis.
In Corporate and Other Business, we will proactively manage SG&A expenses to absorb
the negative impact of the stronger US dollar. Impact from the reclassification of
expenses above the OP line from Branded Product Business to Corporate is expected to
be ¥2.3 billion.
(All comparisons are with the same period of the previous fiscal year unless otherwise stated )
All Rights Reserved. Copyright © 2015 Wacom Co., Ltd. 34
Sales Forecast by Business Segment
43,62551,800
30,277
28,500
655
700
0
10,000
20,000
30,000
40,000
50,000
60,000
70,000
80,000
FY 03/15 (actual) FY 03/16 (forecast)
Brand biz Tech. Solution biz Other biz
+6.9%
+18.7%
-5.9%
+8.6%
74,557
81,000(Unit: Million JPY)
Change
Ratio

All Rights Reserved. Copyright © 2015 Wacom Co., Ltd. 35
Sales Forecast by Product line in Brand Product
21,981 24,500
3,9095,400
10,590
13,2001,554
2,3005,591
6,400
0
10,000
20,000
30,000
40,000
50,000
FY 03/15 (actual) FY 03/16 (forecast)
Creative・Pen tablet Creative・Mobile Creative・DisplayConsumer Business Solution
+48.0%
+38.1%
+11.5%
+24.6%
+14.5%
51,800
43,6250
+18.7%
Creative
biz
36,480
Creative
Biz
43,100
+18.1%
(Unit: Million JPY)
Change
Ratio

All Rights Reserved. Copyright © 2015 Wacom Co., Ltd. 36
Sales Forecast by Product line in Tech. Solution
18,331 17,200
8,542 9,300
3,4042,000
0
5,000
10,000
15,000
20,000
25,000
30,000
FY 03/15 (actual) FY 03/16 (forecast)
Pen for Smartphone Pen for Tablet Pen for Notebook PC, etc.
-41.3%
+8.9%
-6.2%
28,50030,277
-5.9%(Unit: Million JPY)
Change
Ratio

All Rights Reserved. Copyright © 2015 Wacom Co., Ltd. 37
Sales Forecast by Region
30,277 28,500
7,132 8,200
13,914 16,580
14,53215,610
8,70212,110
0
10,000
20,000
30,000
40,000
50,000
60,000
70,000
80,000
FY 03/15 (actual) FY 03/16 (forecast)
Tech. Solution Japan U.S. Germany Asia Oceania
+39.2%
+19.2%
+15.0%
-5.9%
+7.4%
+8.6%
74,557
81,000(Unit: Million JPY)
Change
Ratio
(Note) There are no regional segments in the Tech. Solution Biz.
All Rights Reserved. Copyright © 2015 Wacom Co., Ltd. 38
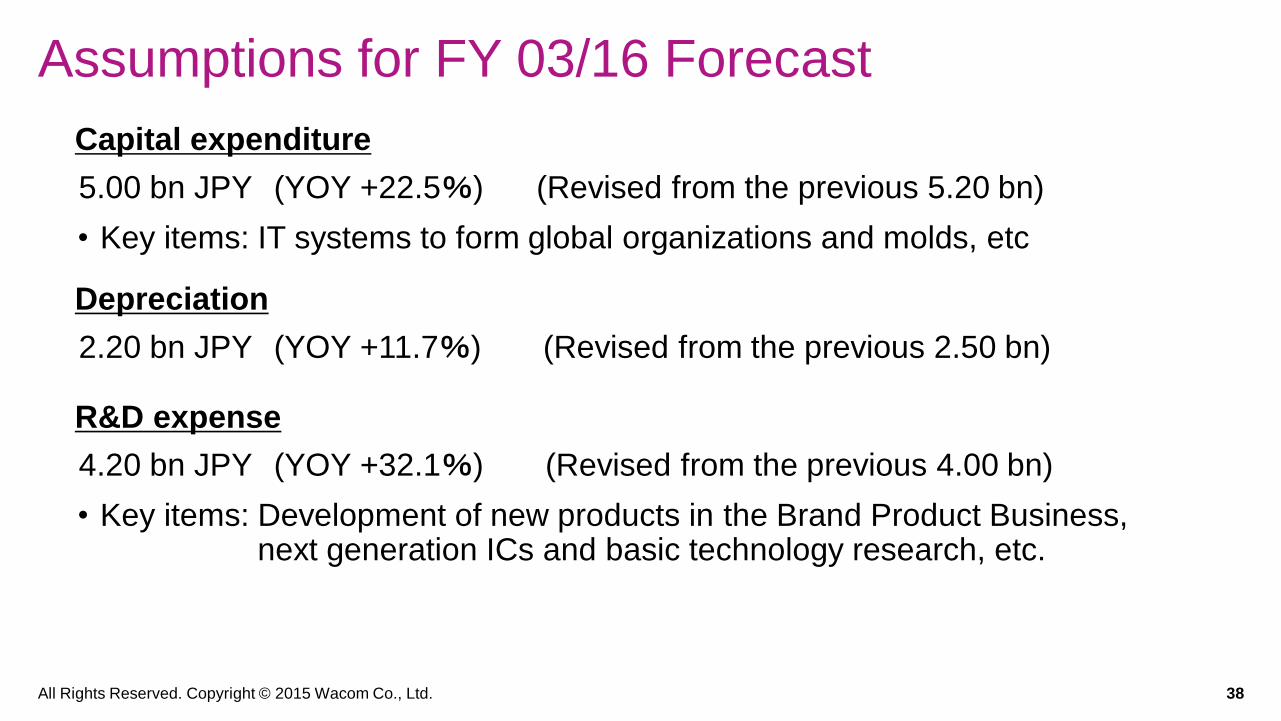
Assumptions for FY 03/16 Forecast
Capital expenditure
5.00 bn JPY (YOY +22.5%) (Revised from the previous 5.20 bn)
• Key items: IT systems to form global organizations and molds, etc
Depreciation
2.20 bn JPY (YOY +11.7%) (Revised from the previous 2.50 bn)
R&D expense
4.20 bn JPY (YOY +32.1%) (Revised from the previous 4.00 bn)
• Key items: Development of new products in the Brand Product Business,next generation ICs and basic technology research, etc.

All Rights Reserved. Copyright © 2015 Wacom Co., Ltd. 39
Dividend Forecast for FY 03/16
Dividend policy
Continue steady dividend payout to shareholders while maintaining a stable financial base necessary for future business development.
Target payout ratio maintains approximately 40% or more to attract global investment.
Dividend per share (No revision from the initial forecast)
JPY 18.00 per share for FY 03/16 (JPY 18.00 for FY 03/15)
Payout ratio 97.1% (86.3% for FY 03/15)

All Rights Reserved. Copyright © 2015 Wacom Co., Ltd. 40
Dividends per Share
0.00
2.50
5.00
7.50
10.00
12.50
15.00
17.50
20.00
FY 03/12 FY 03/13 FY 03/14 FY 03/15 FY 03/16
Specialdividend pershare
Ordinaydividend pershare
54.9%37.7%
55.9%
86.3%97.1%
Payout ratio
7.50
11.25
18.0017.50 18.00
(Unit: JPY)
(Forecast)
(Forecast)
(Forecast)

All Rights Reserved. Copyright © 2015 Wacom Co., Ltd. 41
our vision

All Rights Reserved. Copyright © 2015 Wacom Co., Ltd. 42our mission

All Rights Reserved. Copyright © 2015 Wacom Co., Ltd. 43
our brand

DisclaimerForward-looking statements regarding future events and
performance contained in this presentation are based on currently
available information and involve risks and uncertainties, including
macroeconomic conditions, trends of the industry in which the
company is engaged and progress in new technologies. Please
note that actual results could materially differ from those expressed
or implied by the forward-looking statements in this presentation
due to these risks and uncertainties.
Investor Relations Inquiries
TEL: +81-3-5337-6502 FAX: +81-3-5337-6519
Wacom Co., Ltd.
Sumitomo Fudosan Shinjuku Grand Tower 31F,
8-17-1 Nishi-Shinjuku, Shinjuku-ku, Tokyo
160-6131, Japan
Wacom Co., Ltd.
http://www.wacom.com