Embed Size (px)
Citation preview

The Private Sector Organization of Jamaica, Carlton Alexander Building, 39 Hope Road Kingston 10 Jamaica Tel (927-6238) Fax (927 5137)
April 2015 Issue
The Private Sector Organization of Jamaica, Carlton Alexander Building, 39 Hope Road Kingston 10 Jamaica Tel (927-6238) Fax (927 5137) 2
2
April 2015 Issue
April 25, 2015
Inside This Issue
CEO’s Report 3
Economic Highlights 4-5
International Commodity Prices 6-19
International Commodity Prices: Impact on Jamaica 20-22
Inflation Rate & GOJ Treasury Bills 23
Exchange Rates: Jamaica Dollar Vis-à-vis USD, GBP, CAD 24
Net International Reserves and Money Supply 25-26
Commercial Banks’ Interest Rates 27
Jamaica’s Tourist Arrivals 28
Remittance Inflows to Jamaica 29
Domestic Bauxite and Alumina Production 30
Stock Market Update 31
Previous Month’s Highlights 32-33
Appendices 34-36

The Private Sector Organization of Jamaica, Carlton Alexander Building, 39 Hope Road Kingston 10 Jamaica Tel (927-6238) Fax (927 5137) 3
3
April 2015 Issue
The economy returned to real GDP growth in the first quarter
of 2015 (January to March), with 0.3% real GDP growth rec-
orded, which reversed the two consecutive quarters of decline
in 2014, between July and December. While this is not signifi-
cant, it still signifies an expected return to growth.
As a country we realize that growth is going to be critical if we
are to continue to be successful under the IMF programme,
and hence improvement in the economy. We have seen the
first sign of how critical growth is with the $4 billion shortfall in
the monetary target for the primary surplus target in the just
ended fiscal year for 2014/15.
But this growth must be a deliberate strategy, and takes very
careful consideration and management. Some of the deliber-
ate actions which must take place to achieve the expected two
percept growth include:
Proper governance to ensure that we do not see a recurrence
of the events such as the ChickV and Riverton Fire
productivity losses. This of course also means that the
government must ensure that proper resources are allo-
cated to the prevention of any such event, and not react
after the fact and the productivity losses.
Proper fiscal management. Specifically we have seen in the
past where governments have literally abandoned prudent
fiscal management, as a result of elections or the dictates
of interest groups. The result has been that we have on
many occasions have to restart our progress. The public
sector wage negotiations come to mind, as we must arrive
at a long term win-win situation between the unions repre-
senting the public sector workers and the government.
What is clear is that the fiscal accounts will not be able to
support any double digit wage increase, else we will find
ourselves, individually and as a country, worse than
where we are today very soon.
Public sector bureaucracy. This is one of the most debilitating
issues facing businesses today, especially SMEs. As an
example, the Doing Business Report shows that it takes
Jamaicans some 360 hours per month to pay taxes, while
The CEO’S Remarks
in Singapore that number is closer to 75 hours. The fact is
that unless the public sector bureaucracy increases its
efficiencies then it will also negatively affect private sector
productivity, as we rely significantly on public sector ser-
vices.
Tax compliance efforts must result in a widening of the net, not
place additional burdens on already compliant taxpayers.
We must remember that we live in a competitive global
space, and our tax competitiveness determines among
other things, how willing companies are to headquarter in
Jamaica. The recent 3% Withholding Tax is another ex-
ample of poor government policy without consultation, as
it will only serve to drive administrative burdens, costs for
businesses, and also cause price increases from compa-
nies from whom money will be withheld.
Infrastructure development is also going to be critical, as no
investor wants to come in to a market with poor infrastruc-
ture. There is an understanding that resources are limited,
but infrastructure development must be done in value add-
ed parts of our economy like the Tourism surroundings.
General indiscipline and the crime monster must be dealt with.
Without this then the market, and citizens, will not realize
there full potential. In addition, investments will demand a
higher risk premium, which will drive higher than needed
inflation.
My position therefore is that we can easily get to 2% real GDP
growth for 2015, but it requires careful management and delib-
erate actions.
We must recognize as a country that we are in a new para-
digm, which requires greater competitiveness and more think-
ing outside of the box. The failure to adapt will of course result
in challenging times.
I think, however, that Jamaica has significant potential. This
potential can only be realized with deliberate and careful man-
agement.
The Private Sector Organization of Jamaica, Carlton Alexander Building, 39 Hope Road Kingston 10 Jamaica Tel (927-6238) Fax (927 5137) 4
4
April 2015 Issue Economic Highlights: April 2015
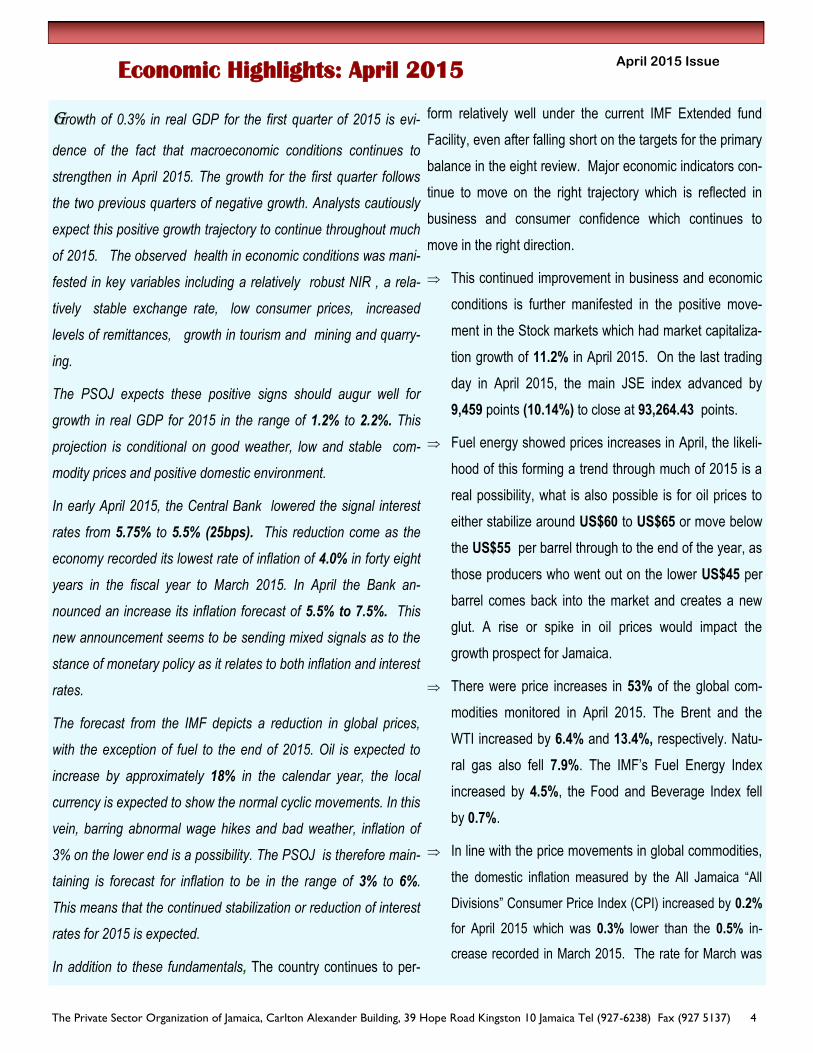
Growth of 0.3% in real GDP for the first quarter of 2015 is evi-
dence of the fact that macroeconomic conditions continues to
strengthen in April 2015. The growth for the first quarter follows
the two previous quarters of negative growth. Analysts cautiously
expect this positive growth trajectory to continue throughout much
of 2015. The observed health in economic conditions was mani-
fested in key variables including a relatively robust NIR , a rela-
tively stable exchange rate, low consumer prices, increased
levels of remittances, growth in tourism and mining and quarry-
ing.
The PSOJ expects these positive signs should augur well for
growth in real GDP for 2015 in the range of 1.2% to 2.2%. This
projection is conditional on good weather, low and stable com-
modity prices and positive domestic environment.
In early April 2015, the Central Bank lowered the signal interest
rates from 5.75% to 5.5% (25bps). This reduction come as the
economy recorded its lowest rate of inflation of 4.0% in forty eight
years in the fiscal year to March 2015. In April the Bank an-
nounced an increase its inflation forecast of 5.5% to 7.5%. This
new announcement seems to be sending mixed signals as to the
stance of monetary policy as it relates to both inflation and interest
rates.
The forecast from the IMF depicts a reduction in global prices,
with the exception of fuel to the end of 2015. Oil is expected to
increase by approximately 18% in the calendar year, the local
currency is expected to show the normal cyclic movements. In this
vein, barring abnormal wage hikes and bad weather, inflation of
3% on the lower end is a possibility. The PSOJ is therefore main-
taining is forecast for inflation to be in the range of 3% to 6%.
This means that the continued stabilization or reduction of interest
rates for 2015 is expected.
In addition to these fundamentals, The country continues to per-
form relatively well under the current IMF Extended fund
Facility, even after falling short on the targets for the primary
balance in the eight review. Major economic indicators con-
tinue to move on the right trajectory which is reflected in
business and consumer confidence which continues to
move in the right direction.
This continued improvement in business and economic
conditions is further manifested in the positive move-
ment in the Stock markets which had market capitaliza-
tion growth of 11.2% in April 2015. On the last trading
day in April 2015, the main JSE index advanced by
9,459 points (10.14%) to close at 93,264.43 points.
Fuel energy showed prices increases in April, the likeli-
hood of this forming a trend through much of 2015 is a
real possibility, what is also possible is for oil prices to
either stabilize around US$60 to US$65 or move below
the US$55 per barrel through to the end of the year, as
those producers who went out on the lower US$45 per
barrel comes back into the market and creates a new
glut. A rise or spike in oil prices would impact the
growth prospect for Jamaica.
There were price increases in 53% of the global com-
modities monitored in April 2015. The Brent and the
WTI increased by 6.4% and 13.4%, respectively. Natu-
ral gas also fell 7.9%. The IMF’s Fuel Energy Index
increased by 4.5%, the Food and Beverage Index fell
by 0.7%.
In line with the price movements in global commodities,
the domestic inflation measured by the All Jamaica “All
Divisions” Consumer Price Index (CPI) increased by 0.2%
for April 2015 which was 0.3% lower than the 0.5% in-
crease recorded in March 2015. The rate for March was
The Private Sector Organization of Jamaica, Carlton Alexander Building, 39 Hope Road Kingston 10 Jamaica Tel (927-6238) Fax (927 5137) 5
5
April 2015 Issue Economic Highlights: March 2015
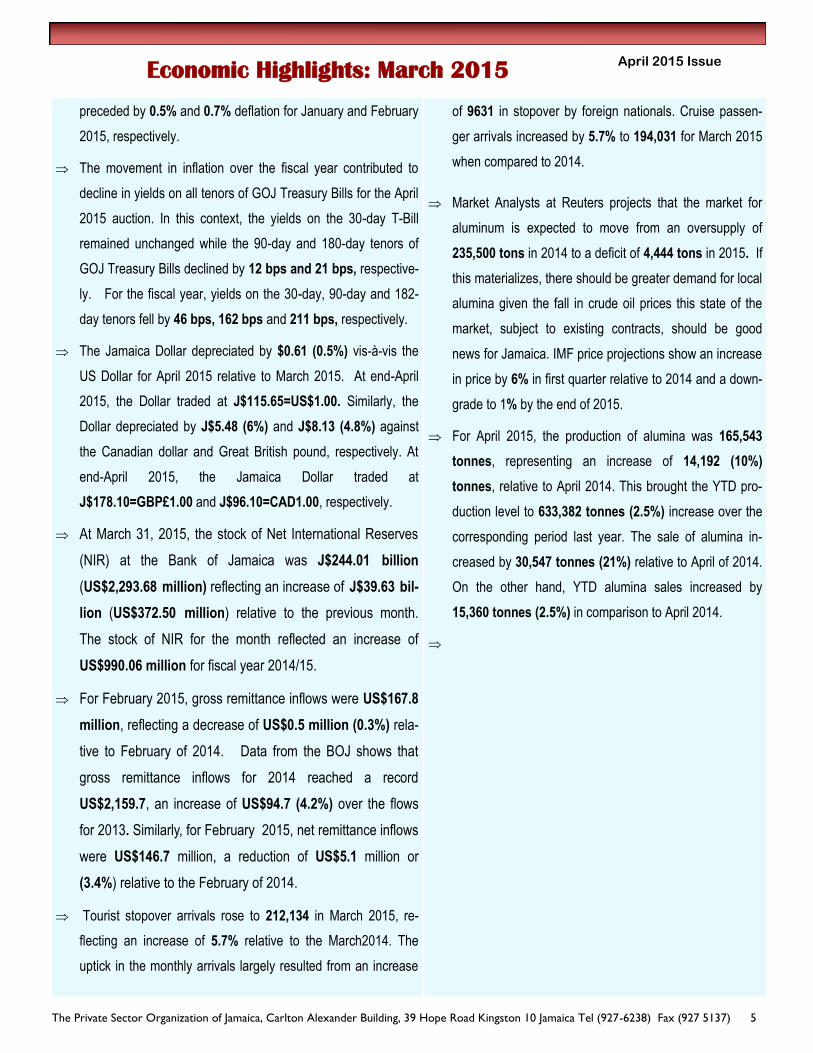
preceded by 0.5% and 0.7% deflation for January and February
2015, respectively.
The movement in inflation over the fiscal year contributed to
decline in yields on all tenors of GOJ Treasury Bills for the April
2015 auction. In this context, the yields on the 30-day T-Bill
remained unchanged while the 90-day and 180-day tenors of
GOJ Treasury Bills declined by 12 bps and 21 bps, respective-
ly. For the fiscal year, yields on the 30-day, 90-day and 182-
day tenors fell by 46 bps, 162 bps and 211 bps, respectively.
The Jamaica Dollar depreciated by $0.61 (0.5%) vis-à-vis the
US Dollar for April 2015 relative to March 2015. At end-April
2015, the Dollar traded at J$115.65=US$1.00. Similarly, the
Dollar depreciated by J$5.48 (6%) and J$8.13 (4.8%) against
the Canadian dollar and Great British pound, respectively. At
end-April 2015, the Jamaica Dollar traded at
J$178.10=GBP£1.00 and J$96.10=CAD1.00, respectively.
At March 31, 2015, the stock of Net International Reserves
(NIR) at the Bank of Jamaica was J$244.01 billion
(US$2,293.68 million) reflecting an increase of J$39.63 bil-
lion (US$372.50 million) relative to the previous month.
The stock of NIR for the month reflected an increase of
US$990.06 million for fiscal year 2014/15.
For February 2015, gross remittance inflows were US$167.8
million, reflecting a decrease of US$0.5 million (0.3%) rela-
tive to February of 2014. Data from the BOJ shows that
gross remittance inflows for 2014 reached a record
US$2,159.7, an increase of US$94.7 (4.2%) over the flows
for 2013. Similarly, for February 2015, net remittance inflows
were US$146.7 million, a reduction of US$5.1 million or
(3.4%) relative to the February of 2014.
Tourist stopover arrivals rose to 212,134 in March 2015, re-
flecting an increase of 5.7% relative to the March2014. The
uptick in the monthly arrivals largely resulted from an increase
of 9631 in stopover by foreign nationals. Cruise passen-
ger arrivals increased by 5.7% to 194,031 for March 2015
when compared to 2014.
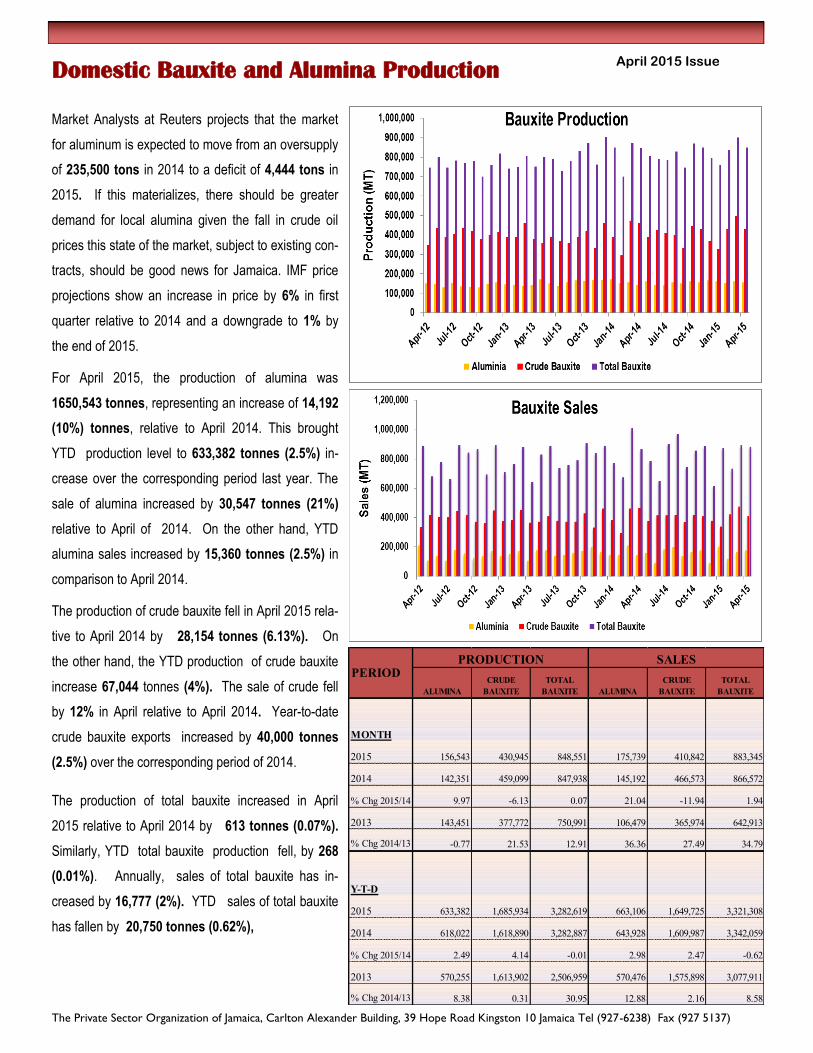
Market Analysts at Reuters projects that the market for
aluminum is expected to move from an oversupply of
235,500 tons in 2014 to a deficit of 4,444 tons in 2015. If
this materializes, there should be greater demand for local
alumina given the fall in crude oil prices this state of the
market, subject to existing contracts, should be good
news for Jamaica. IMF price projections show an increase
in price by 6% in first quarter relative to 2014 and a down-
grade to 1% by the end of 2015.
For April 2015, the production of alumina was 165,543
tonnes, representing an increase of 14,192 (10%)
tonnes, relative to April 2014. This brought the YTD pro-
duction level to 633,382 tonnes (2.5%) increase over the
corresponding period last year. The sale of alumina in-
creased by 30,547 tonnes (21%) relative to April of 2014.
On the other hand, YTD alumina sales increased by
15,360 tonnes (2.5%) in comparison to April 2014.

The Private Sector Organization of Jamaica, Carlton Alexander Building, 39 Hope Road Kingston 10 Jamaica Tel (927-6238) Fax (927 5137) 6
6
April 2015 Issue
The Private Sector Organization of Jamaica, Carlton Alexander Building, 39 Hope Road Kingston 10 Jamaica Tel (927-6238) Fax (927 5137) 7
7
April 2015 Issue
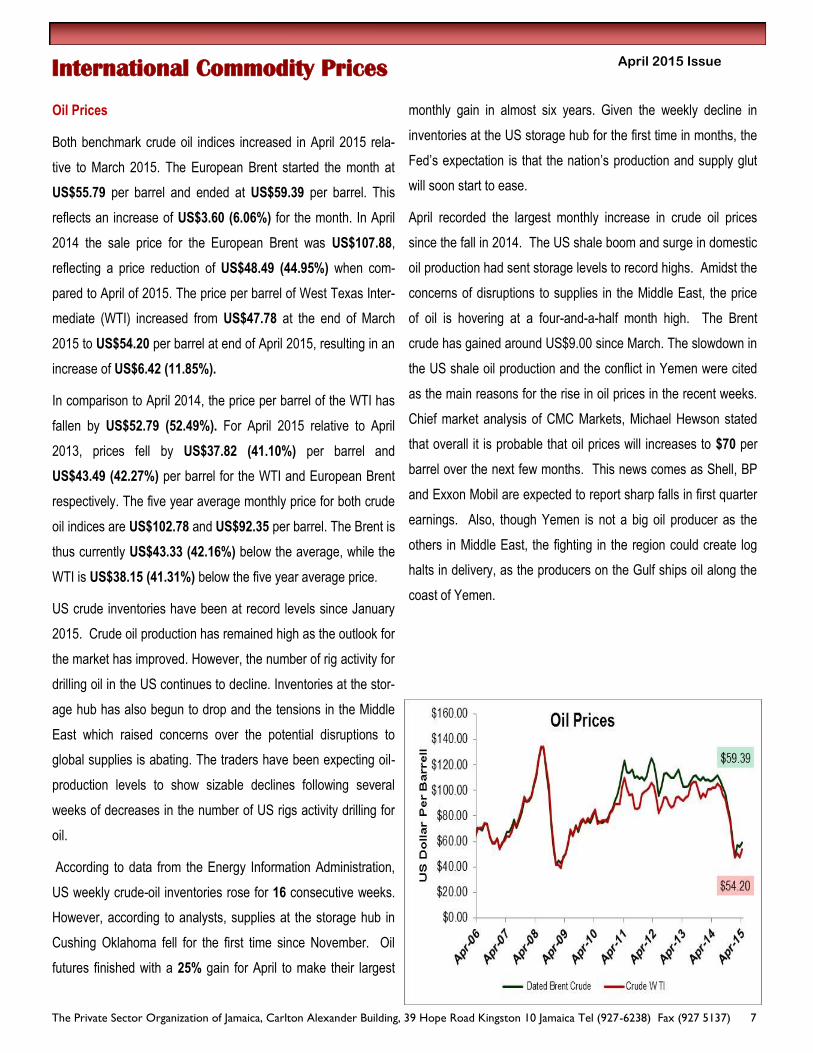
Oil Prices
Both benchmark crude oil indices increased in April 2015 rela-
tive to March 2015. The European Brent started the month at
US$55.79 per barrel and ended at US$59.39 per barrel. This
reflects an increase of US$3.60 (6.06%) for the month. In April
2014 the sale price for the European Brent was US$107.88,
reflecting a price reduction of US$48.49 (44.95%) when com-
pared to April of 2015. The price per barrel of West Texas Inter-
mediate (WTI) increased from US$47.78 at the end of March
2015 to US$54.20 per barrel at end of April 2015, resulting in an
increase of US$6.42 (11.85%).
In comparison to April 2014, the price per barrel of the WTI has
fallen by US$52.79 (52.49%). For April 2015 relative to April
2013, prices fell by US$37.82 (41.10%) per barrel and
US$43.49 (42.27%) per barrel for the WTI and European Brent
respectively. The five year average monthly price for both crude
oil indices are US$102.78 and US$92.35 per barrel. The Brent is
thus currently US$43.33 (42.16%) below the average, while the
WTI is US$38.15 (41.31%) below the five year average price.
US crude inventories have been at record levels since January
2015. Crude oil production has remained high as the outlook for
the market has improved. However, the number of rig activity for
drilling oil in the US continues to decline. Inventories at the stor-
age hub has also begun to drop and the tensions in the Middle
East which raised concerns over the potential disruptions to
global supplies is abating. The traders have been expecting oil-
production levels to show sizable declines following several
weeks of decreases in the number of US rigs activity drilling for
oil.
According to data from the Energy Information Administration,
US weekly crude-oil inventories rose for 16 consecutive weeks.
However, according to analysts, supplies at the storage hub in
Cushing Oklahoma fell for the first time since November. Oil
futures finished with a 25% gain for April to make their largest
International Commodity Prices
monthly gain in almost six years. Given the weekly decline in
inventories at the US storage hub for the first time in months, the
Fed’s expectation is that the nation’s production and supply glut
will soon start to ease.
April recorded the largest monthly increase in crude oil prices
since the fall in 2014. The US shale boom and surge in domestic
oil production had sent storage levels to record highs. Amidst the
concerns of disruptions to supplies in the Middle East, the price
of oil is hovering at a four-and-a-half month high. The Brent
crude has gained around US$9.00 since March. The slowdown in
the US shale oil production and the conflict in Yemen were cited
as the main reasons for the rise in oil prices in the recent weeks.
Chief market analysis of CMC Markets, Michael Hewson stated
that overall it is probable that oil prices will increases to $70 per
barrel over the next few months. This news comes as Shell, BP
and Exxon Mobil are expected to report sharp falls in first quarter
earnings. Also, though Yemen is not a big oil producer as the
others in Middle East, the fighting in the region could create log
halts in delivery, as the producers on the Gulf ships oil along the
coast of Yemen.
The Private Sector Organization of Jamaica, Carlton Alexander Building, 39 Hope Road Kingston 10 Jamaica Tel (927-6238) Fax (927 5137) 8
8
April 2015 Issue
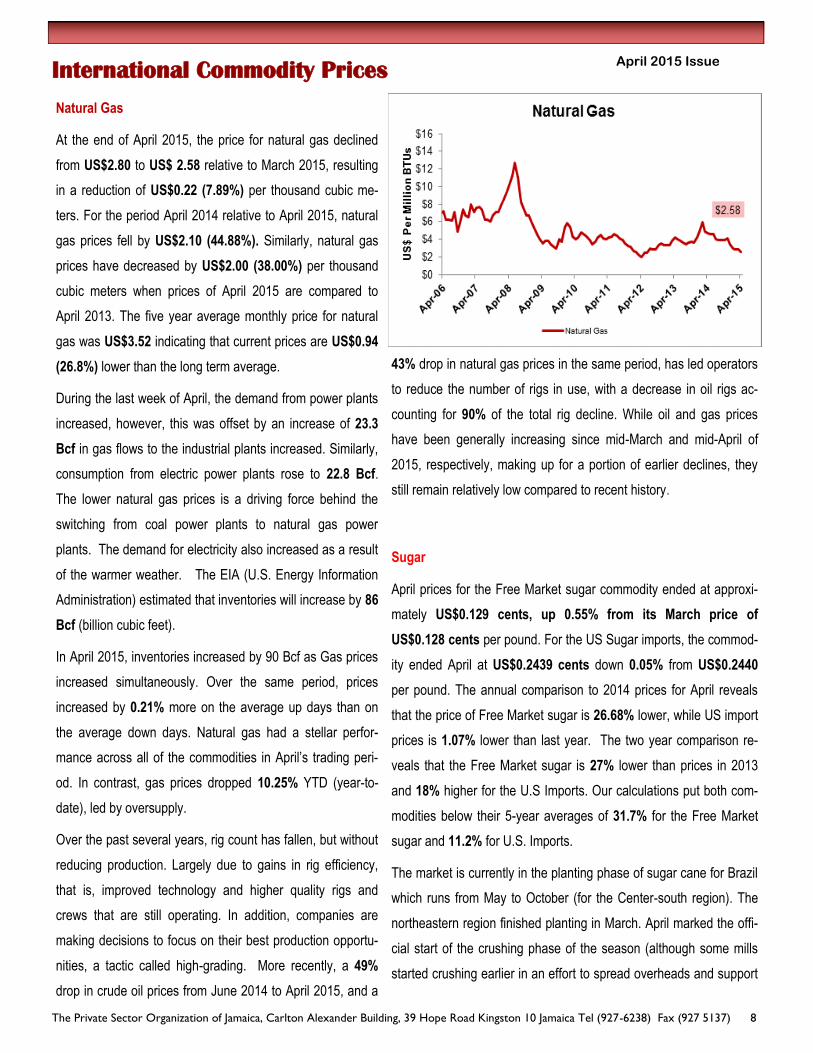
Natural Gas
At the end of April 2015, the price for natural gas declined
from US$2.80 to US$ 2.58 relative to March 2015, resulting
in a reduction of US$0.22 (7.89%) per thousand cubic me-
ters. For the period April 2014 relative to April 2015, natural
gas prices fell by US$2.10 (44.88%). Similarly, natural gas
prices have decreased by US$2.00 (38.00%) per thousand
cubic meters when prices of April 2015 are compared to
April 2013. The five year average monthly price for natural
gas was US$3.52 indicating that current prices are US$0.94
(26.8%) lower than the long term average.
During the last week of April, the demand from power plants
increased, however, this was offset by an increase of 23.3
Bcf in gas flows to the industrial plants increased. Similarly,
consumption from electric power plants rose to 22.8 Bcf.
The lower natural gas prices is a driving force behind the
switching from coal power plants to natural gas power
plants. The demand for electricity also increased as a result
of the warmer weather. The EIA (U.S. Energy Information
Administration) estimated that inventories will increase by 86
Bcf (billion cubic feet).
In April 2015, inventories increased by 90 Bcf as Gas prices
increased simultaneously. Over the same period, prices
increased by 0.21% more on the average up days than on
the average down days. Natural gas had a stellar perfor-
mance across all of the commodities in April’s trading peri-
od. In contrast, gas prices dropped 10.25% YTD (year-to-
date), led by oversupply.
Over the past several years, rig count has fallen, but without
reducing production. Largely due to gains in rig efficiency,
that is, improved technology and higher quality rigs and
crews that are still operating. In addition, companies are
making decisions to focus on their best production opportu-
nities, a tactic called high-grading. More recently, a 49%
drop in crude oil prices from June 2014 to April 2015, and a
International Commodity Prices
43% drop in natural gas prices in the same period, has led operators
to reduce the number of rigs in use, with a decrease in oil rigs ac-
counting for 90% of the total rig decline. While oil and gas prices
have been generally increasing since mid-March and mid-April of
2015, respectively, making up for a portion of earlier declines, they
still remain relatively low compared to recent history.
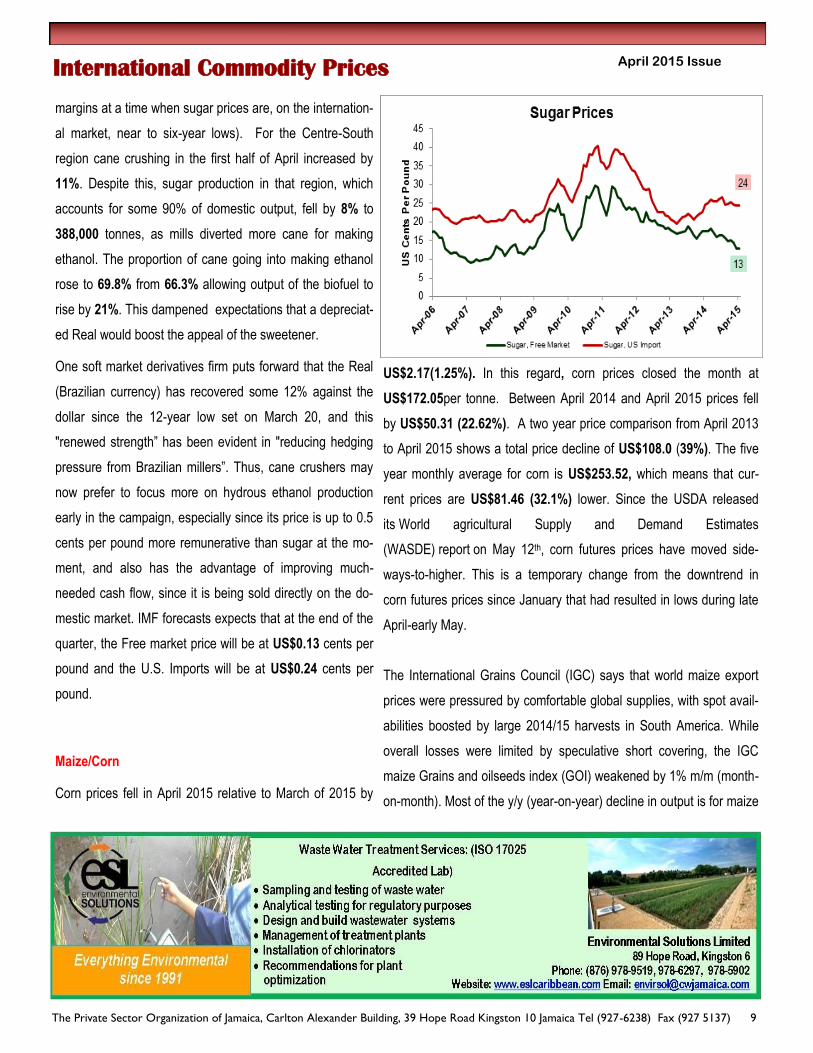
Sugar
April prices for the Free Market sugar commodity ended at approxi-
mately US$0.129 cents, up 0.55% from its March price of
US$0.128 cents per pound. For the US Sugar imports, the commod-
ity ended April at US$0.2439 cents down 0.05% from US$0.2440
per pound. The annual comparison to 2014 prices for April reveals
that the price of Free Market sugar is 26.68% lower, while US import
prices is 1.07% lower than last year. The two year comparison re-
veals that the Free Market sugar is 27% lower than prices in 2013
and 18% higher for the U.S Imports. Our calculations put both com-
modities below their 5-year averages of 31.7% for the Free Market
sugar and 11.2% for U.S. Imports.
The market is currently in the planting phase of sugar cane for Brazil
which runs from May to October (for the Center-south region). The
northeastern region finished planting in March. April marked the offi-
cial start of the crushing phase of the season (although some mills
started crushing earlier in an effort to spread overheads and support
The Private Sector Organization of Jamaica, Carlton Alexander Building, 39 Hope Road Kingston 10 Jamaica Tel (927-6238) Fax (927 5137) 9
9
April 2015 Issue International Commodity Prices
margins at a time when sugar prices are, on the internation-
al market, near to six-year lows). For the Centre-South
region cane crushing in the first half of April increased by
11%. Despite this, sugar production in that region, which
accounts for some 90% of domestic output, fell by 8% to
388,000 tonnes, as mills diverted more cane for making
ethanol. The proportion of cane going into making ethanol
rose to 69.8% from 66.3% allowing output of the biofuel to
rise by 21%. This dampened expectations that a depreciat-
ed Real would boost the appeal of the sweetener.
One soft market derivatives firm puts forward that the Real
(Brazilian currency) has recovered some 12% against the
dollar since the 12-year low set on March 20, and this
"renewed strength” has been evident in "reducing hedging
pressure from Brazilian millers”. Thus, cane crushers may
now prefer to focus more on hydrous ethanol production
early in the campaign, especially since its price is up to 0.5
cents per pound more remunerative than sugar at the mo-
ment, and also has the advantage of improving much-
needed cash flow, since it is being sold directly on the do-
mestic market. IMF forecasts expects that at the end of the
quarter, the Free market price will be at US$0.13 cents per
pound and the U.S. Imports will be at US$0.24 cents per
pound.
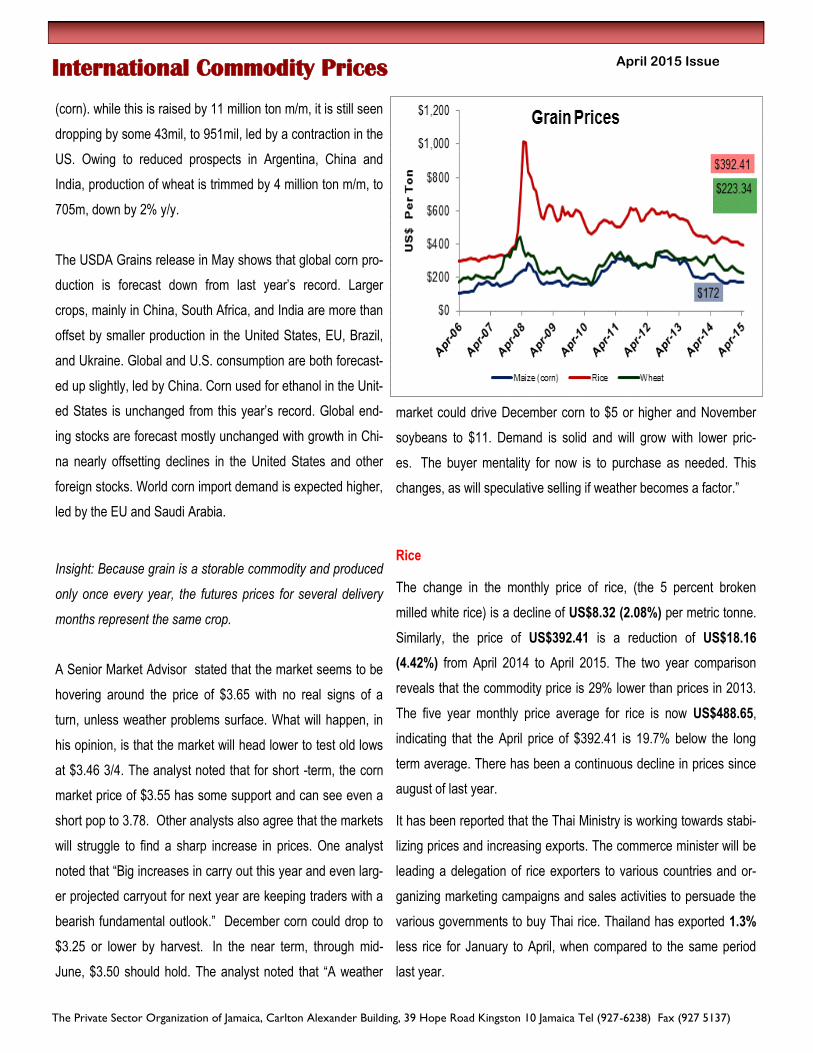
Maize/Corn
Corn prices fell in April 2015 relative to March of 2015 by
US$2.17(1.25%). In this regard, corn prices closed the month at
US$172.05per tonne. Between April 2014 and April 2015 prices fell
by US$50.31 (22.62%). A two year price comparison from April 2013
to April 2015 shows a total price decline of US$108.0 (39%). The five
year monthly average for corn is US$253.52, which means that cur-
rent prices are US$81.46 (32.1%) lower. Since the USDA released
its World agricultural Supply and Demand Estimates
(WASDE) report on May 12th, corn futures prices have moved side-
ways-to-higher. This is a temporary change from the downtrend in
corn futures prices since January that had resulted in lows during late
April-early May.
The International Grains Council (IGC) says that world maize export
prices were pressured by comfortable global supplies, with spot avail-
abilities boosted by large 2014/15 harvests in South America. While
overall losses were limited by speculative short covering, the IGC
maize Grains and oilseeds index (GOI) weakened by 1% m/m (month-
on-month). Most of the y/y (year-on-year) decline in output is for maize
The Private Sector Organization of Jamaica, Carlton Alexander Building, 39 Hope Road Kingston 10 Jamaica Tel (927-6238) Fax (927 5137)
10
April 2015 Issue International Commodity Prices
(corn). while this is raised by 11 million ton m/m, it is still seen
dropping by some 43mil, to 951mil, led by a contraction in the
US. Owing to reduced prospects in Argentina, China and
India, production of wheat is trimmed by 4 million ton m/m, to
705m, down by 2% y/y.
The USDA Grains release in May shows that global corn pro-
duction is forecast down from last year’s record. Larger
crops, mainly in China, South Africa, and India are more than
offset by smaller production in the United States, EU, Brazil,
and Ukraine. Global and U.S. consumption are both forecast-
ed up slightly, led by China. Corn used for ethanol in the Unit-
ed States is unchanged from this year’s record. Global end-
ing stocks are forecast mostly unchanged with growth in Chi-
na nearly offsetting declines in the United States and other
foreign stocks. World corn import demand is expected higher,
led by the EU and Saudi Arabia.
Insight: Because grain is a storable commodity and produced
only once every year, the futures prices for several delivery
months represent the same crop.
A Senior Market Advisor stated that the market seems to be
hovering around the price of $3.65 with no real signs of a
turn, unless weather problems surface. What will happen, in
his opinion, is that the market will head lower to test old lows
at $3.46 3/4. The analyst noted that for short -term, the corn
market price of $3.55 has some support and can see even a
short pop to 3.78. Other analysts also agree that the markets
will struggle to find a sharp increase in prices. One analyst
noted that “Big increases in carry out this year and even larg-
er projected carryout for next year are keeping traders with a
bearish fundamental outlook.” December corn could drop to
$3.25 or lower by harvest. In the near term, through mid-
June, $3.50 should hold. The analyst noted that “A weather
market could drive December corn to $5 or higher and November
soybeans to $11. Demand is solid and will grow with lower pric-
es. The buyer mentality for now is to purchase as needed. This
changes, as will speculative selling if weather becomes a factor.”
Rice
The change in the monthly price of rice, (the 5 percent broken
milled white rice) is a decline of US$8.32 (2.08%) per metric tonne.
Similarly, the price of US$392.41 is a reduction of US$18.16
(4.42%) from April 2014 to April 2015. The two year comparison
reveals that the commodity price is 29% lower than prices in 2013.
The five year monthly price average for rice is now US$488.65,
indicating that the April price of $392.41 is 19.7% below the long
term average. There has been a continuous decline in prices since
august of last year.
It has been reported that the Thai Ministry is working towards stabi-
lizing prices and increasing exports. The commerce minister will be
leading a delegation of rice exporters to various countries and or-
ganizing marketing campaigns and sales activities to persuade the
various governments to buy Thai rice. Thailand has exported 1.3%
less rice for January to April, when compared to the same period
last year.

The Private Sector Organization of Jamaica, Carlton Alexander Building, 39 Hope Road Kingston 10 Jamaica Tel (927-6238) Fax (927 5137)
11
April 2015 Issue
Thai and Vietnamese rice prices are currently in a similar
situation reported an official at the Thai rice exporters' asso-
ciation. Although prices have come down, exports have not
really picked up as demand from foreign countries remains
weak. Demand is expected to pick up in the coming weeks
however as Islamic nations start buying for the Muslim fast-
ing month of Ramadan, which starts around June 17. Once
it is Ramadan, however, the cost of making shipments is
expected to rise as well.
The Food and Agriculture Organization (FAO) in their April
review, reported an expectation that global rice production
will increase by 1.2%. As of April, global rice crop conditions
are mixed; favourable for India’s second crop, Vietnam and
for China, but poor for Thailand’s dry season rice. Planting is
underway in the U.S. and conditions are favourable. The IMF
forecast expects the price at the end of the second quarter to
be approximately U.S $411.4 per metric tonne.
Wheat
In April, global wheat prices fell again for the fourth straight
month, this time by US$7.48 (3.24%) when compared to
March, to close at US$ 223.34 per tonne. When compared
to April 2014, prices have fallen by US$101.59 per tonne
(31.26%). Prices are also below the 2-year average by $85
(28%) and below the 5-year average (which is $291.89) by
23.5%.
The United States is continuing to lose market share in world
wheat trade, reaching 15 percent, the lowest level ever in
USDA’s database. The USDA in April had said that weekly
exports of all wheat varieties saw a net cancellation of
449,167 tonnes for the current marketing season, the largest
such cancellation in USDA records going back to 1990. The
USDA's export sales report shocked the market, not so much
because the overall number was poor, but because there
International Commodity Prices
was a very large shift from old crop to new crop wheat. The market
will be concerned that it will now be left with old crop inventory that it
will need to place quickly.
In April, Minister of Agriculture for the third largest wheat producing
territory, India (after the EU and China), is reported as saying that
the country’s wheat production is likely to decline 4- 5% in the ongo-
ing season due to unseasonal rains and hailstorms in the previous
few weeks. One Canadian grains giant says the EU is to retain the
title as the top wheat exporter this season. The IMF commodities
forecast wheat prices to be well below its current level by the end of
the second quarter at US$176.6 per metric tonne. It is not unusual
for commodity prices to fluctuate greatly during planting phases due
to uncertainty.
Soybean
This month, the prices of soybean meal and soybean oil were a con-
trast. At the end of April the price per metric tonne for soybean oil
stood at increased US$ 691.67. This is 1.21% more than the March
price of US$683.43. This month’s price is also 25.95% lower than
last year. It is also 36% and 33.8% below its 2-year and 5-year aver-
ages. Prices have been declining since October 2014. The Soybean
Meal on the other hand decreased to US$349.71 (4.15%). This is
$183.91 (34.47%) lower than the price level last year. It is also 22%

The Private Sector Organization of Jamaica, Carlton Alexander Building, 39 Hope Road Kingston 10 Jamaica Tel (927-6238) Fax (927 5137)
12
April 2015 Issue International Commodity Prices
and 19% below its 2-year and 5-year averages.
Soybean-meal exports from India, one of the largest producers,
slumped 80 percent in April, the most since October, as higher
internal prices reduced demand for supplies from Asia’s big-
gest shipper. Soybean-meal exports from India may plunge to
the lowest in more than two decades in the crop year started
October 1 2014 as importers from Iran to Vietnam switch to
cheaper supplies. The Indian government has maintained sup-
port prices for soybeans even as futures in Chicago dropped
32 percent in the past year on record global harvests. That
pushed rates in the South Asian nation above its main competi-
tors Argentina, Brazil and the U.S.
For most of April, U.S. sales “struggled”. Soybean exports in-
creased for the first time in four weeks however as increased
Chinese demand helped soybean sales. Earlier this
month, U.S. soybean futures rose for the third consecutive ses-
sion, supported by strong gains in the soy oil market amid talk of
strong overseas demand. A sharp rally in soybean oil futures over
the past few sessions boosted prices of the oilseed. IMF forecasts
have however suggested declines in prices for both commodities
from this month to the ending of the second quarter. Soybean
Meal is forecasted to be US$358.5 while soybean oil is forecasted
to be US$696.
Coffee
The price of the Arabica and the Robusta coffee had smaller
disparities in April 2015. The Arabica fell by US$0.0493(3.08%) to
US$1.6495 while the Robusta fell by US$0.0066(0.68%) to
US$0.9873. Between April 2014 and April 2015 prices fell by
US$0.62(27.33%) and US$0.1195(10.80%) respectively. A bi-
annual comparison from April 2013 to April 2015 shows total price
The Private Sector Organization of Jamaica, Carlton Alexander Building, 39 Hope Road Kingston 10 Jamaica Tel (927-6238) Fax (927 5137)
13
April 2015 Issue
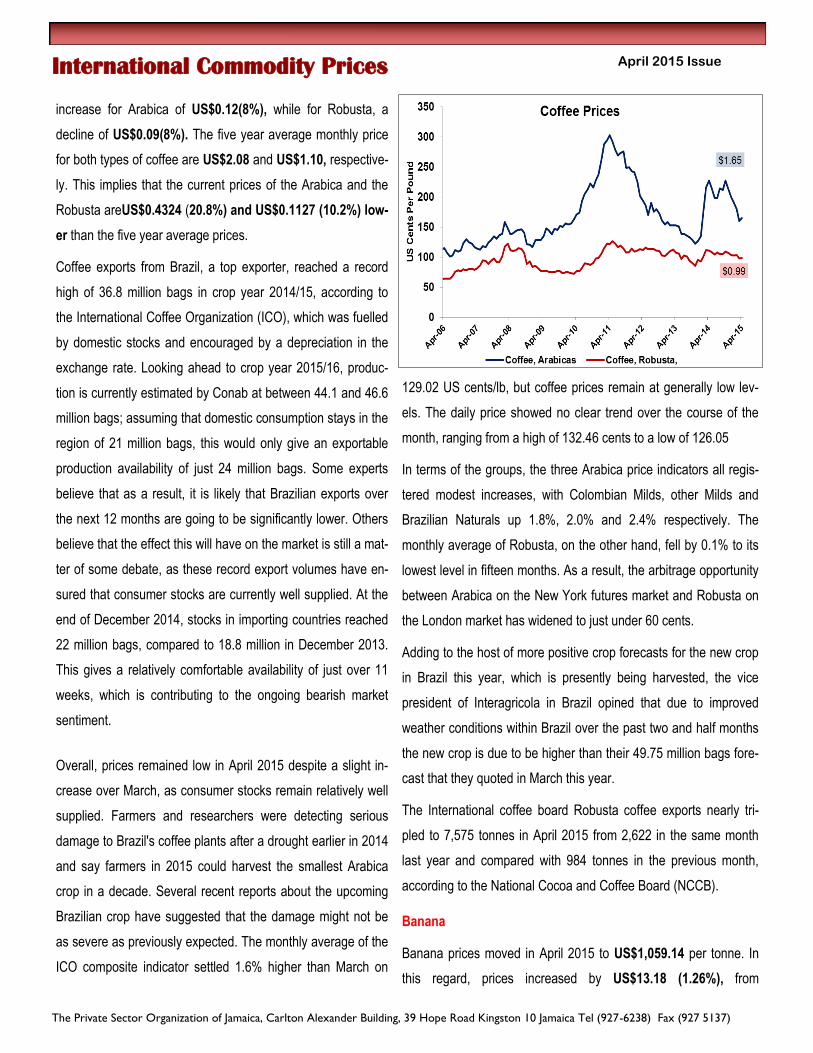
increase for Arabica of US$0.12(8%), while for Robusta, a
decline of US$0.09(8%). The five year average monthly price
for both types of coffee are US$2.08 and US$1.10, respective-
ly. This implies that the current prices of the Arabica and the
Robusta areUS$0.4324 (20.8%) and US$0.1127 (10.2%) low-
er than the five year average prices.
Coffee exports from Brazil, a top exporter, reached a record
high of 36.8 million bags in crop year 2014/15, according to
the International Coffee Organization (ICO), which was fuelled
by domestic stocks and encouraged by a depreciation in the
exchange rate. Looking ahead to crop year 2015/16, produc-
tion is currently estimated by Conab at between 44.1 and 46.6
million bags; assuming that domestic consumption stays in the
region of 21 million bags, this would only give an exportable
production availability of just 24 million bags. Some experts
believe that as a result, it is likely that Brazilian exports over
the next 12 months are going to be significantly lower. Others
believe that the effect this will have on the market is still a mat-
ter of some debate, as these record export volumes have en-
sured that consumer stocks are currently well supplied. At the
end of December 2014, stocks in importing countries reached
22 million bags, compared to 18.8 million in December 2013.
This gives a relatively comfortable availability of just over 11
weeks, which is contributing to the ongoing bearish market
sentiment.
Overall, prices remained low in April 2015 despite a slight in-
crease over March, as consumer stocks remain relatively well
supplied. Farmers and researchers were detecting serious
damage to Brazil's coffee plants after a drought earlier in 2014
and say farmers in 2015 could harvest the smallest Arabica
crop in a decade. Several recent reports about the upcoming
Brazilian crop have suggested that the damage might not be
as severe as previously expected. The monthly average of the
ICO composite indicator settled 1.6% higher than March on
129.02 US cents/lb, but coffee prices remain at generally low lev-
els. The daily price showed no clear trend over the course of the
month, ranging from a high of 132.46 cents to a low of 126.05
In terms of the groups, the three Arabica price indicators all regis-
tered modest increases, with Colombian Milds, other Milds and
Brazilian Naturals up 1.8%, 2.0% and 2.4% respectively. The
monthly average of Robusta, on the other hand, fell by 0.1% to its
lowest level in fifteen months. As a result, the arbitrage opportunity
between Arabica on the New York futures market and Robusta on
the London market has widened to just under 60 cents.
Adding to the host of more positive crop forecasts for the new crop
in Brazil this year, which is presently being harvested, the vice
president of Interagricola in Brazil opined that due to improved
weather conditions within Brazil over the past two and half months
the new crop is due to be higher than their 49.75 million bags fore-
cast that they quoted in March this year.
The International coffee board Robusta coffee exports nearly tri-
pled to 7,575 tonnes in April 2015 from 2,622 in the same month
last year and compared with 984 tonnes in the previous month,
according to the National Cocoa and Coffee Board (NCCB).
Banana
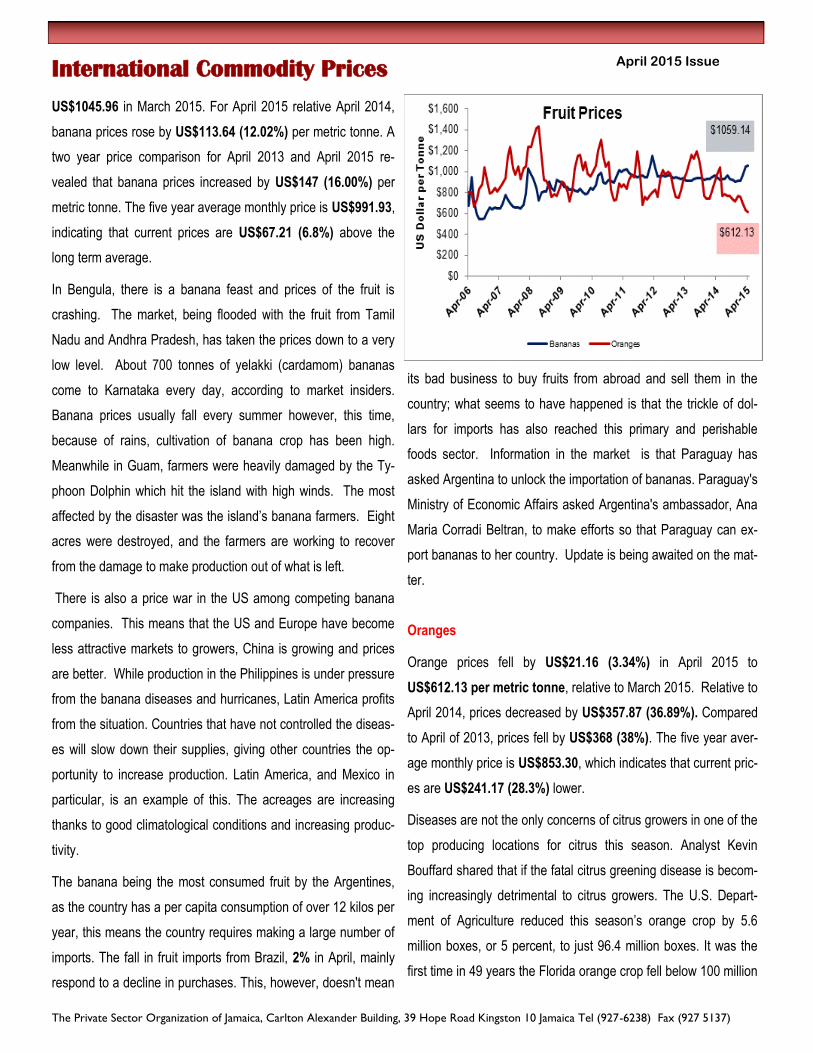
Banana prices moved in April 2015 to US$1,059.14 per tonne. In
this regard, prices increased by US$13.18 (1.26%), from
International Commodity Prices
The Private Sector Organization of Jamaica, Carlton Alexander Building, 39 Hope Road Kingston 10 Jamaica Tel (927-6238) Fax (927 5137)
14
April 2015 Issue
US$1045.96 in March 2015. For April 2015 relative April 2014,
banana prices rose by US$113.64 (12.02%) per metric tonne. A
two year price comparison for April 2013 and April 2015 re-
vealed that banana prices increased by US$147 (16.00%) per
metric tonne. The five year average monthly price is US$991.93,
indicating that current prices are US$67.21 (6.8%) above the
long term average.
In Bengula, there is a banana feast and prices of the fruit is
crashing. The market, being flooded with the fruit from Tamil
Nadu and Andhra Pradesh, has taken the prices down to a very
low level. About 700 tonnes of yelakki (cardamom) bananas
come to Karnataka every day, according to market insiders.
Banana prices usually fall every summer however, this time,
because of rains, cultivation of banana crop has been high.
Meanwhile in Guam, farmers were heavily damaged by the Ty-
phoon Dolphin which hit the island with high winds. The most
affected by the disaster was the island’s banana farmers. Eight
acres were destroyed, and the farmers are working to recover
from the damage to make production out of what is left.
There is also a price war in the US among competing banana
companies. This means that the US and Europe have become
less attractive markets to growers, China is growing and prices
are better. While production in the Philippines is under pressure
from the banana diseases and hurricanes, Latin America profits
from the situation. Countries that have not controlled the diseas-
es will slow down their supplies, giving other countries the op-
portunity to increase production. Latin America, and Mexico in
particular, is an example of this. The acreages are increasing
thanks to good climatological conditions and increasing produc-
tivity.
The banana being the most consumed fruit by the Argentines,
as the country has a per capita consumption of over 12 kilos per
year, this means the country requires making a large number of
imports. The fall in fruit imports from Brazil, 2% in April, mainly
respond to a decline in purchases. This, however, doesn't mean
International Commodity Prices
its bad business to buy fruits from abroad and sell them in the
country; what seems to have happened is that the trickle of dol-
lars for imports has also reached this primary and perishable
foods sector. Information in the market is that Paraguay has
asked Argentina to unlock the importation of bananas. Paraguay's
Ministry of Economic Affairs asked Argentina's ambassador, Ana
Maria Corradi Beltran, to make efforts so that Paraguay can ex-
port bananas to her country. Update is being awaited on the mat-
ter.
Oranges
Orange prices fell by US$21.16 (3.34%) in April 2015 to
US$612.13 per metric tonne, relative to March 2015. Relative to
April 2014, prices decreased by US$357.87 (36.89%). Compared
to April of 2013, prices fell by US$368 (38%). The five year aver-
age monthly price is US$853.30, which indicates that current pric-
es are US$241.17 (28.3%) lower.
Diseases are not the only concerns of citrus growers in one of the
top producing locations for citrus this season. Analyst Kevin
Bouffard shared that if the fatal citrus greening disease is becom-
ing increasingly detrimental to citrus growers. The U.S. Depart-
ment of Agriculture reduced this season’s orange crop by 5.6
million boxes, or 5 percent, to just 96.4 million boxes. It was the
first time in 49 years the Florida orange crop fell below 100 million
The Private Sector Organization of Jamaica, Carlton Alexander Building, 39 Hope Road Kingston 10 Jamaica Tel (927-6238) Fax (927 5137)
15
April 2015 Issue
boxes and the lowest total since 1964-65. Consumers are also con-
cerned as they might be struck with higher prices.
The production decline came entirely in the Valencia orange crop,
harvested from March to June, which sank by 6 million boxes to 49
million boxes, down 11 percent, according to the USDA crop update.
It added 400,000 boxes to the early and mid-season orange harvest,
which ended in March, based on deliveries to Florida juice pro-
cessing plants, which buy 95 percent of the state’s oranges.
The U.S. Department of Agriculture (USDA) on Tuesday said its esti-
mate of the 2014-2015 Florida orange crops decreased 5.6 million
boxes to 96.4 million. Early-mid varieties increased slightly to 47.4
million boxes while Valencia oranges dipped 6 million boxes to 49
million. With the projected decreases in production, consumers are
now expecting large upward price swings.
International Commodity Prices
Beef
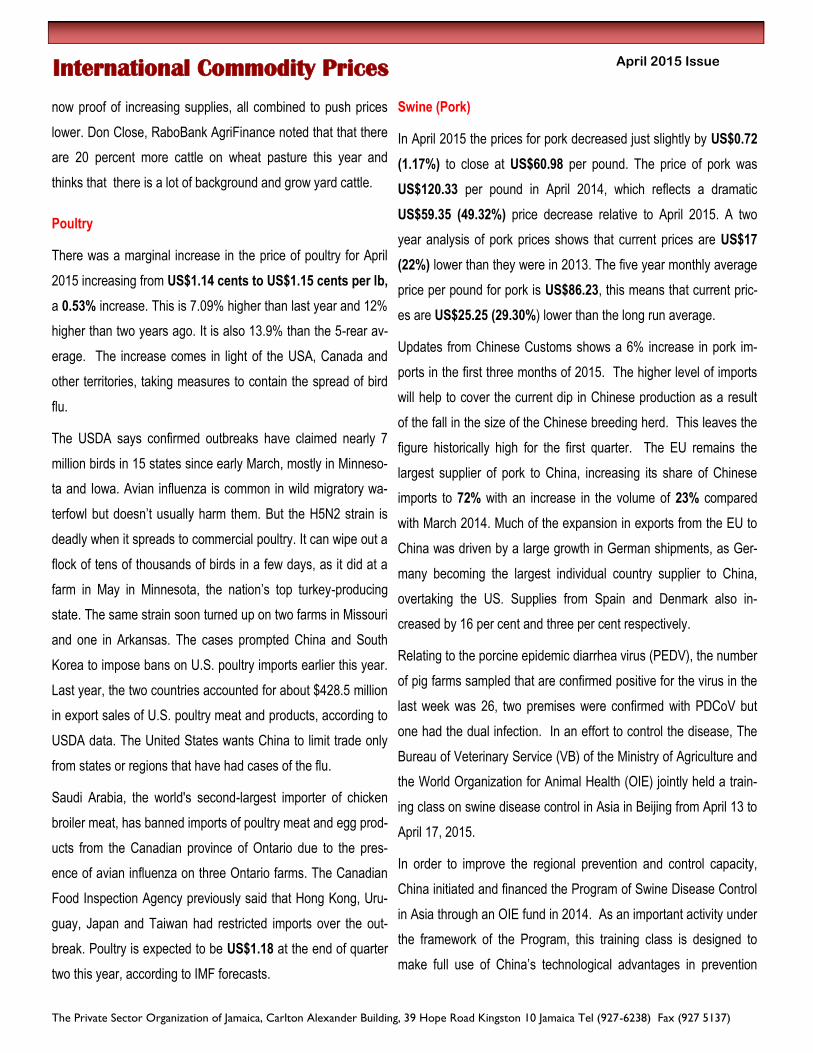
In April 2015, beef prices fell to US$2.14 per pound, a re-
duction of US$0.07 (3.19%) relative to March 2015. Rela-
tive to April of 2014, current prices are US$0.23 or 12.02%
higher. A look at the April 2013 reveals that current prices
are US$0.23 (12%) higher. The five year average monthly
price is US$1.97 which tells us that current prices are
US$0.18 (9.1%) higher than the long term average.
The weather seems to be in farmers’ favor in the beef mar-
ket for the crop year 2014/2015. The wettest winter since
2007 has ranchers in Texas optimistic about spring. That's
because improving pastures are helping producers add
cows in Texas and across the country. The latest cattle in-
ventory report showed cattlemen and women added 600
thousand heads in 2014, with states like Texas growing
herds by 7 percent. "We know rain makes hay, rain makes
grain and we know the industry is responding with expan-
sion" says Art Wagner, VP Cattle Procurement, and National
Beef Packing. Tight supplies have made the last couple of
years difficult to manage. Be it stocker operators, feed yards
or packers that scarcity of supply made for record prices in
2014. However, since the first of the year, a mild winter,
rising dollar values, slow-downs at West Coast Ports and
The Private Sector Organization of Jamaica, Carlton Alexander Building, 39 Hope Road Kingston 10 Jamaica Tel (927-6238) Fax (927 5137)
16
April 2015 Issue
now proof of increasing supplies, all combined to push prices
lower. Don Close, RaboBank AgriFinance noted that that there
are 20 percent more cattle on wheat pasture this year and
thinks that there is a lot of background and grow yard cattle.
Poultry
There was a marginal increase in the price of poultry for April
2015 increasing from US$1.14 cents to US$1.15 cents per lb,
a 0.53% increase. This is 7.09% higher than last year and 12%
higher than two years ago. It is also 13.9% than the 5-rear av-
erage. The increase comes in light of the USA, Canada and
other territories, taking measures to contain the spread of bird
flu.
The USDA says confirmed outbreaks have claimed nearly 7
million birds in 15 states since early March, mostly in Minneso-
ta and Iowa. Avian influenza is common in wild migratory wa-
terfowl but doesn’t usually harm them. But the H5N2 strain is
deadly when it spreads to commercial poultry. It can wipe out a
flock of tens of thousands of birds in a few days, as it did at a
farm in May in Minnesota, the nation’s top turkey-producing
state. The same strain soon turned up on two farms in Missouri
and one in Arkansas. The cases prompted China and South
Korea to impose bans on U.S. poultry imports earlier this year.
Last year, the two countries accounted for about $428.5 million
in export sales of U.S. poultry meat and products, according to
USDA data. The United States wants China to limit trade only
from states or regions that have had cases of the flu.
Saudi Arabia, the world's second-largest importer of chicken
broiler meat, has banned imports of poultry meat and egg prod-
ucts from the Canadian province of Ontario due to the pres-
ence of avian influenza on three Ontario farms. The Canadian
Food Inspection Agency previously said that Hong Kong, Uru-
guay, Japan and Taiwan had restricted imports over the out-
break. Poultry is expected to be US$1.18 at the end of quarter
two this year, according to IMF forecasts.
Swine (Pork)
In April 2015 the prices for pork decreased just slightly by US$0.72
(1.17%) to close at US$60.98 per pound. The price of pork was
US$120.33 per pound in April 2014, which reflects a dramatic
US$59.35 (49.32%) price decrease relative to April 2015. A two
year analysis of pork prices shows that current prices are US$17
(22%) lower than they were in 2013. The five year monthly average
price per pound for pork is US$86.23, this means that current pric-
es are US$25.25 (29.30%) lower than the long run average.
Updates from Chinese Customs shows a 6% increase in pork im-
ports in the first three months of 2015. The higher level of imports
will help to cover the current dip in Chinese production as a result
of the fall in the size of the Chinese breeding herd. This leaves the
figure historically high for the first quarter. The EU remains the
largest supplier of pork to China, increasing its share of Chinese
imports to 72% with an increase in the volume of 23% compared
with March 2014. Much of the expansion in exports from the EU to
China was driven by a large growth in German shipments, as Ger-
many becoming the largest individual country supplier to China,
overtaking the US. Supplies from Spain and Denmark also in-
creased by 16 per cent and three per cent respectively.
Relating to the porcine epidemic diarrhea virus (PEDV), the number
of pig farms sampled that are confirmed positive for the virus in the
last week was 26, two premises were confirmed with PDCoV but
one had the dual infection. In an effort to control the disease, The
Bureau of Veterinary Service (VB) of the Ministry of Agriculture and
the World Organization for Animal Health (OIE) jointly held a train-
ing class on swine disease control in Asia in Beijing from April 13 to
April 17, 2015.
In order to improve the regional prevention and control capacity,
China initiated and financed the Program of Swine Disease Control
in Asia through an OIE fund in 2014. As an important activity under
the framework of the Program, this training class is designed to
make full use of China’s technological advantages in prevention
International Commodity Prices
The Private Sector Organization of Jamaica, Carlton Alexander Building, 39 Hope Road Kingston 10 Jamaica Tel (927-6238) Fax (927 5137)
17
April 2015 Issue
and control of such swine diseases as highly pathogenic por-
cine reproductive and respiratory syndrome (PRRS) and foot-
and-mouth disease (FMD), and enhance the diagnostic capac-
ity of laboratories within the region, in a bid to lay a foundation
for progressive control of major swine diseases.
Aluminum
Aluminum prices fell by US$45.32 (2.56%) per tonne and
closed April 2015 at US$1819.13per tonne. Relative to April
2014, prices increased by US$8.51 (0.47%) per tonne. Rela-
tive to April 2013, prices fell by US$42(2%).The five year aver-
age monthly price for aluminum is US$2026.03 per tonne; this
means that current prices are US$252.17 (12.4%) lower.
Premiums offered for aluminium imported into Brazil have fall-
en as much as $20 per tonne on the lower end of the range,
while domestic premiums remained stable amidst a still weak
demand. Analysts said the rise in aluminium prices in futures
trade was mostly attributed to a firming trend in industrial met-
als at the London Metal Exchange (LME) as manufacturing
data from China, the world's biggest consumer, signaled the
first improvement in three months.
Sucden quarterly metals report describes Aluminium as trying
to rally at the start of 2015 but stalled, with prices falling below
$1,800 per tonne again, but it found support at $1,745. The
contrived tightness in aluminium is showing signs of flounder-
ing - premiums are falling and availability has increased. Tight-
er spreads on the LME have made it harder to roll over expir-
ing financing deals, which have boosted availability. Currency
weakness, weak domestic demand in the likes of Russia and
over-production in China have also bolstered these countries’
efforts to export metal, which in turn has weighed on premiums
and sentiment. There is little to be bullish about unless produc-
tion cuts are made.
International Commodity Prices

The Private Sector Organization of Jamaica, Carlton Alexander Building, 39 Hope Road Kingston 10 Jamaica Tel (927-6238) Fax (927 5137)
18
April 2015 Issue

The Private Sector Organization of Jamaica, Carlton Alexander Building, 39 Hope Road Kingston 10 Jamaica Tel (927-6238) Fax (927 5137)
19
April 2015 Issue International Commodity Prices
Impact of global prices on Jamaica
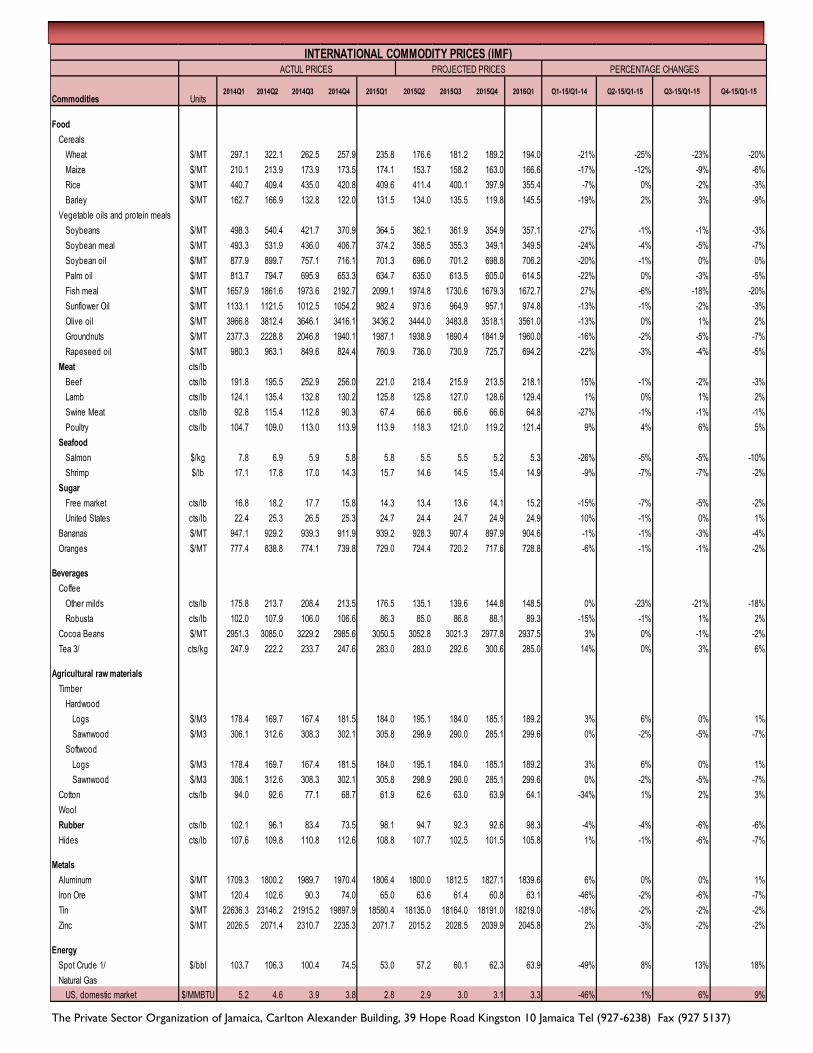
There were prices increases in 53% of the commodities
monitored for April 2015. The price of both crude oil indices
increased following reductions in March 2015. The Brent
and the WTI increased by 6.4% and 13.4%, respectively.
On the other hand, natural gas fell 7.9%. The IMF’s Fuel
Energy Index increased by 4.5%, the Food and Beverage
Index fell by 0.7%. The unsettled market for fuel energy,
will show periods of small spikes in prices, the price of the
WTI is expected to move up to the projected US$60.00 -
US$65.00 per bbl. by June 2015. This rise in fuel price is
expected to be short lived as the normal cyclic movements
and should cause prices to fall or stabilize in the later part
of the year. The projections on food prices show that they
will decline towards the end of 2015 (see table page 20).
To this end, the domestic inflation should continue to be
moderated by both local food production and international
food prices.
The graph to the right shows the relationship between
movements in commodity prices and movements in do-
mestic inflation. The upward movements in the internation-
al price indices for April along with local price increases
should be observed in Jamaica around end-June 2015. In
addition, inflation of 0.3% for April 2015 would have been
influenced by the price movements in February 2015.
The adjusted forecast by the BOJ is for inflation to fall in
the range of 5.5% to 7.5% in the 2015 fiscal year. The
PSOJ sees significant risks from exchange rate move-
ments, domestic agricultural production and wage increas-
es, higher taxes and money growth. In this regard, the
PSOJ’s adjusted forecast is for inflation to fall between 3%
and 6% will remain until end of October 2015. Weather
conditions, fuel prices are the biggest risk to these projec-
tions.
Commodities Unit Price Price Monthly Change
Apr-15 Mar-14 Per cent
Aluminum Metric ton 1819.19 1773.86 2.6%
Bananas Metric ton 1059.14 1045.96 1.3%
Beef Pound 214.43 207.80 3.2%
Cocoa beans Metric ton 2868.27 2878.03 -0.3%
Coffee- Arabicas Pound 164.95 160.02 3.1%
Coffee- Robusta Pound 98.73 98.07 0.7%
Maize (corn) Metric ton 172.05 174.23 -1.2%
Natural Gas MMBTU 2.58 2.80 -7.9%
Dated Brent Crude Barrel 59.39 55.79 6.4%
Crude W TI Barrel 54.20 47.78 13.4%
Oranges Metric ton 612.13 633.29 -3.3%
Swine (pork) Pound 60.98 61.71 -1.2%
Poultry Pound 114.88 114.27 0.5%
Rice Metric ton 392.41 400.73 -2.1%
Soybean Meal Metric ton 349.71 364.86 -4.2%
Soybean Oil Metric ton 691.67 683.43 1.2%
Sugar- Free Market Pound 12.91 12.84 0.5%
Sugar- US Import Pound 24.39 24.40 0.0%
Wheat Metric ton 223.34 230.83 -3.2%
The Private Sector Organization of Jamaica, Carlton Alexander Building, 39 Hope Road Kingston 10 Jamaica Tel (927-6238) Fax (927 5137)
20
April 2015 Issue
Commodities Units2014Q1 2014Q2 2014Q3 2014Q4 2015Q1 2015Q2 2015Q3 2015Q4 2016Q1 Q1-15/Q1-14 Q2-15/Q1-15 Q3-15/Q1-15 Q4-15/Q1-15
Food
Cereals
Wheat $/MT 297.1 322.1 262.5 257.9 235.8 176.6 181.2 189.2 194.0 -21% -25% -23% -20%
Maize $/MT 210.1 213.9 173.9 173.5 174.1 153.7 158.2 163.0 166.6 -17% -12% -9% -6%
Rice $/MT 440.7 409.4 435.0 420.8 409.6 411.4 400.1 397.9 355.4 -7% 0% -2% -3%
Barley $/MT 162.7 166.9 132.8 122.0 131.5 134.0 135.5 119.8 145.5 -19% 2% 3% -9%
Vegetable oils and protein meals
Soybeans $/MT 498.3 540.4 421.7 370.9 364.5 362.1 361.9 354.9 357.1 -27% -1% -1% -3%
Soybean meal $/MT 493.3 531.9 436.0 406.7 374.2 358.5 355.3 349.1 349.5 -24% -4% -5% -7%
Soybean oil $/MT 877.9 899.7 757.1 716.1 701.3 696.0 701.2 698.8 706.2 -20% -1% 0% 0%
Palm oil $/MT 813.7 794.7 695.9 653.3 634.7 635.0 613.5 605.0 614.5 -22% 0% -3% -5%
Fish meal $/MT 1657.9 1861.6 1973.6 2192.7 2099.1 1974.8 1730.6 1679.3 1672.7 27% -6% -18% -20%
Sunflower Oil $/MT 1133.1 1121.5 1012.5 1054.2 982.4 973.6 964.9 957.1 974.8 -13% -1% -2% -3%
Olive oil $/MT 3966.8 3812.4 3646.1 3416.1 3436.2 3444.0 3483.8 3518.1 3561.0 -13% 0% 1% 2%
Groundnuts $/MT 2377.3 2228.8 2046.8 1940.1 1987.1 1938.9 1890.4 1841.9 1960.0 -16% -2% -5% -7%
Rapeseed oil $/MT 980.3 963.1 849.6 824.4 760.9 736.0 730.9 725.7 694.2 -22% -3% -4% -5%
Meat cts/lb
Beef cts/lb 191.8 195.5 252.9 256.0 221.0 218.4 215.9 213.5 218.1 15% -1% -2% -3%
Lamb cts/lb 124.1 135.4 132.8 130.2 125.8 125.8 127.0 128.6 129.4 1% 0% 1% 2%
Swine Meat cts/lb 92.8 115.4 112.8 90.3 67.4 66.6 66.6 66.6 64.8 -27% -1% -1% -1%
Poultry cts/lb 104.7 109.0 113.0 113.9 113.9 118.3 121.0 119.2 121.4 9% 4% 6% 5%
Seafood
Salmon $/kg 7.8 6.9 5.9 5.8 5.8 5.5 5.5 5.2 5.3 -26% -5% -5% -10%
Shrimp $/lb 17.1 17.8 17.0 14.3 15.7 14.6 14.5 15.4 14.9 -9% -7% -7% -2%
Sugar
Free market cts/lb 16.8 18.2 17.7 15.8 14.3 13.4 13.6 14.1 15.2 -15% -7% -5% -2%
United States cts/lb 22.4 25.3 26.5 25.3 24.7 24.4 24.7 24.9 24.9 10% -1% 0% 1%
Bananas $/MT 947.1 929.2 939.3 911.9 939.2 928.3 907.4 897.9 904.6 -1% -1% -3% -4%
Oranges $/MT 777.4 838.8 774.1 739.8 729.0 724.4 720.2 717.6 728.8 -6% -1% -1% -2%
Beverages
Coffee
Other milds cts/lb 175.8 213.7 208.4 213.5 176.5 135.1 139.6 144.8 148.5 0% -23% -21% -18%
Robusta cts/lb 102.0 107.9 106.0 106.6 86.3 85.0 86.8 88.1 89.3 -15% -1% 1% 2%
Cocoa Beans $/MT 2951.3 3085.0 3229.2 2985.6 3050.5 3052.8 3021.3 2977.8 2937.5 3% 0% -1% -2%
Tea 3/ cts/kg 247.9 222.2 233.7 247.6 283.0 283.0 292.6 300.6 285.0 14% 0% 3% 6%
Agricultural raw materials
Timber
Hardwood
Logs $/M3 178.4 169.7 167.4 181.5 184.0 195.1 184.0 185.1 189.2 3% 6% 0% 1%
Sawnwood $/M3 306.1 312.6 308.3 302.1 305.8 298.9 290.0 285.1 299.6 0% -2% -5% -7%
Softwood
Logs $/M3 178.4 169.7 167.4 181.5 184.0 195.1 184.0 185.1 189.2 3% 6% 0% 1%
Sawnwood $/M3 306.1 312.6 308.3 302.1 305.8 298.9 290.0 285.1 299.6 0% -2% -5% -7%
Cotton cts/lb 94.0 92.6 77.1 68.7 61.9 62.6 63.0 63.9 64.1 -34% 1% 2% 3%
Wool
Rubber cts/lb 102.1 96.1 83.4 73.5 98.1 94.7 92.3 92.6 98.3 -4% -4% -6% -6%
Hides cts/lb 107.6 109.8 110.8 112.6 108.8 107.7 102.5 101.5 105.8 1% -1% -6% -7%
Metals
Aluminum $/MT 1709.3 1800.2 1989.7 1970.4 1806.4 1800.0 1812.5 1827.1 1839.6 6% 0% 0% 1%
Iron Ore $/MT 120.4 102.6 90.3 74.0 65.0 63.6 61.4 60.8 63.1 -46% -2% -6% -7%
Tin $/MT 22636.3 23146.2 21915.2 19897.9 18580.4 18135.0 18164.0 18191.0 18219.0 -18% -2% -2% -2%
Zinc $/MT 2026.5 2071.4 2310.7 2235.3 2071.7 2015.2 2028.5 2039.9 2045.8 2% -3% -2% -2%
Energy
Spot Crude 1/ $/bbl 103.7 106.3 100.4 74.5 53.0 57.2 60.1 62.3 63.9 -49% 8% 13% 18%
Natural Gas
US, domestic market $/MMBTU 5.2 4.6 3.9 3.8 2.8 2.9 3.0 3.1 3.3 -46% 1% 6% 9%
PROJECTED PRICESACTUL PRICES
INTERNATIONAL COMMODITY PRICES (IMF)PERCENTAGE CHANGES
The Private Sector Organization of Jamaica, Carlton Alexander Building, 39 Hope Road Kingston 10 Jamaica Tel (927-6238) Fax (927 5137)
21
April 2015 Issue
Domestic Inflation Rate
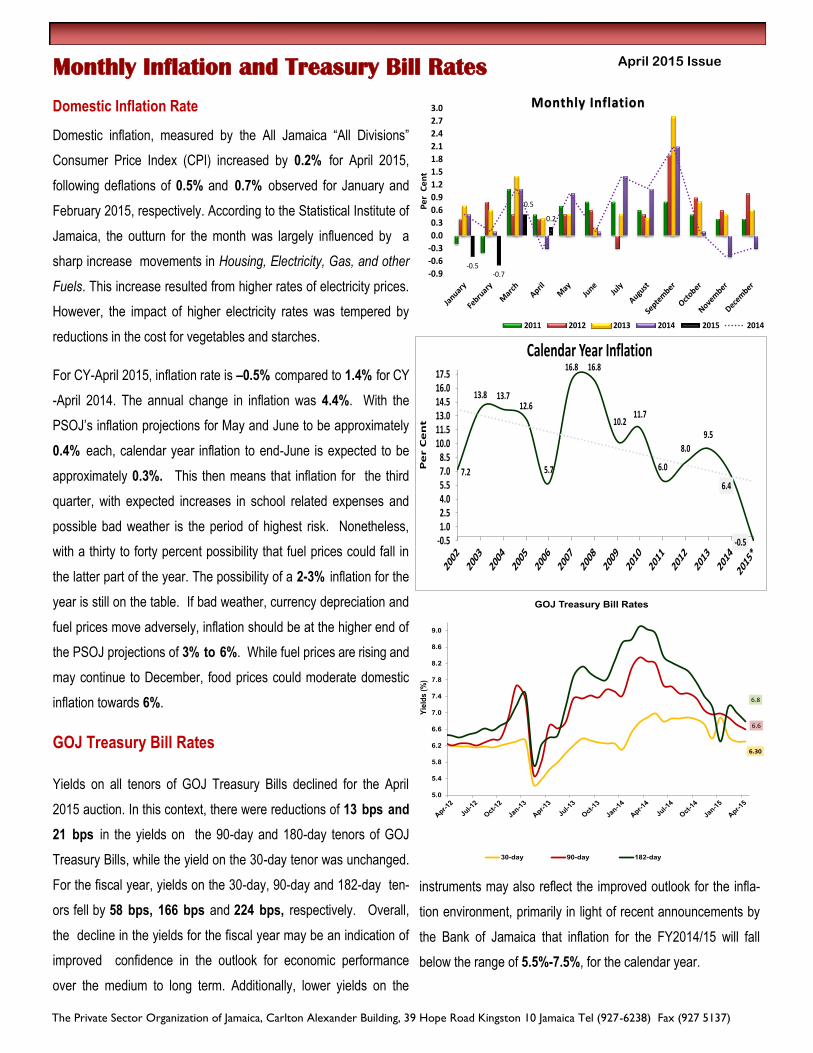
Domestic inflation, measured by the All Jamaica “All Divisions”
Consumer Price Index (CPI) increased by 0.2% for April 2015,
following deflations of 0.5% and 0.7% observed for January and
February 2015, respectively. According to the Statistical Institute of
Jamaica, the outturn for the month was largely influenced by a
sharp increase movements in Housing, Electricity, Gas, and other
Fuels. This increase resulted from higher rates of electricity prices.
However, the impact of higher electricity rates was tempered by
reductions in the cost for vegetables and starches.
For CY-April 2015, inflation rate is –0.5% compared to 1.4% for CY
-April 2014. The annual change in inflation was 4.4%. With the
PSOJ’s inflation projections for May and June to be approximately
0.4% each, calendar year inflation to end-June is expected to be
approximately 0.3%. This then means that inflation for the third
quarter, with expected increases in school related expenses and
possible bad weather is the period of highest risk. Nonetheless,
with a thirty to forty percent possibility that fuel prices could fall in
the latter part of the year. The possibility of a 2-3% inflation for the
year is still on the table. If bad weather, currency depreciation and
fuel prices move adversely, inflation should be at the higher end of
the PSOJ projections of 3% to 6%. While fuel prices are rising and
may continue to December, food prices could moderate domestic
inflation towards 6%.
GOJ Treasury Bill Rates
Yields on all tenors of GOJ Treasury Bills declined for the April
2015 auction. In this context, there were reductions of 13 bps and
21 bps in the yields on the 90-day and 180-day tenors of GOJ
Treasury Bills, while the yield on the 30-day tenor was unchanged.
For the fiscal year, yields on the 30-day, 90-day and 182-day ten-
ors fell by 58 bps, 166 bps and 224 bps, respectively. Overall,
the decline in the yields for the fiscal year may be an indication of
improved confidence in the outlook for economic performance
over the medium to long term. Additionally, lower yields on the
Monthly Inflation and Treasury Bill Rates
instruments may also reflect the improved outlook for the infla-
tion environment, primarily in light of recent announcements by
the Bank of Jamaica that inflation for the FY2014/15 will fall
below the range of 5.5%-7.5%, for the calendar year.
-0.5-0.7
0.5
0.2
-0.9
-0.6
-0.3
0.0
0.3
0.6
0.9
1.2
1.5
1.8
2.1
2.4
2.7
3.0
Pe
r C
en
t
Monthly Inflation
2011 2012 2013 2014 2015 2014
7.2
13.8 13.712.6
5.7
16.8 16.8
10.211.7
6.0
8.0
9.5
6.4
-0.5-0.51.02.54.05.57.08.5
10.011.513.014.516.017.5
Pe
r C
en
t
Calendar Year Inflation
6.30
6.6
6.8
5.0
5.4
5.8
6.2
6.6
7.0
7.4
7.8
8.2
8.6
9.0
Yie
lds (
%)
GOJ Treasury Bill Rates
30-day 90-day 182-day
The Private Sector Organization of Jamaica, Carlton Alexander Building, 39 Hope Road Kingston 10 Jamaica Tel (927-6238) Fax (927 5137)
22
April 2015 Issue
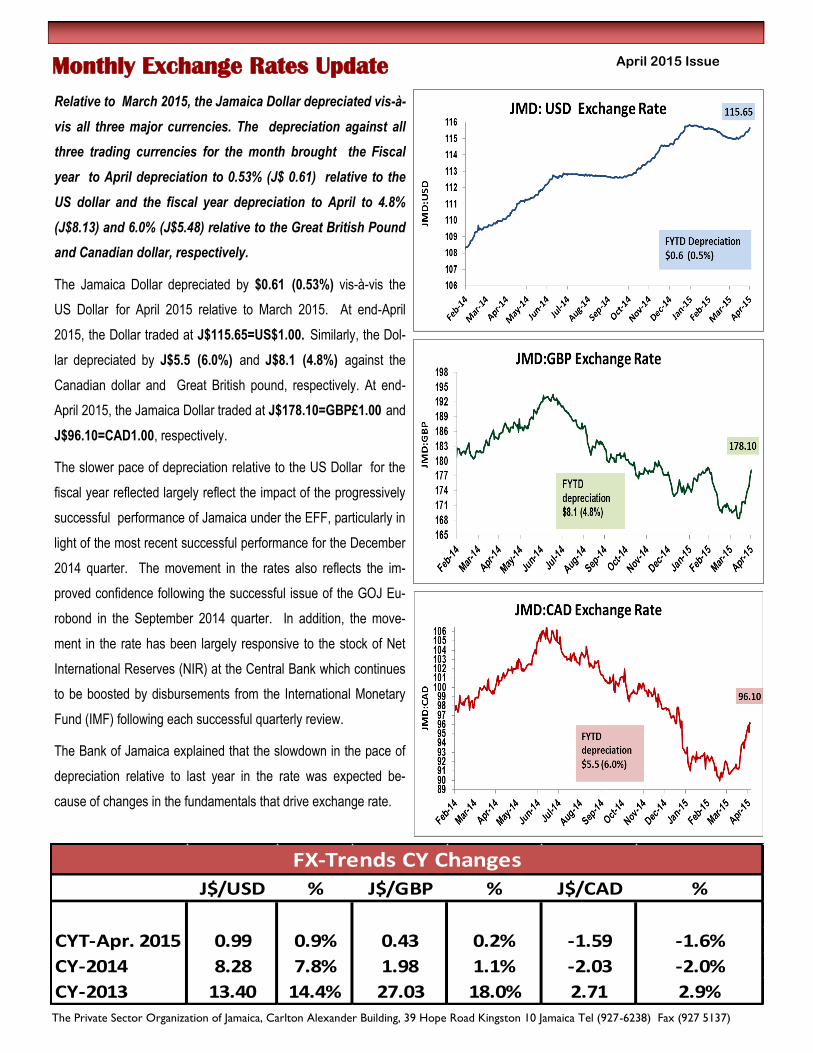
Relative to March 2015, the Jamaica Dollar depreciated vis-à-
vis all three major currencies. The depreciation against all
three trading currencies for the month brought the Fiscal
year to April depreciation to 0.53% (J$ 0.61) relative to the
US dollar and the fiscal year depreciation to April to 4.8%
(J$8.13) and 6.0% (J$5.48) relative to the Great British Pound
and Canadian dollar, respectively.
The Jamaica Dollar depreciated by $0.61 (0.53%) vis-à-vis the
US Dollar for April 2015 relative to March 2015. At end-April
2015, the Dollar traded at J$115.65=US$1.00. Similarly, the Dol-
lar depreciated by J$5.5 (6.0%) and J$8.1 (4.8%) against the
Canadian dollar and Great British pound, respectively. At end-
April 2015, the Jamaica Dollar traded at J$178.10=GBP£1.00 and
J$96.10=CAD1.00, respectively.
The slower pace of depreciation relative to the US Dollar for the
fiscal year reflected largely reflect the impact of the progressively
successful performance of Jamaica under the EFF, particularly in
light of the most recent successful performance for the December
2014 quarter. The movement in the rates also reflects the im-
proved confidence following the successful issue of the GOJ Eu-
robond in the September 2014 quarter. In addition, the move-
ment in the rate has been largely responsive to the stock of Net
International Reserves (NIR) at the Central Bank which continues
to be boosted by disbursements from the International Monetary
Fund (IMF) following each successful quarterly review.
The Bank of Jamaica explained that the slowdown in the pace of
depreciation relative to last year in the rate was expected be-
cause of changes in the fundamentals that drive exchange rate.
Monthly Exchange Rates Update
J$/USD % J$/GBP % J$/CAD %
CYT-Apr. 2015 0.99 0.9% 0.43 0.2% -1.59 -1.6%
CY-2014 8.28 7.8% 1.98 1.1% -2.03 -2.0%
CY-2013 13.40 14.4% 27.03 18.0% 2.71 2.9%
FX-Trends CY Changes

The Private Sector Organization of Jamaica, Carlton Alexander Building, 39 Hope Road Kingston 10 Jamaica Tel (927-6238) Fax (927 5137)
23
April 2015 Issue
Net International Reserves
At end April 2015, the stock of Net International Reserves
(NIR) at the Bank of Jamaica was J$254.52 billion
(US$2,392.56 million) reflecting an increase of J$10.52 bil-
lion (US$98.88 million) relative to the previous month. For
the month, the change in the NIR was largely due to an in-
crease of US$100.57 million in the external holdings of for-
eign assets which was partly offset by an increase of
US$1.69 million in liabilities to the IMF. At the end April
2015, the gross reserves at the Central Bank were sufficient
to finance 29.66 weeks of goods imports which represents
17.66 weeks over the international benchmark of 12 weeks
of goods imports.
Base Money
For April 2015, there was an expansion of J$2.04 billion
(1.98%) in the monetary base relative to the previous month.
This expansion resulted in an end-month stock of J$103.13
billion. The movement in the base mainly reflected net cur-
rency redemption of J$1.4 billion and an increase of
J$691.00 in commercial banks’ statutory cash reserves. This
was partially offset by a decline of $6.4 million in commer-
cial bank current account balances. The expansion in the
base resulted from an increase of J$254.52 billion in the
Net international Reserves (NIR) which was partially offset
by a decline of J$151.40 billion in the Net Domestic Assets
(NDA).
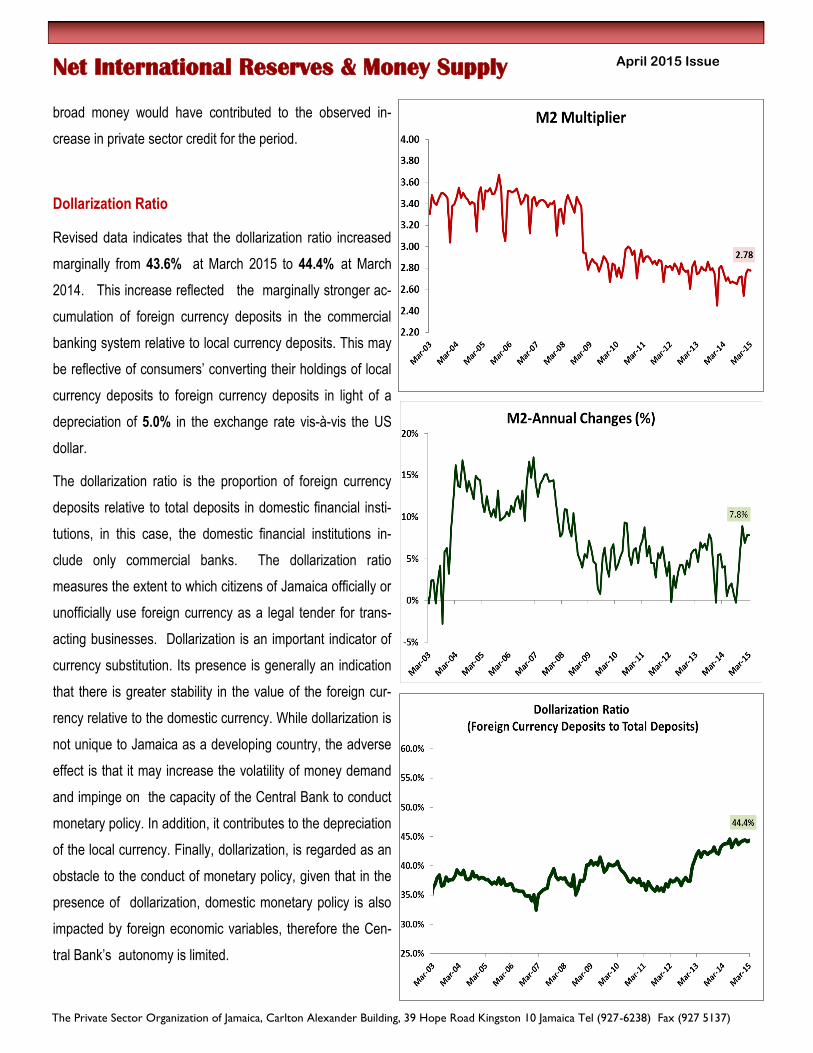
On an annual basis, the multiplier increased from 2.76 at
March 2014 to 2.78 at March 2015. For the same period, the
monetary base increased by J$6.65 billion (7.05%). Con-
sistent with the movements in the base and the multiplier,
money supply increased by J$20.44 billion (7.84%) for
March 2015 relative to 2014. The increase in the supply of
Net International Reserves & Money Supply
The Private Sector Organization of Jamaica, Carlton Alexander Building, 39 Hope Road Kingston 10 Jamaica Tel (927-6238) Fax (927 5137)
24
April 2015 Issue
broad money would have contributed to the observed in-
crease in private sector credit for the period.
Dollarization Ratio
Revised data indicates that the dollarization ratio increased
marginally from 43.6% at March 2015 to 44.4% at March
2014. This increase reflected the marginally stronger ac-
cumulation of foreign currency deposits in the commercial
banking system relative to local currency deposits. This may
be reflective of consumers’ converting their holdings of local
currency deposits to foreign currency deposits in light of a
depreciation of 5.0% in the exchange rate vis-à-vis the US
dollar.
The dollarization ratio is the proportion of foreign currency
deposits relative to total deposits in domestic financial insti-
tutions, in this case, the domestic financial institutions in-
clude only commercial banks. The dollarization ratio
measures the extent to which citizens of Jamaica officially or
unofficially use foreign currency as a legal tender for trans-
acting businesses. Dollarization is an important indicator of
currency substitution. Its presence is generally an indication
that there is greater stability in the value of the foreign cur-
rency relative to the domestic currency. While dollarization is
not unique to Jamaica as a developing country, the adverse
effect is that it may increase the volatility of money demand
and impinge on the capacity of the Central Bank to conduct
monetary policy. In addition, it contributes to the depreciation
of the local currency. Finally, dollarization, is regarded as an
obstacle to the conduct of monetary policy, given that in the
presence of dollarization, domestic monetary policy is also
impacted by foreign economic variables, therefore the Cen-
tral Bank’s autonomy is limited.
Net International Reserves & Money Supply
The Private Sector Organization of Jamaica, Carlton Alexander Building, 39 Hope Road Kingston 10 Jamaica Tel (927-6238) Fax (927 5137)
25
April 2015 Issue
Commercial Bank Interest Rates
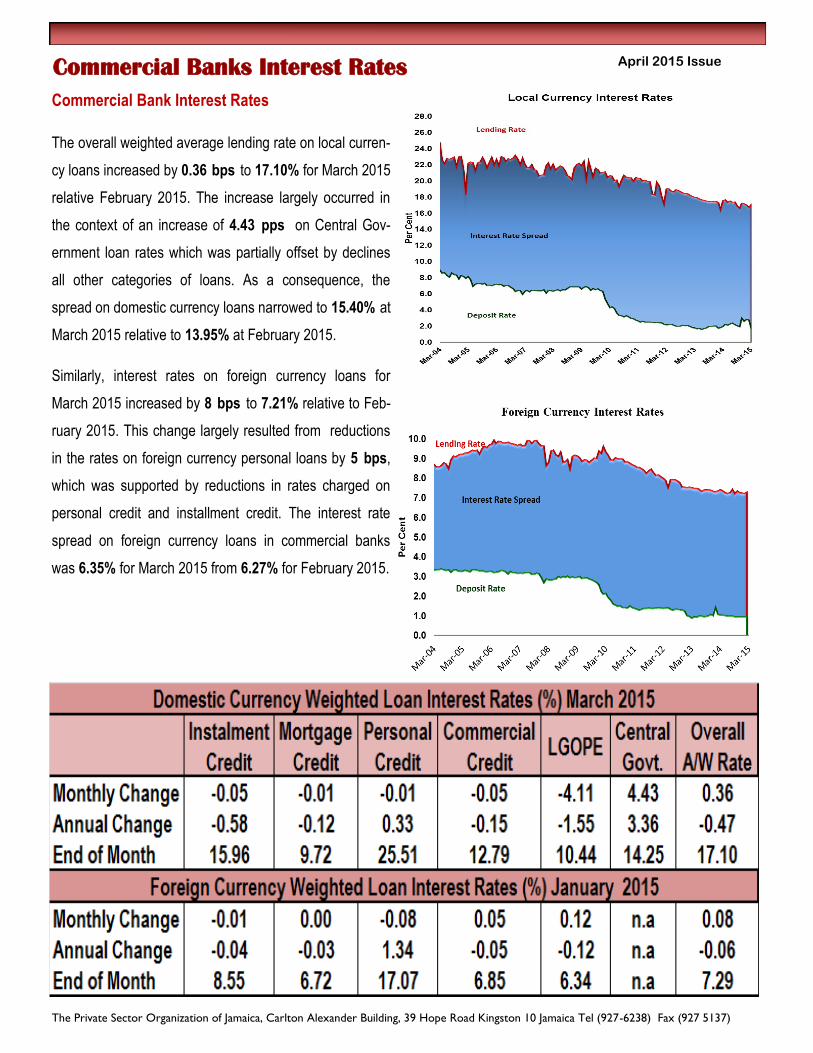
The overall weighted average lending rate on local curren-
cy loans increased by 0.36 bps to 17.10% for March 2015
relative February 2015. The increase largely occurred in
the context of an increase of 4.43 pps on Central Gov-
ernment loan rates which was partially offset by declines
all other categories of loans. As a consequence, the
spread on domestic currency loans narrowed to 15.40% at
March 2015 relative to 13.95% at February 2015.
Similarly, interest rates on foreign currency loans for
March 2015 increased by 8 bps to 7.21% relative to Feb-
ruary 2015. This change largely resulted from reductions
in the rates on foreign currency personal loans by 5 bps,
which was supported by reductions in rates charged on
personal credit and installment credit. The interest rate
spread on foreign currency loans in commercial banks
was 6.35% for March 2015 from 6.27% for February 2015.
Commercial Banks Interest Rates
The Private Sector Organization of Jamaica, Carlton Alexander Building, 39 Hope Road Kingston 10 Jamaica Tel (927-6238) Fax (927 5137)
26
April 2015 Issue Tourist Arrivals
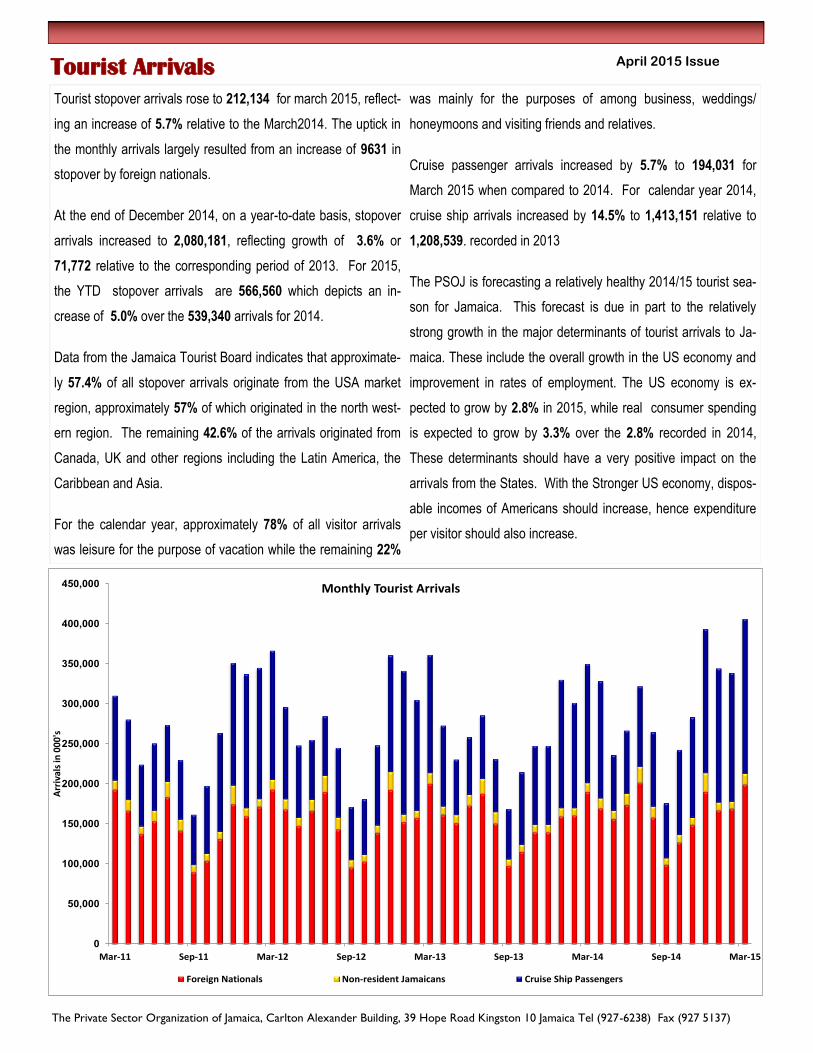
Tourist stopover arrivals rose to 212,134 for march 2015, reflect-
ing an increase of 5.7% relative to the March2014. The uptick in
the monthly arrivals largely resulted from an increase of 9631 in
stopover by foreign nationals.
At the end of December 2014, on a year-to-date basis, stopover
arrivals increased to 2,080,181, reflecting growth of 3.6% or
71,772 relative to the corresponding period of 2013. For 2015,
the YTD stopover arrivals are 566,560 which depicts an in-
crease of 5.0% over the 539,340 arrivals for 2014.
Data from the Jamaica Tourist Board indicates that approximate-
ly 57.4% of all stopover arrivals originate from the USA market
region, approximately 57% of which originated in the north west-
ern region. The remaining 42.6% of the arrivals originated from
Canada, UK and other regions including the Latin America, the
Caribbean and Asia.
For the calendar year, approximately 78% of all visitor arrivals
was leisure for the purpose of vacation while the remaining 22%
was mainly for the purposes of among business, weddings/
honeymoons and visiting friends and relatives.
Cruise passenger arrivals increased by 5.7% to 194,031 for
March 2015 when compared to 2014. For calendar year 2014,
cruise ship arrivals increased by 14.5% to 1,413,151 relative to
1,208,539. recorded in 2013
The PSOJ is forecasting a relatively healthy 2014/15 tourist sea-
son for Jamaica. This forecast is due in part to the relatively
strong growth in the major determinants of tourist arrivals to Ja-
maica. These include the overall growth in the US economy and
improvement in rates of employment. The US economy is ex-
pected to grow by 2.8% in 2015, while real consumer spending
is expected to grow by 3.3% over the 2.8% recorded in 2014,
These determinants should have a very positive impact on the
arrivals from the States. With the Stronger US economy, dispos-
able incomes of Americans should increase, hence expenditure
per visitor should also increase.
0
50,000
100,000
150,000
200,000
250,000
300,000
350,000
400,000
450,000
Mar-11 Sep-11 Mar-12 Sep-12 Mar-13 Sep-13 Mar-14 Sep-14 Mar-15
Arr
ival
s in
000
's
Monthly Tourist Arrivals
Foreign Nationals Non-resident Jamaicans Cruise Ship Passengers
The Private Sector Organization of Jamaica, Carlton Alexander Building, 39 Hope Road Kingston 10 Jamaica Tel (927-6238) Fax (927 5137)
27
April 2015 Issue
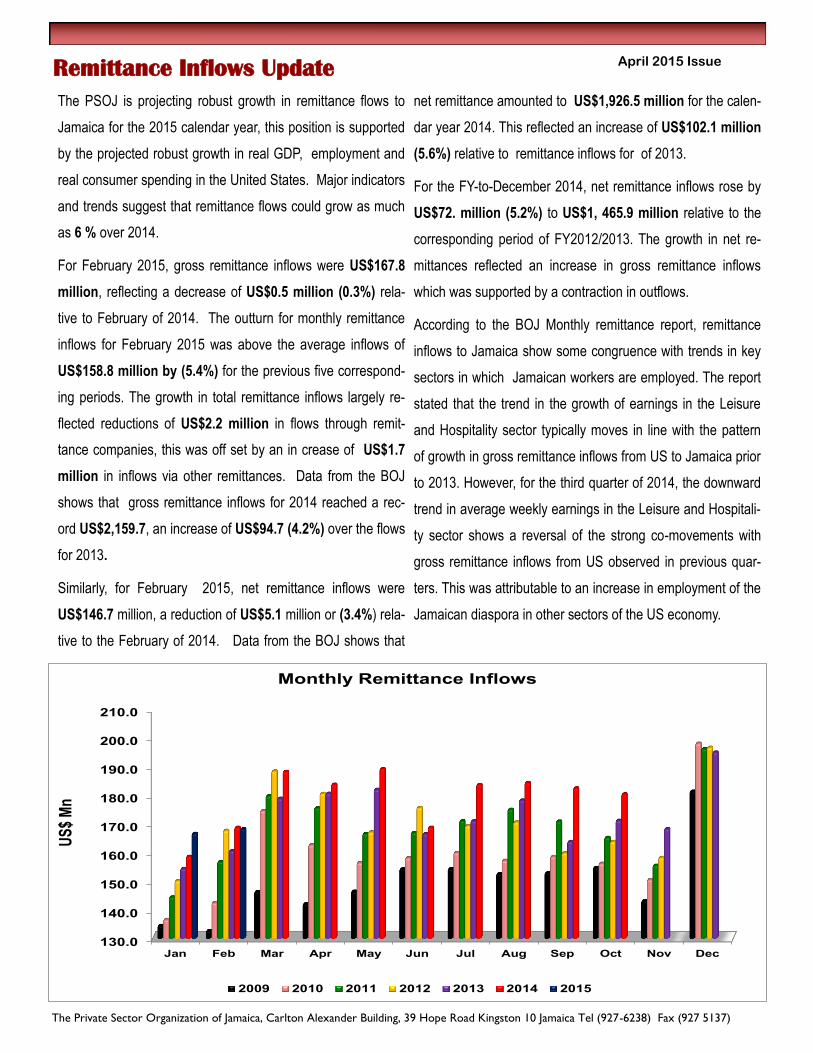
The PSOJ is projecting robust growth in remittance flows to
Jamaica for the 2015 calendar year, this position is supported
by the projected robust growth in real GDP, employment and
real consumer spending in the United States. Major indicators
and trends suggest that remittance flows could grow as much
as 6 % over 2014.
For February 2015, gross remittance inflows were US$167.8
million, reflecting a decrease of US$0.5 million (0.3%) rela-
tive to February of 2014. The outturn for monthly remittance
inflows for February 2015 was above the average inflows of
US$158.8 million by (5.4%) for the previous five correspond-
ing periods. The growth in total remittance inflows largely re-
flected reductions of US$2.2 million in flows through remit-
tance companies, this was off set by an in crease of US$1.7
million in inflows via other remittances. Data from the BOJ
shows that gross remittance inflows for 2014 reached a rec-
ord US$2,159.7, an increase of US$94.7 (4.2%) over the flows
for 2013.
Similarly, for February 2015, net remittance inflows were
US$146.7 million, a reduction of US$5.1 million or (3.4%) rela-
tive to the February of 2014. Data from the BOJ shows that
net remittance amounted to US$1,926.5 million for the calen-
dar year 2014. This reflected an increase of US$102.1 million
(5.6%) relative to remittance inflows for of 2013.
For the FY-to-December 2014, net remittance inflows rose by
US$72. million (5.2%) to US$1, 465.9 million relative to the
corresponding period of FY2012/2013. The growth in net re-
mittances reflected an increase in gross remittance inflows
which was supported by a contraction in outflows.
According to the BOJ Monthly remittance report, remittance
inflows to Jamaica show some congruence with trends in key
sectors in which Jamaican workers are employed. The report
stated that the trend in the growth of earnings in the Leisure
and Hospitality sector typically moves in line with the pattern
of growth in gross remittance inflows from US to Jamaica prior
to 2013. However, for the third quarter of 2014, the downward
trend in average weekly earnings in the Leisure and Hospitali-
ty sector shows a reversal of the strong co-movements with
gross remittance inflows from US observed in previous quar-
ters. This was attributable to an increase in employment of the
Jamaican diaspora in other sectors of the US economy.
Remittance Inflows Update
130.0
140.0
150.0
160.0
170.0
180.0
190.0
200.0
210.0
Jan Feb Mar Apr May Jun Jul Aug Sep Oct Nov Dec
US
$ M
n
Monthly Remittance Inflows
2009 2010 2011 2012 2013 2014 2015
The Private Sector Organization of Jamaica, Carlton Alexander Building, 39 Hope Road Kingston 10 Jamaica Tel (927-6238) Fax (927 5137)
28
April 2015 Issue
Market Analysts at Reuters projects that the market
for aluminum is expected to move from an oversupply
of 235,500 tons in 2014 to a deficit of 4,444 tons in
2015. If this materializes, there should be greater
demand for local alumina given the fall in crude oil
prices this state of the market, subject to existing con-
tracts, should be good news for Jamaica. IMF price
projections show an increase in price by 6% in first
quarter relative to 2014 and a downgrade to 1% by
the end of 2015.
For April 2015, the production of alumina was
1650,543 tonnes, representing an increase of 14,192
(10%) tonnes, relative to April 2014. This brought
YTD production level to 633,382 tonnes (2.5%) in-
crease over the corresponding period last year. The
sale of alumina increased by 30,547 tonnes (21%)
relative to April of 2014. On the other hand, YTD
alumina sales increased by 15,360 tonnes (2.5%) in
comparison to April 2014.
The production of crude bauxite fell in April 2015 rela-
tive to April 2014 by 28,154 tonnes (6.13%). On
the other hand, the YTD production of crude bauxite
increase 67,044 tonnes (4%). The sale of crude fell
by 12% in April relative to April 2014. Year-to-date
crude bauxite exports increased by 40,000 tonnes
(2.5%) over the corresponding period of 2014.
The production of total bauxite increased in April
2015 relative to April 2014 by 613 tonnes (0.07%).
Similarly, YTD total bauxite production fell, by 268
(0.01%). Annually, sales of total bauxite has in-
creased by 16,777 (2%). YTD sales of total bauxite
has fallen by 20,750 tonnes (0.62%),
Domestic Bauxite and Alumina Production
ALUMINA
CRUDE
BAUXITE
TOTAL
BAUXITE ALUMINA
CRUDE
BAUXITE
TOTAL
BAUXITE
MONTH
2015 156,543 430,945 848,551 175,739 410,842 883,345
2014 142,351 459,099 847,938 145,192 466,573 866,572
% Chg 2015/14 9.97 -6.13 0.07 21.04 -11.94 1.94
2013 143,451 377,772 750,991 106,479 365,974 642,913
% Chg 2014/13 -0.77 21.53 12.91 36.36 27.49 34.79
Y-T-D
2015 633,382 1,685,934 3,282,619 663,106 1,649,725 3,321,308
2014 618,022 1,618,890 3,282,887 643,928 1,609,987 3,342,059
% Chg 2015/14 2.49 4.14 -0.01 2.98 2.47 -0.62
2013 570,255 1,613,902 2,506,959 570,476 1,575,898 3,077,911
% Chg 2014/13 8.38 0.31 30.95 12.88 2.16 8.58
PERIODPRODUCTION SALES
The Private Sector Organization of Jamaica, Carlton Alexander Building, 39 Hope Road Kingston 10 Jamaica Tel (927-6238) Fax (927 5137)
29
April 2015 Issue Stock Market Update
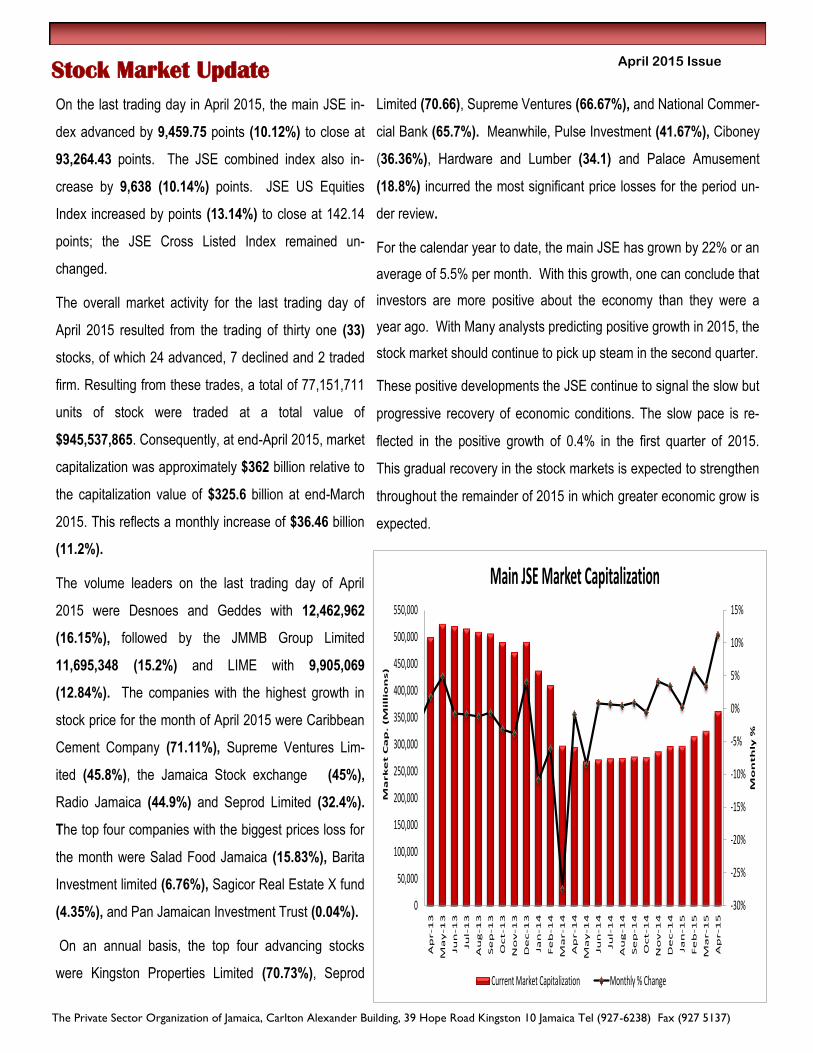
On the last trading day in April 2015, the main JSE in-
dex advanced by 9,459.75 points (10.12%) to close at
93,264.43 points. The JSE combined index also in-
crease by 9,638 (10.14%) points. JSE US Equities
Index increased by points (13.14%) to close at 142.14
points; the JSE Cross Listed Index remained un-
changed.
The overall market activity for the last trading day of
April 2015 resulted from the trading of thirty one (33)
stocks, of which 24 advanced, 7 declined and 2 traded
firm. Resulting from these trades, a total of 77,151,711
units of stock were traded at a total value of
$945,537,865. Consequently, at end-April 2015, market
capitalization was approximately $362 billion relative to
the capitalization value of $325.6 billion at end-March
2015. This reflects a monthly increase of $36.46 billion
(11.2%).
The volume leaders on the last trading day of April
2015 were Desnoes and Geddes with 12,462,962
(16.15%), followed by the JMMB Group Limited
11,695,348 (15.2%) and LIME with 9,905,069
(12.84%). The companies with the highest growth in
stock price for the month of April 2015 were Caribbean
Cement Company (71.11%), Supreme Ventures Lim-
ited (45.8%), the Jamaica Stock exchange (45%),
Radio Jamaica (44.9%) and Seprod Limited (32.4%).
The top four companies with the biggest prices loss for
the month were Salad Food Jamaica (15.83%), Barita
Investment limited (6.76%), Sagicor Real Estate X fund
(4.35%), and Pan Jamaican Investment Trust (0.04%).
On an annual basis, the top four advancing stocks
were Kingston Properties Limited (70.73%), Seprod
Limited (70.66), Supreme Ventures (66.67%), and National Commer-
cial Bank (65.7%). Meanwhile, Pulse Investment (41.67%), Ciboney
(36.36%), Hardware and Lumber (34.1) and Palace Amusement
(18.8%) incurred the most significant price losses for the period un-
der review.
For the calendar year to date, the main JSE has grown by 22% or an
average of 5.5% per month. With this growth, one can conclude that
investors are more positive about the economy than they were a
year ago. With Many analysts predicting positive growth in 2015, the
stock market should continue to pick up steam in the second quarter.
These positive developments the JSE continue to signal the slow but
progressive recovery of economic conditions. The slow pace is re-
flected in the positive growth of 0.4% in the first quarter of 2015.
This gradual recovery in the stock markets is expected to strengthen
throughout the remainder of 2015 in which greater economic grow is
expected.
-30%
-25%
-20%
-15%
-10%
-5%
0%
5%
10%
15%
0
50,000
100,000
150,000
200,000
250,000
300,000
350,000
400,000
450,000
500,000
550,000
Ap
r-1
3
Ma
y-1
3
Ju
n-1
3
Ju
l-1
3
Au
g-1
3
Se
p-1
3
Oct-1
3
No
v-1
3
De
c-1
3
Ja
n-1
4
Fe
b-1
4
Ma
r-1
4
Ap
r-1
4
Ma
y-1
4
Ju
n-1
4
Ju
l-1
4
Au
g-1
4
Se
p-1
4
Oct-1
4
No
v-1
4
De
c-1
4
Ja
n-1
5
Fe
b-1
5
Ma
r-1
5
Ap
r-1
5
Mo
nth
ly %
Ma
rk
et C
ap
. (
Mil
lio
ns)
Main JSE Market Capitalization
Current Market Capitalization Monthly % Change

The Private Sector Organization of Jamaica, Carlton Alexander Building, 39 Hope Road Kingston 10 Jamaica Tel (927-6238) Fax (927 5137)
30
April 2015 Issue Previous Highlights: March 2015 Summary
Macroeconomic conditions continue to strengthen in March
2015 and analysts expect this trajectory to continue through-
out much of 2015. The observed health in economic condi-
tions was manifested in key variables which include a relatively
robust NIR , a stable exchange rate, low consumer prices,
increased levels of remittances, robust growth in tourism and
mining and quarrying.
In this regard, the central Bank has lowered the signal interest
rates from 5.75% to 5.5% (25bps). This reduction come as
the economy recorded its lowest rate of inflation of 4.0% in
forty eight years in the fiscal year to March 2015. This low
inflation rate positively impacted the stability of the local cur-
rency as it depreciated by 4.99% against the US$ when com-
pared to the 10.8% in the previous fiscal year. In addition, the
declining price environment has positively impacted the Cur-
rent Account deficit which contracted by US$291.6 Million
(4.8%) in the calendar year 2014.
The PSOJ expect these positive signs should augur well for
growth in real GDP for 2015 in the range of 1.2% to 2.2%. This
projection is conditional on a normal set of events such as no
natural disaster, no severe external shock such as large spikes
on commodities and no local man made catastrophes.
In addition to these fundamentals, The country continues to
perform relatively well under the current IMF Extended Fund
Facility. On the down side there continues to be failure on the
revenue targets as the economy has not been able to grow at
the desired rate over the last year even in the face of two good
quarters of growth in real GDP in 2014. Major economic indi-
cators continue to move on the right trajectory which is reflect-
ed in business and consumer confidence which continues to
move in the right direction.
This continued improvement in business and economic
conditions is further manifested in the positive movement
in the Stock markets which had market capitalization
growth of 3.3% in March 2015. On the last trading day in
February 2015, the main JSE index advanced by 2,697
points (3.22%) to close at 83,804.6 points
The significant reduction in global commodity prices, espe-
cially crude will continue to have a positive impact on gen-
eral economic conditions especially inflation and growth in
Jamaica. In this regard There were price reductions in
84% of the commodities monitored for March 2015. The
price of both crude oil indices fell following increases in
February 2015 . The Brent and the WTI fell by 2% and
5.8% respectively. Natural gas also fell 1.7%. The IMF’s
Fuel Energy Index fell by 3.2%, the Food and Beverage
Index fell by 2.8%.
In line with the price movements in global commodities,
domestic inflation, measured by the All Jamaica “All Divi-
sions” Consumer Price Index (CPI) increased by 0.5% for
March 2015, following reductions of 0.5% and 0.7% ob-
served for January and February 2015, respectively.
The movement in inflation contributed to decline in yields on
all tenors of GOJ Treasury Bills for the March 2015 auction.
In this context, the yields on the 30-day, 90-day and 180-day
tenors of GOJ Treasury Bills declined by 12 bps,15 bps and
17 bps, respectively. For the fiscal year, yields on the 30-
day, 90-day and 182-day tenors fell by 46 bps, 162 bps and
211 bps, respectively.
Data from the BOJ suggests that the overall weighted
average lending rate on local currency loans increased
by 0.36 bps to 17.10% for March 2015 relative to Febru-
ary 2015. on the other hand, interest rates on foreign
currency loans for March 2015 increased by 8 bps to
7.21% relative to February 2015.
The Jamaica Dollar appreciated by $0.60 (0.52%) vis-à-

The Private Sector Organization of Jamaica, Carlton Alexander Building, 39 Hope Road Kingston 10 Jamaica Tel (927-6238) Fax (927 5137)
31
April 2015 Issue Previous Highlights: March 2015 Summary
vis the US Dollar for March 2015 relative to February
2015. At end-March 2015, the Dollar traded at
J$115.04=US$1.00. Similarly, the Dollar appreciated by
J$8.66 (4.85%) and J$2.02 (2.18%) against the Canadian
dollar and Great British pound, respectively. At end-March
2015, the Jamaica Dollar traded at J$169.93=GBP£1.00
and J$90.62=CAD1.00, respectively.
At March 31, 2015, the stock of Net International Re-
serves (NIR) at the Bank of Jamaica was J$244.01 bil-
lion (US$2,293.68 million) reflecting an increase of
J$39.63 billion (US$372.50 million) relative to the pre-
vious month. The stock of NIR for the month reflected
an increase of US$990.06 million for fiscal year
2014/15.
For March 2015, there was a contraction of J$2.21 bil-
lion (2.14%) in the monetary base relative to the previ-
ous month. This contraction resulted in an end-month
stock of J$101.29 billion. The movement in the base
mainly reflected net currency redemption of J$1.7 bil-
lion and to a lesser extent declines of $453.8 million
and $66.9 million in commercial banks’ statutory cash
reserves and current account balances.
Revised data indicates that the dollarization ratio in-
creased marginally from 43.6% at March 2015 to
44.4% at March 2014. This increase reflected the
marginally stronger accumulation of foreign currency
deposits in the commercial banking system relative to
local currency deposits. This may be reflective of con-
sumers’ converting their holdings of local currency de-
posits to foreign currency deposits in light of a deprecia-
tion of 5.0% in the exchange rate vis-à-vis the US dollar.
For January 2015, gross remittance inflows were
US$166.2 million, reflecting an increase of US$8.1 mil-
lion (5.1%) relative to January of 2014. Data from the
BOJ shows that gross remittance inflows for 2014
reached a record US$2,159.7, an increase of US$94.7
(4.2%) over the flows for 2013. Similarly, for January
2015, net remittance inflows were US$147.4 million, an
increase of US$9.5 million or (6.9%) relative to the Janu-
ary of 2014.
For March 2015, the production of alumina was 160,227
tonnes, representing an increase of 5,645 (3.65%) tonnes,
relative to March 2014. This brought YTD production level
to 476,839 tonnes (0.25%) increase over the corresponding
period last year. The sale of alumina fell by 45,704 tonnes
(21.64%) relative to March of 2014. Similarly, YTD alumina
sales fell by 11,369 tonnes (2.3%) in comparison to March
2014.
The production of total bauxite increased in March 2015
relative to March 2014 by 26,928 tonnes (3%). Similarly,
YTD total bauxite production increased, by 17,825
(0.73%). Annually, sales of total bauxite has fallen by
116,392 (11,5%). YTD sales of total bauxite has fallen by
11,361 (0.50%).

The Private Sector Organization of Jamaica, Carlton Alexander Building, 39 Hope Road Kingston 10 Jamaica Tel (927-6238) Fax (927 5137)
32
April 2015 Issue Statistical Index: Major Macro-Economic Indicators
Monthly
Inflation
Saving
Rate
Lending
Rate
Exchange
Rate NIR
Gross
Remittance
Inflows
Tourist
ArrivalsOil Price-Brent Oil Price-WTI
Month % % % J$/US$ US$B US$M Total (000s) US$ Per barrel US$ Per barrel
Jan-12 0.40 2.45 18.13 86.78 1.8826 149.70 337,100 119.70 102.26
Feb-12 0.80 2.25 17.13 86.91 1.8747 167.24 345,007 124.93 106.15
Mar-12 0.50 2.19 19.03 87.25 1.7771 187.87 366,518 120.59 103.28
Apr-12 0.40 2.19 19.04 87.33 1.7718 180.11 295,858 120.59 103.28
May-12 0.50 2.24 18.76 87.75 1.7188 166.65 247,937 110.52 94.51
Jun-12 0.60 2.14 18.65 88.48 1.5404 175.16 255,121 95.59 82.36
Jul-12 -0.30 2.02 18.92 89.24 1.4838 168.89 284,514 103.14 87.89
Aug-12 0.50 2.00 18.84 89.73 1.4286 170.13 245,204 113.34 94.11
Sep-12 1.90 2.02 18.70 89.90 1.2578 159.37 171,229 113.38 94.61
Oct-12 0.90 2.14 18.53 90.64 1.1328 163.37 180,835 111.97 89.52
Nov-12 0.60 2.05 18.42 91.46 1.0782 157.79 248,141 109.71 86.69
Dec-12 1.00 2.10 18.44 92.65 1.1257 196.18 360,493 109.64 88.19
Jan-13 0.70 1.98 18.23 93.45 1.0091 153.98 341,365 112.93 94.65
Feb-13 0.60 1.82 18.09 95.66 0.9395 160.11 304,889 116.46 95.30
Mar-13 1.40 1.80 17.97 97.76 0.8843 178.42 361,131 109.24 93.12
Apr-13 0.40 1.67 17.92 99.55 0.8662 180.15 272,891 102.88 92.02
May-13 0.50 1.74 17.77 99.12 0.9889 181.54 230,392 103.03 94.72
Jun-13 0.20 1.61 17.66 100.82 1.0032 166.03 258,535 103.11 95.79
Jul-13 0.50 1.71 17.58 101.76 0.9297 170.54 285,601 107.72 104.55
Aug-13 0.40 1.81 17.53 101.94 0.8817 177.77 231,205 110.96 106.55
Sep-13 2.80 1.97 17.45 102.64 0.9102 163.37 168,650 111.62 106.31
Oct-13 0.80 1.97 17.48 104.65 0.8904 170.75 214,430 109.48 100.50
Nov-13 0.50 2.03 17.44 105.60 0.8357 167.79 247,512 108.08 93.81
Dec-13 0.60 2.04 17.49 106.15 1.0478 194.50 247,512 110.63 97.90
Jan-14 0.50 1.77 17.33 106.90 0.9178 158.20 330,201 107.57 95.00
Feb-14 0.10 1.85 16.45 107.93 1.0694 168.30 301,276 108.81 100.70
Mar-14 1.10 1.98 17.57 109.21 1.3036 187.80 349,890 107.41 100.57
Apr-14 -0.30 2.26 17.66 110.16 1.2851 183.30 328,304 107.88 102.18
May-14 1.00 2.12 17.35 111.26 1.1650 188.70 235,856 109.68 102.00
Jun-14 0.10 2.29 17.50 112.20 1.3761 168.30 266,550 111.87 105.24
Jul-14 1.4 2.41 17.38 112.85 2.1800 183.2 321,765 106.98 102.99
Aug-14 1.1 2.21 17.42 112.74 2.1200 183.9 264,592 101.92 96.38
Sep-14 2.10 2.05 16.91 112.67 2.2000 na 175,758 97.34 93.35
Oct-14 0.10 1.93 16.62 112.76 2.0000 na 242,543 87.27 84.40
Nov-14 -0.5 3.01 na 113.59 2.0000 na 283,246 78.44 75.70
Dec-14 -0.3 2.64 17.24 114.66 2.0000 182.0 393371 62.16 59.10
Jan-15 -0.5 2.84 17.01 115.81 1.7800 179.9 344,212 48.42 47.60
Feb-15 -0.7 2.8 16.74 115.64 2.3020 204.9 na 56.93 50.72
Mar-15 0.5 1.69 17.1 115.04 2.4401 166.2 na 55.79 47.78

The Private Sector Organization of Jamaica, Carlton Alexander Building, 39 Hope Road Kingston 10 Jamaica Tel (927-6238) Fax (927 5137)
33
April 2015 Issue
KEY
The contents of this bulletin are only for use by the addressee. The information is provided on a strictly confidential basis to sub-
scribers.
All opinions and estimates constitute the PSOJ’s judgment as at the date of the bulletin and are subject to change without notice.
Copyright Reserved © 2003.
The Private Sector Organization of Jamaica, 39 Hope Road, Kingston 6
Tel: 927-6238/6958 Fax: 927-5137 Email: Web site: http://www.psoj.org
ACP— Africa Caribbean Pacific States Loan – Average Loan Rate
BM – Base Money M – Monthly Percentage Change
BP — Basis Points M2 – Money Supply
CaPRI— Caribbean Policy and Research Institute MT – Million tonnes
CARICOM— Caribbean Community & Common Market N/A – Not Available
CARIFORUM— CARICOM and Dominican Republic NIR – Net International Reserves
CPI – Consumer Price Index OMO – Open Market Operation
CSME— Caribbean Single Market & Economy P – Point-to-Point Percentage Change
EC— European Commission R – Revised
EPA—Economic Partnership Agreement S – Stopover
EU—European Union Save – Average Savings Deposit Rate
FX Dep – Foreign Exchange Deposit T-bill – 6-month Treasury Bill Yield
JCB – Jamaica Conference Board Tourism – Total Tourist Arrivals
JCC – Jamaica Chamber of Commerce WATBY- weighted average Treasury bill yield
KMA — Kingston and Metropolitan Area WTO—World Trade Organization
KSA—Kingston and St. Andrew OECD—Organisation for Economic Co-operating and Develop-
ment (membership of 30 major countries)
WTI — West Texas Intermediate (Spot Oil Price)
The Private Sector Organization of Jamaica, Carlton Alexander Building, 39 Hope Road Kingston 10 Jamaica Tel (927-6238) Fax (927 5137)
34
April 2015 Issue
SUBSCRIBE TO THE ECONOMIC BULLETIN
Please complete form and return to PSOJ by fax as soon as possible. Thank you.
(Complete form in Capital Letters and make a mark where appropriate)
FAX # : (876) 927-5137
Subscriber: ___________________________________________________(Company / Individual)
__________________________________________________________________________________
Address:
_____________________________________________________________
__________________________________________________________________________________
Contact Person Information (Matters pertaining to Subscription)
Name: ___________________________________ ( Mr. / Mrs. / Miss. / Dr. / Hon )
Position: ____________________________________________________________
Telephone: ( ______ ) _________________
Fax: ( _______ ) __________________
Email:
______________________________________________________________
Bulletin Recipients (additional recipients) [ first then last name]
NAME 1: ______________________________________________________
( Mr. / Mrs. / Miss. / Dr. / Hon )
Position: _________________________________________________________________________________
Email: ___________________________________________________________________________________
NAME 2:______________________________________________________ ( Mr. / Mrs. / Miss. / Dr. / Hon )
Position: _________________________________________________________________________________
Email: ___________________________________________________________________________________
The Economic Bulletin is a monthly synopsis of the major developments impacting the Jamaican economy. It
covers a wide range of areas including inflation, the financial markets, fiscal accounts, tourism, the productive
sectors and external trade. In addition to tracking changes in the main indicators, it also goes behind the num-
bers to examine the underlying factors driving those changes. The Bulletin also provides insight into how cur-
rent trends may shape developments going forward in order to help inform your business decisions.
Annual
Subscription
(Jan-Dec)
PSOJ Members: $10,500
(Plus G.C.T. )
Non-members: $14,000
(Plus G.C.T. )
Payment Options
Cheque
Money Order
(No Cash Payment)
(Payment must be included with
your order form)