Embed Size (px)
Citation preview
April 2013
Table of Contents
Executive Summary .......................................................................................................................... i
Introduction .................................................................................................................................... 1
Methodology ................................................................................................................................... 3
City of Dixon Readi-Ride ................................................................................................................. 4
Fairfield and Suisun Transit (FAST) ............................................................................................... 18
City of Rio Vista Delta Breeze........................................................................................................ 45
County of Solano ........................................................................................................................... 64
Solano County Transit (SolTrans) .................................................................................................. 70
City of Vacaville City Coach ........................................................................................................... 95
Peer Transit Agency Performance Comparison .......................................................................... 121
i
Executive Summary The purpose of this study is to focus on the financial condition of the Solano County transit operators in a similar manner to the Metropolitan Transportation Commission’s (MTC) Transit Sustainability Plan financial assessment. MTC has undertaken a TSP examining the needs for making Bay Area transit service sustainable and an approach for meeting sustainability requirements. The focus of the MTC TSP has been on the seven largest transit operators in the region, none of which are in Solano County.
The outcome of this effort for the Solano Transportation Authority (STA) is intended to provide a understanding of the present and future financial condition and needs of the Solano County transit operators: City of Dixon Readi-Ride, Fairfield and Suisun City Transit (FAST), City of Rio Vista Delta Breeze, County of Solano Paratransit, Solano County Transit (SolTrans), and City of Vacaville City Coach.
The MTC TSP made a number of transit service recommendations for Solano County. They include to:
1. Adopt countywide Short Range Transit Plan
2. Complete SolTrans merger
3. Adopt coordinated fare policy
4. Consider expanding SolTrans to include additional member cities
Several of these recommendations have or are currently being implemented. The merger of Vallejo and Benicia transit systems into SolTrans was approved in Fall 2010 when the Joint Powers Agreement was adopted by the member agencies (City of Benicia, City of Vallejo, and the Solano Transportation Authority). STA is currently conducting a countywide SRTP that will develop a coordinated fare policy and enhance the integration of transit services of the five main transit operators.
Coming out of the recession, the Solano County transit agencies have been focusing on improving their respective service consistent with the three goals of the MTC TSP:
• Improve financial position through containing costs; cover a greater percentage of operating costs with a growing share of passenger fare revenues; and secure reliable streams of public funding.
• Improve service for the customer through strengthening the system so that it functions as an accessible, user-friendly and coordinated network for transit riders.
• Attract new riders to the system through strengthening the system so that it can attract and accommodate new riders in an era of emission-reduction goals, and is supported through companion land use and pricing policies.

ii
Whether through consolidation to achieve cost efficiencies, adjusting operational service levels that are based on stable funding sources, and/or modifying transit routes to be more convenient and user-friendly, the Solano County operators are making effort to develop and implement the means to sustain their respective systems.
This financial conditions assessment used several means in the review and analysis of each Solano County transit operator. They include the following for each agency:
• Data collection and consistency review
• Cost driver analysis
• Financial and operations performance trend calculations
• Operator performance against existing Short Range Transit Plan standards
• Trends in operations and capital revenue, and capital expenditures
• Review of Transportation Development Act (TDA) funding balance
• Cost containment strategies
• Five-year operations and capital forecast
Data sources for the existing conditions assessment include annual State Controller Reports, Federal National Transit Database, TDA Claims, Short Range Transit Plans, transit staff reports, financial compliance audit reports, MTC Statistical Summary, and transit budgets. Meetings with each transit agency were also held as a supplement to the data sources.
In addition, a comparison was conducted that details financial and performance trends of the Solano transit operators with agencies of comparable size and service profile around the state. Each operator was analyzed with five other transit agencies that were selected based on criteria including agency structure/organization, service area size, service area population, and fleet size. The comparative analysis provides an additional frame of reference in conducting the existing conditions assessment of each operator. As a caveat, each agency’s service area differs with respect to size, demographics, and land uses. The agencies also differ with age and condition of their vehicle fleet and transit infrastructure, as well as modes of service provided. All of these factors can impact their respective operating costs. Among the financial findings from the Solano County transit financial conditions assessment:
• Transit operators have been or are implementing transit services at levels reflective of more stabilized and recurring funding sources.

iii
• Several cost savings measures have been put into place by various systems, including staff salary reductions/furloughs, alternative fuel use savings, service reductions, and route restructuring to improve efficiencies.
• Financial and performance reporting by the operators is largely consistent among the various reporting requirements to the State and Federal governments. Some discrepancies exist due to audited versus unaudited financial data.
• Administrative cost including for transit staff management salaries, benefits and overhead allocation was within a reasonable range as a proportion of total operations expenditures. These costs comprised about 10 percent or less of operating costs.
• Purchased transportation costs or wages for in-house operations were the largest cost drivers of each transit system. This is within industry norms.
• The smaller operators (Rio Vista and Dixon) have less financial and operational flexibility relative to the larger operators given their limited funding sources and smaller transit services. These systems will need to determine their respective paths to maintain sustainability into the future.
• The transit operators have unallocated TDA reserve funds, some more than others, over the next few years to cushion against funding shortfalls or uncertainties. The flexible use of TDA to offset either capital or operating expenditures provides time for transit service adjustments to be made and to reduce reliance on the reserves.
• Vacaville City Coach has a current dual financial capacity to expand transit service in the near term while also building its state and federal funding reserves.
• Alternative funding strategies that have not been used in the past for Vallejo and Benicia transit are being implemented by SolTrans to sustain operations and capital needs.
A five-year financial forecast was provided for each operator that estimates their respective levels of sustainability in providing current service. The forecast is conservative in that there are no assumptions for new revenue sources or significant growth in revenues. This reflects uncertainty with regard to economic improvements and relatively slow economic growth patterns on the local, state and federal levels. State TDA revenues, for example, are assumed to grow by the forecasted Consumer Price Index over the five-year period. Also, operating expenses are intended to provide a baseline condition that is premised on current service levels with no anticipation of significant expansion or adjustment by the operators.
Among the financial findings from the five-year forecast:

iv
• With reduced or stabilized service levels implemented over the last several years, each of transit operators will be able to sustain current services through the forecast period. TDA carryover funds are used to help balance annual operating and capital expenses.
• The capital funding buildup for the operators is dependent in large part on the future growth of operations and the level of TDA needed to support this growth.
• One time transitional funds provided to SolTrans by MTC, as well as remaining federal grants being transferred from Vallejo to SolTrans, provide additional boosts to the revenues in the short term. Surplus operating revenues support SolTrans’ strategy to bank operations savings to use for capital purchases as well as develop a reserve policy.
• SolTrans and Fairfield are employing a strategy to prolong the useful lives of vehicles, in particular the commuter fleet, through maintenance overhauls to defer capital replacement. These transit systems will face significant capital costs for commuter buses that will need to be replaced soon after the forecast period.
• Fairfield anticipates a significant cost decrease of almost $1 million in the new operations contract that will take effect in FY 2014-15 in order to balance operating revenues and costs. While this was considered in development of the TSP, rather than show a significant decline in operating expenses, the TSP forecast holds fixed route and paratransit operating costs constant to reflect some level of savings from the new contract. The assumption about the cost of the new operations contract is one of the primary factors in whether FAST could continue operating its existing service and still have reserves for future bus replacements.
• Vacaville anticipates some service expansion early in the forecast to meet transit demand. This is expected to increase operations cost by about 4 percent from the prior year. The City will continue actions to save cost through contract operations and alternative fuel cost savings. TDA distributions and FTA grants are sufficient to cover annual expenditures for operations and capital, while building sizable surpluses over time in both fund sources.
• Rio Vista will continue using revenue sources such as local school district contracts and Greyhound bus ticket commissions to support transit. These revenue sources supplement actual passenger fare revenue which historically have not growth adequately to cover required farebox ratios.
• Dixon will rely on competitive federal grant funding to replace its vehicles in the latter part of the forecast. Other federal transit funds would be a backing to the competitive program for capital replacement.

v
The TSP provided the financial baseline for the Solano County Coordinated Short Range Transit Plan (SRTP). The baseline is the point from which the short range planning analysis begins. While the TSP five year forecast of costs and revenues formed the basis for the SRTPs, there are some differences between the two financial scenarios. Subsequent to the development of the TSP, several issues emerged and were resolved and new information became available, all of which are reflected in the SRTP. Additionally, the SRTP is required to cover the next ten years while the TSP covers the next five years.
During the course of the development of the TSP, the STA and transit operators agreed to a schedule and funding plan for replacing intercity buses. This funding agreement is included in the SRTPs. More detailed analysis of all capital needs and funding are included in the SRTP as well. In February 2013, after the TSP financial analysis was completed, new fund estimates for Transportation Development Act (TDA) funds became available. The new fund estimate was incorporated into the SRTPs, but the same growth factors were used to forecast future TDA revenues. These differences between the TSP and SRTP reflect the different points in time that the two documents were developed but the general conclusions of both studies regarding the baseline are similar.

1
Introduction The purpose of this study is to focus on the financial condition of the Solano County transit operators in a similar manner to MTC’s Transit Sustainability Project (TSP) financial assessment. The outcome of this effort is intended to provide a understanding of the present and future financial condition and needs of the Solano County transit operators: City of Dixon Readi-Ride, Fairfield and Suisun City Transit (FAST), City of Rio Vista Delta Breeze, County of Solano Paratransit, Solano County Transit (SolTrans), and City of Vacaville City Coach.
The MTC TSP made a number of transit service recommendations for Solano County. They include to:
1. Adopt countywide Short Range Transit Plan
2. Complete SolTrans merger
3. Adopt coordinated fare policy
4. Consider expanding SolTrans to include additional member cities
Several of these recommendations have or are currently being implemented. The merger of Vallejo and Benicia transit systems into SolTrans was approved in Fall 2010 when the Joint Powers Agreement was adopted by the member agencies (City of Benicia, City of Vallejo, and the Solano Transportation Authority). The Solano Transportation Authority (STA) is currently conducting a countywide SRTP that will develop a coordinated fare policy and enhance the integration of transit services of the five main transit operators.
Coming out of the recession, the Solano County transit agencies have been focusing on improving their respective service consistent with the three goals of the MTC TSP:
• Improve financial position through containing costs; cover a greater percentage of operating costs with a growing share of passenger fare revenues; and secure reliable streams of public funding.
• Improve service for the customer through strengthening the system so that it functions as an accessible, user-friendly and coordinated network for transit riders.
• Attract new riders to the system through strengthening the system so that it can attract and accommodate new riders in an era of emission-reduction goals, and is supported through companion land use and pricing policies.
Whether through consolidation to achieve cost efficiencies, adjusting operational service levels that are based on stable funding sources, and/or modifying transit routes to be more convenient and user-friendly, the Solano County operators are making effort to develop and implement the means to sustain their respective systems.

2
The TSP provided the financial baseline for the Solano County Coordinated Short Range Transit Plan (SRTP). The baseline is the point from which the short range planning analysis begins. While the TSP five year forecast of costs and revenues formed the basis for the SRTPs, there are some differences between the two financial scenarios. Subsequent to the development of the TSP, several issues emerged and were resolved and new information became available, all of which are reflected in the SRTP. Additionally, the SRTP is required to cover the next ten years while the TSP covers the next five years.
During the course of the development of the TSP, the STA and transit operators agreed to a schedule and funding plan for replacing intercity buses. This funding agreement is included in the SRTPs. More detailed analysis of all capital needs and funding are included in the SRTP as well. In February 2013, after the TSP financial analysis was completed, new fund estimates for Transportation Development Act (TDA) funds became available. The new fund estimate was incorporated into the SRTPs, but the same growth factors were used to forecast future TDA revenues. These differences between the TSP and SRTP reflect the different points in time that the two documents were developed but the general conclusions of both studies regarding the baseline are similar.

3
Methodology This financial conditions assessment used several means in the review and analysis of each Solano County transit operator. They include the following for each agency:
• Data collection and consistency review
• Cost driver analysis
• Financial and operations performance trend calculations
• Operator performance against existing Short Range Transit Plan standards
• Trends in operations and capital revenue, and capital expenditures
• Review of current Transportation Development Act (TDA) funding balance
• Cost containment strategies
• Five-year operations and capital forecast
Data sources for the assessment include annual State Controller Reports, Federal National Transit Database, TDA Claims, Short Range Transit Plans, transit staff reports, financial compliance audit reports, MTC Statistical Summary, and transit budgets. Meetings with each transit agency were also held as a supplement to the data sources.
In addition, a comparison was conducted that details financial and performance trends of the Solano transit operators with agencies of comparable size and service profile around the state. Each operator was analyzed with five other transit agencies that were selected based on criteria including agency structure/organization, service area size, service area population, and fleet size. The comparative analysis provides an additional frame of reference in conducting the existing conditions assessment of each operator. As a caveat, each agency’s service area differs with respect to size, demographics, and land uses. The agencies also differ with age and condition of their vehicle fleet and transit infrastructure, as well as modes of service provided. All of these factors can impact their respective operating costs.

4
City of Dixon Readi-Ride The following tables provide a summary of the financial and performance data for City of Dixon Readi-Ride. Data sources used to comprise the tables include TDA Claims, Fiscal Audits, National Transit Database, Comprehensive Annual Financial Reports, MTC Statistical Summary, and State Controller Reports. A review of other data sources including the Short Range Transit Plan and internal reports was also conducted. Data Consistency A comparison of key financial and operations data was undertaken to determine the general accuracy of the recording and reporting by City of Dixon. With an understanding that various reports are submitted at different times on the state and federal levels, they are all prepared after the end of the fiscal year and ideally should match. The listing of the data provides comparison to show minor discrepancies that may exist among the various data sources that portray the financial health of the transit system. Overall, the data sources provide relatively consistent information. The variability in operating costs reported among data sources is likely attributable to the inclusion, or non inclusion, of city allocated costs to the transit program.
DIXON DATA CONSISTENCY - DEMAND RESPONSE
Performance Measure
Source FY09 FY10 FY11 FY12
Total Operating Expenses
FTA National Transit Database $609,571 $579,384 $620,982
State Controller Report $665,691 $628,736 $620,983 Audited Financial
$665,842 $606,420 $620,981
TDA Claim $664,706 $602,267 $620,984 $611,255 Farebox Revenues
FTA National Transit Database
$98,277 $81,326 $78,869
State Controller Report $98,277 $81,326 $78,869 Audited Financial
$98,277 $81,326 $78,869
TDA Claim $98,277 $81,326 $78,869 $85,000
Passengers FTA National Transit Database
68,949 44,339 43,967
State Controller Report 68,949 46,266 43,967 Internal Reports 68,949 44,339 43,967
TDA Claim 68,949 44,339 43,967 47,914

5
DIXON DATA CONSISTENCY - DEMAND RESPONSE
Performance Measure
Source FY09 FY10 FY11 FY12
Vehicle Service Hours
FTA National Transit Database
7,413 5,975 6,373
State Controller Report 7,413 7,149 7,276 Internal Reports 7,413 5,975 6,373 TDA Claim 7,413 6,411 6,373 7,800
Vehicle Service Miles
FTA National Transit Database
99,272 72,685 77,247
State Controller Report 104,800 79,572 79,498 Internal Reports 99,272 72,685 77,247
TDA Claim 99,272 78,432 77,247 79,900
Employee Full-Time Equivalents
FTA National Transit Database
State Controller Report 7.0 7.0 7.0 Dixon CAFR 7.7 6.2 6.8 TDA Claim 7.0 7.0 7.0 7.0
Note: Dixon Readi-Ride performance measures are not contained in the annual MTC Statistical Summary. Cost Drivers Cost drivers are expense items necessary to provide a particular service. Cost drivers for Readi-Ride have generally included administrative labor wages and benefits, and vehicle fuel. The percentage of administrative wages and benefits and fuel are derived relative to total operations costs. Salaries and wages include direct staffing costs to operate and manage the service, as well as city overhead costs that are reimbursed through transfers of transit funds to the general fund. As Readi-Ride is operated in-house, labor and benefits costs are from city employees. An approved overhead cost allocation plan is used as the basis to distribute general fund costs of city administrative and support services (e.g. city council, city manager, finance, clerk, etc.) to city programs like transit for reimbursement. Examples of the cost basis for support services charged to departments include total program budget, number of accounting transactions, and full time equivalents. Transit is also charged for use of the city corporation yard, however, transit funds through the American Reinvestment and Recovery Act (ARRA) were used in the expansion of the yard. Reimbursements for overhead costs charged to transit are about

6
$73,000 per year, according to the city’s updated cost allocation plan, and comprise about 9 to 10 percent of the transit operating budget. Cost Drivers
Dixon Readi-Ride 2009 2010 2011 2012
Salaries & Wages (direct and city admin. staff)
$351,464 $325,420 $327,358 $307,736
% Change -7% 1% -6% Benefits $152,430 $163,526 $155,256 $183,838
% Change 7% -5% 18% Fuel $46,573 $31,077 $44,864 $50,000
% Change -33% 44% 11%
Salaries & Wages as % of Total Operations Cost (minus depreciation)
53% 54% 53% 50%
Benefits as a % of Total Operations Cost (minus Depreciation)
23% 27% 25% 30%
Fuel as % of Total Operations Cost (minus depreciation)
7% 5% 7% 8%
Source: TDA Claims Actual for FYs 2009-2011, Estimated for FY 2012
A breakdown of audited operations costs between O&M and administration is provided for the period of FYs 2007-08 through 2010-11. Operations cost to run the service comprises about 85 percent of total cost (minus depreciation) while administrative costs comprise the remaining 15 percent. Depreciation expense is increasing due to the new replacement vehicles purchased. Readi-Ride Functional Operations Expenses 2008 2009 2010 2011
Operations and Maintenance $560,490 $574,370 $523,135 $556,971 % Change 2% -9% 6%
Administrative and General $93,318 $91,472 $83,285 $64,010 % Change -2% -9% -23%
Depreciation $36,832 $28,693 $22,198 $57,963 % Change -22% -23% 161%
Total $690,640 $694,535 $628,618 $678,944 Source: City of Dixon CAFR
A further division of operating expenses among other cost drivers is shown using audited data. Salaries and wages are the primary cost driver, with others including maintenance, supplies, and services. Trends in most expenses remained relatively stable or have incurred slight decreases over the past few years due to service hour cuts beginning in FY 2010. Administration

7
of the transit system decreased significantly in FY 2011 due in part to staff transitions in management oversight. Readi-Ride Transit Operations Expenses 2009 2010 2011
Salaries and Benefits $431,426 $424,569 $428,030 % Change -2% 1%
Supplies and Materials $1,407 $1,933 $1,143 % Change 37% -41%
Maintenance and Repair $100,336 $85,234 $99,102 % Change -15% 16%
Power and Utilities $4,711 $8,466 $8,876 % Change 80% 5%
Contractual Services $36,490 $2,893 $19,820 % Change -92% 585%
Administration $35,201 $23,587 $9,427 % Change -33% -60%
Miscellaneous $0 $40 $0 % Change
-100%
Cost Allocation Transfer (City Overhead Charge)
$56,271 $59,698 $54,583
% Change 6% -9% Depreciation $28,693 $22,198 $57,963
% Change -23% 161% Total $694,535 $628,618 $678,944 -9% 8% Source: City of Dixon CAFR, TDA Fiscal Audit
Performance Trends The following tables provide information on performance indicators and trends of the transit system. Industry performance measures are used including operating costs, fare revenues, ridership, revenue hours and miles, and full time equivalents. The general trend for fiscal years 2009 through 2011 shows less cost efficiency and effectiveness measured in cost per hour and per passenger, and farebox recovery. Subsidy per passenger also increased over the three year period. Service effectiveness measured by passengers per hour shows a decline. Although costs declined over the period, other measures such as fare revenue, ridership, and service hours/miles declined at a more rapid pace due to service reductions which impact the performance indicator trends.

8
DIXON READI-RIDE PERFORMANCE INDICATORS
% Change
Statistics & Performance Indicators FY 08-09 FY 09-10 FY 10-11 FY09-FY11
Operating Costs $665,842 $606,420 $620,981 -6.7% Annual % Change -8.9% 2.4%
Passengers 68,949 44,339 43,967 -36.2% Annual % Change -35.7% -0.8%
Vehicle Service Hours 7,413 5,975 6,373 -14.0% Annual % Change -19.4% 6.7%
Vehicle Service Miles 99,272 72,685 77,247 -22.2% Annual % Change -26.8% 6.3%
Employee FTEs 8 6 7 -11.7% Annual % Change -19.4% 9.5%
Fare Revenue $98,277 $81,326 $78,869 -19.7% Annual % Change -17.2% -3.0%
Operating Cost per Passenger $9.66 $13.68 $14.12 46.3%
Annual % Change 41.6% 3.3% Operating Cost per Vehicle Service Hour $89.82 $101.49 $97.44 8.5%
Annual % Change 13.0% -4.0% Passengers per Vehicle Service Hour 9.30 7.42 6.90 -25.8%
Annual % Change -20.2% -7.0% Passengers per Vehicle Service Mile 0.69 0.61 0.57 -18.1%
Annual % Change -12.2% -6.7% Veh. Service Hours per Employee FTE 965 965 940 -2.6%
Annual % Change 0.0% -2.6% Fare per Passenger $1.43 $1.83 $1.79 25.9%
Annual % Change 28.7% -2.2% Subsidy per passenger $8.23 $11.84 $12.33 49.8%
Annual % Change 43.9% 4.1% Farebox Recovery Ratio 14.8% 13.4% 12.7% -14.0%
Annual % Change -9.1% -5.3% Percentage Change Consumer Price Index (Bay Area CPI) 1.8% 1.2% 1.7% Source: Operating costs and fare revenue from TDA Fiscal Audit
Passengers, Vehicle Service Hours/Miles are from National Transit Database Reports. Employee FTEs from Dixon CAFR
Graphical display of select performance indicators is shown below.

9
Operating Cost
Ridership
Operating Cost Per Passenger
$0
$100,000
$200,000
$300,000
$400,000
$500,000
$600,000
$700,000
FY09 FY10 FY11
0
10,000
20,000
30,000
40,000
50,000
60,000
70,000
80,000
FY09 FY10 FY11
$0.00
$2.00
$4.00
$6.00
$8.00
$10.00
$12.00
$14.00
$16.00
FY09 FY10 FY11

10
Operating Cost Per Hour
Passengers Per Hour
Farebox Recovery
$0.00
$20.00
$40.00
$60.00
$80.00
$100.00
$120.00
FY09 FY10 FY11
0.0
1.0
2.0
3.0
4.0
5.0
6.0
7.0
8.0
9.0
10.0
FY09 FY10 FY11
0.0%
2.0%
4.0%
6.0%
8.0%
10.0%
12.0%
14.0%
16.0%
FY09 FY10 FY11
11
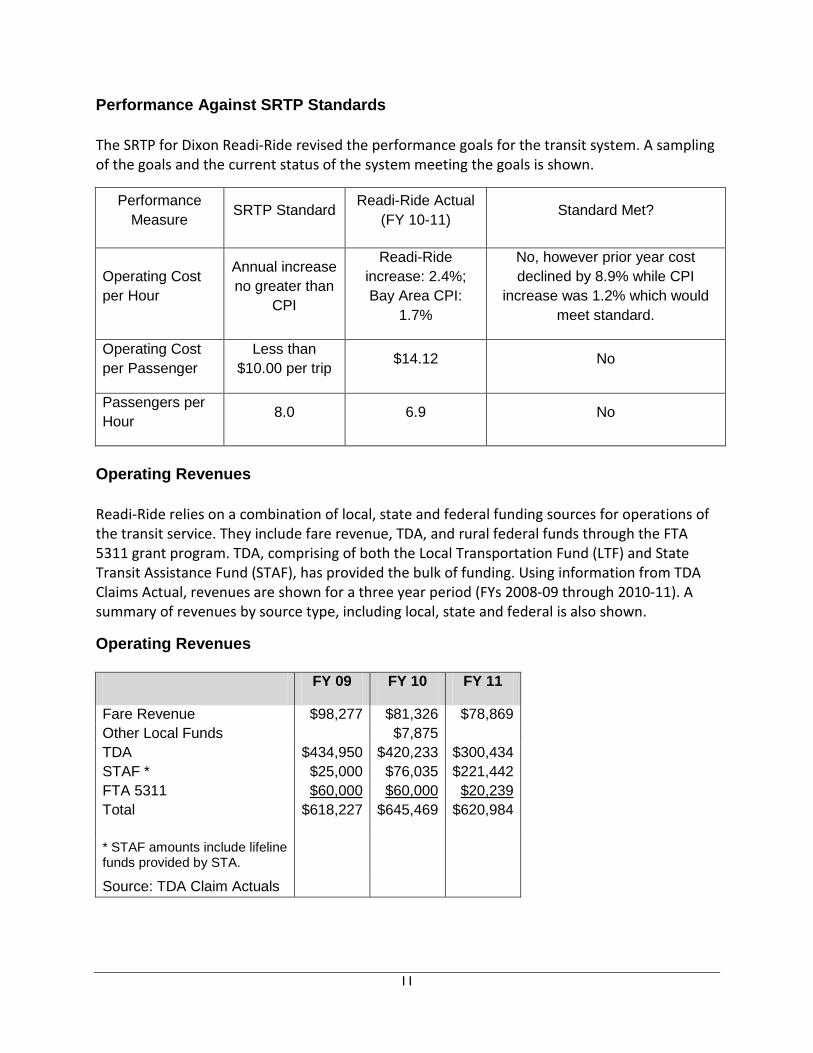
Performance Against SRTP Standards The SRTP for Dixon Readi-Ride revised the performance goals for the transit system. A sampling of the goals and the current status of the system meeting the goals is shown.
Performance Measure SRTP Standard Readi-Ride Actual
(FY 10-11) Standard Met?
Operating Cost per Hour
Annual increase no greater than
CPI
Readi-Ride increase: 2.4%; Bay Area CPI:
1.7%
No, however prior year cost declined by 8.9% while CPI
increase was 1.2% which would meet standard.
Operating Cost per Passenger
Less than $10.00 per trip $14.12 No
Passengers per Hour 8.0 6.9 No
Operating Revenues Readi-Ride relies on a combination of local, state and federal funding sources for operations of the transit service. They include fare revenue, TDA, and rural federal funds through the FTA 5311 grant program. TDA, comprising of both the Local Transportation Fund (LTF) and State Transit Assistance Fund (STAF), has provided the bulk of funding. Using information from TDA Claims Actual, revenues are shown for a three year period (FYs 2008-09 through 2010-11). A summary of revenues by source type, including local, state and federal is also shown.
Operating Revenues
FY 09 FY 10 FY 11
Fare Revenue $98,277 $81,326 $78,869 Other Local Funds $7,875 TDA $434,950 $420,233 $300,434 STAF * $25,000 $76,035 $221,442 FTA 5311 $60,000 $60,000 $20,239 Total $618,227 $645,469 $620,984 * STAF amounts include lifeline funds provided by STA.
Source: TDA Claim Actuals

12
Summary of Operating Revenues by Source Type
FY 09 % of Total FY 10 % of Total FY 11 % of Total
Local Revenues (fares, other)
$98,277 16% $89,201 14% $78,869 13%
State Funds (TDA) $459,950 74% $496,268 72% $521,876 84% Federal $60,000 10% $60,000 9% $20,239 3% Total $618,227 100% $645,469 100% $620,984 100%
Source: TDA Claims Actual
The SRTP prepared for Readi-Ride provides projections of operating revenues. The SRTP assumes that due to funding reductions, the transit system will have to rely almost exclusively on TDA revenues as the only non-fare revenue source. Dixon also contributes a share of its TDA revenues to fund intercity transit as part of the intercity cost sharing agreement, as well as intercity taxi scrip. Approximately 18 percent of Dixon’s annual TDA apportionment is used to fund intercity transit services in FY 2012-13.
FTA 5311 grant funds have been used for both operating and capital. The primary reliance on TDA has led to development of SRTP service alternatives that provide reduced service hours and options that could significantly alter the way transit is delivered including possible transition to fixed route. Capital Revenues Dixon has been limited to a few funding sources for capital expenditures including vehicle replacement and facility improvement. Funding sources include TDA, Proposition 1B, and FTA 5311 ARRA funds. Using National Transit Database information, revenues are shown for a three year period (FYs 2008-09 through 2010-11). The large grant funds in FY 2011 were used for purchase of several vehicles for replacement (4 vehicles) and for dispatch and expansion of the corporation yard. In addition, according to the city’s budget, in FY 11-12 Dixon received over $21,000 in Proposition 1B funding for purchase of radio equipment. A summary of revenues by source type is also shown. Capital Revenues by Source FY 09 FY 10 FY 11
TDA $13,583 $93,009 $1,087 Proposition 1B $66,546 FTA 5311 ARRA $48,460 $48,000 $606,472 Total $62,043 $207,555 $607,559 Source: NTD
13
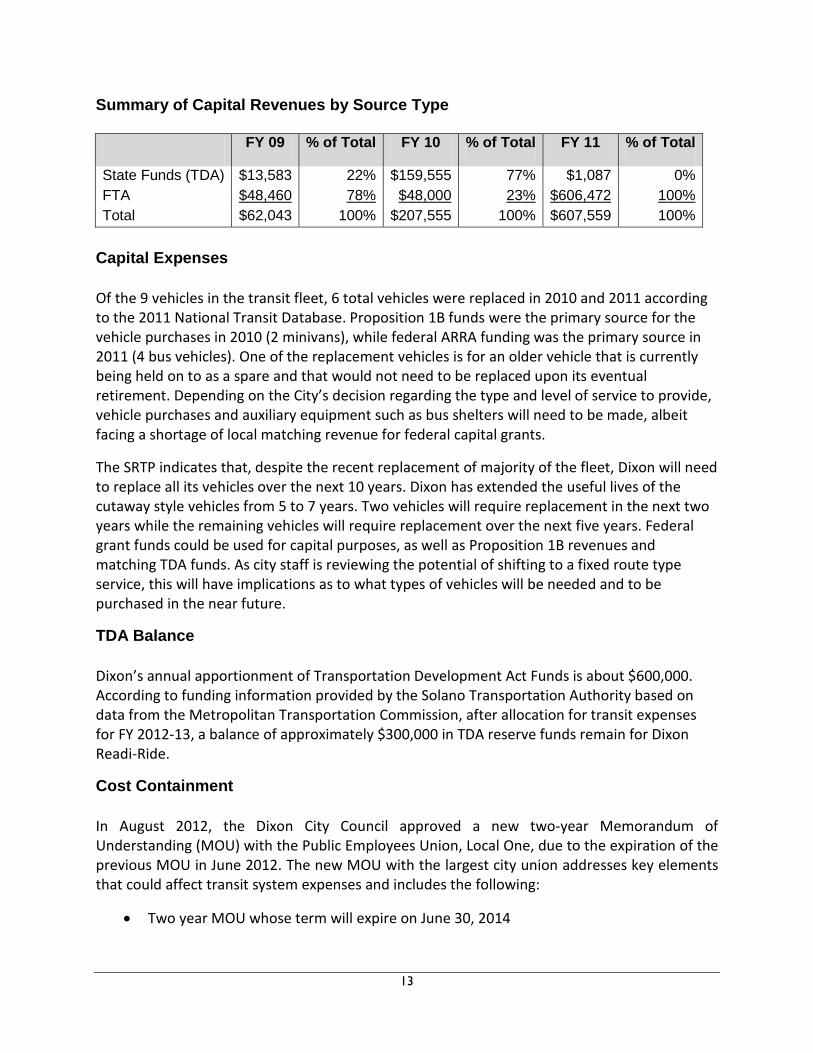
Summary of Capital Revenues by Source Type FY 09 % of Total FY 10 % of Total FY 11 % of Total
State Funds (TDA) $13,583 22% $159,555 77% $1,087 0% FTA $48,460 78% $48,000 23% $606,472 100% Total $62,043 100% $207,555 100% $607,559 100%
Capital Expenses Of the 9 vehicles in the transit fleet, 6 total vehicles were replaced in 2010 and 2011 according to the 2011 National Transit Database. Proposition 1B funds were the primary source for the vehicle purchases in 2010 (2 minivans), while federal ARRA funding was the primary source in 2011 (4 bus vehicles). One of the replacement vehicles is for an older vehicle that is currently being held on to as a spare and that would not need to be replaced upon its eventual retirement. Depending on the City’s decision regarding the type and level of service to provide, vehicle purchases and auxiliary equipment such as bus shelters will need to be made, albeit facing a shortage of local matching revenue for federal capital grants.
The SRTP indicates that, despite the recent replacement of majority of the fleet, Dixon will need to replace all its vehicles over the next 10 years. Dixon has extended the useful lives of the cutaway style vehicles from 5 to 7 years. Two vehicles will require replacement in the next two years while the remaining vehicles will require replacement over the next five years. Federal grant funds could be used for capital purposes, as well as Proposition 1B revenues and matching TDA funds. As city staff is reviewing the potential of shifting to a fixed route type service, this will have implications as to what types of vehicles will be needed and to be purchased in the near future.
TDA Balance Dixon’s annual apportionment of Transportation Development Act Funds is about $600,000. According to funding information provided by the Solano Transportation Authority based on data from the Metropolitan Transportation Commission, after allocation for transit expenses for FY 2012-13, a balance of approximately $300,000 in TDA reserve funds remain for Dixon Readi-Ride.
Cost Containment In August 2012, the Dixon City Council approved a new two-year Memorandum of Understanding (MOU) with the Public Employees Union, Local One, due to the expiration of the previous MOU in June 2012. The new MOU with the largest city union addresses key elements that could affect transit system expenses and includes the following:
• Two year MOU whose term will expire on June 30, 2014

14
• Four percent reduction in base pay over the life of the two year MOU (two percent per
year)
• Increase in the amount paid by Local One members of the City’s PERS pension cost of
five percent over the two year MOU (two percent in the first year and three percent in
the second year)
In a report to the City Council, City transit staff have proposed options for addressing funding constraints including working cooperatively through the STA to curb increases in the cost of providing intercity service, and pursuing funding sources in addition to the annual TDA allocation.
City transit staff will also examine options for improving operating efficiencies to Readi-Ride operations. This may include the following:
• Staff reductions while maintaining curb-to-curb service resulting in increased response times to calls for services. Average response time is currently less than 10 minutes.
• Converting to a fixed or deviated fixed route system. This could be during all operating hours or only during peak periods to address school trips.
• Eliminating Saturday service.
• Reducing hours of service during the week.
• Increasing fares.
Five-Year Financial Forecast A forecast of revenues and expenses for both operations and capital projects of Dixon Readi-Ride is presented for the next five-years. With city staff input, the forecast provides a base scenario of maintaining and reducing levels of service to remain sustainable. The current general public dial-a-ride structure is assumed to be in tact during the forecast period. The SRTP prepared for Read-Ride in May 2009 also describes such a scenario of reduced service with the existing dial-a-ride structure. Any shift to an alternative service delivery method, such as a fixed route/ADA paratransit service or deviated fixed route, will result in different operating and financial conditions.
Operations costs are assumed to grow at 2 percent per year given recent trends with several expenditures items. Labor costs are reduced and stabilized after service reductions and the recent employee MOU, while vehicle maintenance costs are anticipated to stabilize due to the newer fleet from recent replacement. Overhead cost allocations to the general fund are expected to increase with the inclusion of building charges plus central government expenses in

15
the city’s updated cost allocation plan. Fuel expenditures are also expected to continue to increase.
TDA funds and fare revenue are the primary sources to fund operations. Dixon’s TDA forecast for operations is net of its contribution to the intercity funding agreement, intercity taxi, and for STA planning. FTA 5311 grant monies are reasonably available for operations and are based on the median amount of revenues received by the city. State Transit Assistance Funds are assumed to decline slightly from current year figures due to the Governor’s proposed budget for FY 2013-14. Dixon received over $500,000 in STA Lifeline funds for three years which are now depleted. Also, ARRA funds that were used to reduce intercity transit service contributions are depleted, resulting in a need to restore contribution levels by participating agencies such as Dixon.
It is assumed that TDA funds will grow marginally during the forecast period given some improvement that is expected in the economy in the coming years. While TDA revenues in Solano County have grown an average of almost 5 percent per year over the last 20 years (in actual dollars), the average figure factors in both economic peaks and valleys over a long time period. Because of the relatively short forecast period and to remain conservative, TDA growth rates are assumed to follow the forecasted Consumer Price Index for the San Francisco Consolidated Metropolitan Statistical Area (CMSA) developed by the State Department of Finance. The CPI forecast, which goes through FY 2015-16, assumes a 2 percent growth rate per year. The TSP forecast follows this trend. Also, accounting for continued level of some economic growth that is expected to occur slowly in the future, the TSP shows 3 percent growth per year for the last two years of the forecast.
Unallocated TDA funds for Dixon would be available in the short term to balance a shortfall in the level of service until the City makes a decision on whether to retain the current dial-a-ride system or move to another alternative.
Regarding the train station near downtown Dixon, the City funds most expenses from the Public Works Operating Budgets. A few expenses, interior utilities and alarm, are paid by the building tenant. No funds from transit are used to maintain the train station. The Market Lane Park and Ride Lot where Intercity Route 30 stops has no City funding at this time for pavement maintenance although the lot is 14 years old.
The baseline revenue service hours are based on the City of Dixon’s FY 2012-13 TDA Claim. The claim indicates revenue service hours to be 7,500 for FY 2012-13. This is a reduction from the City’s revenue service hour estimate of 7,800 for FY 2011-12 in the claim.
Federal 5310 capital funds, remaining Proposition 1B revenue based funds (the program is expected to sunset in 2017), and matching TDA funds are projected to be used for replacement vehicles and bus amenities. Three replacement vehicles are anticipated to be purchased during the next five years with existing funding sources. However, one minivan and four cutaway vehicles that will be at the end of their useful lives will also need replacement by FY 2018. The minivan will need replacement by FY 2017, and the cutaway vehicles in FY 2018. Replacement

16
of these vehicles will be dependent on the direction taken by the city on future service delivery and subsequent vehicle needs.
Vehicle replacement unit costs are based on the most recent MTC regional bus/van pricelist for FYs 2012-13 and FY 2013-14 for Transit Capital Priorities Call for Projects. Unit costs for cutaway vehicles are assumed at $82,000, and minivans at $55,000. The pricelist assumes a 2 percent annual growth in vehicle cost. The radio communications cost is based on the City of Dixon’s budget and Proposition 1B amount.
A listing of capital projects by year include:
FY 2012-13: Procure radio equipment. FY 2013-14: Procure one replacement cutaway bus. FY 2014-15: Procure one replacement cutaway bus. FY 2016-17: Procure two replacement minivans. FY 2017-18: Procure four replacement cutaway buses. The financial forecast data is expressed in year of expenditure. As shown in the forecast, Dixon will operate at an annual deficit under current conditions. However, TDA carryover funds are sufficient to cover the deficit through the forecast period; however the carryover will diminish over time. A combination of TDA, Proposition 1B, and federal 5310 revenues are anticipated to fund the vehicle replacements during the forecast.
Financial Projections - City of Dixon Readi Ride Capital and Operating
(Numbers are expressed in Year of Expenditure $) Fiscal Year FY 12-13 FY 13-14 FY 14-15 FY 15-16 FY 16-17 FY 17-18 Capital Expense Vehicle Replacement $82,000 $84,000 $117,000 $355,000 Radio Equipment $21,000 Total $21,000 $82,000 $84,000 $0 $117,000 $355,000 Capital Revenue Transportation Development Act $16,000 $17,000 $23,000 $60,900 Proposition 1B (1) $21,000 $10,100 FTA 5310 (2) $66,000 $67,000 $94,000 $284,000 Total $21,000 $82,000 $84,000 $0 $117,000 $355,000 Annual Net Surplus/Deficit - Capital $0 $0 $0 $0 $0 $0 Cumulative Net Surplus/Deficit - $0 $0 $0 $0 $0 $0

17
Financial Projections - City of Dixon Readi Ride Capital and Operating
(Numbers are expressed in Year of Expenditure $) Fiscal Year FY 12-13 FY 13-14 FY 14-15 FY 15-16 FY 16-17 FY 17-18 Capital Operating Expense Operations (3) $647,000 $660,000 $673,000 $686,000 $700,000 $714,000 Operating Revenue Fares (4) $82,000 $84,000 $86,000 $88,000 $90,000 $92,000 Transportation Development Act (5) $500,000 $510,000 $520,000 $530,000 $546,000 $562,000 State Transit Assistance Fund (6) $5,200 $4,900 $4,900 $4,900 $4,900 $4,900 FTA 5311 (7) $32,000 $60,000 $60,000 $60,000 $60,000 $60,000 Total $619,200 $658,900 $670,900 $682,900 $700,900 $718,900 Annual Net Surplus/Deficit - Operations -$27,800 -$1,100 -$2,100 -$3,100 $900 $4,900 Cumulative Net Surplus/Deficit - Operations -$27,800 -$28,900 -$31,000 -$34,100 -$33,200 -$28,300 Transportation Development Act Carryover $297,000 $269,200 $252,100 $233,000 $229,900 $207,800 Annual Operations Balance -$27,800 -$1,100 -$2,100 -$3,100 $900 $4,900 TDA Capital Uses $0 -$16,000 -$17,000 $0 -$23,000 -$60,900 Net Carryover $269,200 $252,100 $233,000 $229,900 $207,800 $151,800 (1) Proposition 1B revenue program is expected to sunset in 2017. (2) FTA Section 5310 is a competitive program for which Dixon Readi Ride is eligible. FTA 5311 funds would be a backing to the competitive program for capital replacement. (3) Operations cost grow by 2% per year based on recent historic growth, including increased overhead costs, stable labor costs, and stable vehicle maintenance costs from newer fleet. (4) Fares increase 2% per year to reflect stable ridership after earlier service reductions.
(5) Transportation Development Act operating revenues are based on the claim amount made by the City for FY 2012-13. The revenues are net of Intercity Fund Agreement, Intercity Taxi, and STA Planning totaling an additional $132,000 of Dixon’s TDA. TDA grows by 2% annually for first three years, then 3% next two years, mirroring forecasted growth of SF CMSA CPI Forecast through FY 2015-16. (6) STAF reduction of 6% between FYs 2013 and 2014 based on proposed FY 2013-14 State budget. Revenue is held constant in forecast since STAF is volatile based on unpredictable diesel fuel sales. (7) FTA 5311 operating is based on historic revenues received by Dixon.

18
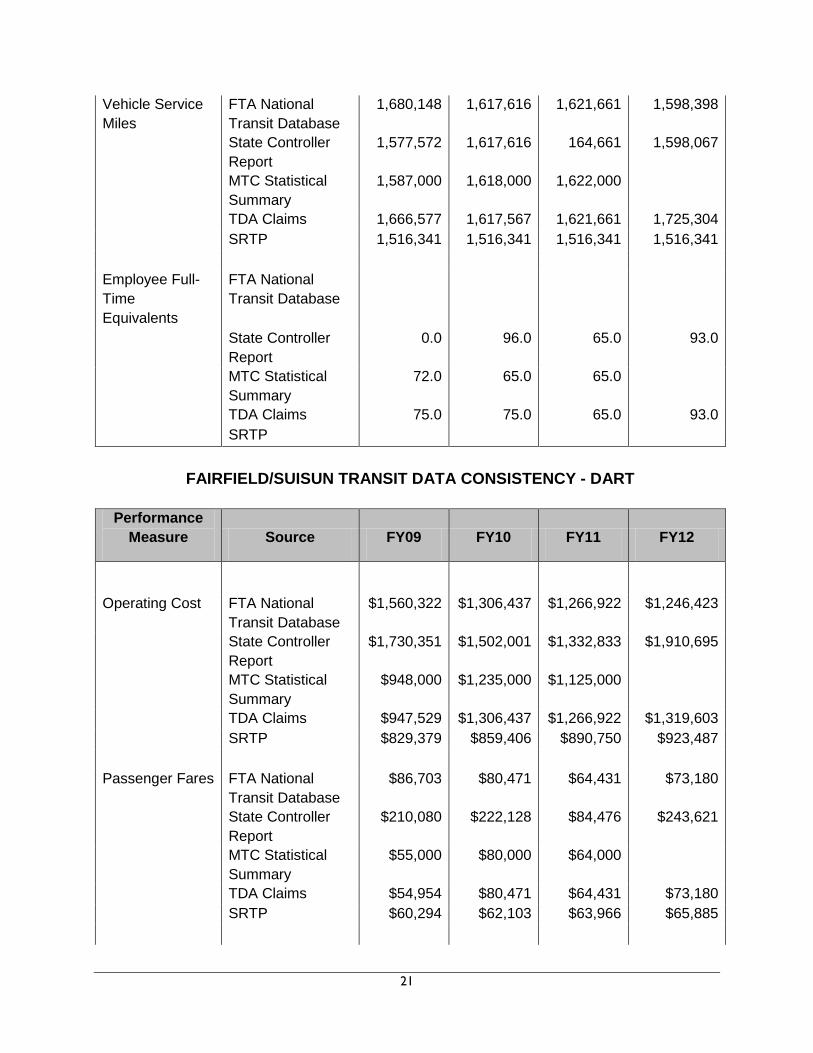
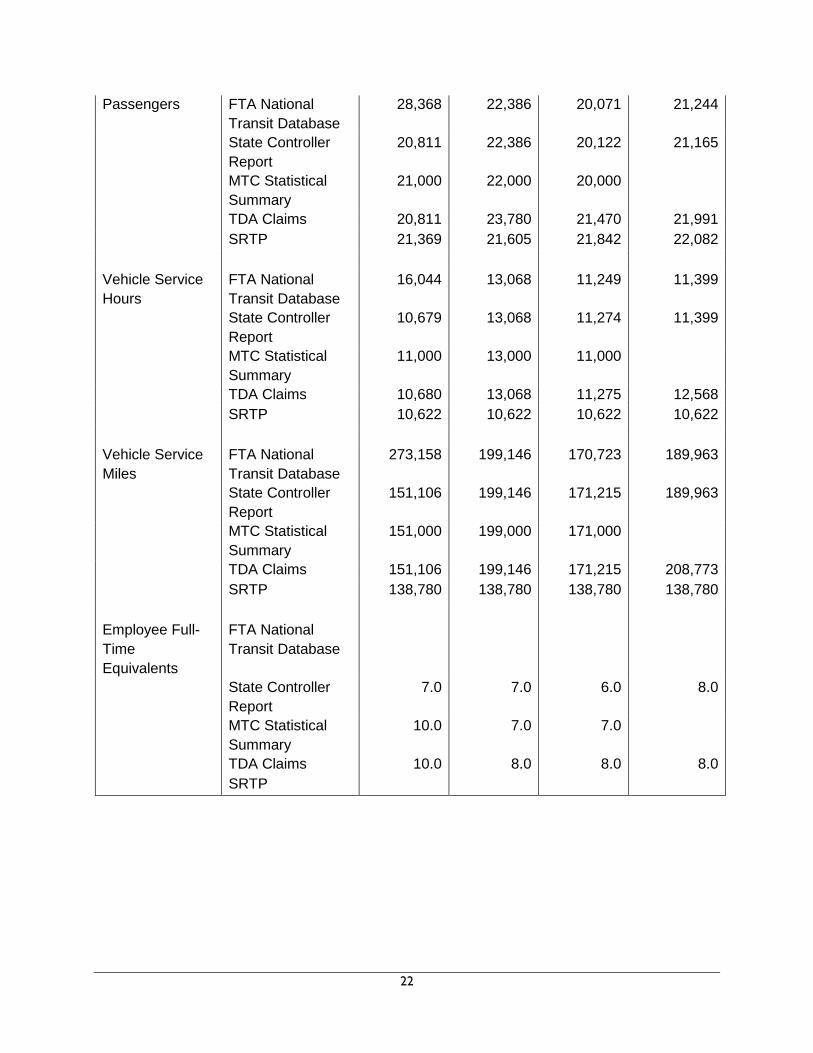
Fairfield and Suisun Transit (FAST) The following tables provide a summary of the financial and performance data for Fairfield And Suisun Transit. Data sources used to comprise the tables include TDA Claims, Fiscal Audits, National Transit Database, Comprehensive Annual Financial Reports, MTC Statistical Summary, and State Controller Reports. A review of other data sources including the Short Range Transit Plan and internal reports was also conducted. Data Consistency A comparison of key financial and operations data was undertaken to determine the general accuracy of the recording and reporting by City of Fairfield. With an understanding that various reports are submitted at different times on the state and federal levels, they are all prepared after the end of the fiscal year and ideally should match. One exception is the SRTP data which are projections from when the study was prepared in early 2008. The listing of the data provides comparison to show discrepancies that may exist among the various data sources that portray the financial health of the transit system. Overall, the data sources provide relatively consistent information. The variability among some data sources is likely due to the aggregation of performance data. For example, DART data reported in the FTA National Transit Database for FY 2009 appears higher than other sources and likely contains all demand response systems including DART, Taxi, Senior Volunteer Program, and Solano Paratransit.
FAIRFIELD/SUISUN TRANSIT DATA CONSISTENCY - TOTAL SYSTEM
Performance Measure Source FY09 FY10 FY11 FY12
Total Operating Expenses
FTA National Transit Database
$9,291,307 $9,070,188 $9,766,146 $9,566,164
State Controller
Report $9,117,195 $9,429,393 $10,343,327 $10,575,244
Audited Financial Statements
$9,117,195 $9,429,393 $9,990,668 $10,510,428
MTC Statistical Summary
$8,219,000 $8,999,000 $9,649,000
TDA Claim $9,157,407 $9,421,605 $9,990,669 $10,148,564 SRTP $8,514,856 $8,323,924 $8,797,510 $9,089,744
Farebox Revenues
FTA National Transit Database
$2,105,682 $1,995,436 $2,092,434 $2,093,503
State Controller Report
$2,229,362 $2,137,093 $2,112,479 $2,254,357

19
Audited Financial Statements
$2,229,362 $2,137,093 $2,112,479 $2,254,204
MTC Statistical Summary
$2,074,000 $1,995,000 $2,092,000
TDA Claim $2,229,060 $2,137,093 $2,112,478 $2,254,357 SRTP $1,842,759 $1,829,214 $1,859,252 $1,889,820 Passengers FTA National
Transit Database 1,011,050 921,609 934,703 1,000,796
State Controller Report
1,005,395 921,609 949,760 976,219
MTC Statistical Summary
1,032,000 921,000 950,000
TDA Claims 1,045,630 962,853 989,197 1,005,818 SRTP 942,749 941,109 951,461 961,926 Vehicle Service Hours
FTA National Transit Database
94,196 97,696 96,012 95,300
State Controller Report
88,881 97,696 96,038 95,300
MTC Statistical Summary
90,000 98,000 96,000
TDA Claims 103,619 97,629 96,038 102,229 SRTP 94,941 86,058 86,058 86,058
Vehicle Service Miles
FTA National Transit Database
1,953,306 1,816,762 1,792,384 1,772,698
State Controller Report
1,728,678 1,816,762 335,876 1,598,067
MTC Statistical Summary
1,738,000 1,817,000 1,793,000
TDA Claims 1,958,564 1,816,713 1,792,876 1,987,246 SRTP 1,813,814 1,655,121 1,655,121 1,655,121
Employee Full-Time Equivalents
FTA National Transit Database
0.0 0.0 0.0 0.0
State Controller Report
7.0 103.0 71.0 93.0
MTC Statistical Summary
82.0 72.0 72.0
TDA Claims 85.0 83.0 73.0 101.0 SRTP 0.0 0.0 0.0

20
FAIRFIELD/SUISUN TRANSIT DATA CONSISTENCY - FIXED ROUTE
Performance Measure Source FY09 FY10 FY11 FY12
Operating Cost FTA National Transit Database
$7,730,985 $7,763,751 $8,499,224 $7,999,212
State Controller Report
$7,386,844 $7,927,392 $9,010,494 $8,664,549
MTC Statistical Summary
$7,271,000 $7,764,000 $8,524,000
TDA Claim $7,271,208 $7,763,751 $8,499,224 $8,442,843 SRTP $6,757,158 $7,158,208 $7,591,262 $7,841,296 Passenger Fares FTA National
Transit Database $2,018,979 $1,914,965 $2,028,003 2,010,583
State Controller Report
$2,019,282 $1,914,965 $2,028,003 2,214,307
MTC Statistical Summary
$2,019,000 $1,915,000 $2,028,000
TDA Claim $2,018,979 $1,914,965 $2,028,002 2,010,583 SRTP $1,631,376 $1,655,847 $1,680,684 $1,705,895
Passengers FTA National Transit Database
982,682 899,223 914,632 976,219
State Controller Report
984,584 899,223 929,638 976,219
MTC Statistical Summary
1,011,000 899,000 930,000
TDA Claims 978,854 899,222 929,638 976,219 SRTP 909,500 919,504 929,619 939,844 Vehicle Service Hours
FTA National Transit Database
78,152 84,628 84,763 81,516
State Controller Report
78,202 84,628 84,764 81,516
MTC Statistical Summary
79,000 85,000 85,000
TDA Claims 85,821 84,561 84,763 87,269 SRTP 75,436 75,436 75,436 75,436
21
Vehicle Service Miles
FTA National Transit Database
1,680,148 1,617,616 1,621,661 1,598,398
State Controller Report
1,577,572 1,617,616 164,661 1,598,067
MTC Statistical Summary
1,587,000 1,618,000 1,622,000
TDA Claims 1,666,577 1,617,567 1,621,661 1,725,304 SRTP 1,516,341 1,516,341 1,516,341 1,516,341
Employee Full-Time Equivalents
FTA National Transit Database
State Controller Report
0.0 96.0 65.0 93.0
MTC Statistical Summary
72.0 65.0 65.0
TDA Claims 75.0 75.0 65.0 93.0 SRTP
FAIRFIELD/SUISUN TRANSIT DATA CONSISTENCY - DART
Performance Measure Source FY09 FY10 FY11 FY12
Operating Cost FTA National Transit Database
$1,560,322 $1,306,437 $1,266,922 $1,246,423
State Controller Report
$1,730,351 $1,502,001 $1,332,833 $1,910,695
MTC Statistical Summary
$948,000 $1,235,000 $1,125,000
TDA Claims $947,529 $1,306,437 $1,266,922 $1,319,603 SRTP $829,379 $859,406 $890,750 $923,487 Passenger Fares FTA National
Transit Database $86,703 $80,471 $64,431 $73,180
State Controller Report
$210,080 $222,128 $84,476 $243,621
MTC Statistical Summary
$55,000 $80,000 $64,000
TDA Claims $54,954 $80,471 $64,431 $73,180 SRTP $60,294 $62,103 $63,966 $65,885
22
Passengers FTA National Transit Database
28,368 22,386 20,071 21,244
State Controller Report
20,811 22,386 20,122 21,165
MTC Statistical Summary
21,000 22,000 20,000
TDA Claims 20,811 23,780 21,470 21,991 SRTP 21,369 21,605 21,842 22,082
Vehicle Service Hours
FTA National Transit Database
16,044 13,068 11,249 11,399
State Controller Report
10,679 13,068 11,274 11,399
MTC Statistical Summary
11,000 13,000 11,000
TDA Claims 10,680 13,068 11,275 12,568 SRTP 10,622 10,622 10,622 10,622
Vehicle Service Miles
FTA National Transit Database
273,158 199,146 170,723 189,963
State Controller Report
151,106 199,146 171,215 189,963
MTC Statistical Summary
151,000 199,000 171,000
TDA Claims 151,106 199,146 171,215 208,773 SRTP 138,780 138,780 138,780 138,780
Employee Full-Time Equivalents
FTA National Transit Database
State Controller Report
7.0 7.0 6.0 8.0
MTC Statistical Summary
10.0 7.0 7.0
TDA Claims 10.0 8.0 8.0 8.0 SRTP

23
FAIRFIELD/SUISUN TRANSIT DATA CONSISTENCY - TAXI
Performance Measure Source FY09 FY10 FY11 FY12
Operating Cost TDA Claims $262,291 $298,046 $172,823 $330,669 SRTP $235,841 $242,916 $250,203 $257,709 Passenger Fares TDA Claims $117,197 $137,241 $14,706 $161,374 SRTP $103,046 $106,137 $109,321 $112,601
Passengers TDA Claims 7,557 4,514 4,039 3,614 SRTP
Vehicle Service Hours
TDA Claims 5,534 710 1,219
SRTP
Vehicle Service Miles
TDA Claims 120,406 27,270 36,095
SRTP
FAIRFIELD/SUISUN TRANSIT DATA CONSISTENCY - SENIOR VOLUNTEER DRIVER PROGRAM
Performance Measure Source FY09 FY10 FY11 FY12
Operating Cost TDA Claims $63,586 $53,371 $51,700 $55,449 SRTP $61,547 $63,394 $65,295 $67,252 Passenger Fares TDA Claims $6,181 $4,416 $5,339 $9,220 SRTP $4,978 $5,127 $5,281 $5,439
Passengers TDA Claims 33,395 35,337 4,039 4,275 SRTP

24
FAIRFIELD/SUISUN CITY TRANSIT CONSISTENCY -
SOLANO PARATRANSIT Performance Measure Source FY09
Operating Cost TDA Claims $612,793 SRTP $630,931 Passenger Fares TDA Claims $31,749 SRTP $43,065
Passengers TDA Claims 5,013 SRTP 11,880
Vehicle Service Hours TDA Claims 1,584 SRTP 8,883
Vehicle Service Miles TDA Claims 20,475 SRTP 158,693
Employee Full-Time Equivalents TDA Claims SRTP
Cost Drivers Cost drivers are expense items necessary to provide a particular service. Cost drivers for FAST include operations, maintenance, fuel and administration. The largest operations expense is for purchased transportation (contracted service), and the most significant cost driver in recent years is the higher costs associated with the new operating contract that became effective July 1, 2008. A breakdown of these costs is contained in the following tables. Within administration are administrative salaries and benefits costs for direct city transportation employees plus overhead charges to the transit system for city administrative support. The decline in salaries in 2011 was attributed to changeovers in transit management and furloughing city employees eight hours every two weeks. The percentage of each cost factor is derived relative to total operations costs. An approved overhead cost allocation plan is used as the basis to distribute general fund costs of city administrative and support services (e.g. city council, city manager, finance, clerk, etc.) to city programs like transit for reimbursement. Examples of the cost basis for support services charged to departments include program expenses, accounting amounts, and purchase orders.

25
Reimbursements for overhead costs charged to transit in the future will be about $350,000 per year, according to the City’s adopted 2012/2013 Budget. The majority of overhead costs are from public works management cost allocations that are based on the department’s organizational structure from past years. Cost Drivers
Fairfield/Suisun Transit 2009 2010 2011 2012
Salaries $505,449 $510,095 $468,989 $505,087 % Change 1% -8% 8%
Benefits $279,313 $300,946 $268,689 $269,622 % Change 8% -11% 0%
Cost Allocation $370,000 $396,000 $412,000 $364,000 % Change 7% 5% -12%
Fuel $1,092,911 $963,363 $1,246,6211 $1,499,739 % Change -12% 29% 20%
Salaries as a % of Total Operations Cost (minus depreciation)
6% 5% 5% 5%
Benefits as a % of Total Operations Cost (minus depreciation)
3% 3% 3% 3%
Cost Allocation as a % of Total Operations Cost (minus depreciation)
3% 3% 3% 3%
Fuel as a % of Total Operations Cost (minus depreciation)
12% 10% 12% 14%
Source: TDA Fiscal Audit FYs 09-12; TDA Claims Estimated FY 2012
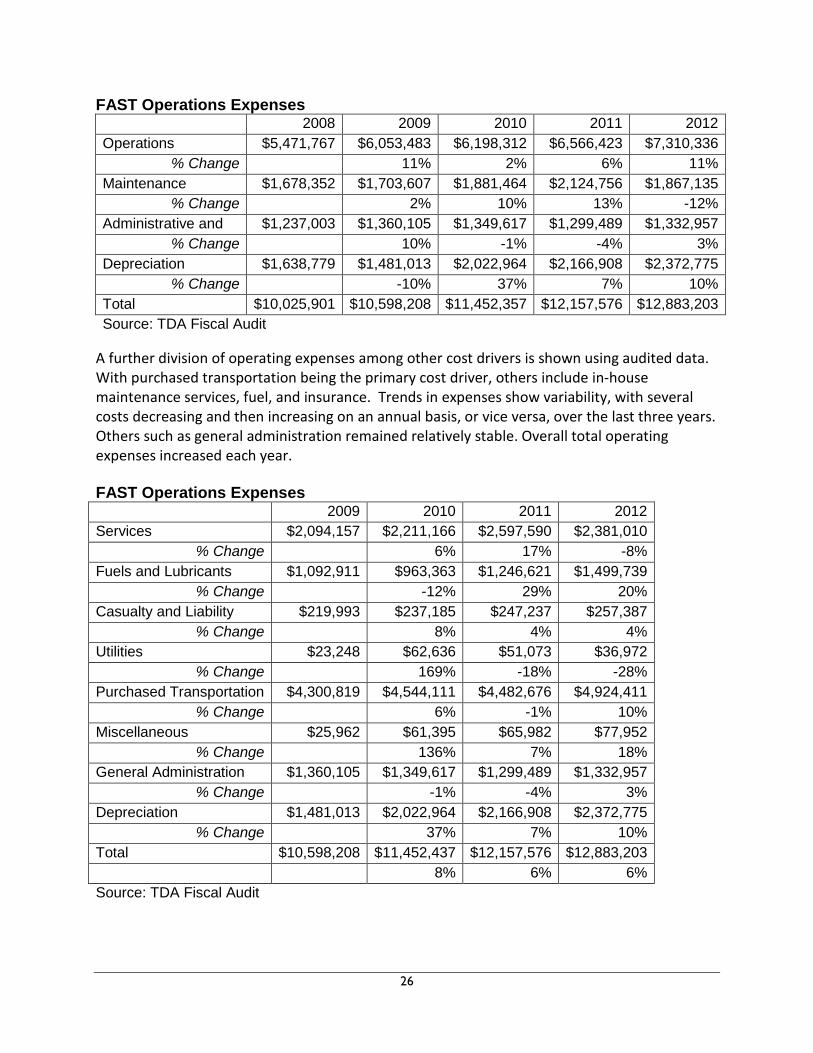
A breakdown of audited operations costs between operations, maintenance and administration is provided for the period of FYs 2007-08 through 2011-12. Contracted operations cost to run the service comprises about 66 percent of total cost (minus depreciation), in-house maintenance cost comprises 21 percent while city administrative costs comprise the remaining 13 percent.
26
FAST Operations Expenses 2008 2009 2010 2011 2012 Operations $5,471,767 $6,053,483 $6,198,312 $6,566,423 $7,310,336
% Change 11% 2% 6% 11% Maintenance $1,678,352 $1,703,607 $1,881,464 $2,124,756 $1,867,135
% Change 2% 10% 13% -12% Administrative and
$1,237,003 $1,360,105 $1,349,617 $1,299,489 $1,332,957
% Change 10% -1% -4% 3% Depreciation $1,638,779 $1,481,013 $2,022,964 $2,166,908 $2,372,775
% Change -10% 37% 7% 10% Total $10,025,901 $10,598,208 $11,452,357 $12,157,576 $12,883,203 Source: TDA Fiscal Audit
A further division of operating expenses among other cost drivers is shown using audited data. With purchased transportation being the primary cost driver, others include in-house maintenance services, fuel, and insurance. Trends in expenses show variability, with several costs decreasing and then increasing on an annual basis, or vice versa, over the last three years. Others such as general administration remained relatively stable. Overall total operating expenses increased each year. FAST Operations Expenses 2009 2010 2011 2012 Services $2,094,157 $2,211,166 $2,597,590 $2,381,010
% Change 6% 17% -8% Fuels and Lubricants $1,092,911 $963,363 $1,246,621 $1,499,739
% Change -12% 29% 20% Casualty and Liability $219,993 $237,185 $247,237 $257,387
% Change 8% 4% 4% Utilities $23,248 $62,636 $51,073 $36,972
% Change 169% -18% -28% Purchased Transportation $4,300,819 $4,544,111 $4,482,676 $4,924,411
% Change 6% -1% 10% Miscellaneous $25,962 $61,395 $65,982 $77,952
% Change 136% 7% 18% General Administration $1,360,105 $1,349,617 $1,299,489 $1,332,957
% Change
-1% -4% 3% Depreciation $1,481,013 $2,022,964 $2,166,908 $2,372,775
% Change 37% 7% 10% Total $10,598,208 $11,452,437 $12,157,576 $12,883,203 8% 6% 6% Source: TDA Fiscal Audit

27
Performance Trends The following tables provide information on performance indicators and trends of the transit system. Industry performance measures are used including operating costs, fare revenues, ridership, revenue hours and miles, and full time equivalents. The general trend in fixed route and demand response services for fiscal years 2009 through 2012 shows less cost efficiency and effectiveness measured in cost per hour and per passenger, and farebox recovery. Subsidy per passenger also increased over the period although improving the last year. Service effectiveness measured by passengers per hour shows an overall decline but showing improvement in the last year. Although service hours increased along with growth in costs, the rate of the increase in hours was slower, thereby resulting in decreased cost effectiveness. Other measures such as fare revenue, ridership, and service miles either declined or grew at a slower pace than the growth in operating costs which impact the performance indicator trends.
FAIRFIELD/SUISUN TRANSIT
PERFORMANCE INDICATORS - FIXED ROUTE Statistics & % Change
Performance Indicators FY 08-09 FY 09-10 FY 10-11 FY 11-12 FY09-FY12
Operating Costs $7,271,2
$7,763,75
$8,499,22
$8,664,549 19.2% Annual % Change 6.8% 9.5% 1.9%
Passengers 982,682 899,223 914,632 976,219 -0.7% Annual % Change -8.5% 1.7% 6.7%
Vehicle Service Hours 78,152 84,628 84,763 81,516 4.3% Annual % Change 8.3% 0.2% -3.8%
Vehicle Service Miles 1,680,14
1,617,616 1,621,661 1,598,067 -4.9% Annual % Change -3.7% 0.3% -1.5%
Employee FTEs 72.0 65.0 65.0 93.0 29.2% Annual % Change -9.7% 0.0% 43.1%
Fare Revenue $2,018,9
$1,914,96
$2,028,00
$2,214,307 9.7% Annual % Change -5.2% 5.9% 9.2%
Operating Cost per Passenger
$7.40 $8.63 $9.29 $8.88 20.0%
Annual % Change 16.7% 7.6% -4.5% Operating Cost per Vehicle Service Hour
$93.04 $91.74 $100.27 $106.29 14.2%
Annual % Change -1.4% 9.3% 6.0% Passengers per Vehicle Service Hour
12.57 10.63 10.79 11.98 -4.8%
Annual % Change -15.5% 1.6% 11.0% Passengers per Vehicle Service Mile
0.58 0.56 0.56 0.61 4.4%
Annual % Change -5.0% 1.5% 8.3%

28
Veh Service Hours per Employee FTE
1,085 1,302 1,304 877 -19.2%
Annual % Change 19.9% 0.2% -32.8% Fare per Passenger $2.05 $2.13 $2.22 $2.27 10.4%
Annual % Change 3.7% 4.1% 2.3% Subsidy per passenger $5.34 $6.50 $7.08 $6.61 23.6%
Annual % Change 21.7% 8.8% -6.6% Farebox Recovery 27.8% 24.7% 23.9% 25.6% -8.0%
Annual % Change -11.2% -3.3% 7.1% Percentage Change Consumer Price Index (Bay Area CPI)
1.8% 1.2% 1.7% 2.8% 51.9%
Source: Operating Cost and Fares from TDA Claims Actual FY 09&10, NTD FY 11, State Controller Report FY12 FY 09-11 Passengers, Hours, and Miles from NTD, FY 12 from State Controller FY 09-11 Employee FTEs from MTC Statistical Summary, FY 12 from State Controller
FAIRFIELD/SUISUN TRANSIT PERFORMANCE INDICATORS - DART
Statistics & % Change Performance Indicators FY 08-09 FY 09-10 FY 10-11 FY 11-12 FY09-FY12
Operating Costs $947,529 $1,306,43
$1,266,9
$1,246,423 31.5% Annual % Change 37.9% -3.0% -1.6%
Passengers 20,811 22,386 20,071 21,165 1.7% Annual % Change 7.6% -10.3% 5.5%
Vehicle Service Hours 10,680 13,068 11,249 11,399 6.7% Annual % Change 22.4% -13.9% 1.3%
Vehicle Service Miles 151,106 199,146 170,723 189,963 25.7% Annual % Change 31.8% -14.3% 11.3%
Employee FTEs 10.0 7.0 7.0 8.0 -20.0% Annual % Change -30.0% 0.0% 14.3%
Fare Revenue $54,954 $80,471 $64,431 $73,180 33.2% Annual % Change 46.4% -19.9% 13.6%
Operating Cost per Passenger
$45.53 $58.36 $63.12 $58.89 29.3%
Annual % Change 28.2% 8.2% -6.7% Operating Cost per Vehicle Service Hour
$88.72 $99.97 $112.63 $109.34 23.2%
Annual % Change 12.7% 12.7% -2.9% Passengers per Vehicle Service Hour
1.95 1.71 1.78 1.86 -4.7%
Annual % Change -12.1% 4.2% 4.1%
29
Passengers per Vehicle Service Mile
0.14 0.11 0.12 0.11 -19.1%
Annual % Change -18.4% 4.6% -5.2% Veh Service Hours per Employee FTE
1,068 1,867 1,607 1,425 33.4%
Annual % Change 74.8% -13.9% -11.3% Fare per Passenger $2.64 $3.59 $3.21 $3.46 30.9%
Annual % Change 36.1% -10.7% 7.7%
Subsidy per passenger $42.89 $54.76 $59.91 $55.43 29.2%
Annual % Change 27.7% 9.4% -7.5% Farebox Recovery 5.8% 6.2% 5.1% 5.9% 1.2%
Annual % Change 6.2% -17.4% 15.4% Percentage Change Consumer Price Index (Bay Area CPI)
1.8% 1.2% 1.7% 2.8% 51.9%
Source: Operating Cost, Passengers, Hours, Miles and Fares from TDA Claims Actual FY 09&10, NTD FY 11&12 FY 09-11 Employee FTEs from MTC Statistical Summary, FY 12 State Controller Report
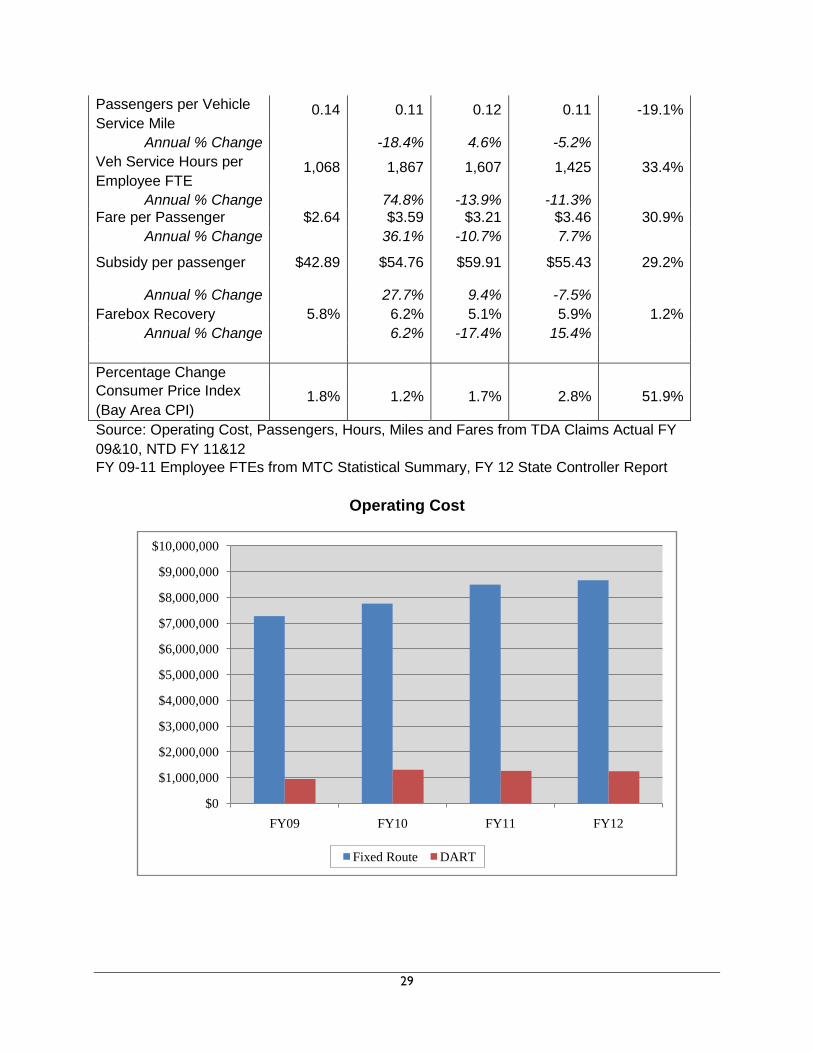
Operating Cost
$0
$1,000,000
$2,000,000
$3,000,000
$4,000,000
$5,000,000
$6,000,000
$7,000,000
$8,000,000
$9,000,000
$10,000,000
FY09 FY10 FY11 FY12
Fixed Route DART

30
Ridership
Operating Cost Per Passenger
0
200,000
400,000
600,000
800,000
1,000,000
1,200,000
FY09 FY10 FY11 FY12
Fixed Route DART
$0.00
$10.00
$20.00
$30.00
$40.00
$50.00
$60.00
$70.00
FY09 FY10 FY11 FY12
Fixed Route DART
31
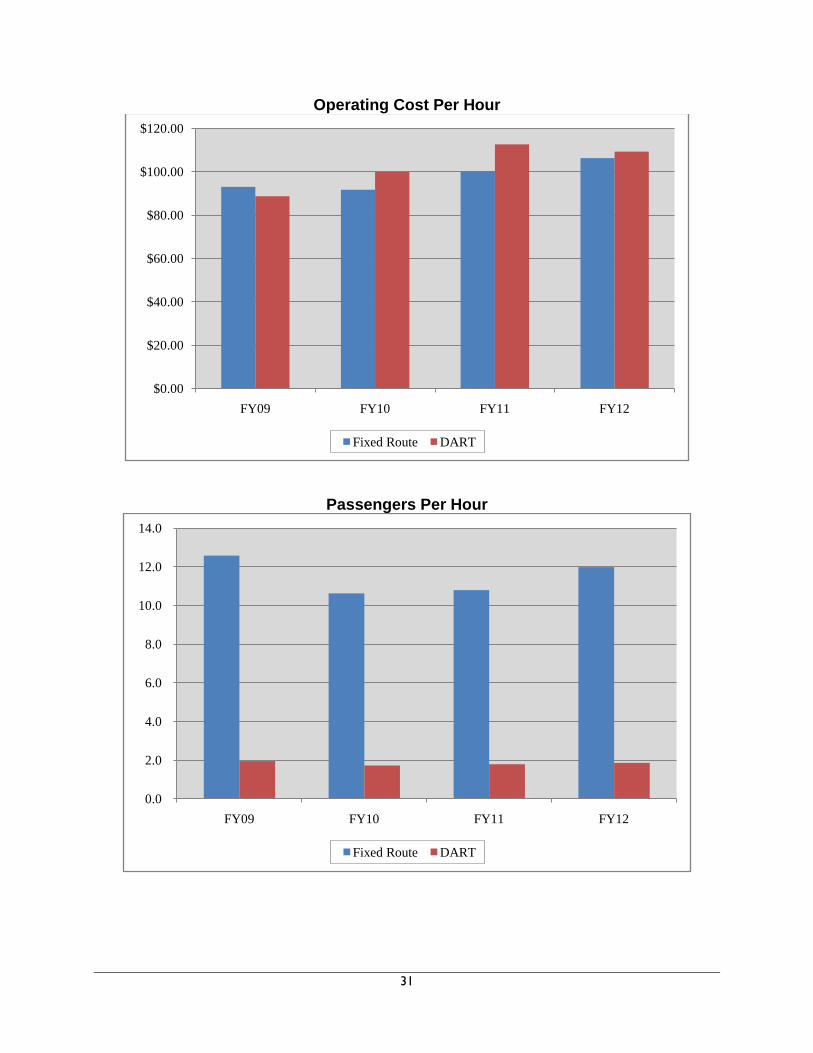
Operating Cost Per Hour
Passengers Per Hour
$0.00
$20.00
$40.00
$60.00
$80.00
$100.00
$120.00
FY09 FY10 FY11 FY12
Fixed Route DART
0.0
2.0
4.0
6.0
8.0
10.0
12.0
14.0
FY09 FY10 FY11 FY12
Fixed Route DART

32
Farebox Recovery
Performance Against SRTP Standards The SRTP for FAST provided projections of performance indicators for each transit mode. A sampling of performance indicators and the current status of fixed route and demand response meeting their respective projections are shown.
Performance Measure SRTP
Standard FAST Actual (FY 10-11)
Standard Met?
Operating Cost per Hour
Fixed Route $100.63 $100.27 Yes
DART $83.86 $112.63 No
Operating Cost per Passenger
Fixed Route $8.17 $9.29 No
DART $40.78 $63.12 No
Passengers per Hour
Fixed Route 12.3 10.8 No
DART 2.1 1.8 No
0.0%
5.0%
10.0%
15.0%
20.0%
25.0%
30.0%
FY09 FY10 FY11 FY12
Fixed Route DART
33
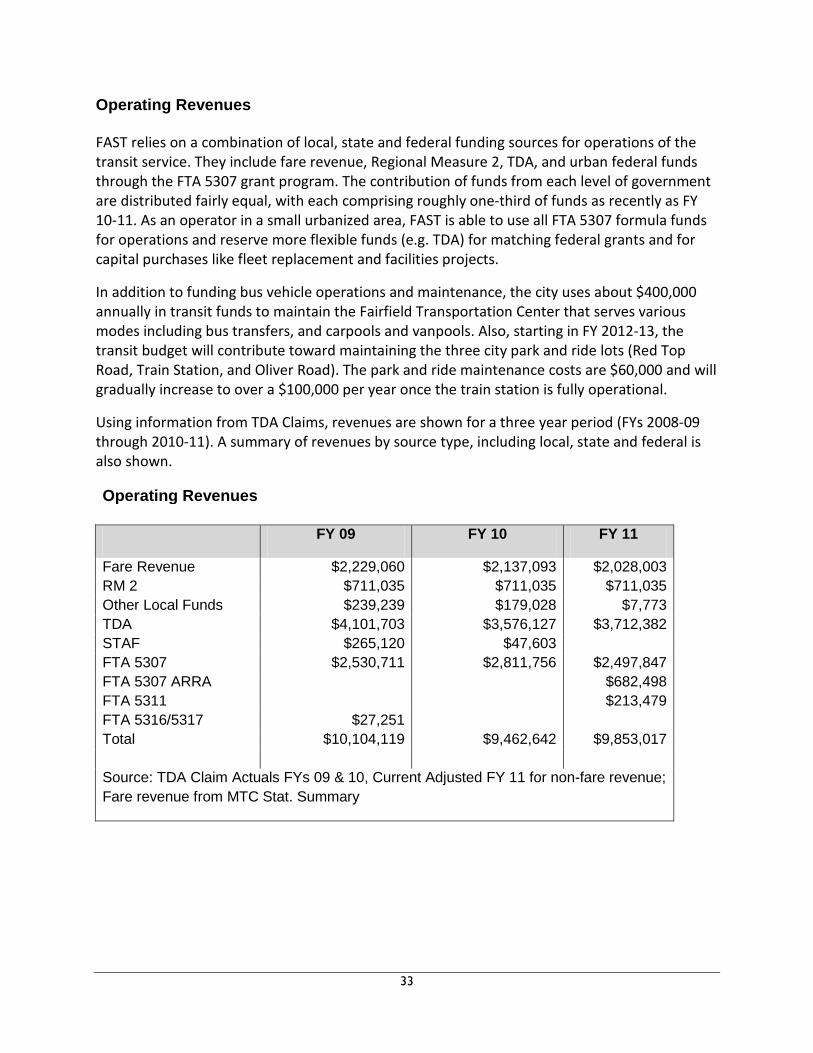
Operating Revenues FAST relies on a combination of local, state and federal funding sources for operations of the transit service. They include fare revenue, Regional Measure 2, TDA, and urban federal funds through the FTA 5307 grant program. The contribution of funds from each level of government are distributed fairly equal, with each comprising roughly one-third of funds as recently as FY 10-11. As an operator in a small urbanized area, FAST is able to use all FTA 5307 formula funds for operations and reserve more flexible funds (e.g. TDA) for matching federal grants and for capital purchases like fleet replacement and facilities projects.
In addition to funding bus vehicle operations and maintenance, the city uses about $400,000 annually in transit funds to maintain the Fairfield Transportation Center that serves various modes including bus transfers, and carpools and vanpools. Also, starting in FY 2012-13, the transit budget will contribute toward maintaining the three city park and ride lots (Red Top Road, Train Station, and Oliver Road). The park and ride maintenance costs are $60,000 and will gradually increase to over a $100,000 per year once the train station is fully operational.
Using information from TDA Claims, revenues are shown for a three year period (FYs 2008-09 through 2010-11). A summary of revenues by source type, including local, state and federal is also shown.
Operating Revenues
FY 09 FY 10 FY 11
Fare Revenue $2,229,060 $2,137,093 $2,028,003 RM 2 $711,035 $711,035 $711,035 Other Local Funds $239,239 $179,028 $7,773 TDA $4,101,703 $3,576,127 $3,712,382 STAF $265,120 $47,603 FTA 5307 $2,530,711 $2,811,756 $2,497,847 FTA 5307 ARRA $682,498 FTA 5311 $213,479 FTA 5316/5317 $27,251 Total $10,104,119 $9,462,642 $9,853,017 Source: TDA Claim Actuals FYs 09 & 10, Current Adjusted FY 11 for non-fare revenue; Fare revenue from MTC Stat. Summary

34
Summary of Operating Revenues by Source Type
FY 09 % of Total FY 10
% of Total FY 11
% of Total
Local Revenues (fares, RM2, other)
$3,179,334 31% $3,027,156 32% $2,746,811 28%
State Funds (TDA) $4,366,823 43% $3,623,730 38% $3,712,382 38% Federal $2,557,962 25% $2,811,756 30% $3,393,824 34% Total $10,104,119 100% $9,462,642 100% $9,853,017 100%
Source: TDA Claims
Capital Revenues FAST has used several funding sources for capital expenditures including for vehicle replacement and facility improvement. Funding sources include FTA 5309 and 5307 ARRA, TDA, and State Proposition 1B. Federal ARRA funding is a one-time injection for capital projects, while Proposition 1B funding is set to expire by 2016. TDA reserve funds are drawn down to use as matching revenue for federal funds. Using National Transit Database information, revenues are shown for a three year period (FYs 2008-09 through 2010-11). The FTA 5309 funds have been used for design and construction of new transit facilities including the Fairfield/Vacaville Intermodal Train Station. A summary of revenues by source type is also shown.
Capital Revenues by Source FY 09 FY 10 FY 11
State Funds (TDA) $260,364 $1,229,170 $1,571,227 State Funds (Prop 1B) $324,399 FTA 5309 $557,651 $750,131 $1,422,954 FTA 5307 ARRA $2,301,240 Total $818,015 $1,979,301 $5,619,820 Source: National Transit Database
Summary of Capital Revenues by Source Type FY 09 % of Total FY 10 % of Total FY 11 % of Total
State Funds $260,364 32% $1,229,170 62% $1,895,626 34% FTA $557,651 68% $750,131 38% $3,724,194 66% Total $818,015 100% $1,979,301 100% $5,619,820 100%

35
Capital Expenses The SRTP for FAST identified a significant capital expenditure plan for a 10-year period that includes three transit center projects, facility improvements and vehicle replacements. The current age of the transit fleet remains a concern considering many active vehicles have or will surpass their useful lives. The oldest six buses date back to 1994 and 1996, but are scheduled to be replaced in 2013 and 2015. The majority of vehicles date to between 2002 and 2011. Nearly the entire intercity commuter fleet was purchased in 2003.
The City of Fairfield has budgeted for some vehicle replacement in the next year using primarily federal funds. However, the budget forecasts insufficient capital funds to replace all vehicles at the end of their useful lives and the city instead will continue to rely on vehicle maintenance. This will be the city’s strategy to prolong the life of the older transit fleet through engine overhauls and other maintenance practices. As contained in the city’s latest budget, the TDA cash balance for fixed route is anticipated to decline over the next five years as it is used for filling revenue gaps for operating and planned capital expenses. The future construction costs of the train station are not included in this analysis because no additional funding that could be used for transit operations or fleet replacement is budgeted for that project which will be funded primarily by toll bridge funds specifically designated for the project.
TDA Balance The Fairfield/Suisun City annual apportionment of Transportation Development Act Funds is about $4.4 million. According to funding information provided by the Solano Transportation Authority based on data from the Metropolitan Transportation Commission, after allocation for transit expenses for FY 2012-13, FAST has no remaining TDA balance held by MTC. However, Fairfield has retained over $2.7 million in TDA in its own accounts and plans to return this amount to MTC for future TDA allocations. FAST also has active, uncommitted TDA allocations of over $1.4 million that will be used to help fund planned capital expenditures beginning in FY 2012-13. Cost Containment A detailed service change proposal that significantly alters the local transit system was introduced in Spring 2012 that is anticipated to result in better efficiencies and a more user-friendly system. The Fairfield City Council approved the proposed service changes on August 21, 2012. FAST implemented the service changes that include replacing long, looping routes with those that follow a more lineal configuration in December 2012. The changes focus more on the local transit routes at the Fairfield Transportation Center, but also include timed transfers at the Solano Town Center, in Cordelia, and near the Wal-Mart on North Texas Street. While the changes are intended to increase service efficiencies and ridership, costs are expected to stabilize from the changes.
Transit management is currently working to reduce contract operations costs through negotiations with the private contractor. The existing operations contract became effective in

36
July 2008, and the city has exercised the two option years through FY 2013-14. A cost escalator clause included in the original contract has been a major cost driver in recent years, but the discussions with the contractor are focused on mitigating the impacts of this and other contract provisions.
The City of Fairfield implemented furloughs in the past three years resulting in a pay reduction of 10 percent. There have been no pay raises since implementation of furloughs.
Five-Year Financial Forecast A forecast of revenues and expenses for both operations and capital projects for FAST is presented for the next five-years. The forecast is based in part on the City of Fairfield’s FY 2013 budget and provides a base scenario that relies on stable funding streams for operations to sustain the transit system. TDA funds, Regional Measure 2, FTA 5307 grant monies, and fare revenue are the main revenue sources to fund operations. As FAST operates a number of Solano Express commuter routes, TDA contributions from other local jurisdictions are obtained through the intercity transit cost sharing agreement and are included in the fixed route bus revenue forecast.
Fairfield claimed all of its annual apportionment plus carryover, including the full amount for Suisun City, for transit services in FY 2013. Beginning in FY 2014, it is assumed the amounts claimed reflect only annual MTC apportionments, hence the decrease in TDA between FYs 2013 and 2014. However, Fairfield has retained over $2.7 million in TDA in its own accounts and plans to return this amount to MTC for future TDA allocations. The $2.7 million is shown separately in the forecast as TDA Reserves. FAST also has over $1.4 million remaining in TDA capital allocations from previous years.
It is assumed that TDA funds will grow marginally during the forecast period given some improvement that is expected in the economy in the coming years. While TDA revenues in Solano County have grown an average of almost 5 percent per year over the last 20 years (in actual dollars), the average figure factors in both economic peaks and valleys over a long time period. Because of the relatively short forecast period and to remain conservative, TDA growth rates are assumed to follow the forecasted Consumer Price Index for the San Francisco Consolidated Metropolitan Statistical Area (CMSA) developed by the State Department of Finance. The CPI forecast, which goes through FY 2015-16, assumes a 2 percent growth rate per year. The TSP forecast follows this trend. Also, accounting for continued level of some economic growth that is expected to occur slowly in the future, the TSP shows 3 percent growth per year for the last two years of the forecast.
FAST will use $50,000 per year of TDA to maintain the Suisun-Fairfield Train Station in Suisun City. This amount is subtracted from the total FAST TDA reserves at the bottom of the systemwide forecast each year.
FAST is currently in the first of two final option years for the operations contract which expires at the end of FY 2013-14. As part of structuring a new operations contract effective FY 2014-15, FAST transit management will work to negotiate lower cost rates. In this regard, the forecast

37
keeps operating costs constant between FYs 2014 and 2015 before incremental increases the following years.
Expenses designated to the fixed route system include local and commuter bus services, operations and maintenance of the Fairfield Transportation Center, and maintenance of three park and ride lots (Red Top Road, Fairfield/Vacaville Intermodal Train Station, and Oliver Road). Maintenance of the future train station park and ride lot is assumed beginning in FY 2014-15, while the other two lots incur expenses beginning in FY 2012-13. No maintenance expenses are included for the Fairfield/Vacaville Intermodal Train Station facilities exclusive of the park and ride lot.
The baseline revenue service hours are based on the FY 2011-12 City of Fairfield FAST National Transit Database. The NTD indicates revenue service hours to be 81,516 for fixed route and 11,399 for Dial-A-Ride.
On the capital side, as most TDA funds will be used to support operations, there is very little remaining for federal capital match requirements or procurements using TDA alone. Remaining capital TDA allocations from previous years will be used. State Transit Assistance Funds are projected to be available for capital projects, with over $1 million targeted for bus procurements in FY 2013 using carryover from prior years. The annual STAF revenue estimate is projected to be reduced by 6 percent in FY 2014 compared to FY 2013 based on the proposed FY 2013-14 State budget. Revenue for both capital and operations is held constant in the forecast since STAF is volatile based on unpredictable diesel fuel sales. Proposition 1B revenues remaining for bus stop improvements, security projects and revenue-based formula funding to FAST totals about $550,000.
A number of vehicles in the fleet will require replacement over the next five years based on age of the buses. FAST has indicated its strategy to prolong the useful lives of the vehicles through maintenance overhauls to defer capital replacement. This applies particularly to the commuter buses used for intercity service. Only three intercity buses are targeted for replacement during the five-year forecast using funding committed by the Solano Transportation Authority in procurements being managed by SolTrans. However, smaller older vehicles in the current fleet that have already had overhauls to extend bus lives are shown to be replaced in the forecast.
Vehicle replacement unit costs are based on the most recent MTC regional bus/van pricelist for FYs 2012-13 and FY 2013-14 for Transit Capital Priorities Call for Projects, unless vendor quotes were available. The pricelist assumes a 2 percent annual growth in vehicle cost. MTC Unit costs include cutaway vehicles at $112,000-$118,000 (Under/Over 26 feet), but FAST is in process of purchasing two 23-foot cutaway vehicles for $70,000 each; minivans at $54,000 although slightly used (less than 20,000 miles) Ford F-350 vans are readily available for under $25,000; and transit diesel buses at $517,000. Capital costs for maintenance shop equipment, small capital, and building improvements are provided by the City of Fairfield.
Eighteen vehicles ranging from minivans to paratransit vehicles to local fixed route buses are scheduled for replacement during the next five years. Additional local fixed route buses and large commuter buses are required to be replaced shortly after the forecast period. A listing of

38
vehicle replacement projects by year is shown. Maintenance shop equipment, small capital, and building improvements are funded per the City of Fairfield.
FY 12-13: Purchase of 6, 40 foot diesel-electric hybrid buses to replace 2-1994, 3-1996, and 1-2002 buses; 2, 23 foot paratransit vans; 2 support vehicles ; maintenance shop equipment; and small capital including engine replacements.
FY 13-14: Purchase 1 support vehicle; maintenance shop equipment and small capital including engine replacements.
FY 14-15: Purchase 1, 40 foot diesel-electric hybrid to replace the last 1996 bus; replacement of 1, 45 foot MCI through procurement managed by SolTrans; 2, 23 foot paratransit vehicles; maintenance shop equipment and small capital including engine replacements.
FY 15-16: Maintenance shop equipment and small capital including engine replacements.
FY 16-17: Replace 2, 45 foot MCIs through procurement managed by SolTrans; 1 support vehicle; maintenance shop equipment and small capital including engine replacements.
FY 17-18: Maintenance shop equipment and small capital including engine replacements.
The financial forecast data is expressed in year of expenditure. As shown in the forecast, FAST will operate with revenues and expenses in approximate balance for the forecast period. However, FAST will face significant costs for buses that will need to be replaced soon after the forecast period.
The adopted City of Fairfield budget anticipates a very significant cost decrease in the new operations contract that will take effect in FY 2014-15 in order to balance operating revenues and costs. The assumed decrease in the operations contract in the city’s budget is almost $1 million. While this was considered in development of the TSP, rather than show a significant decline in operating expenses, the TSP forecast holds fixed route and paratransit operating costs constant between FYs 2014 and 2015 to reflect some level of savings from the new contract. The assumption about the cost of the new operations contract in FY 2014-15 is one of the primary factors in whether FAST could continue operating its existing service and still have reserves for future bus replacements.
FAST management has indicated they are developing strategies to both reduce operating costs and increase operating revenues. In addition to the ongoing discussions with the current operations contractor for cost reductions in the final year of the current contract, FAST will structure the request for proposals (RFP) for a new contract to reduce costs. The most promising prospect for increasing operating revenues is the implementation of parking fees at the park and ride lots owned by the City. The City currently has two park and ride facilities with a total of 854 spaces and has funding for a third lot expected to open in early 2014 with estimated 180 spaces in design. The potential revenues that could be generated by restructuring advertising contracts is not expected to be a major factor in this size operation, so FAST will need to consider a combination of fare increases and service reductions if it not successful in reducing costs and generating parking revenues.

39
Financial Projections - Fixed Route Capital and Operating
(Numbers are expressed in Year of Expenditure $) Fiscal Year
FY 12-13 FY 13-14 FY 14-15 FY 15-16 FY 16-17 FY 17-18
Capital Expense
Vehicle Replacement (1) $4,450,000 $130,000 $1,750,700 $100,000 $2,096,100 $100,000
Bus Stop Improvements $80,000 $340,000 $0 $0 $0 $0
Maint. Shop Equipment $100,000 $103,000 $106,000 $109,000 $113,000 $116,000
Misc. Small Capital $100,000 $103,000 $106,000 $109,000 $113,000 $116,000
Facilities $820,000 $1,912,000 $3,700,000 $1,150,000 $100,000 $0
Total $5,550,000 $2,588,000 $5,662,700 $1,468,000 $2,422,100 $332,000
Capital Revenue Transportation Development Act $1,429,200 $471,000 $566,700 $318,000 $461,000 $332,000 State Transit Assistance Fund (2) $1,047,100 $0 $0 $0 $387,600 $0
Proposition 1B $942,300 $333,500 $931,700 $0 $1,573,500 $0
RM2 $400,000 $3,600,000 $1,150,000 Misc FTA (Earmarks, Lifeline, Grants) $631,400 $1,383,600
FTA 5309 $1,500,000 $0 $0 $0 $0 $0
FTA 5339 $0 $0 $564,300
Total $5,550,000 $2,588,100 $5,662,700 $1,468,000 $2,422,100 $332,000
Annual Net Surplus/Deficit - Capital $0 $100 $0 $0 $0 $0 Cumulative Net Surplus/Deficit - Capital $0 $100 $100 $100 $100 $100
Operating Expense
Fixed Route (3) $8,389,000 $8,641,000 $8,641,000 $8,900,000 $9,167,000 $9,442,000 Fairfield Transportation Center $336,000 $338,000 $340,000 $342,000 $344,000 $346,000 Park & Ride Lots (Red Top, Oliver, Train Station) $60,000 $62,000 $108,000 $117,000 $126,000 $129,000
Cost Allocation $307,000 $312,000 $307,000 $310,000 $316,000 $325,000
Total $9,092,000 $9,353,000 $9,396,000 $9,669,000 $9,953,000 $10,242,000
Operating Revenue

40
Financial Projections - Fixed Route Capital and Operating
(Numbers are expressed in Year of Expenditure $) Fiscal Year
FY 12-13 FY 13-14 FY 14-15 FY 15-16 FY 16-17 FY 17-18
Fares (4) $2,110,000 $2,152,000 $2,195,000 $2,239,000 $2,284,000 $2,330,000
Other Income $106,000 $109,000 $111,000 $114,000 $117,000 $119,000
RM 2 $711,000 $711,000 $711,000 $711,000 $711,000 $711,000 Transportation Development Act (5) $2,993,000 $3,053,000 $3,114,000 $3,176,000 $3,271,000 $3,369,000 TDA Intercity Transit Cost Sharing $958,000 $977,000 $997,000 $1,017,000 $1,048,000 $1,079,000 State Transit Assistance Fund $0 $116,100 $116,100 $116,100 $116,100 $116,100
FTA 5307/5311 (6) $2,569,000 $2,452,000 $2,452,000 $2,452,000 $2,452,000 $2,452,000
Total $9,447,000 $9,570,100 $9,696,100 $9,825,100 $9,999,100 $10,176,100
Annual Net Surplus/Deficit - Operations $355,000 $217,100 $300,100 $156,100 $46,100 -$65,900 Cumulative Net Surplus/Deficit - Operations $355,000 $572,100 $872,200 $1,028,300 $1,074,400 $1,008,500 (1) Vehicle replacement includes replacement of intercity service commuter buses using funding committed by the Solano Transportation Authority in procurements being managed by SolTrans. (2) STAF for FY 2013 includes carryover of $923,947 plus fiscal year revenue estimate of $123,196. STAF reduction of 6% between FY 2013 revenue estimate of $123,196 and 2014 based on proposed FY 2013-14 State budget. Reduced revenue shown as operating revenues. STA operating revenue held constant since STAF is volatile based on unpredictable diesel fuel sales. (3) Fixed route operating costs increase by 3%, slightly above the forecasted growth in CPI for the San Francisco Consolidated Metropolitan Statistical Area (CMSA). Costs in FY 2014-15 remain the same as the prior year to reflect cost savings anticipated by FAST with a new operating contract. (4) Fares grow at 2% per year.
(5) TDA revenues are net of STA Planning ($127,000) and Intercity Service Agreement (SolTrans $101,000). TDA grows by 2% annually for first three years, then 3% next two years, mirroring forecasted growth of SF CMSA CPI Forecast through FY 2015-16. (6) FTA 5307 urban revenues of about $2.4 million based on MTC estimates for FYs 2013 and 2014. FTA 5311 rural revenues of $200,000 in FY 2013 based on STA allocation, and $50,000 thereafter.

41
Financial Projections - Paratransit and Local and Intercity Taxi Capital and Operating
(Numbers are expressed in Year of Expenditure $) Fiscal Year FY 12-13 FY 13-14 FY 14-15 FY 15-16 FY 16-17 FY 17-18 Capital Expense Vehicle Replacement $140,000 $0 $180,000 $0 $0 $0 Facilities $0 $0 $0 $0 $0 $0 Total $140,000 $0 $180,000 $0 $0 $0 Capital Revenue Transportation Development Act $79,200 $0 $180,000 $0 $0 $0 State Transit Assistance Fund $0 $0 $0 $0 $0 $0 Proposition 1B $60,800 $0 $0 $0 $0 $0 RM2 $0 $0 $0 $0 $0 $0 Misc FTA (Earmarks, Lifeline, Grants) $0 $0 $0 $0 $0 $0 FTA 5309 $0 $0 $0 $0 $0 $0 FTA 5339 $0 $0 $0 $0 $0 $0 Total $140,000 $0 $180,000 $0 $0 $0 Annual Net Surplus/Deficit - Capital $0 $0 $0 $0 $0 $0 Cumulative Net Surplus/Deficit - Capital $0 $0 $0 $0 $0 $0 Operating Expense
Paratransit (1) $1,279,000 $1,317,000 $1,317,000 $1,357,000 $1,398,000 $1,440,000 Local Taxi $130,000 $132,000 $136,000 $140,000 $144,000 $148,000 Intercity Taxi $150,000 $153,000 $158,000 $163,000 $168,000 $173,000 Volunteer Driver $54,000 $56,000 $58,000 $60,000 $62,000 $64,000 Cost Allocation Plan $39,000 $35,000 $40,000 $40,000 $41,000 $42,000 Fairfield Transportation Center $64,000 $66,000 $68,000 $70,000 $72,000 $74,000 Total $1,716,000 $1,759,000 $1,777,000 $1,830,000 $1,885,000 $1,941,000 Operating Revenue
Fares (2) $131,000 $134,000 $137,000 $140,000 $143,000 $146,000 Local Operating $246,000 $246,000 $246,000 $246,000 $246,000 $246,000

42
Financial Projections - Paratransit and Local and Intercity Taxi Capital and Operating
(Numbers are expressed in Year of Expenditure $) Fiscal Year FY 12-13 FY 13-14 FY 14-15 FY 15-16 FY 16-17 FY 17-18 Transportation Development Act (3) $1,391,000 $1,419,000 $1,447,000 $1,476,000 $1,520,000 $1,566,000 Total $1,768,000 $1,799,000 $1,830,000 $1,862,000 $1,909,000 $1,958,000 Annual Net Surplus/Deficit - Operations $52,000 $40,000 $53,000 $32,000 $24,000 $17,000 Cumulative Net Surplus/Deficit - Operations $52,000 $92,000 $145,000 $177,000 $201,000 $218,000
(1) Paratransit operating costs increase by 3%, slightly above the forecasted growth in CPI for the San Francisco Consolidated Metropolitan Statistical Area (CMSA). Costs in FY 2014-15 remain the same as the prior year to reflect cost savings anticipated by FAST with a new operating contract. (2) Fares grow at 2% per year.
(3) TDA grows by 2% annually for first three years, then 3% next two years, mirroring forecasted growth of SF CMSA CPI Forecast through FY 2015-16.
Financial Projections - Complete System (Fixed Route, Paratransit, Local Taxi and Intercity Taxi) Capital and Operating
(Numbers are expressed in Year of Expenditure $) Fiscal Year
FY 12-13 FY 13-14 FY 14-15 FY 15-16 FY 16-17 FY 17-18
Capital Expense
Vehicle Replacement (1) $4,590,000 $130,000 $1,930,700 $100,000 $2,096,100 $100,000
Bus Stop Improvements $80,000 $340,000 $0 $0 $0 $0
Maint. Shop Equipment $100,000 $103,000 $106,000 $109,000 $113,000 $116,000
Misc. Small Capital $100,000 $103,000 $106,000 $109,000 $113,000 $116,000
Facilities $820,000 $1,912,000 $3,700,000 $1,150,000 $100,000 $0
Total $5,690,000 $2,588,000 $5,842,700 $1,468,000 $2,422,100 $332,000
Capital Revenue Transportation Development Act $1,508,400 $471,000 $746,700 $318,000 $461,000 $332,000
State Transit Assistance Fund $1,047,100 $0 $0 $0 $387,600 $0

43
Financial Projections - Complete System (Fixed Route, Paratransit, Local Taxi and Intercity Taxi) Capital and Operating
(Numbers are expressed in Year of Expenditure $) Fiscal Year
FY 12-13 FY 13-14 FY 14-15 FY 15-16 FY 16-17 FY 17-18
Proposition 1B $1,003,100 $333,500 $931,700 $0 $1,573,500 $0
RM2 $0 $400,000 $3,600,000 $1,150,000 $0 $0 Misc FTA (Earmarks, Lifeline, Grants) $631,400 $1,383,600 $0 $0 $0 $0
FTA 5309 $1,500,000 $0 $0 $0 $0 $0
FTA 5339 $0 $0 $564,300 $0 $0 $0
Total $5,690,000 $2,588,100 $5,842,700 $1,468,000 $2,422,100 $332,000
Annual Net Surplus/Deficit - Capital $0 $100 $0 $0 $0 $0 Cumulative Net Surplus/Deficit - Capital $0 $100 $100 $100 $100 $100
Operating Expense
Operations $10,002,000 $10,299,000 $10,310,000 $10,620,000 $10,939,000 $11,267,000 Fairfield Transportation Center $400,000 $404,000 $408,000 $412,000 $416,000 $420,000
Park & Ride Lots $60,000 $62,000 $108,000 $117,000 $126,000 $129,000
Cost Allocation $346,000 $347,000 $347,000 $350,000 $357,000 $367,000
Total $10,808,000 $11,112,000 $11,173,000 $11,499,000 $11,838,000 $12,183,000
Operating Revenue
Fares $2,241,000 $2,286,000 $2,332,000 $2,379,000 $2,427,000 $2,476,000
Other Income $106,000 $109,000 $111,000 $114,000 $117,000 $119,000
Local Operating $246,000 $246,000 $246,000 $246,000 $246,000 $246,000
RM 2 $711,000 $711,000 $711,000 $711,000 $711,000 $711,000 Transportation Development Act (2) $4,384,000 $4,472,000 $4,561,000 $4,652,000 $4,791,000 $4,935,000 TDA Intercity Transit Cost Sharing $958,000 $977,000 $997,000 $1,017,000 $1,048,000 $1,079,000
State Transit Assistance Fund $0 $116,100 $116,100 $116,100 $116,100 $116,100
FTA 5307/5311 $2,569,000 $2,452,000 $2,452,000 $2,452,000 $2,452,000 $2,452,000
Total $11,215,000 $11,369,100 $11,526,100 $11,687,100 $11,908,100 $12,134,100
Annual Net Surplus/Deficit - Operations $407,000 $257,100 $353,100 $188,100 $70,100 -$48,900

44
Financial Projections - Complete System (Fixed Route, Paratransit, Local Taxi and Intercity Taxi) Capital and Operating
(Numbers are expressed in Year of Expenditure $) Fiscal Year
FY 12-13 FY 13-14 FY 14-15 FY 15-16 FY 16-17 FY 17-18 Cumulative Net Surplus/Deficit - Operations $407,000 $664,100 $1,017,200 $1,205,300 $1,275,400 $1,226,500
TDA Reserve (3) $2,760,000 $0 $0 $0 $0 $0
TDA Carryover (4) $1,422,800 $3,031,400 $2,767,500 $2,323,900 $2,144,000 $1,703,100
Annual Operations Balance $407,000 $257,100 $353,100 $188,100 $70,100 -$48,900 TDA Suisun Transit Station Maintenance (5) -$50,000 -$50,000 -$50,000 -$50,000 -$50,000 -$50,000
TDA Capital Uses -$1,508,400 -$471,000 -$746,700 -$318,000 -$461,000 -$332,000
Net Carryover $3,031,400 $2,767,500 $2,323,900 $2,144,000 $1,703,100 $1,272,200
(1) Vehicle replacement includes replacement of intercity service commuter buses using funding committed by the Solano Transportation Authority in procurements being managed by SolTrans. (2) TDA revenues are net of STA Planning ($127,000) and Intercity Service Agreement (SolTrans $101,000). Fairfield claimed all of its annual apportionment plus carryover, including the full amount for Suisun City, for transit services in FY 2013. Beginning in FY 2014, it is assumed the amounts claimed reflect only annual MTC apportionments and no carryover, hence the decrease in TDA between FYs 2013 and 2014. (3) Fairfield has retained $2.7 million in TDA reserves from past years that will be returned to MTC and included as part of future TDA carryover balances. (4) Fairfield claimed all TDA funds for FY 12-13, so there is no unallocated carryover for that year. However, Fairfield has $1.4 million of previously allocated TDA that can be used to reimburse capital project expenses. This amount is shown in the FY 2012-13 TDA Carryover. (5) $50,000 in annual TDA will be provided for maintenance of the Suisun-Fairfield Train Station in Suisun City.

45
City of Rio Vista Delta Breeze The following tables provide an initial summary of the historic financial and performance data for Rio Vista Delta Breeze. Data sources used to comprise the tables include TDA Claims, Fiscal Audits, National Transit Database, Comprehensive Annual Financial Reports, MTC Statistical Summary, and State Controller Reports. A review of other data sources including the Short Range Transit Plan was also conducted. Data Consistency
A comparison of key financial and operations data was undertaken to determine the general accuracy of the recording and reporting by City of Rio Vista staff. With an understanding that various reports are submitted at different times on the state and federal levels, they are all prepared after the end of the fiscal year and ideally should match. The listing of the data provides comparison to show discrepancies that exist among the various data sources that portray the financial health of the transit system.
RIO VISTA DATA CONSISTENCY - TOTAL SYSTEM
Performance Measure
Source FY09 FY10 FY11 FY12
Total Operating Expenses
FTA National Transit Database
$337,275 $443,832 $490,011 $556,149
State Controller Report $377,917 $440,967 $504,016 $556,149 Audited Financial
Statements $313,658 $386,135 $509,083
MTC Statistical
$337,000 $444,000 $472,000 TDA Claim $325,028 $386,135 $502,423 $525,536 SRTP $387,717 $505,996 Farebox Revenues FTA National Transit
Database $59,258 $103,451 $57,459 $53,775
State Controller Report $65,593 $45,141 $62,459 $53,775 Audited Financial
Statements $65,668 $108,038 $114,935
MTC Statistical
$59,000 $63,000 $62,000 TDA Claim $71,353 $68,783 $60,866 $42,125 SRTP $26,000 $62,213

46
RIO VISTA DATA CONSISTENCY - FIXED ROUTE
Performance Measure
Source FY09 FY10 FY11 FY12
Operating Cost TDA Claim $313,658 $364,649 $494,016 $525,286 MTC Statistical
$337,000 $444,000 $472,000
Passenger Fares TDA Claim $65,668 $58,038 $57,459 $42,000 MTC Statistical
$59,000 $63,000 $62,000
Passengers FTA National Transit
Database 11,180 14,399 13,431
State Controller Report 11,180 14,399 13,431 MTC Statistical
11,000 14,000 12,000
TDA Claims 11,196 14,648 13,431 15,050 SRTP 11,180 14,648 13,181 Vehicle Service Hours
FTA National Transit Database
4,572 5,825 5,475
State Controller Report 4,572 5,824 5,419 MTC Statistical
3,000 6,000 5,000
TDA Claims 3,130 5,825 5,475 5,500 SRTP 5,719 Vehicle Service Miles
FTA National Transit Database
78,959 123,679 130,151
State Controller Report 78,959 123,679 130,151 MTC Statistical
42,000 116,000 130,000
TDA Claims 42,138 123,679 130,151 126,000 SRTP 131,132 Employee Full-Time Equivalents
FTA National Transit Database
State Controller Report 6.0 8.0 10.0 MTC Statistical
6.0 12.0 12.0
TDA Claims 6.0 8.0 11.0 10.0

47
RIO VISTA DATA CONSISTENCY - TAXI SCRIP
Performance Measure
Source FY09 FY10 FY11 FY12
Operating Cost TDA Claim $11,370 $21,486 $8,407 $250 Passenger Fare TDA Claim $5,685 $10,745 $3,407 $125 Passengers FTA National Transit
Database 281 281 108
State Controller Report 119 281 99 TDA Claim 119 281 108 8 Vehicle Service Hours
FTA National Transit Database
259 259 108
State Controller Report 321 259 100 TDA Claim 321 259 108 3 Vehicle Service Miles
FTA National Transit Database
7,213 7,213 3,690
State Controller Report 3,018 7,213 3,390 TDA Claim 3,018 7,213 3,690 85 Employee Full-Time Equivalents
FTA National Transit Database
State Controller Report 2.0 2.0 2.0 TDA Claim 2.0 2.0 1.0 1.0
Cost Drivers Cost drivers are expense items necessary to provide a particular service. Cost drivers for Delta Breeze include operations, maintenance, fuel and administration. The percentage of administrative wages and benefits and fuel are derived relative to total operations costs. The transit manager was transitioned from a contractor to a city staff member in FY 2011 which increased administrative labor cost.

48
Cost Drivers
Rio Vista Delta Breeze
FY 2008 FY 2009 FY 2010 FY 2011 FY 2012
Salaries & Wages (direct and city admin. staff)
$16,403 $9,890 $10,788 $33,061 $31,378
Ann. % Chg. -40% 9% 206% -5%
Benefits (Direct Employee) $9,607 $6,634 $5,676 $10,987 $13,388
Ann. % Chg. -31% -14% 94% 22%
Fuel $29,759 $52,000 $50,000 $48,000 $53,000
Ann. % Chg. 75% -4% -4% 10%
Salaries & Wages as % of Total Operations Cost (minus Depreciation)
5% 3% 3% 6% 5%
Benefits as a % of Total Operations Cost (minus Depreciation)
3% 2% 1% 2% 2%
Fuel as % of Total Operations Cost (minus Depreciation)
10% 17% 13% 9% 9%
Source: Rio Vista Delta Breeze Transit Budget
A breakdown of audited operations costs between O&M and administration is provided for the period of FYs 2007-08 through 2010-11. The significant variance in expenses from one year to another makes it difficult to draw any initial trends or conclusions, although the general trend is an increase in overall costs. In FY 2008, the fiscal auditor treated some contractor fixed operations costs as administrative cost, and then charged administrative expenses into operations the next year. Delta Breeze Transit Operations Expenses
FY 2008 FY 2009 FY 2010 2011
Operations and Maintenance $136,540 $306,716 $353,506 $474,402
Ann. % Chg 125% 15% 34%
Administrative and General
$162,330 $6,942 $32,910 $34,681
Ann. % Chg -96% 374% 5%
Depreciation $11,053 $19,253 $23,269 $24,552
Ann. % Chg 74% 21% 6%
Total $309,923 $332,911 $409,685 $533,635
Source: TDA Fiscal Audits
A further division of operating expenses among other cost drivers is shown using audited data. The data shows that contract operations costs as well as supplies and materials increased

49
significantly between FYs 2009 and 2011. This increase is in line with expanded services that occurred over the past few years. Also, this was due to a change in operating contractors in FY 2010 from MV to Storer. Storer had much higher costs as compared to MV.
Delta Breeze Transit Operations Expenses FY 2009 FY 2010 FY 2011
Salaries and Benefits $17,135 $15,028 $34,681 % Change -12% 131%
Contract Services $221,831 $268,399 $315,190 % Change 21% 17%
Supplies and Materials $57,685 $82,371 $158,866 % Change 43% 93%
Insurance $2,313 $1,831 $103 % Change -21% -94%
Maintenance and Repair $725 $262 $0 % Change -64% -100%
Communications $932 $6,112 $93 % Change 556% -98%
Professional Services $13,037 $12,413 $144 % Change -5% -99%
Depreciation $19,253 $23,269 $24,552 % Change 21% 6%
Total $332,911 $409,685 $533,629 23% 30% Source: City of Rio Vista CAFR
Performance Trends The following tables provide information on performance indicators and trends of the transit system. Industry performance measures are used including operating costs, fare revenues, ridership, revenue hours and miles, and full time equivalents. The general trend for the fiscal years 2009 through 2011 shows less cost efficiency and effectiveness measured in cost per hours and per passenger, and farebox recovery. Service effectiveness measured by passengers per hour remained relatively stable, but below approved standards in the SRTP.
Fare revenues reported by the city have historically been comprised of several sources including passenger fares, River Delta Unified School District (RDUSD) contract revenue, Greyhound ticket sales commissions, and other miscellaneous funds. These revenues have generally been combined in the accounts of the City finance department when reporting on fare revenue, thus creating difficulties in separating true passenger fares from the other sources. Transit staff has begun to separate these sources to identify the actual base fares generated by the general public and students from riding Delta Breeze.

50
The SRTP reports that historically passenger fares alone have not been enough to meet the required farebox recovery ratio, and that the other local revenues are needed to meet the ratio. Since the historic data from published city reports do not separate passenger fares from local support revenue, the fare revenue in the tables include all the various sources. When including only passenger fares, the farebox ratio declines to about 5 percent according to the SRTP. Recent reconciliation of fare revenues by city transit staff show that pure passenger fare revenues from general public transit, school district ridership and taxi scrip is about $30,000.
RIO VISTA PERFORMANCE INDICATORS - TOTAL SYSTEM
Statistics & % Change Performance Indicators FY 08-09 FY 09-10 FY 10-11 FY09-FY11
Operating Costs $325,028 $386,135 $502,423 54.6% Annual % Change 18.8% 30.1%
Passengers 11,299 14,680 13,539 19.8% Annual % Change 29.9% -7.8%
Vehicle Service Hours 4,893 6,084 5,583 14.1% Annual % Change 24.3% -8.2%
Vehicle Service Miles 81,977 130,892 133,841 63.3% Annual % Change 59.7% 2.3%
Employee FTEs 8 10 12 50.0% Annual % Change 25.0% 20.0%
Fare Revenue (1) $65,668 $68,783 $60,866 -7.3% Annual % Change 4.7% -11.5%
Operating Cost per Passenger $28.77 $26.30 $37.11 29.0%
Annual % Change -8.6% 41.1% Operating Cost per Vehicle Service Hour
$66.43 $63.47 $89.99 35.5%
Annual % Change -4.5% 41.8% Passengers per Vehicle Service Hour 2.31 2.41 2.43 5.0%
Annual % Change 4.5% 0.5% Passengers per Vehicle Service Mile 0.14 0.11 0.10 -26.6%
Annual % Change -18.6% -9.8% Veh Service Hours per Employee FTE 612 608 465 -23.9%
Annual % Change -0.5% -23.5% Fare per Passenger $5.81 $4.69 $4.50 -22.6%
Annual % Change -19.4% -4.1% Subsidy per passenger $22.95 $21.62 $32.61 42.1%
Annual % Change -5.8% 50.9% Farebox Recovery Ratio 20.2% 17.8% 12.1% -40.0%
Annual % Change -11.8% -32.0%

51
Percentage Change Consumer Price Index (Bay Area CPI) 1.8% 1.2% 1.7%
(1) Fare revenue for FY11 excluding service extensions was $37,253, and operating cost was $476,365. Farebox excluding service extensions was 7.8%.
Source: Operating costs (FYs 09-10) and fare revenue (FY 09) from TDA Fiscal Audit Operating costs for FY 11 from TDA Claim Actual Fare Revenue (FY 10 and 11) from TDA Claim Actuals
RIO VISTA PERFORMANCE INDICATORS - FIXED ROUTE
Statistics & % Change Performance Indicators FY 08-09 FY 09-10 FY 10-11 FY09-FY11
Operating Costs $313,658 $364,649 $494,016 57.5% Annual % Change 16.3% 35.5%
Passengers 11,180 14,399 13,431 20.1% Annual % Change 28.8% -6.7%
Vehicle Service Hours 4,572 5,825 5,475 19.8% Annual % Change 27.4% -6.0%
Vehicle Service Miles 78,959 123,679 130,151 64.8% Annual % Change 56.6% 5.2%
Employee FTEs 6 8 11 83.3% Annual % Change 33.3% 37.5%
Fare Revenue $59,983 $58,038 $57,459 -4.2% Annual % Change -3.2% -1.0%
Operating Cost per Passenger $28.06 $25.32 $36.78 31.1%
Annual % Change -9.7% 45.2% Operating Cost per Vehicle Service Hour
$68.60 $62.60 $90.23 31.5%
Annual % Change -8.8% 44.1% Passengers per Vehicle Service Hour 2.45 2.47 2.45 0.3%
Annual % Change 1.1% -0.8% Passengers per Vehicle Service Mile 0.14 0.12 0.10 -27.1%
Annual % Change -17.8% -11.4% Veh Service Hours per Employee FTE 762 728 498 -34.7%
Annual % Change -4.4% -31.6% Fare per Passenger $5.37 $4.03 $4.28 -20.3%
Annual % Change -24.9% 6.1% Subsidy per passenger $22.69 $21.29 $32.50 43.3%
Annual % Change -6.2% 52.6% Farebox Recovery 19.1% 15.9% 11.6% -39.2%
Annual % Change -16.8% -26.9%
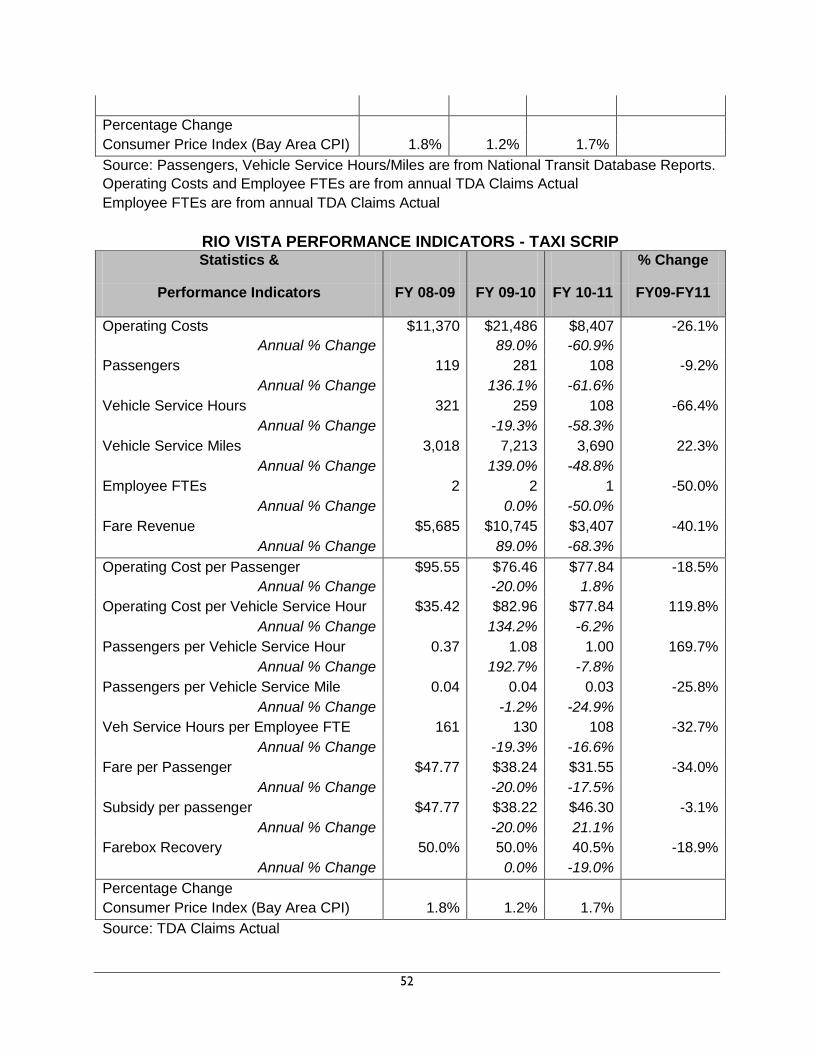
52
Percentage Change Consumer Price Index (Bay Area CPI) 1.8% 1.2% 1.7% Source: Passengers, Vehicle Service Hours/Miles are from National Transit Database Reports. Operating Costs and Employee FTEs are from annual TDA Claims Actual Employee FTEs are from annual TDA Claims Actual
RIO VISTA PERFORMANCE INDICATORS - TAXI SCRIP
Statistics & % Change
Performance Indicators FY 08-09 FY 09-10 FY 10-11 FY09-FY11
Operating Costs $11,370 $21,486 $8,407 -26.1% Annual % Change 89.0% -60.9%
Passengers 119 281 108 -9.2% Annual % Change 136.1% -61.6%
Vehicle Service Hours 321 259 108 -66.4% Annual % Change -19.3% -58.3%
Vehicle Service Miles 3,018 7,213 3,690 22.3% Annual % Change 139.0% -48.8%
Employee FTEs 2 2 1 -50.0% Annual % Change 0.0% -50.0%
Fare Revenue $5,685 $10,745 $3,407 -40.1% Annual % Change 89.0% -68.3%
Operating Cost per Passenger $95.55 $76.46 $77.84 -18.5% Annual % Change -20.0% 1.8%
Operating Cost per Vehicle Service Hour $35.42 $82.96 $77.84 119.8% Annual % Change 134.2% -6.2%
Passengers per Vehicle Service Hour 0.37 1.08 1.00 169.7% Annual % Change 192.7% -7.8%
Passengers per Vehicle Service Mile 0.04 0.04 0.03 -25.8% Annual % Change -1.2% -24.9%
Veh Service Hours per Employee FTE 161 130 108 -32.7% Annual % Change -19.3% -16.6%
Fare per Passenger $47.77 $38.24 $31.55 -34.0% Annual % Change -20.0% -17.5%
Subsidy per passenger $47.77 $38.22 $46.30 -3.1% Annual % Change -20.0% 21.1%
Farebox Recovery 50.0% 50.0% 40.5% -18.9% Annual % Change 0.0% -19.0%
Percentage Change Consumer Price Index (Bay Area CPI) 1.8% 1.2% 1.7% Source: TDA Claims Actual

53
Operating Cost
Ridership
Operating Cost Per Passenger
$0
$100,000
$200,000
$300,000
$400,000
$500,000
$600,000
FY09 FY10 FY11Systemwide Fixed Route Taxi Scrip
0
2,000
4,000
6,000
8,000
10,000
12,000
14,000
16,000
FY09 FY10 FY11Systemwide Fixed Route Taxi Scrip
$0.00
$20.00
$40.00
$60.00
$80.00
$100.00
$120.00
FY09 FY10 FY11Systemwide Fixed Route Taxi Scrip

54
Operating Cost Per Hour
Passengers Per Hour
Farebox Recovery
$0.00
$10.00
$20.00
$30.00
$40.00
$50.00
$60.00
$70.00
$80.00
$90.00
$100.00
FY09 FY10 FY11Systemwide Fixed Route Taxi Scrip
0.0
0.5
1.0
1.5
2.0
2.5
3.0
FY09 FY10 FY11Systemwide Fixed Route Taxi Scrip
0.0%
10.0%
20.0%
30.0%
40.0%
50.0%
60.0%
FY09 FY10 FY11Systemwide Fixed Route Taxi Scrip

55
Performance Against SRTP Standards The recent SRTP for Rio Vista Delta Breeze updated the performance goals for the transit system. A sampling of the goals and the current status of the system meeting the goals is shown.
Performance Measure Fixed Route
Standard Fixed Route
Actual (FY 10-11) Standard
Met?
Operating Cost per Hour $52.00 $90.23 No
Operating Cost per Passenger $30.00 $36.78 No
Passengers per Hour 3 2.5 No
Operating Revenues Rio Vista Delta Breeze relies on a variety of local, state and federal funding sources for operations of the transit service. They include fare revenue, contract revenue such as with the school district, advertising, TDA, and various federal funds. FTA 5311, FTA 5316 and 5317 funds are competitive grants based on the distribution process by Caltrans and MTC. Using National Transit Database information, revenues are shown for a three year period (FYs 2008-09 through 2010-11). A summary of revenues by source type, including local, state and federal is also shown. Operating Revenues by Source
FY 09 FY 10 FY 11
Fare Revenue $59,258 $103,451 $57,459 Contract Revenue $0 $0 $97,605 Local Funds $23,762 $2,231 $0 TDA-LTF/STA $91,378 $154,916 $182,200 FTA 5311 $97,877 $22,265 $43,827 FTA 5316 $50,000 $51,201 $47,399 FTA 5317 $15,000 $15,000 $25,318 Other FTA Funds (1) $0 $24,673 $0 Total $337,275 $373,738 $453,807 (1) FY 2010, Other FTA Funds is MTC LIFT Source: National Transit Database
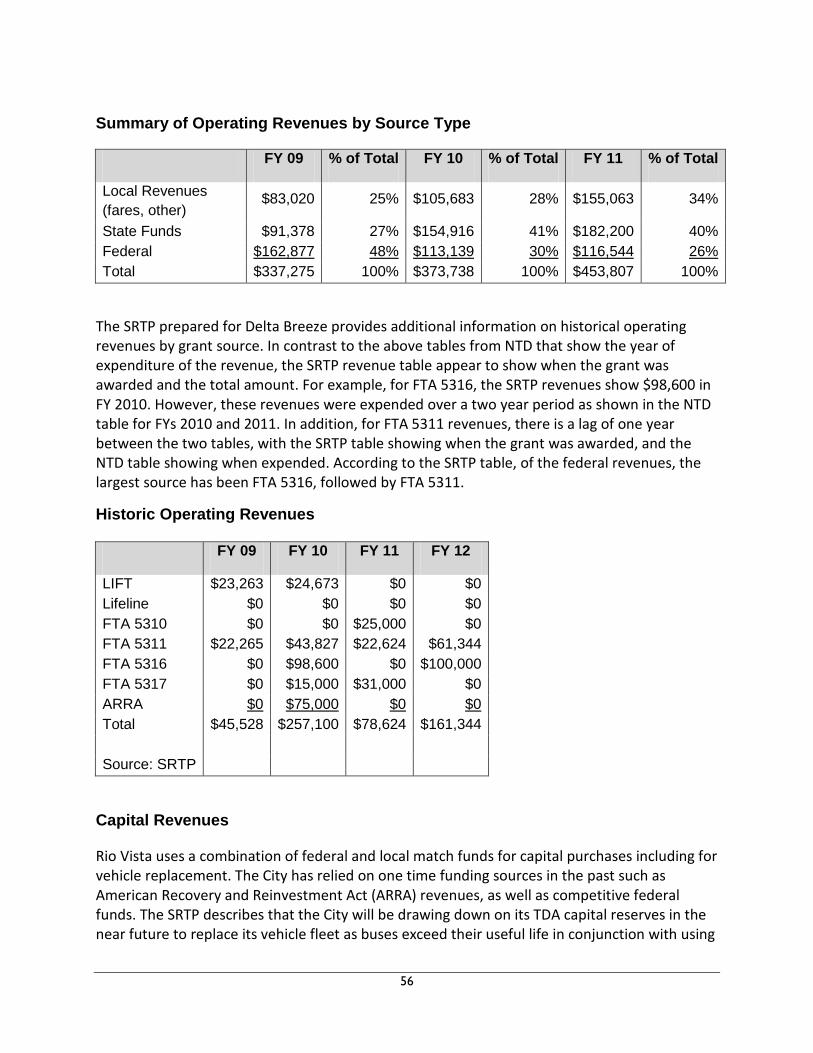
56
Summary of Operating Revenues by Source Type FY 09 % of Total FY 10 % of Total FY 11 % of Total
Local Revenues (fares, other)
$83,020 25% $105,683 28% $155,063 34%
State Funds $91,378 27% $154,916 41% $182,200 40% Federal $162,877 48% $113,139 30% $116,544 26% Total $337,275 100% $373,738 100% $453,807 100%
The SRTP prepared for Delta Breeze provides additional information on historical operating revenues by grant source. In contrast to the above tables from NTD that show the year of expenditure of the revenue, the SRTP revenue table appear to show when the grant was awarded and the total amount. For example, for FTA 5316, the SRTP revenues show $98,600 in FY 2010. However, these revenues were expended over a two year period as shown in the NTD table for FYs 2010 and 2011. In addition, for FTA 5311 revenues, there is a lag of one year between the two tables, with the SRTP table showing when the grant was awarded, and the NTD table showing when expended. According to the SRTP table, of the federal revenues, the largest source has been FTA 5316, followed by FTA 5311.
Historic Operating Revenues FY 09 FY 10 FY 11 FY 12
LIFT $23,263 $24,673 $0 $0 Lifeline $0 $0 $0 $0 FTA 5310 $0 $0 $25,000 $0 FTA 5311 $22,265 $43,827 $22,624 $61,344 FTA 5316 $0 $98,600 $0 $100,000 FTA 5317 $0 $15,000 $31,000 $0 ARRA $0 $75,000 $0 $0 Total $45,528 $257,100 $78,624 $161,344 Source: SRTP
Capital Revenues Rio Vista uses a combination of federal and local match funds for capital purchases including for vehicle replacement. The City has relied on one time funding sources in the past such as American Recovery and Reinvestment Act (ARRA) revenues, as well as competitive federal funds. The SRTP describes that the City will be drawing down on its TDA capital reserves in the near future to replace its vehicle fleet as buses exceed their useful life in conjunction with using
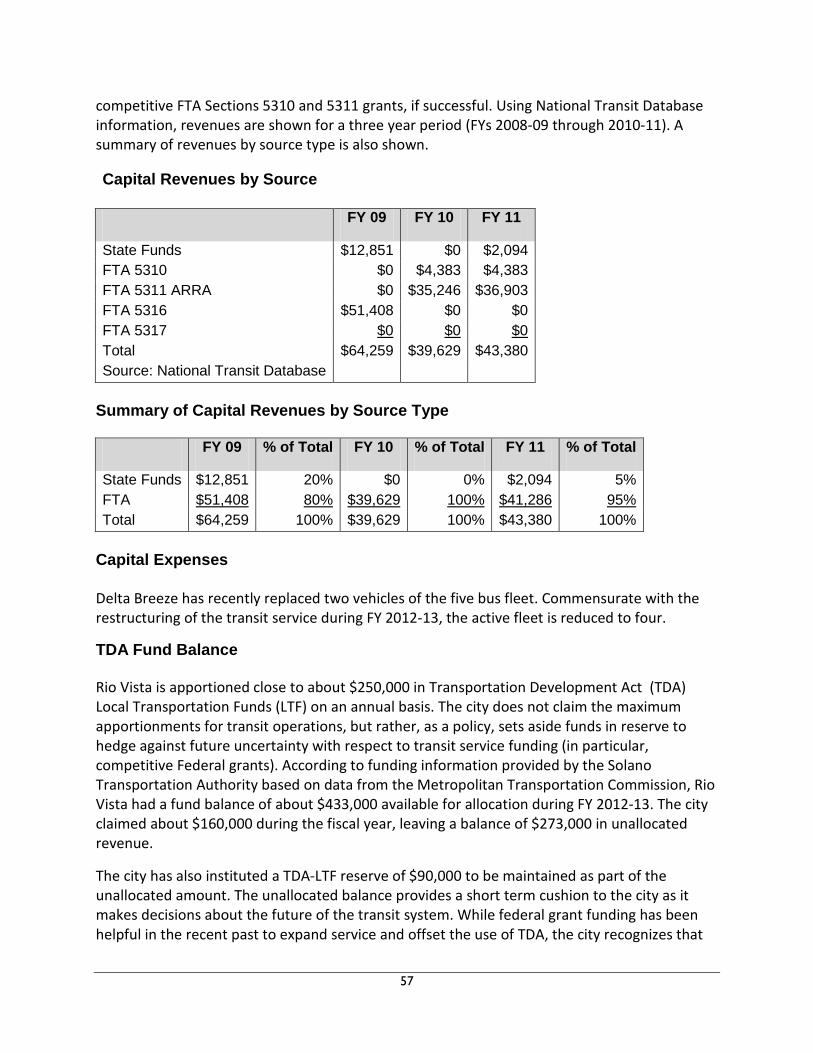
57
competitive FTA Sections 5310 and 5311 grants, if successful. Using National Transit Database information, revenues are shown for a three year period (FYs 2008-09 through 2010-11). A summary of revenues by source type is also shown.
Capital Revenues by Source
FY 09 FY 10 FY 11
State Funds $12,851 $0 $2,094 FTA 5310 $0 $4,383 $4,383 FTA 5311 ARRA $0 $35,246 $36,903 FTA 5316 $51,408 $0 $0 FTA 5317 $0 $0 $0 Total $64,259 $39,629 $43,380 Source: National Transit Database
Summary of Capital Revenues by Source Type FY 09 % of Total FY 10 % of Total FY 11 % of Total
State Funds $12,851 20% $0 0% $2,094 5% FTA $51,408 80% $39,629 100% $41,286 95% Total $64,259 100% $39,629 100% $43,380 100%
Capital Expenses Delta Breeze has recently replaced two vehicles of the five bus fleet. Commensurate with the restructuring of the transit service during FY 2012-13, the active fleet is reduced to four.
TDA Fund Balance
Rio Vista is apportioned close to about $250,000 in Transportation Development Act (TDA) Local Transportation Funds (LTF) on an annual basis. The city does not claim the maximum apportionments for transit operations, but rather, as a policy, sets aside funds in reserve to hedge against future uncertainty with respect to transit service funding (in particular, competitive Federal grants). According to funding information provided by the Solano Transportation Authority based on data from the Metropolitan Transportation Commission, Rio Vista had a fund balance of about $433,000 available for allocation during FY 2012-13. The city claimed about $160,000 during the fiscal year, leaving a balance of $273,000 in unallocated revenue.
The city has also instituted a TDA-LTF reserve of $90,000 to be maintained as part of the unallocated amount. The unallocated balance provides a short term cushion to the city as it makes decisions about the future of the transit system. While federal grant funding has been helpful in the recent past to expand service and offset the use of TDA, the city recognizes that

58
those fund sources are unstable. With the July 1, 2012 service change, the City restructured the transit system to match more committed funding and to avoid drawing down on the TDA reserve funds.
Cost Containment Rio Vista has implemented a number of measures to contain cost of Rio Vista Delta Breeze. The most pronounced measure is the recent restructuring of service starting in July 2012. The city has reduced service by 22 percent, including the elimination of Saturday service for both Route 50 and Route 52, elimination of midday service on Route 52, and consolidation of Route 50 from five to three daily weekday round trips.
Transit staff is implementing recommendations in the latest SRTP such as restructured transit service to operate with operating funds that are known and committed. City overhead cost allocation is being addressed to reduce administrative costs charged to the Transit Enterprise Fund. Also, since FY 2008-09, alternative revenue generation projects to diversify the transit income stream have been promoted such as Greyhound ticket sales and contracts with the River Delta Unified School District (RDUSD) to provide afterschool program transportation in conjunction with general public transportation on Route 51. Additional opportunities for Rio Vista Delta Breeze may exist when the school district ends transportation to the high school as there is a growing need to transport students across State Route 12.
A new contract provider was selected to operate Delta Breeze starting in FY 2012-13. A combination of lower contractor costs and less transit service will result in better cost containment. The previous operations contract with another vendor had higher costs in prior years that contributed to the poorer performance of the system. However, a downside to this trend experienced by Rio Vista was that the number of bidders during the RFP period to provide service was very limited. It was expressed by potential contractors that as the transit system becomes smaller, profit margins to the contractors get tighter, thus limiting their interest in serving Rio Vista. This trend presents an additional challenge to Rio Vista Delta Breeze.
Internally, the City instituted a number of staff measures beginning in FY 2009-10. These measures include furloughs every other Friday, wage freezes but with cost of living increases, managerial position freezes, and contracting out certain city positions. According to City transit staff, it recently recommended to the City council to award a new fuel contract for potential cost savings for the next five years, not only for transit, but for other City departments as well.
Five-Year Financial Forecast A forecast of revenues and expenses for both operations and capital projects for Rio Vista Delta Breeze is presented for the next five-years. With city staff input, the forecast provides a base scenario of reduced service from recent historic levels. The forecast relies on more stable funding streams to sustain operations of the transit system. The SRTP recently prepared for Delta Breeze provides guidance on the forecast and an implementation plan.

59
A funding strategy for Delta Breeze is to tap into alternative funding for operations. In addition to the more traditional sources such as TDA-LTF, STA, and federal transit grant monies, the city receives revenues from a service contract with the River Delta Unified School District and from Greyhound ticket sales. Some additional revenue is generated from advertising and other local sources.
Dispatchers sell Greyhound tickets at the Suisun City Train Depot concurrent with taking dial-a-ride reservations for Delta Breeze. There is an opportunity cost for the transit system in that the dispatchers could miss answering the phone to serve a Delta Breeze customer while selling Greyhound tickets. However, staff will return the missed call provided that a message is left by the caller. Greyhound ticket sales are included in both the operating expense and revenue in the forecast as an offset. About 86 percent of the ticket sales revenue is remitted to Greyhound with Rio Vista retaining 14 percent as commission to apply toward transit services.
Fare revenue is comprised of different related revenues and includes passenger fares and fares generated from the RDUSD. Delta Breeze has historically not been able to meet its farebox recovery requirement through passenger fares alone. Fare revenue generated from passenger ridership comprises about 25 percent of total fare revenue shown in the forecast. This is equivalent to about $18,000 projected in FY 2013-14, which would not meet the 10 percent minimum farebox requirement. When combined with other related revenue sources, Delta Breeze then meets the farebox ratio. Fare revenues were estimated using historical average fares collected.
As Rio Vista’s policy is to not claim its full allocation of TDA-LTF for operations, claims for these funds grow at the pace of the system’s operations needs. The pace of operations growth and system viability will be dependent in part on contract costs and willingness by private operators to bid on future contracts. The experience by Rio Vista in the latest bid round shows concern as the Delta Breeze has lowered its service levels.
It is assumed that TDA-LTF funds will grow marginally during the forecast period given some improvement that is expected in the economy in the coming years. While TDA-LTF revenues in Solano County have grown an average of almost 5 percent per year over the last 20 years (in actual dollars), the average figure factors in both economic peaks and valleys over a long time period. Because of the relatively short forecast period and to remain conservative, TDA-LTF growth rates are assumed to follow the forecasted Consumer Price Index for the San Francisco Consolidated Metropolitan Statistical Area (CMSA) developed by the State Department of Finance. The CPI forecast, which goes through FY 2015-16, assumes a 2 percent growth rate per year. The Transit Sustainability Project (TSP) forecast follows this trend. Also, accounting for continued level of some economic growth that is expected to occur slowly in the future, the TSP shows 3 percent growth per year for the last two years of the forecast.
Along with a TDA-LTF reserve, there is unallocated TDA funds in the short term to balance any shortfall while the City reviews its potential options for transit service delivery. Options include remaining a stand-alone city provided system, having another agency claim TDA-LTF on behalf

60
of Rio Vista (similar to Healdsburg and Cloverdale in Sonoma County), or merging with SolTrans or Fairfield And Suisun Transit, the larger transit operators in the county.
The operating revenue forecast will fund 4,340 annual revenue vehicle service hours (RVSH), based on the service plan recommended in the recent SRTP. Services include weekday Dial-A-Ride (Route 51) (9:30 AM-1:30 PM) (1,010 RVSH); weekday Route 50 three times daily (2,040 RVSH); Route 52 weekday AM/PM commute (630 RVSH); new Medical/ Shopping Shuttle (Route) 54 once a week (200 RVSH); and evening Route 51 service under contract with River Delta Unified School District (230 RVSH). The operations revenue and cost forecast only accounts for bus operations, and not for any infrastructure operations/maintenance such as future park and ride lots, or CNG fueling station.
On the capital side, the city anticipates replacing each of its four active vehicles during the forecast. One cutaway bus replacement is planned in each of FYs 2012-2013, 2013-14 and 2015-16. A minivan replacement vehicle is planned for FY 2016-2017. Other capital assets are also forecasted including bus stop amenities, automatic vehicle location (AVL) technology for buses, security cameras, and minor facility needs. Capital funding sources include federal grants (FTA Sections 5310, 5311, 5316 and 5317) and matching TDA-LTF and STA revenues.
Vehicle replacement unit costs are based on the SRTP cost estimates of $82,400 per cutaway vehicle and $53,600 per minivan. These costs align closely with the most recent MTC regional bus/van pricelist for FYs 2012-13 and FY 2013-14 for Transit Capital Priorities Call for Projects. Other capital costs were provided by the City’s Transit and Airport Coordinator.
While not included in this forecast, the Delta Breeze SRTP discusses the Historic City and Downtown Waterfront Planned Development Area (PDA) Plan including infrastructure investments related to a planned water transit system. Investments include a land/dock transit plaza at the waterfront and a water vessel. Additional investments include two park and ride lots and a CNG fueling station. There are no stable funding sources identified for these major capital projects identified in the SRTP totaling an additional $5.8 million. Rather, discretionary grants are assumed in the Delta Breeze SRTP with the CNG fueling station identified as having no funding.
A listing of capital projects in the TSP forecast by year include:
FY 2012-13: Procure one replacement bus; improve bus stop amenities including a shelter at Front and Main and update kiosks; purchase maintenance tools; Clipper implementation.
FY 2013-14: Procure one replacement bus; continue to update information kiosks at bus stops; procure fencing/overhang for Global Electric Motorcar vehicle.
FY 2014-15: Continue to update passenger amenities; install AVL; procure Security Cameras for buses.
FY 2015-16: Procure one replacement bus; install Passenger Improvements. FY 2016-17: Procure one replacement minivan; continue to update passenger amenities. FY 2017-18: Continue to update passenger amenities; install electronic fareboxes.

61
The financial forecast data is expressed in year of expenditure. As shown in the forecast, Delta Breeze will not have an operating deficit under current conditions, given its carryover funds. As described above, the City does not intend to claim its full TDA-LTF apportionment while maintaining an operating reserve. TDA carryover funds are also available to cover any shortfall that may occur. The City will continue to rely heavily on outside non-public transit funding such as Greyhound ticket sales, as well as school service contracts, to support the current system. In addition, federal grant programs such as FTA 5310, 5311, 5316 and 5317 are also actively sought. Delta Breeze is not anticipated to meet the required farebox ratio from passenger fares alone without other local support. In addition, a future uncertainty will be the next renewal of the transit service contract given the challenges that the City encountered in procuring a private transportation vendor to operate the smaller service. For capital projects, vehicle replacements rely heavily on competitive FTA grants and the TDA-LTF or STA local match. Financial Projections – City of Rio Vista Delta Breeze
Capital and Operating
(Numbers are expressed in Year of Expenditure $) Fiscal Year FY 12-13 FY 13-14 FY 14-15 FY 15-16 FY 16-17 FY 17-18 Capital Expense Vehicle Replacement $82,000 $84,000 $87,400 $58,400 Vehicle Amenities $45,000 $175,000 Security Cameras $25,000 Bus Stop Amenities $10,000 $5,000 $1,500 $1,500 $1,500 $1,500 Facilities $10,300 $13,000 Clipper Implementation $1,500 Total $103,800 $102,000 $71,500 $88,900 $59,900 $176,500 Capital Revenue Transportation Development Act (LTF) $8,000 $20,400 $1,500 $17,800 $12,000 $1,500 State Transit Assistance Funds (STAF) $30,000 $45,000 $175,000 FTA Grant (5310, 5311, 5316, 5317) $65,800 $81,600 $25,000 $71,100 $47,900 Total $103,800 $102,000 $71,500 $88,900 $59,900 $176,500 Annual Net Surplus/Deficit - Capital $0 $0 $0 $0 $0 $0 Cumulative Net Surplus/Deficit - Capital $0 $0 $0 $0 $0 $0 Operating Expense

62
Financial Projections – City of Rio Vista Delta Breeze Capital and Operating
(Numbers are expressed in Year of Expenditure $) Fiscal Year FY 12-13 FY 13-14 FY 14-15 FY 15-16 FY 16-17 FY 17-18
Operations (1) $432,100 $445,000 $458,000 $472,000 $486,000 $501,000 Operating Revenue Transportation Development Act (LTF) (2) $151,000 $154,000 $157,100 $160,200 $165,000 $170,000
State Transit Assistance Funds (3) $9,800 $9,200 $9,200 $9,200 $9,200 $9,200 Isleton STAF $5,000 $5,000 $5,000 $5,000 $5,000 $5,000 RDUSD Contract Revenues $20,000 $20,600 $21,200 $21,800 $22,400 $23,000
Greyhound Revenue (4) $95,000 $97,900 $100,800 $103,800 $106,900 $110,100 FTA Section 5311 $78,000 $68,500 $68,500 $68,500 $68,500 $68,500
FTA Section 5316 (5) $0 $100,000 $100,000 $0 $0 $0
FTA Section 5317 (5) $0 $15,000 $15,000 $0 $0 $0
Fare Revenue (incl. RDUSD fares) (6) $65,000 $66,800 $68,600 $70,500 $72,400 $74,400 Advertising, Clipper, Reg. Transit Connection Card, Newspaper $3,500 $3,600 $3,700 $3,800 $3,900 $4,000 Total $427,300 $540,600 $549,100 $442,800 $453,300 $464,200 Annual Net Surplus/Deficit - Operations -$4,800 $95,600 $91,100 -$29,200 -$32,700 -$36,800 Cumulative Net Surplus/Deficit - Operations -$4,800 $90,800 $181,900 $152,700 $120,000 $83,200 Transportation Development Act Carryover (7) $273,000 $260,200 $335,400 $425,000 $378,000 $333,300 Annual Operations Balance -$4,800 $95,600 $91,100 -$29,200 -$32,700 -$36,800 TDA Capital Uses -$8,000 -$20,400 -$1,500 -$17,800 -$12,000 -$1,500 Net Carryover $260,200 $335,400 $425,000 $378,000 $333,300 $295,000 (1) Operating expenses grow by 3% per year, slightly above the forecasted growth in CPI for the San Francisco Consolidated Metropolitan Statistical Area (CMSA). Costs include the new Route 54 medical/shopping shuttle that operates once per week starting in January 2013. Costs also include greyhound ticket sales revenue as a fixed administrative expense. Greyhound sales on the expense side are offset by the same sales figure for operating revenue. Rio Vista remits approximately 86% of ticket revenue to Greyhound, and keeps the remaining 14% as commission. (2) TDA-LTF revenue is the maximum obligation that Rio Vista claims for operations to ensure an operating reserve fund and capital match revenue. Revenue is net of STA Planning, and Intercity Taxi totaling an additional $9,500. TDA grows by 2% annually for first three years, then 3% next two years, mirroring forecasted growth of SF CMSA CPI Forecast through FY 2015-16.
63
Financial Projections – City of Rio Vista Delta Breeze Capital and Operating
(Numbers are expressed in Year of Expenditure $) Fiscal Year FY 12-13 FY 13-14 FY 14-15 FY 15-16 FY 16-17 FY 17-18 (3) STAF reduction of 6% between FYs 2013 and 2014 based on proposed FY 2013-14 State budget. Revenue is held constant in forecast since STAF is volatile based on unpredictable diesel fuel sales. (4) Greyhound revenue includes total ticket sales. Rio Vista's commission is approximately 14% ($13,500) of total sales, with the remaining 86% ($81,500) remitted to Greyhound. (5) FTA Section 5316 and 5317 funds use State Toll Credits as local match. Rio Vista intends to apply for another round of FTA 5316 and 5317 funding for use in FY 15-16 and FY 16-17. If successful, the TDA-LTF carryover would increase. (6) Fare revenue generated from passenger ridership comprises about 25 percent of total fare revenue shown, equivalent to about $18,000 projected in FY 2013-14. (7) TDA Carryover includes a reserve of $90,000 per Rio Vista transit policy.

64
County of Solano The following tables provide an initial summary of the historic financial and performance data for County of Solano. The data source used to comprise the tables is the TDA Claim. The County of Solano provides intercity paratransit service through a private contractor. Data Consistency TDA Claim was the sole information used to present the historic transit data for the County. Therefore, there is no consistency analysis. Cost Drivers The primary cost driver for countywide paratransit service is the administration and operations expense incurred by the private paratransit provider. The cost is reflected in the table below. The breakout of operating cost between purchased transportation and administration in the TDA Claims indicates that some expenses are captured by County staff in administering the county paratransit program. The $50,000 in FY 2010-11 was claimed for county transit coordination. County Paratransit Operations Expenses 2010 2011
Operations $13,053 $29,400 % Change -- 125%
General Administration
$23,500 $50,000
% Change -- 113%
Total $36,553 $79,400 Source: TDA Claims Performance Trends The following tables provide information on performance indicators and trends of the countywide paratransit system. Industry performance measures are used including operating costs, fare revenues, ridership, revenue hours and miles, and full time equivalents. Based on the TDA claims, the general trend for fiscal years 2010 through 2011 show mixed results, with increased efficiency measured in cost per hour, but decreased efficiency measured in cost per passenger. Subsidy per passenger also decreased over the two year period. Service effectiveness measured by passengers per hour shows a significant increase. Costs for paratransit decreased with a large increase in ridership, while both service hours and miles decreased. Other measures such as fare revenue and farebox recovery declined.

65
SOLANO COUNTY PERFORMANCE INDICATORS - PARATRANSIT
Statistics & % Change Performance Indicators FY 09-10 FY 10-11 (1) FY10-FY11
Operating Costs $36,553 $29,400 -19.6% Annual % Change -19.6%
Passengers 104 255 145.2% Annual % Change 145.2%
Vehicle Service Hours 423 120 -71.6% Annual % Change -71.6%
Vehicle Service Miles 1,800 1,190 -33.9% Annual % Change -33.9%
Fare Revenue $2,860 $1,550 -45.8% Annual % Change -45.8%
Operating Cost per Passenger $351.47 $115.29 -67.2%
Annual % Change -67.2% Operating Cost per Vehicle Service Hour $86.41 $245.00 183.5%
Annual % Change 183.5% Passengers per Vehicle Service Hour 0.25 2.13 764.3%
Annual % Change 764.3% Passengers per Vehicle Service Mile 0.06 0.21 270.9%
Annual % Change 270.9% Fare per Passenger $27.50 $6.08 -77.9%
Annual % Change -77.9% Subsidy per passenger $323.97 $109.22 -66.3%
Annual % Change -66.3% Farebox Recovery 7.8% 5.3% -32.6%
Annual % Change -32.6%
Percentage Change Consumer Price Index (Bay Area CPI) 1.8% 1.2%
(1) Solano County claimed an additional $50,000 in FY 10-11 for countywide transit coordination.
Graphical display of select performance indicators is shown below.

66
Operating Cost
Ridership
Operating Cost Per Passenger
$0
$5,000
$10,000
$15,000
$20,000
$25,000
$30,000
$35,000
$40,000
FY10 FY11
Paratransit
0
50
100
150
200
250
300
FY10 FY11
Paratransit
$0.00
$50.00
$100.00
$150.00
$200.00
$250.00
$300.00
$350.00
$400.00
FY10 FY11
Paratransit

67
Operating Cost Per Hour
Passengers Per Hour
Farebox Recovery
$0.00
$50.00
$100.00
$150.00
$200.00
$250.00
$300.00
FY10 FY11
Paratransit
0.0
0.5
1.0
1.5
2.0
2.5
FY10 FY11
Paratransit
0.0%1.0%2.0%3.0%4.0%5.0%6.0%7.0%8.0%9.0%
FY10 FY11
Paratransit

68
Operating Revenues County paratransit relies on a few funding sources for operations of the service. They include fare revenue and TDA. TDA funds have been consistent at about $25,000 per year while fares contribute a much smaller amount. Using information from TDA Claims, revenues are shown for the two year period. A summary of revenues by source type, including local and state, is also shown.
Operating Revenues FY 10 FY 11
Fare Revenue $2,860 $1,550 TDA $25,000 $25,000 Total $27,860 $26,550 Source: TDA Claim
Summary of Operating Revenues by Source Type FY 10 % of Total FY 11 % of Total
Local Revenues (fares) $2,860 10% $1,550 6% State Funds (TDA) $25,000 90% $25,000 94% Total $27,860 100% $26,550 100%
TDA Fund Balance The annual apportionment of Transportation Development Act Funds to the County of Solano is about $600,000. The County authorizes local transit operators to claim County funds for intercity transit services in the amount of about $140,000 The County then submits a claim to fund intercity paratransit service and for streets and roads. Paratransit service claims are $25,000 per year. Beginning in FY 2010-11, Solano County is implementing a three year phase out plan for the use of TDA for streets and road purposes. According to funding information provided by the Solano Transportation Authority based on data from the Metropolitan Transportation Commission, the TDA balance for County of Solano is $540,000
Cost Containment The County has been working with the transit operators in Solano County on a memorandum of understand for an intercity taxi scrip funding agreement. Currently, each transit operator provides their own taxi scrip program.

69
Five-Year Financial Forecast A forecast of revenues and expenses for operations of Solano County Paratransit is presented for the next five-years. The forecast provides a base scenario of maintaining current levels of contracted paratransit service. It is assumed that TDA funds will grow marginally during the forecast period given some improvement that is expected in the economy in the coming years. Growth rates are 2 percent per year for the first three years, followed by 3 percent per year for the last two years. Fare revenues are assumed to grow 5 percent per year.
Financial Projections-County of Solano
Operating
Fiscal Year FY 12-13 FY 13-14 FY 14-15 FY 15-16 FY 16-17 FY 17-18 Operating Expense Operations $26,500 $27,600 $28,700 $29,800 $30,900 $32,000 Operating Revenue Fares $1,500 $1,600 $1,700 $1,800 $1,900 $2,000 Transportation Development Act
$25,000 $26,000 $27,000 $28,000 $29,000 $30,000
Total $26,500 $27,600 $28,700 $29,800 $30,900 $32,000

70
Solano County Transit (SolTrans) The following tables provide an initial summary of the historic financial and performance data for SolTrans. The Joint Powers Agency creating SolTrans was approved by its member agencies- City of Benicia, City of Vallejo, and the Solano Transportation Authority, in the Fall of 2010. The historic data is presented only for FY’s 2010-11 and 2011-12 to reflect the relatively short time period of SolTrans’ existence. As the transition occurred between the two fiscal years, the data is presented to provide a general history of the system’s performance. Data sources used to comprise the tables include TDA Claims, Operating Budget, and Short Range Transit Plan. A review of other data sources including SolTrans staff reports and presentations to the board were also undertaken. It is acknowledged that SolTrans has been in a transitional stage during the review period as the agency continues to solidify its administrative staff positions and make adjustments to transit operations from the merger of Vallejo and Benicia transit systems. While performance and financial information from the past few years provide indication to the general health of the new agency, SolTrans has been implementing recent significant changes to the service in efforts to achieve improved efficiencies from the merger. Data Consistency A comparison of key financial and operations data was undertaken to determine the general accuracy of the recording and reporting by SolTrans. TDA claim and operating budget data in the comparison were prepared in the same general time frame (May 2012), while the SRTP was developed during an earlier time period prior to its completion in January 2012. The State Controller Data is prepared after the fiscal year and contains year-end actual data. The listing of the data provides comparison to show discrepancies that existed among the various data sources that portray the financial health of the transit system. Most data discrepancies occurred in FY 2011 when SolTrans was first created, and collection and reporting of transit information was transitioned from the cities of Benicia and Vallejo to contracted SolTrans management staff. Upon this transition and clean up of expenditures that would be passed over to SolTrans, FY 2012 data consistency improved significantly, as a more stable reporting structure was established. Operating budget and TDA Claim data for operating revenues and expenditures are identical in FY 2012 indicating one data source was used to develop the documents. SRTP data was slightly different due to the forecast being made earlier, although passenger fares were consistent among each data source for all transit modes. State Controller Data show actual year-end data and differ from the other sources which provide estimates. In spite of missing data from a few of the information sources, beginning in FY 2012 the financial and performance data have been relatively consistent.

71
SOLTRANS DATA CONSISTENCY - TOTAL SYSTEM
Performance Measure Source FY11 FY12
Total Operating Expenses TDA Claim $14,703,395 $13,252,415 Operating Budget $11,790,506 $13,252,415 SRTP $9,006,489 $13,478,015 State Controller Report $12,516,513 Passenger Fares TDA Claim $3,352,800 $3,291,000 Operating Budget $3,275,108 $3,291,000 SRTP $2,849,557 $3,443,815 State Controller Report $3,752,911 Passengers TDA Claims 1,619,980 1,498,176 SRTP 1,441,007 State Controller Report 1,473,250 Vehicle Service Hours TDA Claims 134,475 136,729 SRTP 117,898 127,901 State Controller Report 113,120
Vehicle Service Miles TDA Claims 2,194,364 202,201 SRTP 2,051,965 State Controller Report 1,697,750
Employee Full-Time Equivalents TDA Claims 147.0 140.0 State Controller Report 156.0
SOLTRANS DATA CONSISTENCY - FIXED ROUTE
Performance Measure Source FY11 FY12
Operating Cost TDA Claim $12,890,595 $11,370,300 Operating Budget $10,052,563 $11,370,300 SRTP $7,981,211 $11,689,900 Passenger Fares TDA Claim $3,166,000 $3,093,000

72
Operating Budget $3,093,000 $3,093,000 SRTP $2,763,755 $3,093,000
Passengers TDA Claims 1,560,450 1,447,491 SRTP 1,410,680 State Controller Report 1,442,229 Vehicle Service Hours TDA Claims 111,266 111,680 SRTP 102,202 111,349 State Controller Report 97,892
Vehicle Service Miles TDA Claims 2,070,864 SRTP 1,900,656 State Controller Report 1,434,693
Employee Full-Time Equivalents TDA Claims 124 124
State Controller Report 134
SOLTRANS DATA CONSISTENCY - PARATRANSIT
Performance Measure Source FY11 FY12
Operating Cost Operating Budget $1,473,128 $1,602,300 TDA Claims $1,545,200 $1,602,300 SRTP $1,025,278 $1,508,300 Passenger Fares Operating Budget $70,509 $71,000 TDA Claims $78,000 $71,000 SRTP $85,802 $71,000
Passengers TDA Claims 36,130 35,264 SRTP 30,327 State Controller Report 31,021
Vehicle Service Hours TDA Claims 12,412 14,252 SRTP 15,696 16,552 State Controller Report 15,227
Vehicle Service Miles TDA Claims 121,900 172,633

73
SRTP 151,309 State Controller Report 263,057
Employee Full-Time Equivalents TDA Claims 23 16 State Controller Report 22
SOLTRANS DATA CONSISTENCY - TAXI SCRIP
Performance Measure Source FY11 FY12
Operating Cost Operating Budget $264,815 $279,815 TDA Claims $267,600 $279,815 SRTP $279,815 Passenger Fares Operating Budget $111,599 $127,000
TDA Claims $108,800 $127,000
SRTP $279,815
Passengers TDA Claims 23,400 15,421
Vehicle Service Hours TDA Claims 10,797 10,797
Vehicle Service Miles TDA Claims 1,600 29,568 Cost Drivers Cost drivers are expense items necessary to provide a particular service. Cost drivers for SolTrans have generally included operations and maintenance, administrative salaries and benefits, and vehicle fuel. The percentage of these costs relative to total operations costs is derived. As SolTrans service is operated and maintained by a private contractor, salaries and benefits costs are shown for in-house employees for administration and management of the system. 2011 2012
Salaries $223,137 $450,044 % Change 102%
Benefits $121,794 $237,916 % Change 95%
Fuel $1,868,000 $2,256,000 % Change 21%

74
Salaries as % of Total Operations Cost (minus depreciation)
1% 3%
Benefits as a % of Total Operations Cost (minus Depreciation)
1% 2%
Fuel as % of Total Operations Cost (minus depreciation)
12% 15%
Source: TDA Claim Actual for FY 11; TDA Claim Current Adjusted FY 2012
A breakdown of costs between operations, maintenance, and administration is provided for the period of FYs 2010-11 and 2011-12. Operations cost in FY 2010-11 comprised about 52 percent of total cost (minus depreciation), maintenance comprised 22 percent, and general administrative cost comprised the remaining 26 percent. Transition of ferry bus route 200 operating cost from SolTrans to WETA occurred during this period. The cost percentages shifted during FY 2011-12 in which operations comprised 46 percent of cost, maintenance comprised 29 percent, and administration 25 percent. Administration costs appeared high relative to overall operations costs to account for start up transition expenses, use of professional management services during the transition, and other charges that have since declined when full time SolTrans were hired. SolTrans Operations Expenses 2011 2012 Operations $9,322,167 $7,319,945
% Change -- -21% Maintenance $3,333,968 $4,261,770
% Change -- 28% General Administration $3,988,260 $3,686,656
% Change -- -8% Depreciation $39,756 $0
% Change -- -100% Cost Adjustment during transition (1) -$1,466,000 -$478,000
Total $15,218,151 $14,790,371
(1) Cost adjustments include transfer of Route 200 cost to WETA, and transfer of ferry ticket office to Baylink Ferry. Source: TDA Claim Actual for FY 11; TDA Claim Current Adjusted FY 2012
A further division of operating expenses among other cost drivers is shown. With purchased transportation being the primary cost driver, others include fuel, services, and insurance. Several expense categories showed increases but the largest cost item, purchased transportation, decreased by over 10 percent due to reductions in bus service. Overall annual total operating expenses decreased about three percent between the two fiscal years, with anticipation for further operating cost reductions through additional adjustments in service.

75
SolTrans Operations Expenses 2011 2012 Services $770,669 $934,440
% Change 21% Fuels and Lubricants $1,868,000 $2,256,000
% Change 21% Casualty and Liability $77,708 $425,000
% Change 447% Utilities $37,000 $33,000
% Change -11% Purchased Transportation $10,042,427 $8,947,000
% Change -11% Other $3,503,660 $1,984,971
% Change -43% Administration $344,931 $687,960
% Change 99% Depreciation $39,756 $0
% Change -100% Cost Adjustment during transition -$1,466,000 -$478,000
Total $15,218,151 $14,790,371
% Change -3%
Source: TDA Claim Actual for FY 11; TDA Claim Current Adjusted FY 2012
Performance Trends The following tables provide information on performance indicators and trends of the transit system. Industry performance measures are used including operating costs, fare revenues, ridership, revenue hours and miles, and full time equivalents. The general trend in fixed route and paratransit services for fiscal years 2011 through 2012 shows decreased cost efficiency and effectiveness measured in cost per hour and per passenger. Subsidy per passenger also increased over the two year period. Service effectiveness measured by passengers per hour increased for fixed route but slightly declined for paratransit. Costs increased for fixed route but ridership and service hours decreased. Costs for paratransit increased with smaller declines in ridership, while both service hours and miles increased. Other measures such as fare revenue and farebox recovery declined for both fixed route and paratransit. Some performance indicators for local taxi show significant changes from a decline in ridership but a large increase in service miles.

76
SOLTRANS PERFORMANCE INDICATORS - FIXED ROUTE
Statistics & % Change Performance Indicators FY 10-11 FY 11-12 FY11-FY12
Operating Costs $10,052,563 $10,738,911 6.8% Annual % Change 6.8%
Passengers 1,560,450 1,442,229 -7.6% Annual % Change -7.6%
Vehicle Service Hours 111,266 97,892 -12.0% Annual % Change -12.0%
Vehicle Service Miles 2,070,864 1,434,693 -30.7% Annual % Change -30.7%
Employee FTEs 124.0 134.0 8.1% Annual % Change 8.1%
Fare Revenue $3,166,000 $3,527,121 11.4% Annual % Change 11.4%
Operating Cost per Passenger $6.44 $7.45 15.6%
Annual % Change 15.6% Operating Cost per Vehicle Service Hour $90.35 $109.70 21.4%
Annual % Change 21.4% Passengers per Vehicle Service Hour 14.02 14.73 5.1%
Annual % Change 5.1% Passengers per Vehicle Service Mile 0.75 1.01 33.4%
Annual % Change 33.4% Veh Service Hours per Employee FTE 897 731 -18.6%
Annual % Change -18.6% Fare per Passenger $2.03 $2.45 20.5%
Annual % Change 20.5% Subsidy per passenger $4.41 $5.00 13.3%
Annual % Change 13.3% Farebox Recovery 31.5% 32.8% 4.3%
Annual % Change 4.3% Percentage Change Consumer Price Index (Bay Area CPI) 1.8% 1.2%
Source: TDA Claim Actual for FY 11, State Controller Report for FY 12

77
SOLTRANS PERFORMANCE INDICATORS - PARATRANSIT
Statistics & % Change Performance Indicators FY 10-11 FY 11-12 FY11-FY12
Operating Costs $1,473,128 $1,513,325 2.7% Annual % Change 2.7%
Passengers 36,130 31,021 -14.1% Annual % Change -14.1%
Vehicle Service Hours 15,696 15,227 -3.0% Annual % Change -3.0%
Vehicle Service Miles 121,900 263,057 115.8% Annual % Change 115.8%
Employee FTEs 23.0 22.0 -4.3% Annual % Change -4.3%
Fare Revenue $70,509 $80,965 14.8% Annual % Change 14.8%
Operating Cost per Passenger $40.77 $48.78 19.6%
Annual % Change 19.6% Operating Cost per Vehicle Service Hour $93.85 $99.38 5.9%
Annual % Change 5.9% Passengers per Vehicle Service Hour 2.30 2.04 -11.5%
Annual % Change -11.5% Passengers per Vehicle Service Mile 0.30 0.12 -60.2%
Annual % Change -60.2% Veh Service Hours per Employee FTE 682 692 1.4%
Annual % Change 1.4% Fare per Passenger $1.95 $2.61 33.7%
Annual % Change 33.7% Subsidy per passenger $38.82 $46.17 18.9%
Annual % Change 18.9% Farebox Recovery 4.8% 5.4% 11.8%
Annual % Change 11.8% Percentage Change Consumer Price Index (Bay Area CPI) 1.8% 1.2%
Source: TDA Claim Actual for FY 11, State Controller Report for FY 12

78
SOLTRANS PERFORMANCE INDICATORS - TAXI
Statistics & % Change Performance Indicators FY 10-11 FY 11-12 FY11-FY12
Operating Costs $264,815 $264,277 -0.2% Annual % Change -0.2%
Passengers 23,400 15,421 -34.1% Annual % Change -34.1%
Vehicle Service Hours 10,797 10,797 0.0% Annual % Change 0.0%
Vehicle Service Miles 1,600 29,568 1748.0% Annual % Change 1748.0%
Fare Revenue $111,599 $144,825 29.8% Annual % Change 29.8%
Operating Cost per Passenger $11.32 $17.14 51.4%
Annual % Change 51.4% Operating Cost per Vehicle Service Hour $24.53 $24.48 -0.2%
Annual % Change -0.2% Passengers per Vehicle Service Hour 2.17 1.43 -34.1%
Annual % Change -34.1% Passengers per Vehicle Service Mile 14.63 0.52 -96.4%
Annual % Change -96.4% Fare per Passenger $4.77 $9.39 96.9%
Annual % Change 96.9% Subsidy per passenger $6.55 $7.75 18.3%
Annual % Change 18.3% Farebox Recovery 42.1% 54.8% 30.0%
Annual % Change 30.0% Percentage Change Consumer Price Index (Bay Area CPI) 1.8% 1.2%
Source: TDA Claims for Passengers, Hours and Miles. Costs and Fares from Operating Budget for FY 11 and State Controller Report for FY 12
Graphical display of select performance indicators is shown below.
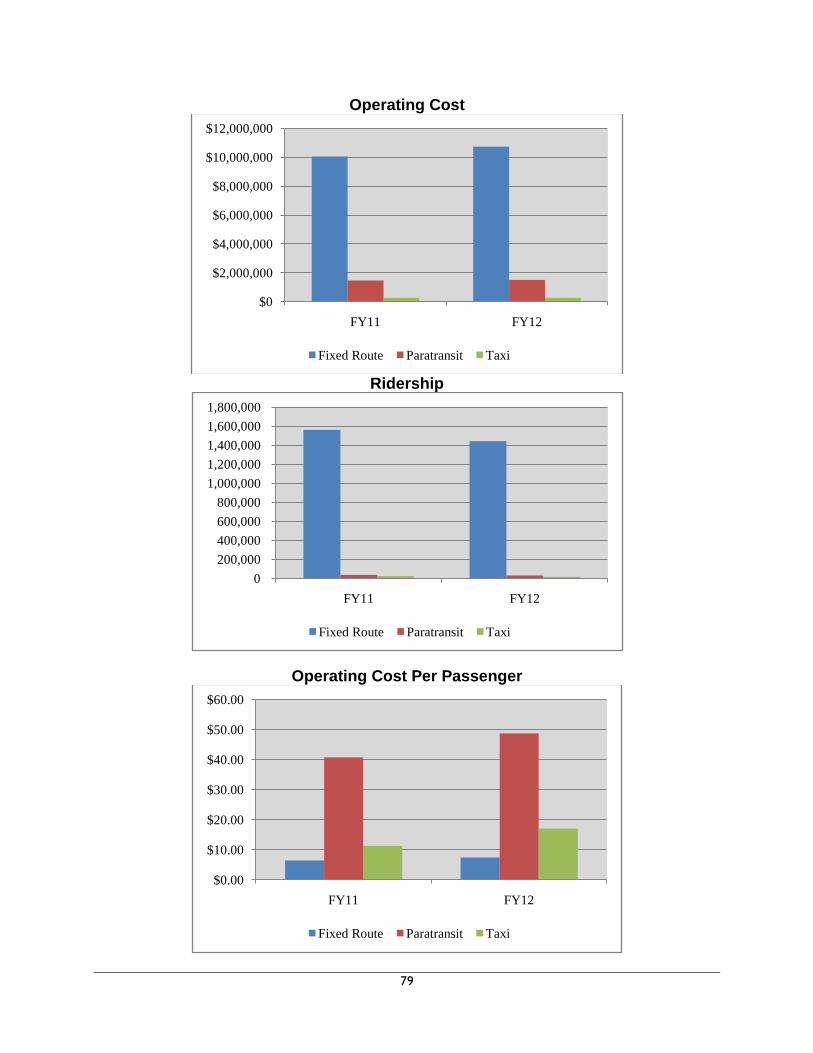
79
Operating Cost
Ridership
Operating Cost Per Passenger
$0
$2,000,000
$4,000,000
$6,000,000
$8,000,000
$10,000,000
$12,000,000
FY11 FY12
Fixed Route Paratransit Taxi
0 200,000 400,000 600,000 800,000
1,000,000 1,200,000 1,400,000 1,600,000 1,800,000
FY11 FY12
Fixed Route Paratransit Taxi
$0.00
$10.00
$20.00
$30.00
$40.00
$50.00
$60.00
FY11 FY12
Fixed Route Paratransit Taxi

80
Operating Cost Per Hour
Passengers Per Hour
Farebox Recovery
$0.00
$20.00
$40.00
$60.00
$80.00
$100.00
$120.00
FY11 FY12
Fixed Route Paratransit Taxi
0.0 2.0 4.0 6.0 8.0
10.0 12.0 14.0 16.0
FY11 FY12
Fixed Route Paratransit Taxi
0.0%
10.0%
20.0%
30.0%
40.0%
50.0%
60.0%
FY11 FY12
Fixed Route Paratransit Taxi

81
Performance Against SRTP Standards The SRTP for SolTrans provided a set of performance standards for fixed route, paratransit, and systemwide. A sampling of performance standards and the current status of each mode meeting their respective projections are shown.
Performance Measure SRTP Standard
SolTrans
(FY 11-12) Standard Met?
Operating Cost per Hour
Fixed Route <= $98.46 $109.70 No
Paratransit <= $78.51 $99.38 No
Operating Cost per Passenger
Systemwide <= $8.00 $8.41 No
Passengers per Hour
Systemwide >=8.5 12.0 Yes
Operating Revenues SolTrans relies on a combination of local, state and federal funding sources for operations of the transit service. They include local sources such as fare revenue and Regional Measure 2, TDA, and rural and urban federal funds through the FTA 5311 and 5307 grant programs, respectively. SolTrans also receives federal funds through the Jobs Access and Reverse Commute (JARC) competitive grant. In FY 2011, local funds provided the largest contribution for operations, followed by TDA and then federal. However, in FY 2012, TDA was the larger contributor of revenue followed by local sources, and then federal. Using information from SolTrans budget for FY 11 and State Controller Report for FY 12, revenues are shown for the two year period. A summary of revenues by source type, including local, state and federal is also shown. Operating Revenues FY 11 FY 12
Fare Revenue $3,348,108 $3,752,911 Regional Measure 2 $1,223,840 $1,223,840 Intercity Funding Agreement $91,996 Auxiliary Transp. Revenues $665,913 Other Local $143,000 $1,057
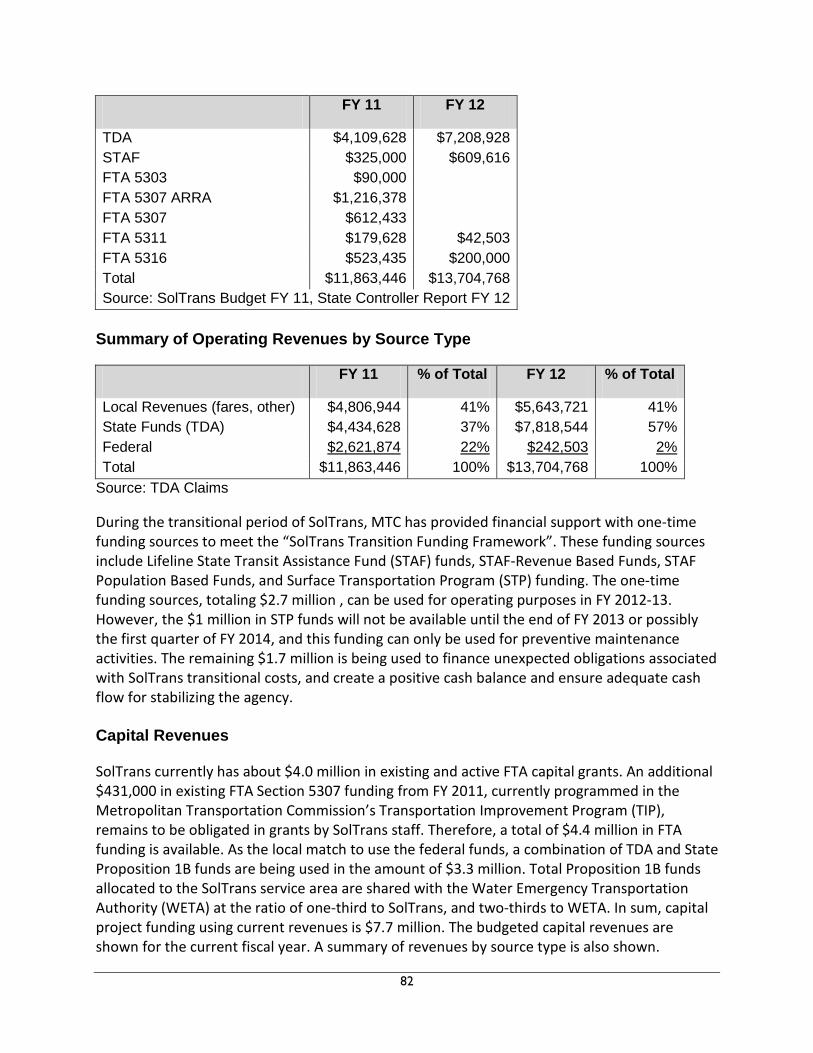
82
FY 11 FY 12
TDA $4,109,628 $7,208,928 STAF $325,000 $609,616 FTA 5303 $90,000 FTA 5307 ARRA $1,216,378 FTA 5307 $612,433 FTA 5311 $179,628 $42,503 FTA 5316 $523,435 $200,000 Total $11,863,446 $13,704,768 Source: SolTrans Budget FY 11, State Controller Report FY 12
Summary of Operating Revenues by Source Type FY 11 % of Total FY 12 % of Total
Local Revenues (fares, other) $4,806,944 41% $5,643,721 41% State Funds (TDA) $4,434,628 37% $7,818,544 57% Federal $2,621,874 22% $242,503 2% Total $11,863,446 100% $13,704,768 100%
Source: TDA Claims
During the transitional period of SolTrans, MTC has provided financial support with one-time funding sources to meet the “SolTrans Transition Funding Framework”. These funding sources include Lifeline State Transit Assistance Fund (STAF) funds, STAF-Revenue Based Funds, STAF Population Based Funds, and Surface Transportation Program (STP) funding. The one-time funding sources, totaling $2.7 million , can be used for operating purposes in FY 2012-13. However, the $1 million in STP funds will not be available until the end of FY 2013 or possibly the first quarter of FY 2014, and this funding can only be used for preventive maintenance activities. The remaining $1.7 million is being used to finance unexpected obligations associated with SolTrans transitional costs, and create a positive cash balance and ensure adequate cash flow for stabilizing the agency. Capital Revenues SolTrans currently has about $4.0 million in existing and active FTA capital grants. An additional $431,000 in existing FTA Section 5307 funding from FY 2011, currently programmed in the Metropolitan Transportation Commission’s Transportation Improvement Program (TIP), remains to be obligated in grants by SolTrans staff. Therefore, a total of $4.4 million in FTA funding is available. As the local match to use the federal funds, a combination of TDA and State Proposition 1B funds are being used in the amount of $3.3 million. Total Proposition 1B funds allocated to the SolTrans service area are shared with the Water Emergency Transportation Authority (WETA) at the ratio of one-third to SolTrans, and two-thirds to WETA. In sum, capital project funding using current revenues is $7.7 million. The budgeted capital revenues are shown for the current fiscal year. A summary of revenues by source type is also shown.

83
Capital Revenues by Source FY13
State Funds (TDA) $1,395,000 State Funds (Prop 1B) $1,830,526 FTA 5307 $430,598 FTA Grants $3,960,000 Total $7,616,124 Source: SolTrans Board Agenda 9/20/12
Summary of Capital Revenues by Source Type FY 13 % of Total
State Funds $3,225,526 42% FTA $4,390,598 58% Total $7,616,124 100%
Separately, and contained in MTC’s TIP, SolTrans currently holds about $1.2 million in FTA 5307 funding that is programmed to fifteen separate projects. The fifteen projects had been previously planned by either City of Vallejo or City of Benicia staff, and are either not critical for the SolTrans system at this time, or may be funded with more flexible funding such as TDA. Rather than continuing to fund these fifteen smaller separate projects, SolTrans staff recommended applying the $1.2 million to a few critical and manageable projects, with the goal of closing-out projects as quickly as possible. The SolTrans Board approved reprogramming of these funds to allow for timely use of funds, quicker project delivery, and a local match reserve. Of the $1.2 million, about $506,000 will be used for capital projects and the remaining for operating expenses and preventive maintenance.1 Historically, FTA 5307 funding has been used for capital purposes by both cities of Vallejo and Benicia. TDA funds were the primary source of operating assistance. SolTrans staff is developing a funding strategy with Board approval to use 5307 funding for operating assistance instead, which MTC allows under their proposed Transit Capital Priorities (TCP) Policy. SolTrans will then be able to save TDA funds as a local match reserve or for some other purpose. This is due to the fact that SolTrans does not currently have a local fund reserve for meeting the local match for capital projects. Since TDA is one of the most flexible funding sources available to SolTrans, the agency can decide to use this funding for any transit-related capital or operating purpose as approved by MTC.
1 The $506,000 includes $431,000 that is part of the $7.7 million identified above for capital projects. The remaining $75,000 will be used for technology upgrades.

84
Capital Expenses The proposed capital projects for the $7.7 million in federal and local match funding by SolTrans includes farebox upgrades, automatic vehicle location (AVL) system, hybrid commuter bus replacement, video security cameras, operations/maintenance facility improvements, communications system, information technology equipment, and branding/website. The largest expenditures will be for the replacement vehicles ($2.9 million), AVL technology ($2.2 million), and bus facility rehabilitation ($1.5 million). SolTrans has recently replaced all but a few local transit buses and does not anticipate another large local bus replacement until year 2022.
TDA Balance The Vallejo/Benicia apportionment area comprising the SolTrans service area receives about $4.7 million in Transportation Development Act Funds on an annual basis. According to funding information provided by the Solano Transportation Authority based on data from the Metropolitan Transportation Commission, after allocation for transit expenses for FY 2012-13, a balance of approximately $200,000 in TDA reserve funds remain for SolTrans. Cost Containment When the JPA that created SolTrans became effective, contract transit management, and since then full time administrative staff, have been making effort to integrate and restructure the former Vallejo and Benicia transit services. A General Manager was hired prior to the start of fiscal year 2012-13, as well as a Finance Officer shortly afterward, to plan and manage the board approved changes occurring for SolTrans.
Beginning in July 2012, SolTrans restructured service systemwide that has impacted nearly all existing services in order to address a $3.0 million structural deficit. The service reductions will result in the elimination of approximately 15,500 annual service hours, about a 10 percent reduction in service. The final determination of service changes was crafted with the objective to create a sustainable, reliable, and productive system. These system changes are the product of extensive public meetings and outreach with existing ridership and the citizens of both Benicia and Vallejo.
Anticipated improvements from the route changes include:
• Direct access from Northeast Vallejo to Gateway Plaza
• Improved reliability and connections between buses
• Sunday service that serves Vallejo and Benicia, and connects to BART
• Continued connections to Diablo Valley College
• Direct service to Discovery Kingdom
• Improved Dial-A-Ride in Benicia through allocation of additional resources
85
• Implementation of a single regional monthly pass allowing travel on all SolTrans commuter routes
• Implementation of both Regional and Local Day Passes for fixed route and Dial-A-Ride
While some cost savings will be realized from the reduction in service and subsequent reduction in the contract operator’s cost, the savings are not expected to meet SolTrans’ cost goal. SolTrans transit management has also identified operational efficiencies to contain cost. Efficiencies include meeting on-time performance targets that go towards increasing customer service but also reducing the need, and cost, to send out extra buses to meet time schedules. In addition to the service reductions, a Request for Proposals for transit operations services was recently released to procure a private vendor to operate the service and maintain vehicles, transit facilities and amenities. SolTrans and the current contractor negotiated a contract extension that will end in June 2013. The RFP was developed with further cost reductions in mind, given that purchased transportation comprises the largest operating expenditure category for SolTrans. Five Year Financial Forecast A forecast of revenues and expenses for both operations and capital projects for SolTrans is presented for the next five-years. The forecast is based in part on SolTrans FY 2013 operations and capital budget and forecast and provides a base scenario that relies on stable funding streams for operations to sustain the transit system. TDA funds, Regional Measure 2, FTA 5307 grant monies, and fare revenue are the main revenue sources to fund operations. Transitional one-time funding provided by MTC is also shown in FY 2013. As SolTrans operates a number of Solano Express commuter routes, TDA contributions from other local jurisdictions are obtained through the intercity transit cost sharing agreement and are included in the fixed route bus revenue forecast.
SolTrans claimed almost the full apportionment amounts plus carryover, including for both Benicia and Vallejo, for transit services in FY 2013. TDA funds will grow marginally during the forecast period given some improvement that is expected in the economy in the coming years. While TDA revenues in Solano County have grown an average of almost 5 percent per year over the last 20 years (in actual dollars), the average figure factors in both economic peaks and valleys over a long time period. Because of the relatively short forecast period and to remain conservative, TDA growth rates are assumed to follow the forecasted Consumer Price Index for the San Francisco Consolidated Metropolitan Statistical Area (CMSA) developed by the State Department of Finance. The CPI forecast, which goes through FY 2015-16, assumes a 2 percent growth rate per year. The TSP forecast follows this trend. Also, accounting for continued level of some economic growth that is expected to occur slowly in the future, the TSP shows 3 percent growth per year for the last two years of the forecast.

86
SolTrans identifies funding sources that are uncertain or are competitive and not stable on an annual basis. They include STAF Lifeline, FTA 5311 rural, and FTA 5307 preventive maintenance fuel allocation. To be conservative, future revenues are reduced from 2013 budgeted amounts.
Fare revenues increase by 2 percent per year to reflect stable operations from service enhancements. STAF revenue-based funds are projected to decrease from budgeted 2013 levels beginning in FY 2014 because SolTrans will receive one-third of the amount and WETA will receive two-thirds. The Governor’s FY 2013-14 State budget also proposes a reduction in STAF by about 6 percent from the previous year.
Operations expenses designated to the fixed route system include local and commuter bus services, and small amounts for bus facility maintenance. Growth in operations is assumed at 3 percent per year which is slightly above the forecasted growth in CPI for the San Francisco Consolidated Metropolitan Statistical Area (CMSA). No transfer center operations/ maintenance expenses appear to be in the fixed route budget. Paratransit expenses are primarily for the transit services contract.
The baseline revenue service hours are based on the SolTrans FY 2011-12 State Controller Report data. The supplemental operations data indicates revenue service hours to be 97,900 for fixed route, and 15,200 for dial-a-ride.
On the capital side, capital projects in FY 2012-13 are budgeted with sufficient funding including replacement of three Solano Express Model Year 2001 commuter buses with hybrid commuter coaches. One bus will go to FAST and two will remain with SolTrans to replace buses bought in FY 2001, leaving one additional 2001 commuter bus owned by SolTrans to replace in 2015. However, with recent MTC action to modify the eligible claimants for several Bay Area UZAs, including the San Francisco/Oakland and Vallejo UZAs, replacement of these express buses would no longer be eligible from this fund source even though they continue to provide service within the San Francisco/Oakland UZA. Solano Transit Authority has requested that MTC modify this recent action to ensure that the replacement of Solano Express Buses, consistent with MTC Resolution 3434 which provide service to BART, remain eligible for San Francisco/Oakland UZA funds. From the same MTC action, SolTrans would become the sole eligible claimant in the Vallejo UZA with the exception of Napa transit service which receives an annual allocation for ADA paratransit assistance due to American Canyon residing in the Vallejo Urbanized Area. All other MCI buses are Model Year 2003, and based on MTC's TCP policy, these buses have a useful life of 14 years and will need to be replaced in 2017. However, SolTrans plans to extend the life of the buses by 2 to 3 years beyond the 14 year life span due to completed midlife engine replacements. SolTrans is developing a reserve policy for TDA as part of its strategy to bank operating revenue savings for future capital expenses. Actual level of reserves will be determined along with FTA 5307 funds to pay for the large replacement of commuter buses.

87
Preventive maintenance is projected to be $200,000 per year beginning in FY 2013-14 and will include labor and parts associated with capitalized maintenance work (i.e. replacement of engines, transmissions, hybrid battery packs, and other capital work that would typically exceed $5,000 in total). Unused funds in a given year will be carried-over to the next year. Therefore, actual funding investment on an annual basis may be less than shown, if funding is carried-over year after year.
Full renovation and expansion of the bus facility on Broadway is budgeted at $2 million in FY 2013. The current SolTrans capital budget for FY 2013 includes $1.5 million in federal and local funding. In addition, the City of Vallejo has roughly $500,000 in an existing FTA grant (including the local match) for the renovation. Beyond this, some funding is set-aside for other potential maintenance needs. The Curtola Transit & Parking Center is not included until such time that funding is clearly allocated by MTC for this project.
Technology enhancements such as information technology equipment, communications, farebox upgrade, security cameras, and automatic vehicle locator systems are budgeted in 2013 at a cost of over $3 million. In FY 2014, $200,000 is projected should SolTrans need to invest in a comprehensive phone system for ADA compliance purposes and for improved customer service. Beyond FY 2014, $100,000 is budgeted for unforeseen technology needs. An additional $250,000 is budgeted for branding and website development in FY 2013.
Vehicle replacement unit costs are based on the most recent MTC regional bus/van pricelist for FYs 2012-13 and FY 2013-14 for Transit Capital Priorities Call for Projects. SolTrans provided the vehicle replacement costs for three commuter buses in FY 2012-13 which are similar to those in the MTC pricelist. Unit costs include cutaway vehicles at $118,000 (over 26 feet), and minivans at $54,000. The pricelist assumes a 2 percent annual growth in vehicle cost. Capital costs for preventive maintenance, technology enhancements, automated vehicle locator system, and branding/website development are provided by SolTrans.
Based on the fleet list and vehicle ages, with the understanding that SolTrans anticipates prolonging the useful life of the existing commuter buses, vehicles assumed to need replacement over the next five years include a total of 13 vehicles ranging from ADA accessible vans to paratransit vehicles to large commuter buses (only those commuter buses replaced in 2013). SolTrans’ local fleet of 21 Model Year 2011 Gillig hybrid buses are sufficient for meeting current service levels with some room for expansion. Funding is identified for over-the-road bus replacements in FY 2013, while the TDA reserve policy that will be developed, together with federal grant funds, will likely be used to pay for future replacements beyond the forecast period. A listing of capital projects by year is shown.
FY 12-13: 3 replacements of year 2001, 52 passenger commuter buses; bus facility improvements; technology enhancements; and branding/website improvements.
FY 13-14: 3 replacement of year 2000 and 2001 supervisor cars with ADA accessible vans; bus preventive maintenance; facility maintenance; technology enhancement.
FY 14-15: Bus preventive maintenance; facility maintenance; technology enhancement.

88
FY 15-16: Bus preventive maintenance; facility maintenance; technology enhancement.
FY 16-17: Bus preventive maintenance; facility maintenance; technology enhancement.
FY 17-18: 7 replacements of 2011, 16 passenger paratransit vehicles; bus preventive maintenance; facility maintenance; technology enhancement.
The financial forecast data is expressed in year of expenditure. As shown in the forecast, SolTrans will operate at an overall annual surplus under current conditions. Fixed route operations will have a sizable surplus while paratransit will incur a smaller deficit, thus a net surplus systemwide. One time transitional funds provided by MTC, as well as remaining federal grants being transferred from Vallejo to SolTrans, provide additional boosts to the revenues in the short term. As identified in SolTrans’ budget assumptions, certain revenue sources included in the forecast have been identified as uncertain given their competitive nature. As such, a decrease in these funds is assumed after the initial year. The surplus operating revenues support SolTrans’ strategy to bank operations savings to use for capital purchases, as well as develop a reserve policy.
The large capital replacement of commuter buses after the forecast period presents a challenge for adequate funding. The flexibility in TDA savings along with potential FTA 5307 grants would help in funding the replacements. SolTrans plans to extend the useful lives of the existing commuter fleet, which would enable funding to further build up. The capital funding buildup is dependent in large part on the future growth of operations and the level of TDA needed to support this growth.
Financial Projections - Fixed Route
Capital and Operating
(Numbers are expressed in Year of Expenditure $) Fiscal Year FY 12-13 FY 13-14 FY 14-15 FY 15-16 FY 16-17 FY 17-18 Capital Expense Vehicle Replacement $2,850,000 $0 $0 $0 $0 $0 Preventive Maintenance - Bus $200,000 $200,000 $200,000 $200,000 $200,000 Preventive Maintenance - Facilities $2,000,000 $20,000 $20,000 $20,000 $20,000 $20,000 Technology $1,080,000 $200,000 $100,000 $100,000 $100,000 $100,000 Automatic Vehicle Locator System $2,160,000 Branding & Website-System Investments $250,000 Total $8,340,000 $420,000 $320,000 $320,000 $320,000 $320,000 Capital Revenue

89
Financial Projections - Fixed Route Capital and Operating
(Numbers are expressed in Year of Expenditure $) Fiscal Year FY 12-13 FY 13-14 FY 14-15 FY 15-16 FY 16-17 FY 17-18 Transportation Development Act (1) $1,395,000 $84,000 $64,000 $64,000 $64,000 $64,000 RM 2 $130,000 Proposition 1B $1,831,000 FTA Grants $3,960,000 FTA 5307 $566,000 $336,000 $256,000 $256,000 $256,000 $256,000 FTA 5339 $458,000 $493,000 Total $8,340,000 $913,000 $320,000 $320,000 $320,000 $320,000 Annual Net Surplus/Deficit - Capital $0 $493,000 $0 $0 $0 $0 Cumulative Net Surplus/Deficit - Capital $0 $493,000 $493,000 $493,000 $493,000 $493,000 Operating Expense
Fixed Route (2) $9,809,000 $10,103,000 $10,406,000 $10,718,000 $11,040,000 $11,371,000 Total $9,809,000 $10,103,000 $10,406,000 $10,718,000 $11,040,000 $11,371,000 Operating Revenue
Fares (3) $3,250,000 $3,315,000 $3,381,000 $3,449,000 $3,518,000 $3,588,000 Other Income $5,000 $5,000 $5,000 $5,000 $5,000 $5,000 RM 2 $1,224,000 $1,200,000 $1,200,000 $1,200,000 $1,200,000 $1,200,000 Transportation Development Act (4) $3,417,000 $3,485,000 $3,555,000 $3,626,000 $3,735,000 $3,847,000 TDA Intercity Transit Cost Sharing $213,000 $217,000 $221,000 $225,000 $232,000 $239,000
STAF - Revenue Based (5) $586,000 $171,000 $171,000 $171,000 $171,000 $171,000 STAF Lifeline * $375,000 $375,000 $375,000 $375,000 $375,000 $375,000 FTA 5307 $3,264,000 $2,958,000 $3,228,000 $3,200,000 $3,200,000 $3,200,000 FTA 5307 - Fuel * $321,000 FTA 5311 * $107,000 $50,000 $50,000 $50,000 $50,000 $50,000 FTA 5316 $300,000 $100,000 $100,000 $100,000 $100,000 $100,000 Unused Vallejo FTA Grants (O&M) $1,689,000 Transitional One-Time Funding

90
Financial Projections - Fixed Route Capital and Operating
(Numbers are expressed in Year of Expenditure $) Fiscal Year FY 12-13 FY 13-14 FY 14-15 FY 15-16 FY 16-17 FY 17-18 STAF - Revenue Based One -Time (6) $549,000 STAF - Population Based One-Time (7) $878,000 STAF Lifeline One-Time $182,000 FTA STP Prev. Maint. One-Time $1,000,000 Total $15,671,000 $13,565,000 $12,286,000 $12,401,000 $12,586,000 $12,775,000 Annual Net Surplus/Deficit - Operations $5,862,000 $3,462,000 $1,880,000 $1,683,000 $1,546,000 $1,404,000 Cumulative Net Surplus/Deficit - Operations $5,862,000 $9,324,000 $11,204,000 $12,887,000 $14,433,000 $15,837,000
(1) SolTrans is developing a reserve policy for TDA as part of its strategy to bank operating revenue savings for future capital expenses. Actual level of reserves to be determined.
(2) Operating expenses includes $15,000 for bus facility maintenance. Operating expenses grow by 3% per year, slightly above forecasted growth in CPI for the San Francisco Consolidated Metropolitan Statistical Area (CMSA). (3) Fare revenues increase by 2% per year to reflect stable operations from service enhancements. (4) TDA revenues are net of FAST Intercity and STA Planning totaling an additional $345,000. TDA growth is 2 percent for first three years, and 3 percent remaining two years, mirroring forecasted growth of SF CMSA CPI Forecast through FY 2015-16. SolTrans is developing a reserve policy for TDA for its strategy to bank operating revenue savings for future capital expenses. (5) Combined Vallejo and Benicia STAF revenue-based apportionments for FY 2012-13. STAF reduction of 6% between FYs 2013 and 2014 based on proposed FY 2013-14 State budget. SolTrans will receive 1/3 of Vallejo STAF beginning in FY 2014, and 2/3 goes to WETA. Revenue is held constant in forecast since STAF is volatile based on unpredictable diesel fuel sales. (6) Unprogrammed/unclaimed Vallejo STAF Revenue Based, MTC Resolution 4051
(7) Benicia Debt Retirement payment of $121,600 not included. * SolTrans identifies these funding sources as uncertain/one-time/competitive grant funds. Revenues are either held
constant or reduced to reflect uncertainty.

91
Financial Projections - Paratransit and Local and Intercity Taxi Capital and Operating
(Numbers are expressed in Year of Expenditure $) Fiscal Year FY 12-13 FY 13-14 FY 14-15 FY 15-16 FY 16-17 FY 17-18 Capital Expense Vehicle Replacement $0 $162,000 $0 $0 $0 $894,000 Total $0 $162,000 $0 $0 $0 $894,000 Capital Revenue Transportation Development Act $162,000 $894,000 Proposition 1B Total $0 $162,000 $0 $0 $0 $894,000 Annual Net Surplus/Deficit - Capital $0 $0 $0 $0 $0 $0 Cumulative Net Surplus/Deficit - Capital $0 $0 $0 $0 $0 $0 Operating Expense Paratransit (1) $1,732,000 $1,784,000 $1,838,000 $1,893,000 $1,950,000 $2,009,000 Taxi (Local and Regional) (1) $236,000 $243,000 $250,000 $258,000 $266,000 $274,000 Total $1,968,000 $2,027,000 $2,088,000 $2,151,000 $2,216,000 $2,283,000 Operating Revenue Fares - Paratransit $81,000 $83,000 $85,000 $87,000 $89,000 $91,000 Fares - Local Taxi $112,000 $114,000 $116,000 $118,000 $120,000 $122,000 Fares - Regional Taxi $25,000 $26,000 $27,000 $28,000 $29,000 $30,000 Transportation Development Act (2) $1,082,000 $1,104,000 $1,126,000 $1,149,000 $1,183,000 $1,218,000 FTA 5307 ADA Setaside (3) $594,000 $200,000 $200,000 $200,000 $200,000 $200,000

92
Financial Projections - Paratransit and Local and Intercity Taxi Capital and Operating
(Numbers are expressed in Year of Expenditure $) Fiscal Year FY 12-13 FY 13-14 FY 14-15 FY 15-16 FY 16-17 FY 17-18 Total $1,894,000 $1,527,000 $1,554,000 $1,582,000 $1,621,000 $1,661,000 Annual Net Surplus/Deficit - Operations -$74,000 -$500,000 -$534,000 -$569,000 -$595,000 -$622,000 Cumulative Net Surplus/Deficit - Operations -$74,000 -$574,000 -$1,108,000 -$1,677,000 -$2,272,000 -$2,894,000
(1) Operating expenses grow by 3% per year, slightly above forecasted growth in CPI for the San Francisco Consolidated Metropolitan Statistical Area (CMSA). (2) TDA revenues are net of STA Planning totaling an additional $141,000.
(3) $200,000 from SF-Oakland Urbanized Area beginning in FY 2013-14, in MTC Resolution 4072. Vallejo Urbanized Area will be included in 5307 "operating assistance" lump amount.
Financial Projections - Complete System (Fixed Route, Paratransit, Local Taxi and Intercity Taxi) Capital and Operating
(Numbers are expressed in Year of Expenditure $) Fiscal Year FY 12-13 FY 13-14 FY 14-15 FY 15-16 FY 16-17 FY 17-18 Capital Expense Vehicle Replacement $2,850,000 $162,000 $0 $0 $0 $894,000 Preventive Maintenance - Bus $0 $200,000 $200,000 $200,000 $200,000 $200,000 Preventive Maintenance - Facilities $2,000,000 $20,000 $20,000 $20,000 $20,000 $20,000 Technology $1,080,000 $200,000 $100,000 $100,000 $100,000 $100,000 Automatic Vehicle Locator System $2,160,000 $0 $0 $0 $0 $0 Branding & Website-System Investments $250,000 $0 $0 $0 $0 $0 Total $8,340,000 $582,000 $320,000 $320,000 $320,000 $1,214,000

93
Financial Projections - Complete System (Fixed Route, Paratransit, Local Taxi and Intercity Taxi) Capital and Operating
(Numbers are expressed in Year of Expenditure $) Fiscal Year FY 12-13 FY 13-14 FY 14-15 FY 15-16 FY 16-17 FY 17-18 Capital Revenue Transportation Development Act (1) $1,395,000 $246,000 $64,000 $64,000 $64,000 $958,000 RM 2 $130,000 $0 $0 $0 $0 $0 Proposition 1B $1,831,000 $0 $0 $0 $0 $0 FTA Grants $3,960,000 $0 $0 $0 $0 $0 FTA 5307 $566,000 $336,000 $256,000 $256,000 $256,000 $256,000 FTA 5339 $458,000 $493,000 $0 $0 $0 $0 Total $8,340,000 $1,075,000 $320,000 $320,000 $320,000 $1,214,000 Annual Net Surplus/Deficit - Capital $0 $493,000 $0 $0 $0 $0 Cumulative Net Surplus/Deficit - Capital $0 $493,000 $493,000 $493,000 $493,000 $493,000 Operating Expense Operations $11,777,000 $12,130,000 $12,494,000 $12,869,000 $13,256,000 $13,654,000 Total $11,777,000 $12,130,000 $12,494,000 $12,869,000 $13,256,000 $13,654,000 Operating Revenue Fares $3,468,000 $3,538,000 $3,609,000 $3,682,000 $3,756,000 $3,831,000 Other Income $5,000 $5,000 $5,000 $5,000 $5,000 $5,000 RM 2 $1,224,000 $1,200,000 $1,200,000 $1,200,000 $1,200,000 $1,200,000 Transportation Development Act (1) $4,499,000 $4,589,000 $4,681,000 $4,775,000 $4,918,000 $5,065,000 TDA Intercity Transit Cost Sharing $213,000 $217,000 $221,000 $225,000 $232,000 $239,000 STAF - Revenue Based $586,000 $171,000 $171,000 $171,000 $171,000 $171,000 STAF Lifeline * $375,000 $375,000 $375,000 $375,000 $375,000 $375,000 FTA 5307 $3,858,000 $3,158,000 $3,428,000 $3,400,000 $3,400,000 $3,400,000 FTA 5307 - Fuel * $321,000 $0 $0 $0 $0 $0 FTA 5311 * $107,000 $50,000 $50,000 $50,000 $50,000 $50,000 FTA 5316 $300,000 $100,000 $100,000 $100,000 $100,000 $100,000

94
Financial Projections - Complete System (Fixed Route, Paratransit, Local Taxi and Intercity Taxi) Capital and Operating
(Numbers are expressed in Year of Expenditure $) Fiscal Year FY 12-13 FY 13-14 FY 14-15 FY 15-16 FY 16-17 FY 17-18 Unused Vallejo FTA Grants (O&M) $1,689,000 Transitional One-Time Funding STAF - Revenue Based One -Time $549,000 $0 $0 $0 $0 $0 STAF - Population Based One-Time $878,000 $0 $0 $0 $0 $0 STAF Lifeline One-Time $182,000 $0 $0 $0 $0 $0 FTA STP Prev. Maint. One-Time $1,000,000 $0 $0 $0 $0 $0 Total $17,565,000 $15,092,000 $13,840,000 $13,983,000 $14,207,000 $14,436,000 Annual Net Surplus/Deficit - Operations $5,788,000 $2,962,000 $1,346,000 $1,114,000 $951,000 $782,000 Cumulative Net Surplus/Deficit - Operations $5,788,000 $8,750,000 $10,096,000 $11,210,000 $12,161,000 $12,943,000
(1) SolTrans is developing a reserve policy for TDA as part of its strategy to bank operating revenue savings for future capital expenses. Actual level of reserves to be determined. (2) TDA revenues are net of STA Planning totaling an additional $141,000.
* SolTrans identifies these funding sources as uncertain/one-time/competitive grant funds. Revenues are either held constant or reduced to reflect uncertainty.

95
City of Vacaville City Coach The following tables provide an initial summary of the historic financial and performance data for Vacaville City Coach. Data sources used to comprise the tables include TDA Claims, Fiscal Audits, Comprehensive Annual Financial Reports, MTC Statistical Summary, Operating Budget, State Controller Reports, and National Transit Database.2 A review of other data sources including the Short Range Transit Plan was also conducted. Data Consistency A comparison of key financial and operations data was undertaken to determine the general accuracy of the recording and reporting by City of Vacaville. With an understanding that various reports are submitted at different times on the local, regional and state level, most are all prepared after the end of the fiscal year and ideally should match. An exception is the Operating Budget which provides adopted and proposed budgets for FYs 2010-11 and 2011-12 respectively. The listing of the data provides comparison to show minor discrepancies that may exist among the various data sources that portray the financial health of the transit system. The data reported in the annual MTC Statistical Summary include only the fixed route and paratransit services, and not either the local taxi or intercity taxi programs. In comparison, the other data sources include all public transit services managed by the city. Full time equivalents are reported for fixed route and paratransit services, and do not include either taxi programs. For non-fixed route services, the financial audits aggregate total operations cost and fare revenue for paratransit, local taxi, and intercity taxi. Other data sources separate among these three services. This explains the discrepancy in operating cost and fare revenues in the paratransit and taxi table. Fiscal year 2010-11 was the first full year of the intercity taxi scrip program managed by Vacaville. Overall, in consideration of which transit services are reported in the respective sources, the data provide relatively consistent information.
2 On an annual basis, the City of Vacaville certifies that the transit system operates 30 or fewer vehicles in annual maximum service and reports to the FTA as a Small Systems Waiver agency for purposes of the National Transit Database. This status requires Vacaville to submit fewer forms to NTD than without the waiver.
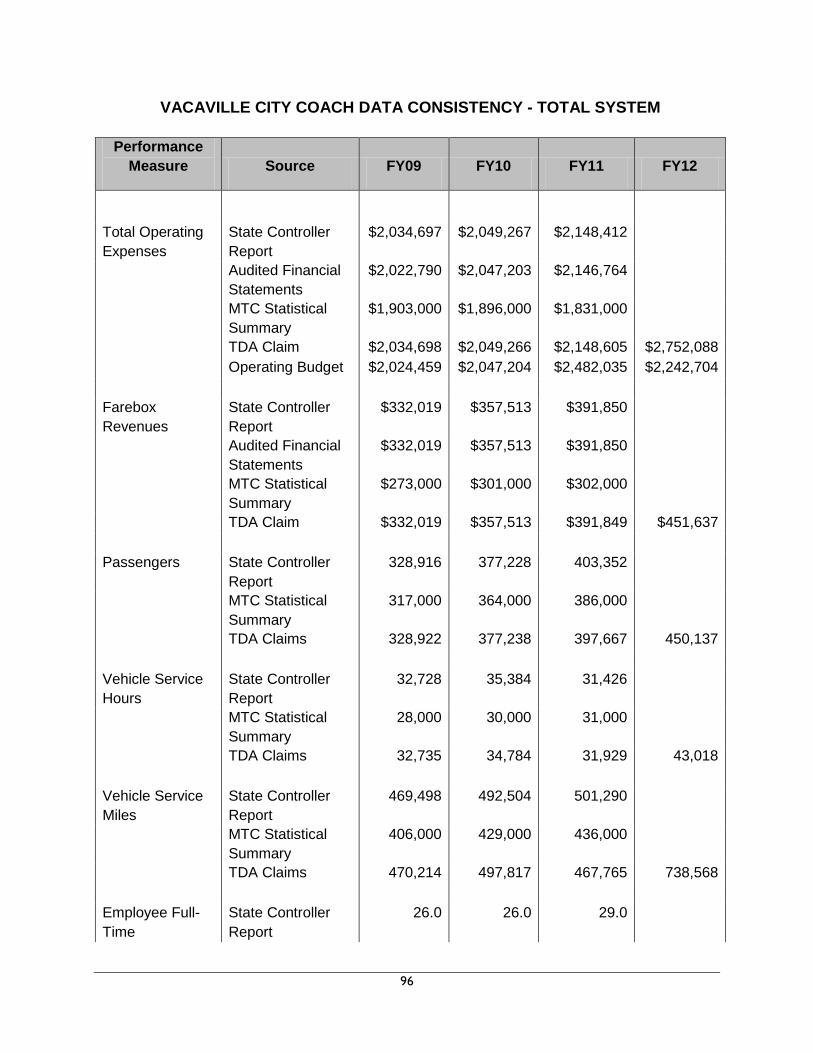
96
VACAVILLE CITY COACH DATA CONSISTENCY - TOTAL SYSTEM
Performance Measure Source FY09 FY10 FY11 FY12
Total Operating Expenses
State Controller Report
$2,034,697 $2,049,267 $2,148,412
Audited Financial Statements
$2,022,790 $2,047,203 $2,146,764
MTC Statistical Summary
$1,903,000 $1,896,000 $1,831,000
TDA Claim $2,034,698 $2,049,266 $2,148,605 $2,752,088 Operating Budget $2,024,459 $2,047,204 $2,482,035 $2,242,704 Farebox Revenues
State Controller Report
$332,019 $357,513 $391,850
Audited Financial Statements
$332,019 $357,513 $391,850
MTC Statistical Summary
$273,000 $301,000 $302,000
TDA Claim $332,019 $357,513 $391,849 $451,637 Passengers State Controller
Report 328,916 377,228 403,352
MTC Statistical Summary
317,000 364,000 386,000
TDA Claims 328,922 377,238 397,667 450,137 Vehicle Service Hours
State Controller Report
32,728 35,384 31,426
MTC Statistical Summary
28,000 30,000 31,000
TDA Claims 32,735 34,784 31,929 43,018
Vehicle Service Miles
State Controller Report
469,498 492,504 501,290
MTC Statistical Summary
406,000 429,000 436,000
TDA Claims 470,214 497,817 467,765 738,568
Employee Full-Time
State Controller Report
26.0 26.0 29.0

97
MTC Statistical Summary
22.0 22.0 22.0
TDA Claims 22.0 22.0 26.0 24.0
VACAVILLE CITY COACH DATA CONSISTENCY - FIXED ROUTE
Performance Measure Source FY09 FY10 FY11 FY12
Operating Cost State Controller Report
$1,422,575 $1,454,669 $1,404,235
Audited Financial Statements
$1,414,367 $1,454,284 $1,403,450
MTC Statistical Summary
$1,423,000 $1,455,000 $1,427,000
TDA Claim $1,422,575 $1,454,668 $1,404,427 $1,796,309 Operating Budget $1,416,036 $1,454,284 $1,594,205 $1,429,865 National Transit
Database $1,693,024
Passenger Fares State Controller
Report $242,166 $270,951 $276,749
Audited Financial Statements
$242,166 $270,951 $276,749
MTC Statistical Summary
$242,000 $271,000 $272,000
TDA Claim $242,166 $270,951 $276,749 $314,060 National Transit
Database $339,687
Passengers State Controller
Report 302,461 350,410 372,412
MTC Statistical Summary
302,000 350,000 372,000
TDA Claims 302,461 350,410 372,412 425,014
National Transit Database
446,109
Vehicle Service Hours
State Controller Report
23,204 25,120 23,670

98
MTC Statistical Summary
23,000 25,000 26,000
TDA Claims 23,206 25,130 25,744 36,582
National Transit Database
33,767
Vehicle Service Miles
State Controller Report
340,485 364,277 348,631
MTC Statistical Summary
340,000 365,000 375,000
TDA Claims 340,485 364,512 379,238 525,066
National Transit Database
525,949
Employee Full-Time Equivalents
State Controller Report
21 21 24
MTC Statistical Summary
18 18 18
TDA Claims 18 18 22 24
VACAVILLE CITY COACH DATA CONSISTENCY – PARATRANSIT AND LOCAL TAXI
Performance Measure Source FY09 FY10 FY11 FY12
Operating Cost State Controller Report
$612,122 $594,598 $527,210
Audited Financial Statements
$608,423 $592,919 $743,314
TDA Claims $612,123 $576,991 $527,212 $609,600 Operating Budget $608,423 $575,313 $598,250 $657,057 Passenger Fares State Controller
Report $89,853 $86,562 $82,556
Audited Financial Statements
$89,853 $86,562 $115,101
TDA Claims $89,853 $83,606 $82,556 $85,650

99
Passengers State Controller Report
26,455 26,818 25,255
TDA Claims 26,461 26,054 25,255 25,123
Vehicle Service Hours
State Controller Report
9,524 10,264 5,750
TDA Claims 9,529 9,097 6,185 6,436
Vehicle Service Miles
State Controller Report
129,013 128,227 83,212
TDA Claims 129,729 124,943 88,527 89,928
VACAVILLE CITY COACH DATA CONSISTENCY – SPECIAL SERVICES (PARATRANSIT)
Performance Measure Source FY09 FY10 FY11 FY12
Operating Cost MTC Statistical Summary
$480,000 $441,000 $404,000
TDA Claims $480,219 $440,954 $399,098 $456,501 National Transit
Database $468,084
Passenger Fares MTC Statistical
Summary $31,000 $30,000 $30,000
TDA Claims $31,123 $29,696 $30,055 $27,705 National Transit
Database $58,060
Passengers State Controller Report 14,767 14,312 14,212
MTC Statistical Summary
15,000 14,000 14,000
TDA Claims 14,773 14,312 14,212 13,687
National Transit Database
13,707
Vehicle Service Hours
State Controller Report 5,315 5,569 4,723
MTC Statistical Summary
5,000 5,000 5,000

100
TDA Claims 5,320 5,047 5,158 5,295
National Transit Database
5,311
Vehicle Service Miles
State Controller Report 65,715 59,080 56,895
MTC Statistical Summary
66,000 64,000 61,000
TDA Claims 66,431 64,012 62,210 63,140
National Transit Database
61,666
Employee Full-Time Equivalents
State Controller Report 5 5 5
MTC Statistical Summary
4 4 4
TDA Claims 4 4 4
VACAVILLE CITY COACH DATA CONSISTENCY - LOCAL TAXI SCRIP
Performance Measure Source FY09 FY10 FY11 FY12
Operating Cost TDA Claims $131,904 $136,037 $128,114 $153,099 Passenger Fares TDA Claims $58,730 $53,910 $52,501 $57,945
Passengers TDA Claims 11,688 11,742 11,043 11,436 State Controller Report 11,688 12,506 11,043
Vehicle Service Hours
TDA Claims 4,209 4,050 1,027 1,141
State Controller Report 4,209 4,695 1,027
Vehicle Service Miles
TDA Claims 63,298 60,931 26,317 26,788
State Controller Report 63,298 69,147 26,317
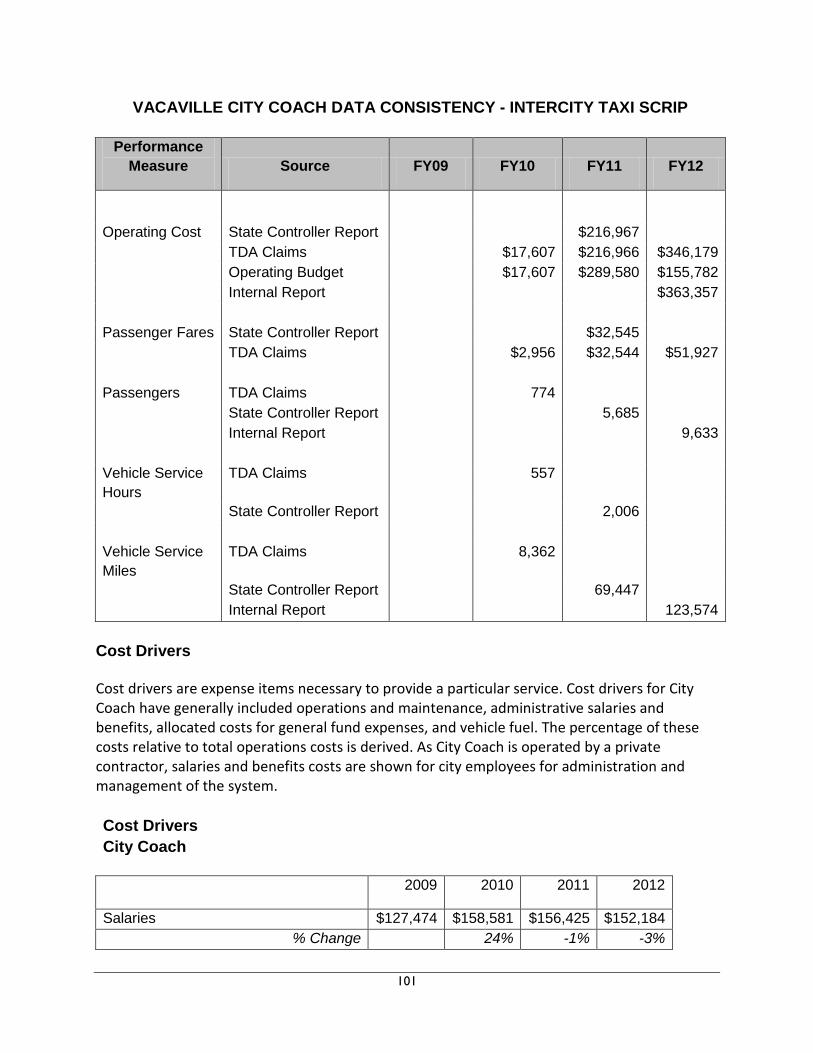
101
VACAVILLE CITY COACH DATA CONSISTENCY - INTERCITY TAXI SCRIP
Performance Measure Source FY09 FY10 FY11 FY12
Operating Cost State Controller Report $216,967
TDA Claims $17,607 $216,966 $346,179
Operating Budget $17,607 $289,580 $155,782
Internal Report $363,357
Passenger Fares State Controller Report $32,545
TDA Claims $2,956 $32,544 $51,927
Passengers TDA Claims 774 State Controller Report 5,685 Internal Report 9,633 Vehicle Service Hours
TDA Claims 557
State Controller Report 2,006
Vehicle Service Miles
TDA Claims 8,362
State Controller Report 69,447 Internal Report 123,574
Cost Drivers Cost drivers are expense items necessary to provide a particular service. Cost drivers for City Coach have generally included operations and maintenance, administrative salaries and benefits, allocated costs for general fund expenses, and vehicle fuel. The percentage of these costs relative to total operations costs is derived. As City Coach is operated by a private contractor, salaries and benefits costs are shown for city employees for administration and management of the system. Cost Drivers
City Coach
2009 2010 2011 2012
Salaries $127,474 $158,581 $156,425 $152,184 % Change 24% -1% -3%

102
Benefits $70,779 $79,294 $73,694 $81,640 % Change 12% -7% 11%
Cost Allocation $0 $57,466 $53,559 $57,333 % Change -- -7% 7%
Fuel (1) $184,508 $186,302 $158,782 $194,829 % Change 1% -15% 23%
Salaries as % of Total Operations Cost (minus depreciation)
6% 8% 7% 6%
Benefits as a % of Total Operations Cost (minus Depreciation)
3% 4% 3% 3%
Cost Allocation as a % of Total Operations Cost (minus Depreciation)
0% 3% 2% 2%
Fuel as % of Total Operations Cost (minus depreciation)
9% 9% 7% 7%
(1) CNG fuel rebates not shown in figures. Source: TDA Claim Actual for FYs 09-11; TDA Claim Current Adjusted FY 2012; Annual Cost Allocation figure from City Budget.
A breakdown of audited costs between operations, maintenance, and administration is provided for the period of FYs 2008-09 through 2010-11. Operations cost comprises about 66 percent of total cost (minus depreciation), maintenance comprises 13 percent, and general administrative cost comprises the remaining 21 percent. City Coach Operations Expenses 2009 2010 2011 Operations $1,192,252 $1,211,924 $1,412,216
% Change -- 2% 17% Maintenance $255,818 $263,648 $286,769
% Change -- 3% 9% General Administration $586,628 $573,694 $449,619
% Change -- -2% -22% Depreciation $361,816 $615,414 $969,855
% Change -- 70% 58% Total $2,396,514 $2,664,680 $3,118,459
Source: TDA Claim Actual
A further division of operating expenses among other cost drivers is shown using audited data. With purchased transportation being the primary cost driver, others include fuel, services, and insurance. Trends in expenses show some variability in terms of increases and decreases, but most show decreasing cost trends on an annual basis over the last three years. For example, fuel expenses decreased in FY 2011 as a result of the fleet making a full conversion to CNG fuel

103
from diesel. Other expenses such as purchased transportation increased due to the commencement of new intercity taxi service in early 2010 while utilities remained relatively stable. Overall annual total operating expenses increased about five percent or less after excluding depreciation, primarily due to the inclusion of the new intercity taxi costs starting in early 2010. Excluding startup cost for intercity taxi, operations cost for fixed route and paratransit generally decreased over the last three years. City Coach Operations Expenses 2009 2010 2011 Services $314,288 $306,542 $256,764
% Change -2% -16% Fuels and Lubricants $184,508 $186,302 $158,782
% Change 1% -15% Casualty and Liability $77,454 $55,399 $36,621
% Change -28% -34% Utilities $12,540 $12,391 $12,547
% Change -1% 1% Purchased Transportation $1,192,252 $1,211,924 $1,412,216
% Change 2% 17% Other $55,403 $38,833 $41,556
% Change -30% 7% Administration (Labor) $198,253 $237,875 $230,119
% Change 20% -3% Depreciation $361,816 $615,414 $969,855
% Change 70% 58% Total $2,396,514 $2,664,680 $3,118,460
% Change 11% 17% Source: TDA Claim Actual
Performance Trends The following tables provide information on performance indicators and trends of the transit system. Industry performance measures are used including operating costs, fare revenues, ridership, revenue hours and miles, and full time equivalents. The general trend in fixed route and paratransit services for fiscal years 2009 through 2011 shows increased cost efficiency and effectiveness measured in cost per hour and per passenger, and farebox recovery. Subsidy per passenger also decreased over the three year period. Service effectiveness measured by passengers per hour shows an increase for fixed route while paratransit remained stable. Costs remained flat for fixed route, although ridership, service hours and miles increased thereby resulting in increased cost effectiveness. Costs for paratransit decreased with smaller declines in ridership, service hours and miles. Other measures such as fare revenue and farebox recovery increased for both fixed route and paratransit. Some performance indicators for local taxi show significant changes from a decline in service hours and miles in FY 2010-11 due in part to the introduction of intercity taxi.

104
VACAVILLE CITY COACH PERFORMANCE INDICATORS - FIXED ROUTE
Statistics & % Change Performance Indicators FY 08-09 FY 09-10 FY 10-11 FY09-FY11
Operating Costs $1,414,367 $1,454,284 $1,403,450 -0.8% Annual % Change 2.8% -3.5%
Passengers 302,461 350,410 372,412 23.1% Annual % Change 15.9% 6.3%
Vehicle Service Hours 23,206 25,130 25,744 10.9% Annual % Change 8.3% 2.4%
Vehicle Service Miles 340,485 364,512 379,238 11.4% Annual % Change 7.1% 4.0%
Employee FTEs 18.0 18.0 22.0 22.2% Annual % Change 0.0% 22.2%
Fare Revenue $242,166 $270,951 $276,749 14.3% Annual % Change 11.9% 2.1%
Local Match (Advertising revenue) $27,190 $19,180 $13,717 -49.6% Annual % Change -29.5% -28.5%
Operating Cost per Passenger $4.68 $4.15 $3.77 -19.4%
Annual % Change -11.2% -9.2% Operating Cost per Vehicle Service Hour
$60.95 $57.87 $54.52 -10.6%
Annual % Change -5.1% -5.8% Passengers per Vehicle Service Hour 13.03 13.94 14.47 11.0%
Annual % Change 7.0% 3.7% Passengers per Vehicle Service Mile 0.89 0.96 0.98 10.5%
Annual % Change 8.2% 2.2% Veh Service Hours per Employee FTE
1,289 1,396 1,170 -9.2%
Annual % Change 8.3% -16.2% Fare per Passenger $0.80 $0.77 $0.74 -7.2%
Annual % Change -3.4% -3.9% Subsidy per passenger $3.88 $3.38 $3.03 -21.9%
Annual % Change -12.9% -10.4% Farebox Recovery 19.0% 20.0% 20.7% 8.7%
Annual % Change 4.8% 3.7%
Percentage Change Consumer Price Index (Bay Area CPI)
1.8% 1.2% 1.7% 0.0%
Source: Operating Cost and Fares/Local Match from Audited Financial Statements

105
Passengers, Hours, Miles, and Employee FTEs from TDA Claim Actual
VACAVILLE CITY COACH PERFORMANCE INDICATORS – SPECIAL SERVICES (PARATRANSIT)
Statistics & % Change Performance Indicators FY 08-09 FY 09-10 FY 10-11 FY09-FY11
Operating Costs $480,219 $440,954 $399,098 -16.9% Annual % Change -8.2% -9.5%
Passengers 14,773 14,312 14,212 -3.8% Annual % Change -3.1% -0.7%
Vehicle Service Hours 5,320 5,047 5,158 -3.0% Annual % Change -5.1% 2.2%
Vehicle Service Miles 66,431 64,012 62,210 -6.4% Annual % Change -3.6% -2.8%
Employee FTEs 4.0 4.0 4.0 0.0% Annual % Change 0.0% 0.0%
Fare Revenue $31,123 $29,696 $30,055 -3.4% Annual % Change -4.6% 1.2%
Operating Cost per Passenger $32.51 $30.81 $28.08 -13.6%
Annual % Change -5.2% -8.9% Operating Cost per Vehicle Service Hour
$90.27 $87.37 $77.37 -14.3%
Annual % Change -3.2% -11.4% Passengers per Vehicle Service Hour 2.78 2.84 2.76 -0.8%
Annual % Change 2.1% -2.8% Passengers per Vehicle Service Mile 0.22 0.22 0.23 2.7%
Annual % Change 0.5% 2.2% Veh Service Hours per Employee FTE
1,330 1,262 1,290 -3.0%
Annual % Change -5.1% 2.2% Fare per Passenger $2.11 $2.07 $2.11 0.4%
Annual % Change -1.5% 1.9% Subsidy per passenger $30.40 $28.74 $25.97 -14.6%
Annual % Change -5.5% -9.6% Farebox Recovery 6.5% 6.7% 7.5% 16.2%
Annual % Change 3.9% 11.8% Percentage Change Consumer Price Index (Bay Area CPI)
1.8% 1.2% 1.7% 0.0%

106
Source: TDA Claims Actual
VACAVILLE CITY COACH PERFORMANCE INDICATORS - LOCAL TAXI
Statistics & % Change Performance Indicators FY 08-09 FY 09-10 FY 10-11 FY09-FY11
Operating Costs $131,904 $136,037 $128,114 -2.9% Annual % Change 3.1% -5.8%
Passengers 11,688 11,742 11,043 -5.5% Annual % Change 0.5% -6.0%
Vehicle Service Hours 4,209 4,050 1,027 -75.6% Annual % Change -3.8% -74.6%
Vehicle Service Miles 63,298 60,931 26,317 -58.4% Annual % Change -3.7% -56.8%
Fare Revenue $58,730 $53,910 $52,501 -10.6% Annual % Change -8.2% -2.6%
Operating Cost per Passenger $11.29 $11.59 $11.60 2.8%
Annual % Change 2.7% 0.1% Operating Cost per Vehicle Service Hour
$31.34 $33.59 $124.75 298.1%
Annual % Change 7.2% 271.4% Passengers per Vehicle Service Hour 2.78 2.90 10.75 287.2%
Annual % Change 4.4% 270.9% Passengers per Vehicle Service Mile 0.18 0.19 0.42 127.2%
Annual % Change 4.4% 117.7% Fare per Passenger $5.02 $4.59 $4.75 -5.4%
Annual % Change -8.6% 3.6% Subsidy per passenger $6.26 $6.99 $6.85 9.4%
Annual % Change 11.7% -2.1% Farebox Recovery 44.5% 39.6% 41.0% -8.0%
Annual % Change -11.0% 3.4% Percentage Change Consumer Price Index (Bay Area CPI)
1.8% 1.2% 1.7% 0.0%
Source: TDA Claims Actual
Graphical display of select performance indicators is shown below.

107
Operating Cost
Ridership
Operating Cost Per Passenger
$0$200,000$400,000$600,000$800,000
$1,000,000$1,200,000$1,400,000$1,600,000
FY09 FY10 FY11
Fixed Route Paratransit Local Taxi
0
50,000
100,000
150,000
200,000
250,000
300,000
350,000
400,000
FY09 FY10 FY11
Fixed Route Paratransit Local Taxi
$0.00
$5.00
$10.00
$15.00
$20.00
$25.00
$30.00
$35.00
FY09 FY10 FY11
Fixed Route Paratransit Local Taxi

108
Operating Cost Per Hour
Passengers Per Hour
Farebox Recovery
$0.00
$20.00
$40.00
$60.00
$80.00
$100.00
$120.00
$140.00
FY09 FY10 FY11
Fixed Route Paratransit Local Taxi
0.0 2.0 4.0 6.0 8.0
10.0 12.0 14.0 16.0
FY09 FY10 FY11
Fixed Route Paratransit Local Taxi
0.0%
5.0%
10.0%
15.0%
20.0%
25.0%
FY09 FY10 FY11
Fixed Route Special Services (Paratransit and Local Taxi)

109
Performance Against SRTP Standards The SRTP for City Coach provided a set of performance standards for fixed route and paratransit. A sampling of performance standards and the current status of each mode meeting their respective projections are shown.
Performance Measure SRTP
Standard City Coach Actual (FY 10-
11) Standard
Met?
Operating Cost per Hour
Fixed Route <= $65.00 $54.52 Yes
Paratransit <= $53.00 $77.37 No
Operating Cost per Passenger
Fixed Route <= $10.00 $3.77 Yes
Paratransit <= $22.00 $28.08 No
Passengers per Hour
Fixed Route 10.0 14.5 Yes
Paratransit 3.0 2.8 Yes
Operating Revenues City Coach relies on a combination of local, state and federal funding sources for operations of the transit service. They include local sources such as fare revenue and advertising, TDA, and urban federal funds through the FTA 5307 grant program. Federal funds provide the largest contribution for operations, followed by TDA and then fares. Using information from TDA Claims, revenues are shown for a three year period (FYs 2008-09 through 2010-11). A summary of revenues by source type, including local, state and federal is also shown.
Operating Revenues FY 09 FY 10 FY 11
Fare Revenue $332,019 $357,513 $391,849 Advertising $27,190 $19,180 $13,717 Other local (AQMD) $46,821 LTF $672,429 $739,113 $707,023

110
FY 09 FY 10 FY 11
STAF $60,000 FTA 5307 $943,060 $933,460 $913,434 FTA 5317 $75,761 Total $2,034,698 $2,049,266 $2,148,605 Source: TDA Claim Actuals
Summary of Operating Revenues by Source Type
FY 09 % of Total FY 10
% of Total FY 11
% of Total
Local Revenues (fares, other)
$359,209 18% $376,693 18% $452,387 21%
State Funds (TDA)
$732,429 36% $739,113 36% $707,023 33%
Federal $943,060 46% $933,460 46% $989,195 46% Total $2,034,698 100% $2,049,266 100% $2,148,605 100%
Source: TDA Claims
Capital Revenues City Coach has used several funding sources for capital expenditures including for vehicle replacement, facility improvement, and amenities. Funding sources include FTA 5307, TDA, and State Proposition 1B. The city’s current cumulative balance of federal transit revenues is $1.6 million. Proposition 1B funds have been used to improve bus shelters and replace five vehicles. Using annual fiscal audit information and federal grant data from the city, revenues are shown for a three year period (FYs 2008-09 through 2010-11). A summary of revenues by source type is also shown. Capital Revenues by Source FY 09 FY 10 FY 11
State Funds (TDA) $2,169,406 $1,187,739 $1,238,078 State Funds (Prop 1B) $349,800 FTA 5307 $1,738,807 $933,460 $2,409,315 Total $3,908,213 $2,470,999 $3,647,393 Source: Annual Fiscal Audits, City of Vacaville
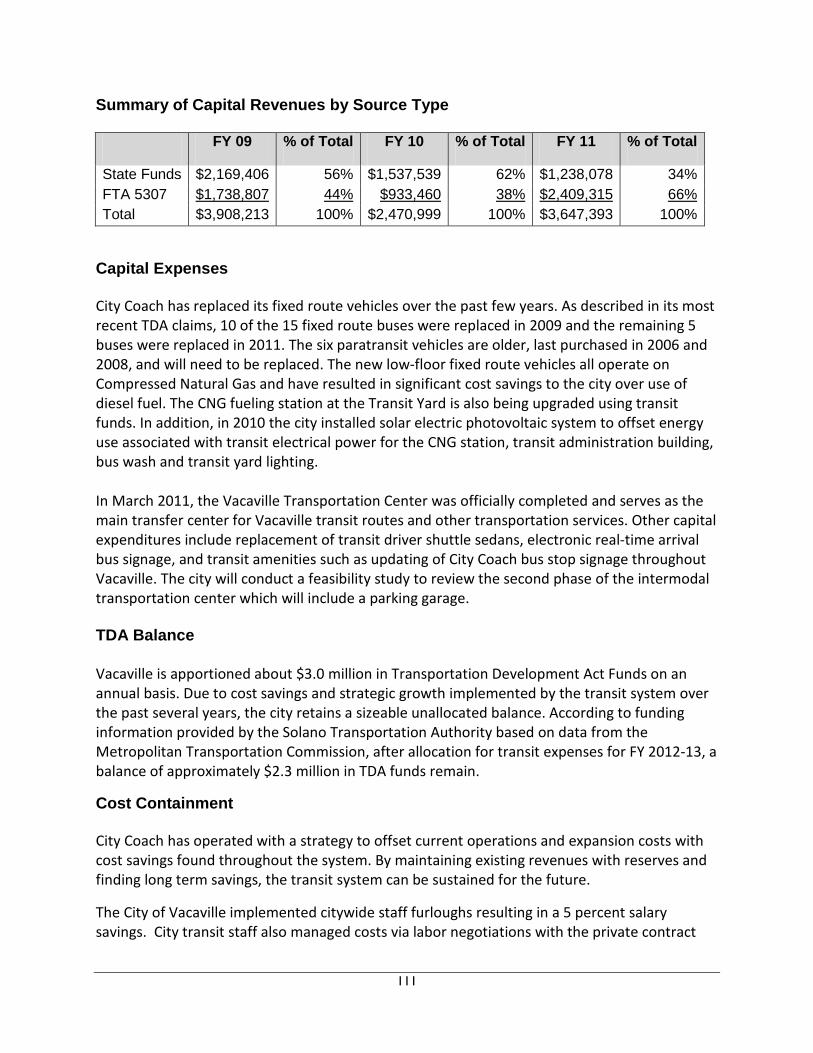
111
Summary of Capital Revenues by Source Type FY 09 % of Total FY 10 % of Total FY 11 % of Total
State Funds $2,169,406 56% $1,537,539 62% $1,238,078 34% FTA 5307 $1,738,807 44% $933,460 38% $2,409,315 66% Total $3,908,213 100% $2,470,999 100% $3,647,393 100%
Capital Expenses City Coach has replaced its fixed route vehicles over the past few years. As described in its most recent TDA claims, 10 of the 15 fixed route buses were replaced in 2009 and the remaining 5 buses were replaced in 2011. The six paratransit vehicles are older, last purchased in 2006 and 2008, and will need to be replaced. The new low-floor fixed route vehicles all operate on Compressed Natural Gas and have resulted in significant cost savings to the city over use of diesel fuel. The CNG fueling station at the Transit Yard is also being upgraded using transit funds. In addition, in 2010 the city installed solar electric photovoltaic system to offset energy use associated with transit electrical power for the CNG station, transit administration building, bus wash and transit yard lighting. In March 2011, the Vacaville Transportation Center was officially completed and serves as the main transfer center for Vacaville transit routes and other transportation services. Other capital expenditures include replacement of transit driver shuttle sedans, electronic real-time arrival bus signage, and transit amenities such as updating of City Coach bus stop signage throughout Vacaville. The city will conduct a feasibility study to review the second phase of the intermodal transportation center which will include a parking garage. TDA Balance Vacaville is apportioned about $3.0 million in Transportation Development Act Funds on an annual basis. Due to cost savings and strategic growth implemented by the transit system over the past several years, the city retains a sizeable unallocated balance. According to funding information provided by the Solano Transportation Authority based on data from the Metropolitan Transportation Commission, after allocation for transit expenses for FY 2012-13, a balance of approximately $2.3 million in TDA funds remain.
Cost Containment City Coach has operated with a strategy to offset current operations and expansion costs with cost savings found throughout the system. By maintaining existing revenues with reserves and finding long term savings, the transit system can be sustained for the future.
The City of Vacaville implemented citywide staff furloughs resulting in a 5 percent salary savings. City transit staff also managed costs via labor negotiations with the private contract
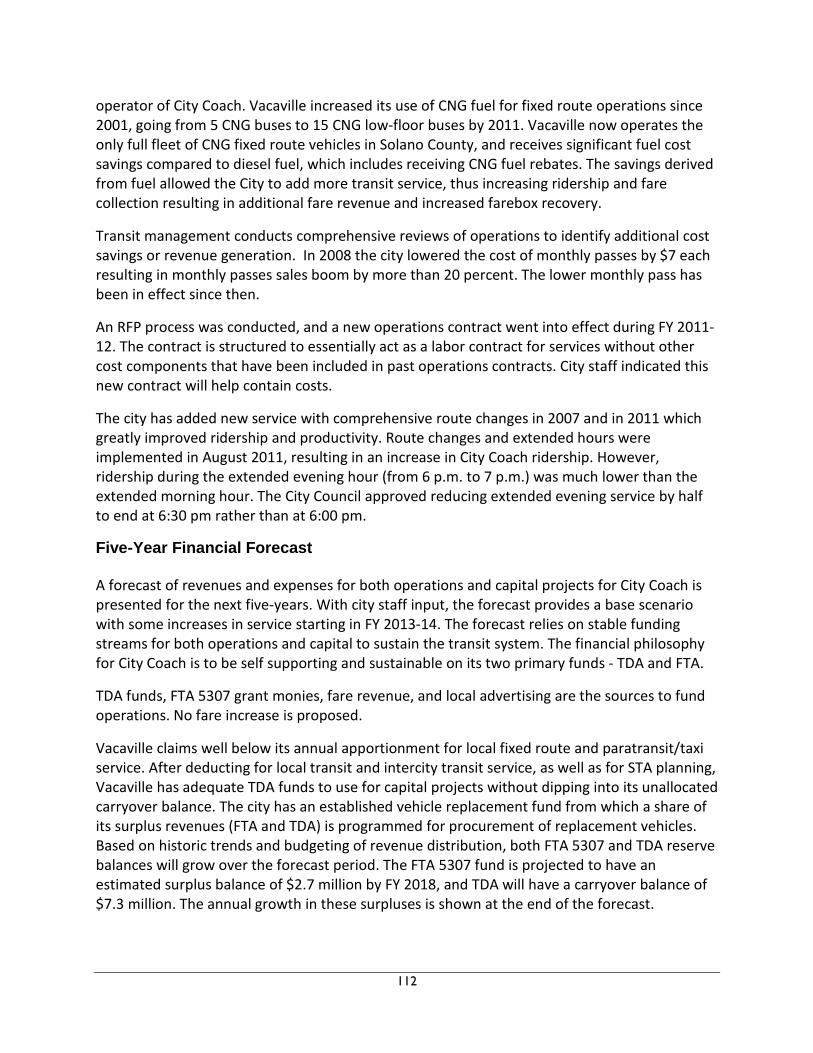
112
operator of City Coach. Vacaville increased its use of CNG fuel for fixed route operations since 2001, going from 5 CNG buses to 15 CNG low-floor buses by 2011. Vacaville now operates the only full fleet of CNG fixed route vehicles in Solano County, and receives significant fuel cost savings compared to diesel fuel, which includes receiving CNG fuel rebates. The savings derived from fuel allowed the City to add more transit service, thus increasing ridership and fare collection resulting in additional fare revenue and increased farebox recovery.
Transit management conducts comprehensive reviews of operations to identify additional cost savings or revenue generation. In 2008 the city lowered the cost of monthly passes by $7 each resulting in monthly passes sales boom by more than 20 percent. The lower monthly pass has been in effect since then.
An RFP process was conducted, and a new operations contract went into effect during FY 2011-12. The contract is structured to essentially act as a labor contract for services without other cost components that have been included in past operations contracts. City staff indicated this new contract will help contain costs.
The city has added new service with comprehensive route changes in 2007 and in 2011 which greatly improved ridership and productivity. Route changes and extended hours were implemented in August 2011, resulting in an increase in City Coach ridership. However, ridership during the extended evening hour (from 6 p.m. to 7 p.m.) was much lower than the extended morning hour. The City Council approved reducing extended evening service by half to end at 6:30 pm rather than at 6:00 pm.
Five-Year Financial Forecast A forecast of revenues and expenses for both operations and capital projects for City Coach is presented for the next five-years. With city staff input, the forecast provides a base scenario with some increases in service starting in FY 2013-14. The forecast relies on stable funding streams for both operations and capital to sustain the transit system. The financial philosophy for City Coach is to be self supporting and sustainable on its two primary funds - TDA and FTA.
TDA funds, FTA 5307 grant monies, fare revenue, and local advertising are the sources to fund operations. No fare increase is proposed.
Vacaville claims well below its annual apportionment for local fixed route and paratransit/taxi service. After deducting for local transit and intercity transit service, as well as for STA planning, Vacaville has adequate TDA funds to use for capital projects without dipping into its unallocated carryover balance. The city has an established vehicle replacement fund from which a share of its surplus revenues (FTA and TDA) is programmed for procurement of replacement vehicles. Based on historic trends and budgeting of revenue distribution, both FTA 5307 and TDA reserve balances will grow over the forecast period. The FTA 5307 fund is projected to have an estimated surplus balance of $2.7 million by FY 2018, and TDA will have a carryover balance of $7.3 million. The annual growth in these surpluses is shown at the end of the forecast.

113
These surpluses are expected in spite of conservative assumptions of annual TDA apportionments and FTA distributions for the forecast period. TDA apportionments are assumed to be $3.0 million with a growth rate of 2 percent per year for the first three years, and 3 percent per year for the remaining forecast period. TDA growth is assumed to follow the forecasted Consumer Price Index for the San Francisco Consolidated Metropolitan Statistical Area (CMSA) developed by the State Department of Finance. FTA distributions are assumed at $2.0 million per year. The difference between actual distributions and uses of the funds would be added to the growing surpluses shown in the forecast.
City Coach is also anticipating new revenues to be generated from local sources. Transit staff is implementing a new bus wrap program that will generate revenues from advertisement. In addition, new revenues will be generated from electronic advertising panels at the two transit centers, and from electronic advertising panels at select high frequency use bus shelters. Potential congressional reinstatement of the IRS Alternative Fuel Rebate program for CNG use would result in additional cost savings to the transit system.
In FY 2013-14, City Coach anticipates some service expansion to meet transit demand. This is expected to increase operations cost by about 4 percent from the prior year. Facilities operations and maintenance including the new Vacaville Intermodal Station are projected to comprise no more than 1 percent of annual fixed route operating costs. All of the electrical needs of the station are met by the photovoltaic system that was installed during construction of the project which will stabilize facilities O&M costs. The remaining operations and maintenance costs are then applied toward the administration and provision of transit services. Operating expenses remain stable through the remaining forecast period based on the City's actions to save cost through contract operations and alternative fuel cost savings. Paratransit operating expenses are forecast to remain stable based on recent historic trends and similar operations savings to fixed route.
Baseline vehicle revenue service hours for fixed route and dial-a-ride are based on data by mode reported in the FY 2011-12 City Coach National Transit Database. Fixed revenue service hours are 33,767, and 5,311 for dial-a-ride. The slight expansion of service in FY 2013-14 would add approximately 700 to 900 service hours.
On the capital side, the city anticipates using primarily TDA funds. A combination of TDA and FTA 5307 revenues will be used to purchase three new 35 foot low-floor CNG buses in FY 2013-14 that will add to the fleet. Vehicle security cameras and other technology are added as part of the procurement. Other capital assets are also forecasted during the five year period including four paratransit vehicle replacements with low floor CNG vehicles, CNG station upgrades, facility upgrades including security cameras, new bus shelters, and other transit amenities. The city will also conduct the Vacaville Transportation Center Phase II Feasibility Study.
Capital costs, including vehicle replacement costs, are based on estimates provided by City Coach transit management. The per unit bus vehicle cost of approximately $627,000 in FY 2013-14 align closely to the most recent MTC regional bus/van pricelist for FYs 2012-13 and FY 2013-

114
14 for Transit Capital Priorities Call for Projects. The per unit paratransit vehicle replacement cost of about $110,000 is also similar to the lower cutaway vehicle prices on the MTC list.
A listing of capital projects by year is shown.
Capital Projects: FY2012-13 - CNG Station Upgrades FY2012-13 - Driver Shuttle Car FY2012-13 - Transit Amenities FY2012-13 - VTC Phase II Feasibility Study FY2013-14 - Procure three, 35 foot New Flyer, low-floor CNG buses FY2013-14 - Facility Upgrades to VTC FY2013-14 - Replace 4 Paratransit buses with low-floor, possibly CNG buses which will drop fuel costs FY2014-15 - Upgrade security cameras at Downtown Transit Plaza and VTC FY2015-16 - Procure and install additional bus shelters, information kiosks and other transit amenities
The financial forecast data is expressed in year of expenditure. As shown in the forecast, Vacaville will operate at an annual surplus under current conditions. TDA distributions and FTA grants are sufficient to cover annual expenditures for operations and capital, while building sizable surpluses over time in both fund sources. The City has an established vehicle replacement fund whereby a share of surplus TDA and FTA revenues are programmed to be used for procurement of replacement vehicles.
Financial Projections - Fixed Route Capital and Operating
(Numbers are expressed in Year of Expenditure $) Fiscal Year FY 12-13 FY 13-14 FY 14-15 FY 15-16 FY 16-17 FY 17-18 Capital Expense Vehicle Additions to Fleet $18,000 1,882,500 $0 $0 $0 $0 Vehicle Replacement $0 $0 $0 $0 $0 $0 Vehicle Technology $0 $0 $0 $0 $0 $0 Security $0 $0 $20,000 $0 $0 $0 Bus Stop Amenities $188,000 $0 $0 $100,000 $0 $0 Facilities $220,000 $2,000 $0 $0 $0 $0

115
Financial Projections - Fixed Route Capital and Operating
(Numbers are expressed in Year of Expenditure $) Fiscal Year FY 12-13 FY 13-14 FY 14-15 FY 15-16 FY 16-17 FY 17-18 Total $426,000 $1,884,500 $20,000 $100,000 $0 $0 Capital Revenue Transportation Development Act $426,000 $378,500 $20,000 $100,000 $0 $0 State Transit Assistance Funds $0 $0 $0 $0 $0 $0 Proposition 1B $0 $0 $0 $0 $0 $0 FTA 5307 $0 $1,506,000 $0 $0 $0 $0 FTA 5311 $0 $0 $0 $0 $0 $0 FTA 5339 $0 $0 $0 $0 $0 $0 Total $426,000 $1,884,500 $20,000 $100,000 $0 $0 Annual Net Surplus/Deficit - Capital $0 $0 $0 $0 $0 $0 Cumulative Net Surplus/Deficit - Capital $0 $0 $0 $0 $0 $0 Operating Expense Fixed Route (1) $1,629,000 $1,703,000 $1,683,000 $1,678,000 $1,673,000 $1,683,000 Facilities (2) $16,500 $17,200 $17,000 $17,000 $16,900 $17,000 Total $1,645,500 $1,720,200 $1,700,000 $1,695,000 $1,689,900 $1,700,000 Operating Revenue Fares (3) $331,400 $341,400 $344,800 $348,200 $351,700 $355,200 Advertising (4) $15,000 $25,000 $35,000 $40,000 $40,000 $45,000

116
Financial Projections - Fixed Route Capital and Operating
(Numbers are expressed in Year of Expenditure $) Fiscal Year FY 12-13 FY 13-14 FY 14-15 FY 15-16 FY 16-17 FY 17-18 RM 2 $0 $0 $0 $0 $0 $0 Transportation Development Act (5) $491,200 $483,600 $458,300 $443,000 $431,900 $431,900 State Transit Assistance Funds $0 $0 $0 $0 $0 $0 FTA 5307 (6) $822,600 $870,300 $862,000 $863,800 $866,400 $867,900 FTA 5311 $0 $0 $0 $0 $0 $0 FTA 5316 $0 $0 $0 $0 $0 $0 FTA 5317 $0 $0 $0 $0 $0 $0 Total $1,660,200 $1,720,300 $1,700,100 $1,695,000 $1,690,000 $1,700,000 Annual Net Surplus/Deficit - Operations $14,700 $100 $100 $0 $100 $0 Cumulative Net Surplus/Deficit - Operations $14,700 $14,800 $14,900 $14,900 $15,000 $15,000
(1) Operations expenses increase by 4.5% between FYs 2013 and 2014 to reflect increased service. Operating expenses remain stable through remaining forecast period based on city's actions to save cost through contract operations and alternative fuel cost savings. (2) Facilities expenses are approximately 1% of operations costs. Renewable energy facility projects stabilize facilities O&M costs. (3) Fare revenues grow by 3% between FYs 2013 and 2014 to reflect increased ridership from service increases. Revenues grow 1% through remaining forecast period to reflect stable operations. (4) Advertising revenue increases are based on city's increased advertising program including bus wraps. (5) TDA revenues reflect anticipated claims by city to fund annual transit service. The revenues are net of Intercity Fund Agreement, and STA Planning totaling an additional $701,000 of Vacaville's TDA. Because the city claims less than its annual apportionment, the TDA carryover is expected to grow during the forecast period. (6) FTA revenues reflect anticipated use by city to fund annual transit service. Because the city uses less than its annual formula fund allocation, the FTA 5307 carryover is expected to grow during the forecast period.
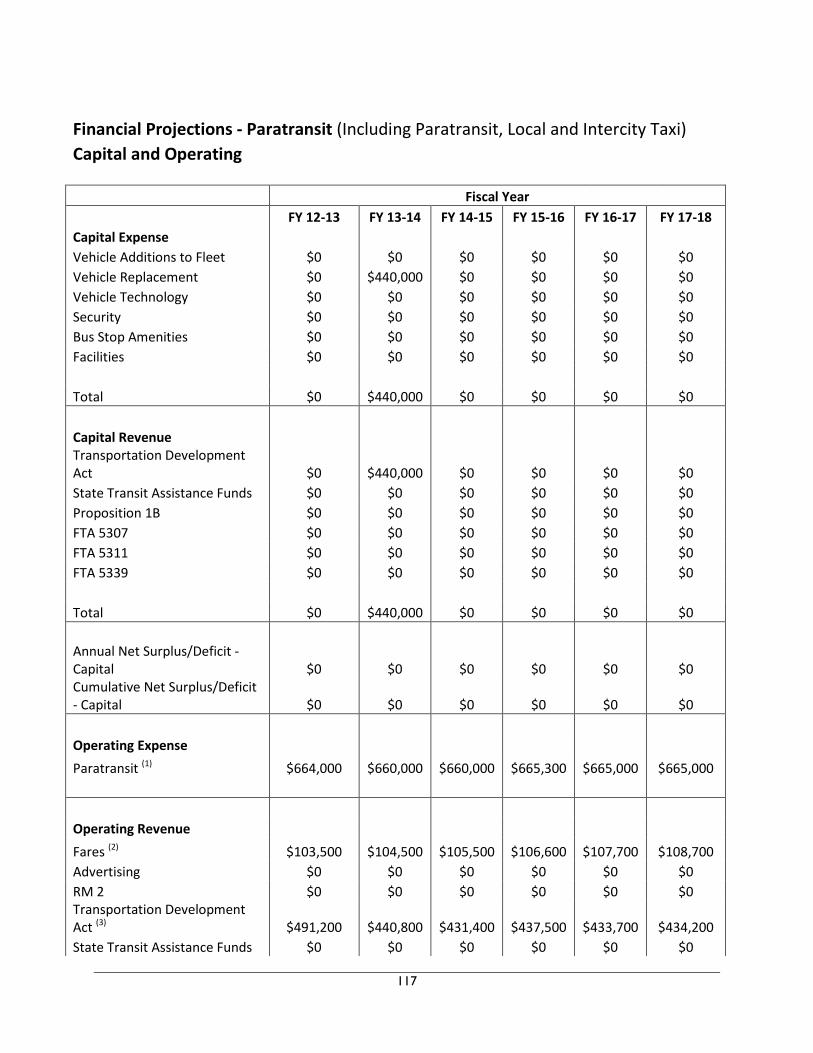
117
Financial Projections - Paratransit (Including Paratransit, Local and Intercity Taxi)
Capital and Operating
Fiscal Year FY 12-13 FY 13-14 FY 14-15 FY 15-16 FY 16-17 FY 17-18 Capital Expense Vehicle Additions to Fleet $0 $0 $0 $0 $0 $0 Vehicle Replacement $0 $440,000 $0 $0 $0 $0 Vehicle Technology $0 $0 $0 $0 $0 $0 Security $0 $0 $0 $0 $0 $0 Bus Stop Amenities $0 $0 $0 $0 $0 $0 Facilities $0 $0 $0 $0 $0 $0 Total $0 $440,000 $0 $0 $0 $0 Capital Revenue Transportation Development Act $0 $440,000 $0 $0 $0 $0 State Transit Assistance Funds $0 $0 $0 $0 $0 $0 Proposition 1B $0 $0 $0 $0 $0 $0 FTA 5307 $0 $0 $0 $0 $0 $0 FTA 5311 $0 $0 $0 $0 $0 $0 FTA 5339 $0 $0 $0 $0 $0 $0 Total $0 $440,000 $0 $0 $0 $0 Annual Net Surplus/Deficit - Capital $0 $0 $0 $0 $0 $0 Cumulative Net Surplus/Deficit - Capital $0 $0 $0 $0 $0 $0 Operating Expense Paratransit (1) $664,000 $660,000 $660,000 $665,300 $665,000 $665,000 Operating Revenue Fares (2) $103,500 $104,500 $105,500 $106,600 $107,700 $108,700 Advertising $0 $0 $0 $0 $0 $0 RM 2 $0 $0 $0 $0 $0 $0 Transportation Development Act (3) $491,200 $440,800 $431,400 $437,500 $433,700 $434,200 State Transit Assistance Funds $0 $0 $0 $0 $0 $0

118
Financial Projections - Paratransit (Including Paratransit, Local and Intercity Taxi)
Capital and Operating
Fiscal Year FY 12-13 FY 13-14 FY 14-15 FY 15-16 FY 16-17 FY 17-18 FTA 5307 (4) $69,400 $114,700 $123,100 $121,200 $123,600 $122,100 FTA 5311 $0 $0 $0 $0 $0 $0 FTA 5316 $0 $0 $0 $0 $0 $0 FTA 5317 $0 $0 $0 $0 $0 $0 Total $664,100 $660,000 $660,000 $665,300 $665,000 $665,000 Annual Net Surplus/Deficit - Operations $100 $0 $0 $0 $0 $0 Cumulative Net Surplus/Deficit - Operations $100 $100 $100 $100 $100 $100 (1) Paratransit operating expenses remain stable based on recent historic trends and similar operations savings to fixed route. (2) Fare revenues grow about 1% annually to reflect historic stable operations.
(3) TDA revenues reflect anticipated claims by city to fund annual transit service. The revenues are net of Intercity Fund Agreement, and STA Planning totaling an additional $701,000 of Vacaville's TDA. Because the city claims less than its annual apportionment, the TDA carryover is expected to grow during the forecast period. (4) FTA revenues reflect anticipated use by city to fund annual transit service. Because the city uses less than its annual formula fund allocation, the FTA 5307 carryover is expected to grow during the forecast period.
Financial Projections - Complete System (Fixed Route, Paratransit, Local Taxi and Intercity Taxi) Capital and Operating
Fiscal Year FY 12-13 FY 13-14 FY 14-15 FY 15-16 FY 16-17 FY 17-18 Capital Expense Vehicle Additions to Fleet $18,000 $1,882,500 $0 $0 $0 $0 Vehicle Replacement $0 $440,000 $0 $0 $0 $0 Vehicle Technology $0 $0 $0 $0 $0 $0 Security $0 $0 $20,000 $0 $0 $0 Bus Stop Amenities $188,000 $0 $0 $100,000 $0 $0 Facilities $220,000 $2,000 $0 $0 $0 $0 Total $426,000 $2,324,500 $20,000 $100,000 $0 $0

119
Financial Projections - Complete System (Fixed Route, Paratransit, Local Taxi and Intercity Taxi) Capital and Operating
Fiscal Year FY 12-13 FY 13-14 FY 14-15 FY 15-16 FY 16-17 FY 17-18 Capital Revenue Transportation Development Act $426,000 $818,500 $20,000 $100,000 $0 $0 State Transit Assistance Funds $0 $0 $0 $0 $0 $0 Proposition 1B $0 $0 $0 $0 $0 $0 FTA 5307 $0 $1,506,000 $0 $0 $0 $0 FTA 5311 $0 $0 $0 $0 $0 $0 FTA 5339 $0 $0 $0 $0 $0 $0 Total $426,000 $2,324,500 $20,000 $100,000 $0 $0 Annual Net Surplus/Deficit - Capital $0 $0 $0 $0 $0 $0 Cumulative Net Surplus/Deficit - Capital $0 $0 $0 $0 $0 $0 Operating Expense Operations $2,293,000 $2,363,000 $2,343,000 $2,343,300 $2,338,000 $2,348,000 Facilities $16,500 $17,200 $17,000 $17,000 $16,900 $17,000 Total $2,309,500 $2,380,200 $2,360,000 $2,360,300 $2,354,900 $2,365,000 Operating Revenue Fares $434,900 $445,900 $450,300 $454,800 $459,400 $463,900 Advertising $15,000 $25,000 $35,000 $40,000 $40,000 $45,000 RM 2 $0 $0 $0 $0 $0 $0 Transportation Development Act $982,400 $924,400 $889,700 $880,500 $865,600 $866,100 State Transit Assistance Funds $0 $0 $0 $0 $0 $0 FTA 5307 $892,000 $985,000 $985,100 $985,000 $990,000 $990,000 FTA 5311 $0 $0 $0 $0 $0 $0 FTA 5316 $0 $0 $0 $0 $0 $0 FTA 5317 $0 $0 $0 $0 $0 $0 Total $2,324,300 $2,380,300 $2,360,100 $2,360,300 $2,355,000 $2,365,000

120
Financial Projections - Complete System (Fixed Route, Paratransit, Local Taxi and Intercity Taxi) Capital and Operating
Fiscal Year FY 12-13 FY 13-14 FY 14-15 FY 15-16 FY 16-17 FY 17-18 Annual Net Surplus/Deficit - Operations $14,800 $100 $100 $0 $100 $0 Cumulative Net Surplus/Deficit - Operations $14,800 $14,900 $15,000 $15,000 $15,100 $15,100 Cumulative Transportation Development Act Carryover (1) $2,334,000 $2,936,000 $4,371,000 $5,735,000 $7,237,000 $8,739,000 Cumulative FTA 5307 Carryover (2) $1,663,000 $1,172,000 $2,186,900 $3,201,900 $4,211,900 $5,221,900 Total Cumulative TDA and FTA Carryover $3,997,000 $4,108,000 $6,557,900 $8,936,900 $11,448,900 $13,960,900 (1) TDA revenues are net of Intercity Fund Agreement, and STA Planning totaling an additional $701,000 of Vacaville's TDA. Because the city claims less than its annual apportionment, the TDA carryover is expected to grow during the forecast period, assuming TDA distributions of $3.0 million and growth of 2 percent per year for the first three years, and 3 percent the remaining two years.
(2) Because the city uses less than its annual formula fund allocation, the FTA 5307 carryover is expected to grow during the forecast period, assuming annual FTA distributions of $2.0 million per year.

121
Peer Transit Agency Performance Comparison A peer review was conducted involving the five Solano County transit agencies (Dixon, Fairfield/Suisun City, Rio Vista, SolTrans, and Vacaville) with agencies of comparable size and service profile around the state. The transit systems profiled in this comparative analysis include those operated as part of city or county municipalities, and by independent transit agencies. Methodology Each Solano County agency was analyzed with five other transit agencies. The sources of data for this comparable analysis include the Metropolitan Transportation Commission Statistical Summary of Bay Area Operators, Fiscal Years 2006-07 through 2010-11, the California State Controller’s Office Transit Operators and Non-Transit Claimants Annual Reports, triennial performance audits, short-range transit plans (SRTPs) and transit agency staff. The comparable agencies were selected based on the following criteria:
• Agency structure/organization • Service area size (square miles) • Service area population • Fleet size
Agency Structure and Organization Type Transit services are organized under various governing entities including municipal systems and joint powers agencies. Municipalities provide transit service under the auspices of specific departments such as public works, parks and recreation or community services. Smaller municipalities such as the City of Dixon provide demand responsive transit service to the general public as well as to senior citizens and disabled persons. Larger municipalities such as the Cities of Vacaville and Fairfield/Suisun City provide both fixed-route and specialized demand responsive services to seniors and the disabled. At the county level, transit services have a more regional and inter-city orientation by linking smaller outlying communities with larger urban centers. Service Area The service area for each transit agency is based on square mileage data from the 2010 U.S. Census data for the jurisdictions served or the agency’s own estimates. Most municipal services, particularly dial-a-ride services, operate within the city limits. Efforts were made to select agencies with comparable service area mileage as those in Solano County.

122
Service Area Population The service area population for each transit agency is based on population data from the 2010 U.S. Census data for the jurisdictions served or the agency’s own estimates based on the route system. Efforts were made to select agencies with comparable service area populations as those in Solano County. Fleet Size The total fleet size for each agency is presented and is broken down to denote the type of service provided: fixed-route or demand response.
Comparative Performance Data Analysis Performance indicators are used to gauge the efficiency of transit operations based upon key inputs. The indicators measure costs and productivity. The farebox recovery ratio is also included as part of the indicators. The comparable data analysis utilized the following performance data inputs:
• Operating costs • Passenger trips • Vehicle service hours • Vehicle service miles • Passenger fare revenue
Dixon The City of Dixon operates a general public dial-a-ride service under the name of Readi-Ride. Readi-Ride provides ADA-accessible, curb-to-curb within the Dixon city limits. Five comparable operators of general public dial-a-ride services were analyzed with Readi-Ride based on the aforementioned criteria as shown below.
Dixon Readi-Ride & Peer Agencies Service Profile
Transit System
Service Area
(Square Miles)
Service Area Population
Fleet Size Fixed-Route
Demand Response
Total Vehicles
Dixon 7.10 18,351 0 9 9 Brawley 7.68 24,953 0 4 4 Exeter 2.46 10,334 0 3 3 Fortuna 4.85 11,926 0 3 3 Ripon 5.31 14,297 0 1 1 Woodlake 2.25 7,279 0 2 2

123
Readi-Ride’s service area is comparable to that of the Brawley system in Imperial County with a slightly smaller population served. Amongst the operators surveyed, Exeter and Woodlake in Tulare County had the smallest service areas and populations.
Operating Cost per Passenger In the analyzing the operating costs per passenger amongst the operators , Dixon’s costs per passenger showed a steady increase during the period with the biggest increase in FY 2010. The number of passenger trips decreased by nearly 23,000. Ripon experienced more than a four-fold increase in passenger trips during FY 2011, which was tied to the significant decrease in its costs per passenger for that year. FY 2011 cost data for Woodlake was not available. A comparison of passenger operating costs is shown below in the table and graph.
Operating Cost per Passenger FY 2009 FY 2010 FY 2011
Dixon $9.66 $13.68 $14.12
Brawley $9.50 $8.19 $7.46
Exeter $7.59 $8.36 $13.81
Fortuna $9.25 $11.35 $8.50
Ripon $17.81 $9.55 $1.88
Woodlake $6.16 $6.28 N/A
Operating Cost per Passenger
$0.00
$2.00
$4.00
$6.00
$8.00
$10.00
$12.00
$14.00
$16.00
$18.00
FY 2009 FY 2010 FY 2011
Dixon
Brawley
Exeter
Fortuna
Ripon
Woodlake

124
Operating Cost per Vehicle Service Hour Dixon’s costs per hour remained fairly stable during the period. Vehicle service hours decreased nearly 1,500 hours from the prior year. Cost per hour peaked in FY 2010 before decreasing slightly in FY 2011. In comparison to the other operators, Dixon’s cost per hour remained among one of the highest along with Exeter and Ripon. However, Ripon’s cost per hour declined during the period due to lower operating costs, increased operating hours and passenger trips. Hourly operating cost trends are shown in the table and graph.
Operating Cost per Vehicle Service Hour
FY 2009 FY 2010 FY 2011
Dixon $89.82 $101.49 $97.44
Brawley $47.10 $45.38 $42.17
Exeter $58.77 $61.81 $88.35
Fortuna $33.57 $34.86 $32.39
Ripon $139.85 $75.96 $31.32
Woodlake $62.65 $59.24 N/A
Operating Cost per Vehicle Service Hour
$0.00
$20.00
$40.00
$60.00
$80.00
$100.00
$120.00
$140.00
FY 2009 FY 2010 FY 2011
Dixon
Brawley
Exeter
Fortuna
Ripon
Woodlake
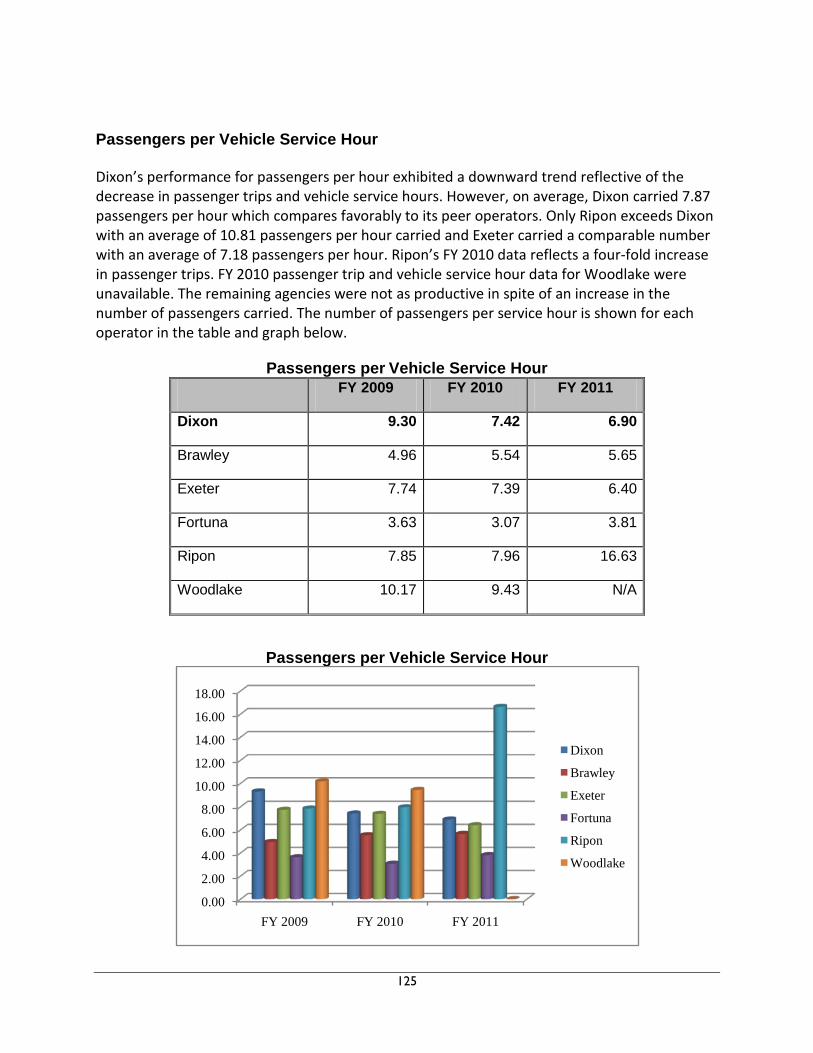
125
Passengers per Vehicle Service Hour Dixon’s performance for passengers per hour exhibited a downward trend reflective of the decrease in passenger trips and vehicle service hours. However, on average, Dixon carried 7.87 passengers per hour which compares favorably to its peer operators. Only Ripon exceeds Dixon with an average of 10.81 passengers per hour carried and Exeter carried a comparable number with an average of 7.18 passengers per hour. Ripon’s FY 2010 data reflects a four-fold increase in passenger trips. FY 2010 passenger trip and vehicle service hour data for Woodlake were unavailable. The remaining agencies were not as productive in spite of an increase in the number of passengers carried. The number of passengers per service hour is shown for each operator in the table and graph below.
Passengers per Vehicle Service Hour
FY 2009 FY 2010 FY 2011
Dixon 9.30 7.42 6.90
Brawley 4.96 5.54 5.65
Exeter 7.74 7.39 6.40
Fortuna 3.63 3.07 3.81
Ripon 7.85 7.96 16.63
Woodlake 10.17 9.43 N/A
Passengers per Vehicle Service Hour
0.00
2.00
4.00
6.00
8.00
10.00
12.00
14.00
16.00
18.00
FY 2009 FY 2010 FY 2011
Dixon
Brawley
Exeter
Fortuna
Ripon
Woodlake

126
Passengers per Vehicle Service Mile In concert with the aforementioned indicator, the number of passengers carried per mile by Dixon also exhibited a downward trend due to the decrease in vehicle service miles and passenger trips. With a decrease from 0.69 to 0.57 passengers per mile, Dixon averaged 0.62 passengers during the period. Most of Dixon’s peer operators exhibited an increase in the number of passengers carried per mile. Woodlake carried the most number of passengers per mile despite the unavailability of FY 2011 data. A comparison of the number of passengers carried per service mile is shown below in the table and graph.
Passengers per Vehicle Service Mile
FY 2009 FY 2010 FY 2011
Dixon 0.69 0.61 0.57
Brawley 0.50 0.55 0.58
Exeter 0.79 0.73 0.75
Fortuna 0.43 0.41 0.46
Ripon 0.33 0.30 0.78
Woodlake 1.27 1.07 N/A
Passengers per Vehicle Service Mile
0.00
0.20
0.40
0.60
0.80
1.00
1.20
1.40
FY 2009 FY 2010 FY 2011
Dixon
Brawley
Exeter
Fortuna
Ripon
Woodlake
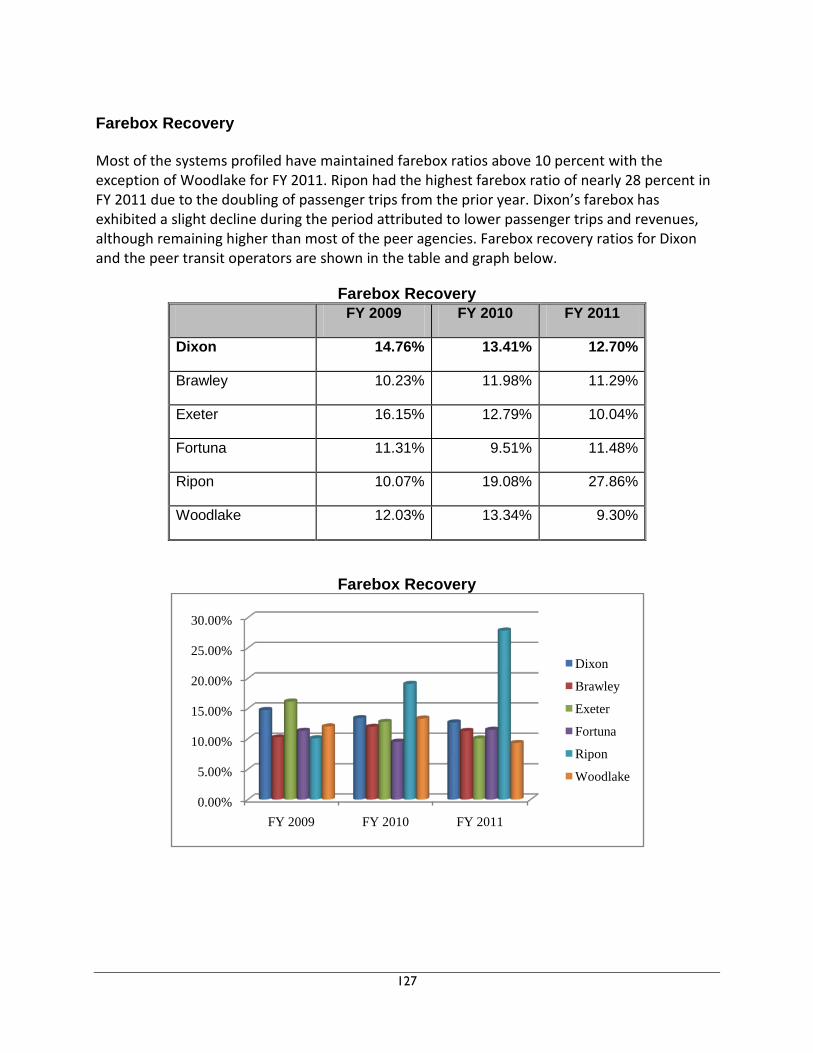
127
Farebox Recovery Most of the systems profiled have maintained farebox ratios above 10 percent with the exception of Woodlake for FY 2011. Ripon had the highest farebox ratio of nearly 28 percent in FY 2011 due to the doubling of passenger trips from the prior year. Dixon’s farebox has exhibited a slight decline during the period attributed to lower passenger trips and revenues, although remaining higher than most of the peer agencies. Farebox recovery ratios for Dixon and the peer transit operators are shown in the table and graph below.
Farebox Recovery
FY 2009 FY 2010 FY 2011
Dixon 14.76% 13.41% 12.70%
Brawley 10.23% 11.98% 11.29%
Exeter 16.15% 12.79% 10.04%
Fortuna 11.31% 9.51% 11.48%
Ripon 10.07% 19.08% 27.86%
Woodlake 12.03% 13.34% 9.30%
Farebox Recovery
0.00%
5.00%
10.00%
15.00%
20.00%
25.00%
30.00%
FY 2009 FY 2010 FY 2011
Dixon
Brawley
Exeter
Fortuna
Ripon
Woodlake

128
Fairfield and Suisun Transit (FAST) Fairfield and Suisun Transit (FAST) provides local fixed-route public transit service to the cities of Fairfield and Suisun City as well as commuter service to the El Cerrito and Walnut Creek BART stations, Vacaville and Sacramento. Demand responsive service including ADA paratransit as well as other local services are provided for the elderly and disabled. FAST operates 15 routes encompassing 11 local routes and 4 express commuter routes. Five comparable operators of fixed-route services were analyzed with FAST based on the aforementioned criteria as shown below.
Fairfield and Suisun Transit (FAST) & Peer Agencies Service Profile
Transit System
Service Area (Square Miles)
Service Area Population
Fleet Size Fixed-Route
Demand Response
Total Vehicles
Fairfield-Suisun
41.5 133,432 62 7 69
Elk Grove 42.19 153,015 45 9 54 Modesto 36.87 201,165 56 13 69 Redding 76.94 109,957 18 20 38 Visalia 42.74 148,370 41 9 50 Yuba-Sutter 34.06 108,426 32 15 47
FAST’s service area and population are comparable to the transit systems serving Elk Grove and Visalia. However, in terms of fleet size, FAST is comparable to Modesto Area Express (MAX) with a total of 69 vehicles each. The smallest system in the comparative analysis with regard to service population and fleet size is Redding in spite of having the largest service area. Operating Cost per Passenger On a systemwide basis inclusive of all transit modes provided by each agency, FAST exhibited a higher per passenger costs than comparable systems. The cost per passenger increased nearly 28 percent from $8.19 to $10.45 per passenger carried attributed to an increase in operating costs and a decrease in passenger trips. This amounts to an average cost of $9.49 per passenger. Of the peer agencies surveyed, Elk Grove exhibited the second highest costs with an average of $8.38 per passenger. Modesto had the lowest per passenger costs followed by Visalia and Yuba-Sutter. A comparison of passenger operating costs is shown below in the table and graph.
Operating Cost per Passenger
FY 2009 FY 2010 FY 2011
Fairfield-Suisun $8.19 $9.84 $10.45
Elk Grove $7.67 $7.67 $9.81

129
FY 2009 FY 2010 FY 2011
Modesto $3.72 $3.80 $4.03
Redding $6.61 $6.82 $7.16
Visalia $4.58 $5.21 $4.70
Yuba-Sutter $4.21 $4.63 $5.02
Operating Cost per Passenger
Operating Cost per Hour In analyzing operating costs per hour, FAST’s cost per hour ranked amongst the highest in the survey. Although vehicle service hours remained fairly constant during the period, FAST exhibited a 10 percent increase in hourly costs, averaging $95.69 per hour. Only Elk Grove’s hourly costs were higher, averaging $129.40 per hour. The remaining operators averaged between $60 and $80 per hour, with Yuba-Sutter averaging the lowest at $62.18 per hour. Hourly operating cost trends are shown below in the table and graph.
Operating Cost per Hour
FY 2009 FY 2010 FY 2011
Fairfield-Suisun $92.52 $92.84 $101.72
Elk Grove $125.74 $117.50 $144.96
$0.00
$2.00
$4.00
$6.00
$8.00
$10.00
$12.00
FY 2009 FY 2010 FY 2011
Fairfield-Suisun
Elk Grove
Modesto
Redding
Visalia
Yuba-Sutter

130
Modesto $73.93 $70.49 $97.23
Redding $69.32 $76.31 $79.60
Visalia $68.34 $66.26 $65.00
Yuba-Sutter $58.88 $63.24 $64.43
Operating Cost per Hour
Passengers per Vehicle Service Hour In comparison to its peers, FAST carried fewer passengers per hour. The number of passengers carried per hour decreased from 11.30 passengers to 9.74 passengers, about a 14 percent decrease. The average number of passengers carried was just over 10 passengers per hour. Modesto carried the number of passengers per hour, averaging 20.85 passengers, followed by Elk Grove at 15.50 passengers per hour. The remaining operators averaged between 11 and 13 passengers per hour. The number of passengers per service hour is shown for each operator in the table and graph below.
Passengers per Vehicle Service Hour
FY 2009 FY 2010 FY 2011
Fairfield-Suisun 11.30 9.43 9.74
Elk Grove 16.40 15.31 14.78
Modesto 19.85 18.55 24.15
$0.00
$20.00
$40.00
$60.00
$80.00
$100.00
$120.00
$140.00
$160.00
FY 2009 FY 2010 FY 2011
Fairfield-Suisun
Elk Grove
Modesto
Redding
Visalia
Yuba-Sutter
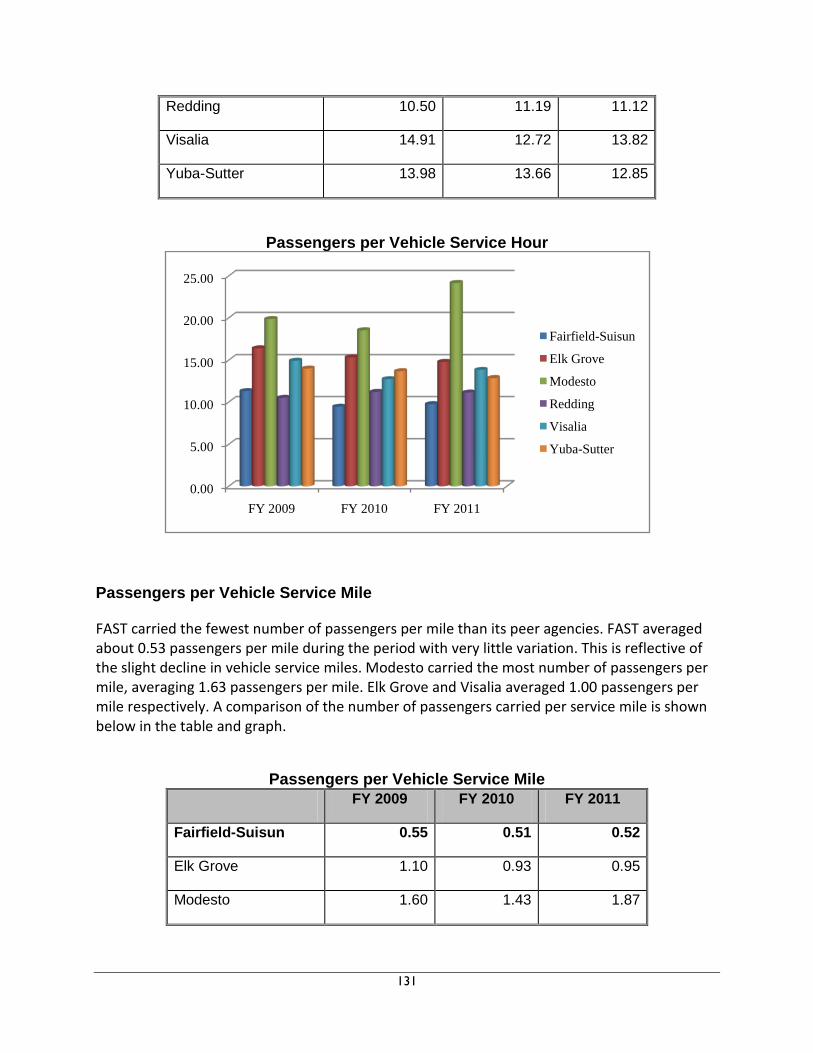
131
Redding 10.50 11.19 11.12
Visalia 14.91 12.72 13.82
Yuba-Sutter 13.98 13.66 12.85
Passengers per Vehicle Service Hour
Passengers per Vehicle Service Mile FAST carried the fewest number of passengers per mile than its peer agencies. FAST averaged about 0.53 passengers per mile during the period with very little variation. This is reflective of the slight decline in vehicle service miles. Modesto carried the most number of passengers per mile, averaging 1.63 passengers per mile. Elk Grove and Visalia averaged 1.00 passengers per mile respectively. A comparison of the number of passengers carried per service mile is shown below in the table and graph.
Passengers per Vehicle Service Mile FY 2009 FY 2010 FY 2011
Fairfield-Suisun 0.55 0.51 0.52
Elk Grove 1.10 0.93 0.95
Modesto 1.60 1.43 1.87
0.00
5.00
10.00
15.00
20.00
25.00
FY 2009 FY 2010 FY 2011
Fairfield-Suisun
Elk Grove
Modesto
Redding
Visalia
Yuba-Sutter

132
FY 2009 FY 2010 FY 2011
Redding 0.72 0.76 0.75
Visalia 1.07 0.90 0.97
Yuba-Sutter 0.92 0.90 0.81
Passengers per Vehicle Service Mile
Farebox Recovery FAST maintained a higher farebox recovery in spite of a declining trend in this indicator. FAST’s passenger fare revenue was fairly consistent during the period in spite of increased operating costs. The average farebox during the period was 22.89 percent. This compares well with Yuba-Sutter, whose average farebox recovery was 24.43 percent. Farebox recovery ratios for FAST and peer transit operators are shown in the table and graph below.
Farebox Recovery
FY 2009 FY 2010 FY 2011
Fairfield-Suisun 25.23% 22.00% 21.43%
Elk Grove 18.79% 16.60% 14.56%
Modesto 20.42% 19.73% 18.63%
0.000.200.400.600.801.001.201.401.601.802.00
FY 2009 FY 2010 FY 2011
Fairfield-Suisun
Elk Grove
Modesto
Redding
Visalia
Yuba-Sutter

133
Redding 16.99% 15.48% 15.12%
Visalia 26.84% 15.73% 13.40%
Yuba-Sutter 26.30% 23.83% 23.16%
Farebox Recovery
Rio Vista Delta Breeze The City of Rio Vista operates a deviated fixed-route transit service under the name of Rio Vista Delta Breeze. In addition to operating within the city limits of Rio Vista, the Delta Breeze provides intercity lifeline service between Rio Vista and the communities of Fairfield, Isleton, Suisun City, and Antioch as well as to the Pittsburg/Bay Point BART station. As a deviated system, the Delta Breeze provides door-to-door service and administers a taxi-scrip program. Five comparable operators of deviated fixed-route services were analyzed with the Delta Breeze based on the aforementioned criteria as shown in the following table.
Rio Vista Delta Breeze & Peer Agencies
Service Profile Transit System
Service Area (Square Miles)
Service Area Population
Fleet Size Fixed-Route
Demand Response
Total Vehicles
Rio Vista 7.2 8,222 4 1 5 Calaveras 1,020 45,578 8 0 8 Del Norte 1,006 28,610 8 5 13 Needles 30.8 4,844 4 3 7 Palo Verde 26.19 20,817 5 2 7
0.00%
5.00%
10.00%
15.00%
20.00%
25.00%
30.00%
FY 2009 FY 2010 FY 2011
Fairfield-Suisun
Elk Grove
Modesto
Redding
Visalia
Yuba-Sutter
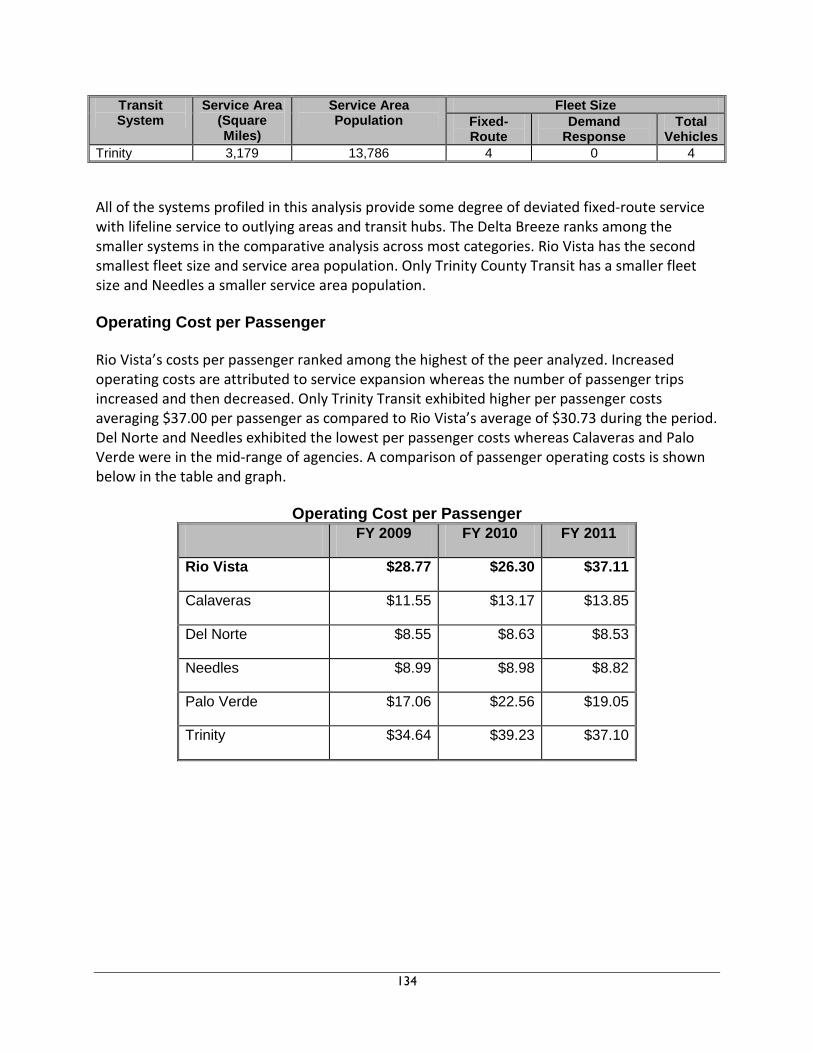
134
Transit System
Service Area (Square Miles)
Service Area Population
Fleet Size Fixed-Route
Demand Response
Total Vehicles
Trinity 3,179 13,786 4 0 4
All of the systems profiled in this analysis provide some degree of deviated fixed-route service with lifeline service to outlying areas and transit hubs. The Delta Breeze ranks among the smaller systems in the comparative analysis across most categories. Rio Vista has the second smallest fleet size and service area population. Only Trinity County Transit has a smaller fleet size and Needles a smaller service area population. Operating Cost per Passenger Rio Vista’s costs per passenger ranked among the highest of the peer analyzed. Increased operating costs are attributed to service expansion whereas the number of passenger trips increased and then decreased. Only Trinity Transit exhibited higher per passenger costs averaging $37.00 per passenger as compared to Rio Vista’s average of $30.73 during the period. Del Norte and Needles exhibited the lowest per passenger costs whereas Calaveras and Palo Verde were in the mid-range of agencies. A comparison of passenger operating costs is shown below in the table and graph.
Operating Cost per Passenger FY 2009 FY 2010 FY 2011
Rio Vista $28.77 $26.30 $37.11
Calaveras $11.55 $13.17 $13.85
Del Norte $8.55 $8.63 $8.53
Needles $8.99 $8.98 $8.82
Palo Verde $17.06 $22.56 $19.05
Trinity $34.64 $39.23 $37.10

135
Operating Cost per Passenger
Operating Cost per Hour Delta Breeze’s costs per hour increased in FY 2011 from $66.43 to about $90, a 35 percent increase. This was attributed to an increase in overall operating costs and vehicle service hours. Its average hourly costs were $73.30 for the period. This trend is comparable to the operators serving Calaveras and Trinity counties. Del Norte exhibited the lowest cost of its peers, which averaged just under $50.00 per hour. Hourly operating cost trends are shown in the following table and graph.
Operating Cost per Hour
FY 2009 FY 2010 FY 2011
Rio Vista $66.43 $63.47 $89.99
Calaveras $69.90 $78.69 $91.99
Del Norte $48.05 $50.64 $50.70
Needles $68.88 $66.16 $68.23
Palo Verde $81.46 $89.88 $83.25
Trinity $85.86 $100.79 $90.09
$0.00
$5.00
$10.00
$15.00
$20.00
$25.00
$30.00
$35.00
$40.00
FY 2009 FY 2010 FY 2011
Rio Vista
Calaveras
Del Norte
Needles
Palo Verde
Trinity

136
Operating Cost per Hour
Passengers per Vehicle Service Hour The number of passengers carried per hour remained fairly constant averaging 2.38 passengers per hour. This average is comparable to the number of passengers per hour carried by Trinity Transit. Needles carried the most passengers per hour, averaging 7.59 passengers. The remaining agencies carried between 4 and 7 passengers per hour. The number of passengers per service hour is shown for each operator in the table and graph below.
Passengers per Vehicle Service Hour
FY 2009 FY 2010 FY 2011
Rio Vista 2.31 2.41 2.43
Calaveras 6.05 5.98 6.64
Del Norte 5.62 5.87 5.94
Needles 7.66 7.37 7.73
Palo Verde 4.78 3.98 4.37
Trinity 2.48 2.57 2.43
$0.00
$20.00
$40.00
$60.00
$80.00
$100.00
$120.00
FY 2009 FY 2010 FY 2011
Rio Vista
Calaveras
Del Norte
Needles
Palo Verde
Trinity

137
Passengers per Vehicle Service Hour
Passengers per Vehicle Service Mile Rio Vista carried fewer passengers per mile than most of its peer agencies. Only Trinity Transit carried fewer passengers per mile than Rio Vista. Rio Vista averaged about 0.12 passengers per mile. Vehicle service miles increased from 81,977 miles to 133,841 due to new route expansion; however, passenger trips remained fairly level. Needles carried the most passengers per mile, averaging 0.56 passengers during the period. The remaining agencies are in the mid-range averaging between 0.20 and 0.30 passengers. A comparison of the number of passengers carried per service mile is shown below in the table and graph.
Passengers per Vehicle Service Mile
FY 2009 FY 2010 FY 2011
Rio Vista 0.14 0.11 0.10
Calaveras 0.21 0.20 0.23
Del Norte 0.30 0.32 0.31
Needles 0.58 0.54 0.57
Palo Verde 0.28 0.23 0.26
Trinity 0.11 0.09 0.08
0.00
1.00
2.00
3.00
4.00
5.00
6.00
7.00
8.00
FY 2009 FY 2010 FY 2011
Rio Vista
Calaveras
Del Norte
Needles
Palo Verde
Trinity

138
Passengers per Vehicle Service Mile
Farebox Recovery Farebox recovery for the Delta Breeze exhibited a steady decline during the three year period. Rio Vista’s farebox declined 40 percent from a high of 20 percent to 12 percent, resulting in an average farebox of 16.7 percent. Del Norte’s farebox remained fairly consistent averaging 16.5 percent during the period. Nevertheless, Rio Vista exhibited a higher farebox than the remaining peer agencies. Farebox recovery ratios for Rio Vista and peer transit operators are shown in the table and graph below.
Farebox Recovery FY 2009 FY 2010 FY 2011
Rio Vista 20.20% 17.81% 12.11%
Calaveras 8.52% 9.51% 7.18%
Del Norte 17.17% 15.53% 16.90%
Needles 11.12% 11.21% 10.81%
Palo Verde 12.92% 12.43% 10.60%
Trinity 6.63% 7.94% 11.81%
0.00
0.10
0.20
0.30
0.40
0.50
0.60
FY 2009 FY 2010 FY 2011
Rio Vista
Calaveras
Del Norte
Needles
Palo Verde
Trinity

139
Farebox Recovery
Solano County Transit (SolTrans) SolTrans is the newly consolidated transit system from the merger between the City of Benicia and City of Vallejo transit services. SolTrans operates under a Joint Powers Agreement (JPA) entered into by the Cities of Benicia, Vallejo and the Solano County Transportation Authority in the fall of 2010. The system operates 16 routes encompassing 11 local and 5 multi-zone routes. The multi-zone routes provide intercity commuter service between Vallejo, Benicia and Fairfield, Diablo Valley College, and the El Cerrito and Walnut Creek BART stations. As SolTrans is a relatively new entity, comparative analysis with peer operators are only presented for one operating year based on the aforementioned criteria as shown in the table below.
SolTrans & Peer Agencies
Service Profile Transit System Service Area
(Square Miles)
Service Area Population
Fleet Size Fixed-Route
Demand Response
Total Vehicles
SolTrans 61 147,571 62 16 78 Antelope Valley 301 475,000 72 14 86 Butte County 257.11 179,830 34 23 57 Livermore-Amador
40 171,652 74 18 92
Monterey-Salinas
280 435,000 113 31 144
Victor Valley 275.48 306,994 28 26 54
0.00%
5.00%
10.00%
15.00%
20.00%
25.00%
FY 2009 FY 2010 FY 2011
Rio Vista
Calaveras
Del Norte
Needles
Palo Verde
Trinity

140
SolTrans ranks in the middle tier of systems with regard to fleet size and ranks in the lower tier in terms of size of service area population. Butte County and Victor Valley have smaller systems but cover wider service areas. It is worth noting that FY 2010-11 was a transition year for SolTrans in operating the service as an independent entity. Administrative and management functions were being transitioned from Vallejo and Benicia city staff to contract management. Operating Cost per Passenger SolTrans’ $7.28 operating cost per passenger is higher than most peer agencies. The number of passenger trips relative to operating costs was lower for SolTrans compared to peers. Costs per passenger for Antelope Valley, Butte County, Monterey-Salinas and Victor Valley were lower due to relatively flat operating costs and increased passenger trips. Livermore-Amador had the highest cost per passenger due to fewer passenger trips relative to operating costs. A comparison of passenger operating costs is shown below in the table and graph.
Operating Cost per Passenger
FY 2011
SolTrans $7.28
Antelope Valley $6.62
Butte County $5.82
Livermore-Amador $7.54
Monterey-Salinas $6.15
Victor Valley $5.44

141
Operating Cost per Passenger
Operating Cost per Hour SolTrans’ operating cost per hour compares favorably to other agencies. The cost per hour for SolTrans during FY 2011 was $85.59, which ranks in the mid-tier of peer agencies. Antelope Valley, Livermore-Amador and Monterey-Salinas had higher costs due to a combination of increased operating costs and vehicle service hours. Hourly operating cost comparisons are shown below in the table and graph.
Operating Cost per Hour FY 2011
SolTrans $85.59
Antelope Valley $100.93
Butte County $69.42
Livermore-Amador $100.35
Monterey-Salinas $106.67
Victor Valley $64.18
$0.00
$1.00
$2.00
$3.00
$4.00
$5.00
$6.00
$7.00
$8.00
FY 2011
SolTrans
Antelope Valley
Butte County
Livermore-Amador
Monterey-Salinas
Victor Valley

142
Operating Cost per Hour
Passengers per Vehicle Service Hour SolTrans carried 11.76 passengers per hour during FY 2011, which compared lowest to all other peers but only slightly lower than Butte County and Victor Valley. All agencies reported declining numbers of passengers per hour with the exception of Monterey-Salinas Transit which carried 17.35 passengers per hour, the highest out of all the agencies. The number of passengers per service hour is shown for each operator in the following table and graph.
Passengers per Vehicle Service Hour
FY 2011
SolTrans 11.76
Antelope Valley 15.24
Butte County 11.94
Livermore-Amador 13.31
Monterey-Salinas 17.35
Victor Valley 11.79
$0.00
$20.00
$40.00
$60.00
$80.00
$100.00
$120.00
FY 2011
SolTrans
Antelope Valley
Butte County
Livermore-Amador
Monterey-Salinas
Victor Valley
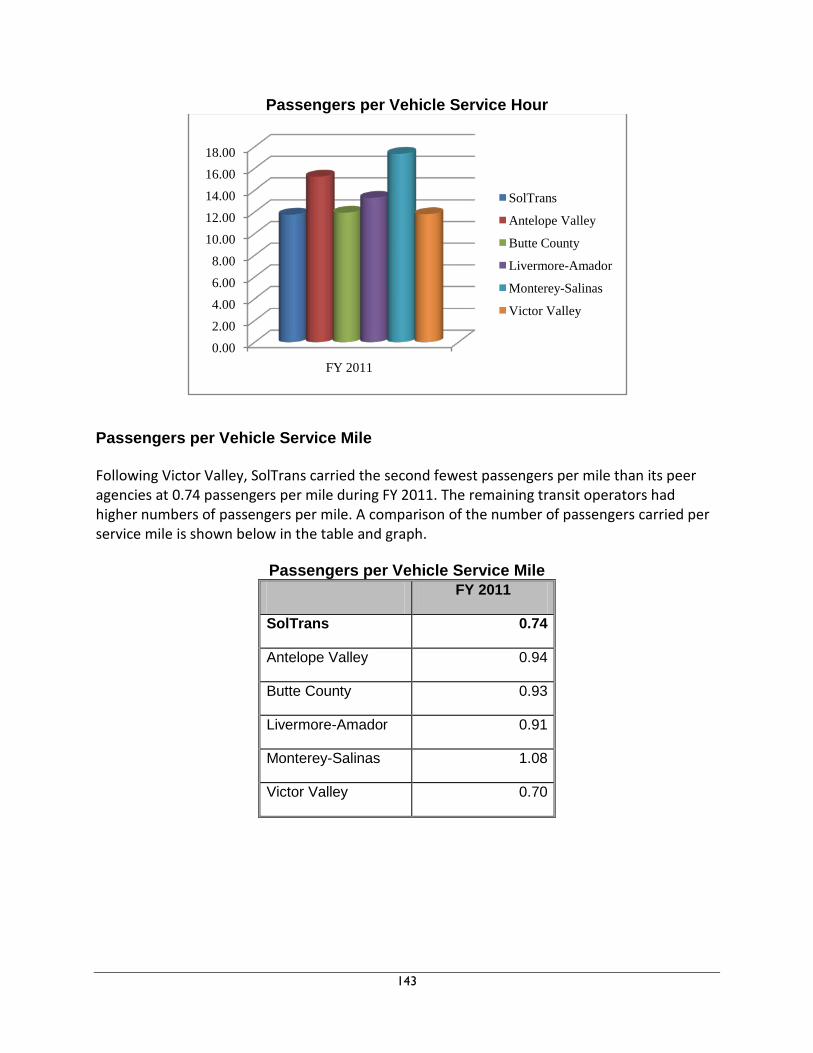
143
Passengers per Vehicle Service Hour
Passengers per Vehicle Service Mile Following Victor Valley, SolTrans carried the second fewest passengers per mile than its peer agencies at 0.74 passengers per mile during FY 2011. The remaining transit operators had higher numbers of passengers per mile. A comparison of the number of passengers carried per service mile is shown below in the table and graph.
Passengers per Vehicle Service Mile
FY 2011
SolTrans 0.74
Antelope Valley 0.94
Butte County 0.93
Livermore-Amador 0.91
Monterey-Salinas 1.08
Victor Valley 0.70
0.002.004.006.008.00
10.0012.0014.0016.0018.00
FY 2011
SolTrans
Antelope Valley
Butte County
Livermore-Amador
Monterey-Salinas
Victor Valley

144
Passengers per Vehicle Service Mile
Farebox Recovery SolTrans farebox ratio ranks the second highest among the comparable systems. SolTrans had a farebox return of 28.40 percent during FY 2011 while Monterey-Salinas Transit had a farebox ratio of 29.13 percent. Butte County’s B-Line and Livermore-Amador ranked amongst the lowest in terms of farebox ratios. Farebox recovery ratios for SolTrans and peer transit operators are shown in the table and graph below:
Farebox Recovery
FY 2011
SolTrans 28.40%
Antelope Valley 22.34%
Butte County 18.12%
Livermore-Amador 17.11%
Monterey-Salinas 29.13%
Victor Valley 20.08%
0.00
0.20
0.40
0.60
0.80
1.00
1.20
FY 2011
SolTrans
Antelope Valley
Butte County
Livermore-Amador
Monterey-Salinas
Victor Valley

145
Farebox Recovery
Vacaville City Coach The City of Vacaville operates local fixed-route and special services under the name of City Coach. The six fixed routes originate from and terminate from the Vacaville Transportation Center, where both system and interline connections are available to Fairfield, Suisun City and other regional destinations. Five municipal transit operators were analyzed with Vacaville City Coach based on the aforementioned criteria as shown in the table below.
Vacaville City Coach & Peer Agencies Service Profile
Transit System
Service Area
(Square Miles)
Service Area Population
Subsidized Taxi Service
Fleet Size Fixed-Route
Demand Response
Total Vehicles
Vacaville 28.37 92,428 Yes 15 6 21 Lodi 13.61 62,134 No 13 17 30 Manteca 17.73 67,096 No 5 5 10 Roseville 36.22 118,788 Yes 31 13 44 Tracy 22 82,922 No 8 5 13 Union City 18 73,977 Yes 16 6 22
City Coach’s profile is in the middle tier of the comparable agencies with the second largest service area after Roseville and the fourth largest fleet. Operating Cost per Passenger Based upon modest increases in operating costs and notable growth in passenger trips, Vacaville’s operating cost per passenger has averaged the lowest when compared to the other
0.00%
5.00%
10.00%
15.00%
20.00%
25.00%
30.00%
FY 2011
SolTrans
Antelope Valley
Butte County
Livermore-Amador
Monterey-Salinas
Victor Valley

146
operators. Vacaville along with Union City exhibited downward trends in this indicator. In contrast, the remaining operators all exhibited increases in per passenger costs due to decreases in passenger trips combined with increases in operating costs. A comparison of passenger operating costs is shown below in the table and graph.
Operating Cost per Passenger
FY 2009 FY 2010 FY 2011
Vacaville $6.16 $5.40 $4.85
Lodi $7.54 $12.92 $13.30
Manteca $19.63 $9.51 $17.22
Roseville $11.40 $12.14 $12.26
Tracy $12.21 $12.62 $15.35
Union City $6.61 $7.50 $7.28
Operating Cost per Passenger
Operating Cost per Hour In analyzing operating cost per hour, Vacaville ranks very well to other operators such as Manteca. In FY 2011, Vacaville’s cost was $60.47 per hour, in line with Manteca’s ($59.59 per hour) which rates the lowest among the peers. Hourly operating cost trends are shown below in the table and graph.
$0.00$2.00$4.00$6.00$8.00
$10.00$12.00$14.00$16.00$18.00$20.00
FY 2009 FY 2010 FY 2011
Vacaville
Lodi
Manteca
Roseville
Tracy
Union City

147
Operating Cost per Hour
FY 2009 FY 2010 FY 2011
Vacaville $61.91 $59.35 $60.47
Lodi $46.40 $84.75 $87.77
Manteca $70.76 $31.54 $59.59
Roseville $89.15 $88.80 $91.79
Tracy $72.68 $76.92 $73.34
Union City $63.71 $71.11 $74.45
Operating Cost per Hour
Passengers per Vehicle Service Hour Vacaville City Coach carried more passengers per hour on average than comparable systems. This indicator reflects the steady increases in passenger trips accompanied by the slight changes in vehicle service hours. Vacaville averaged 11.2 passengers carried per hour. Union City came in second to Vacaville in the number of passengers per hour systemwide, averaging 9.8 passengers during the same period. The remaining transit systems did not compare as well given the decreases in passenger trips. The number of passengers per service hour is shown for each operator in the table and graph below.
$0.00
$10.00
$20.00
$30.00
$40.00
$50.00
$60.00
$70.00
$80.00
$90.00
$100.00
FY 2009 FY 2010 FY 2011
Vacaville
Lodi
Manteca
Roseville
Tracy
Union City

148
Passengers per Vehicle Service Hour FY 2009 FY 2010 FY 2011
Vacaville 10.05 11.00 12.45
Lodi 6.16 6.56 6.60
Manteca 3.61 3.32 3.46
Roseville 7.82 7.32 7.49
Tracy 5.95 6.09 4.78
Union City 9.64 9.48 10.22
Passengers per Vehicle Service Hour
Passengers per Vehicle Service Mile The number of passenger carried per hour by City Coach ranks among the highest of the peer operators averaging about 0.77 passengers per mile. Only Union City carried more passengers per mile, averaging 0.87 passengers. Both systems exhibited increases in passenger trips with minor fluctuations in vehicle service miles. In contrast, the remaining operators saw decreased passenger trips during the period with some fluctuations in vehicle service miles. A comparison of the number of passengers carried per service mile is shown below in the table and graph.
0.00
2.00
4.00
6.00
8.00
10.00
12.00
14.00
FY 2009 FY 2010 FY 2011
Vacaville
Lodi
Manteca
Roseville
Tracy
Union City

149
Passengers per Vehicle Service Mile FY 2009 FY 2010 FY 2011
Vacaville 0.70 0.77 0.85
Lodi 0.58 0.64 0.61
Manteca 0.35 0.30 0.31
Roseville 0.53 0.53 0.48
Tracy 0.48 0.48 0.42
Union City 0.86 0.84 0.92
Passengers per Vehicle Service Mile
Farebox Recovery On a systemwide basis, Vacaville’s farebox ratio ranked amongst the highest during the three year period in comparison to the other operators. Its farebox ratio exhibited a steady upward trend attributed to increases in passenger trips and revenues as well as controlled operating costs. Roseville was the only other operator which fared favorably to Vacaville. While not reflected in their data, other systems including Lodi, Manteca and Tracy are supported by local county transportation measure revenues which are used to support the farebox. Solano County has no such self-help transportation revenue measure. Systemwide farebox recovery ratios for Vacaville City Coach and peer transit operators are shown in the following table and graph.
0.000.100.200.300.400.500.600.700.800.901.00
FY 2009 FY 2010 FY 2011
Vacaville
Lodi
Manteca
Roseville
Tracy
Union City

150
Farebox Recovery FY 2009 FY 2010 FY 2011
Vacaville 16.38% 17.45% 18.61%
Lodi 11.29% 11.17% 11.10%
Manteca 5.85% 12.23% 6.28%
Roseville 17.23% 16.96% 19.99%
Tracy 6.81% 5.96% 6.25%
Union City 12.49% 11.38% 12.91%
Farebox Recovery
0.00%
2.00%
4.00%
6.00%
8.00%
10.00%
12.00%
14.00%
16.00%
18.00%
20.00%
FY 2009 FY 2010 FY 2011
Vacaville
Lodi
Manteca
Roseville
Tracy
Union City