Embed Size (px)
Citation preview

Center for Financial Security
April 2010 Symposium
Family Financial Security

StabilityFirst Pilot Test by Gregory Mills Prepared for: Family Financial Security Symposium University of Wisconsin-Madison April 19-20, 2010 ideas42 Institute for Quantitative Social Science Harvard University 1737 Cambridge Street Cambridge, MA 02138
1
1. Introduction This paper describes the development of the StabilityFirst program, which aims to enable low- and moderate-income (LMI) households to establish a savings buffer-stock to cope with financial shocks. We define financial shocks as unexpected adverse changes in income or expenses. As the StabilityFirst name implies, stabilizing one’s economic circumstances is a necessary first step toward upward mobility for low-income families. This means having the capacity to regularly meet one’s basic household consumption needs, without increased reliance on borrowing. A buffer stock of savings or “ready money” is a form of self-insurance against financial shocks.
Overview: What Is StabilityFirst? StabilityFirst combines the following five program components:
BankIt account: basic checking account, into which paychecks and government payments can be direct-deposited, from which bills can be paid;
SaveIt account: a linked savings account into which amounts can be transferred
from BankIt on a scheduled basis;
SpendIt card: a general-purpose reloadable pre-paid card, into which amounts can be transferred from BankIt on a scheduled basis for store purchases;
Financial dashboard: timely feedback through a daily account balance on the
SpendIt card, received via text message and a monthly at-a-glance update of spending and savings versus one’s budget.
Financial coaching: assistance in constructing and monitoring a monthly
household budget, and in on-line management of the BankIt, SaveIt, and SpendIt accounts.
How does StabilityFirst differ from other strategies to promote low-income savings, such as individual development accounts (IDAs, which are personal savings accounts that provide matching funds when deposits are withdrawn for specified asset-building uses)?
The primary focus of StabilityFirst is on unrestricted short-term savings for financial shocks, but funds can also be used for IDA-subsidized investments such as home purchase or repair, micro-enterprise development, post-secondary education, or retirement.
StabilityFirst does not rely on financial incentives (such as matching funds) to
change savings behavior, but instead acts through low-cost electronic banking
2
StabilityFirst participants need not be affiliated with a provider agency or
employer, other than during an initial period of orientation and financial coaching from a host program agency. In contrast, employer-based savings programs typically require a re-enrollment process when the individual changes jobs, if the new employer offers a comparable program.
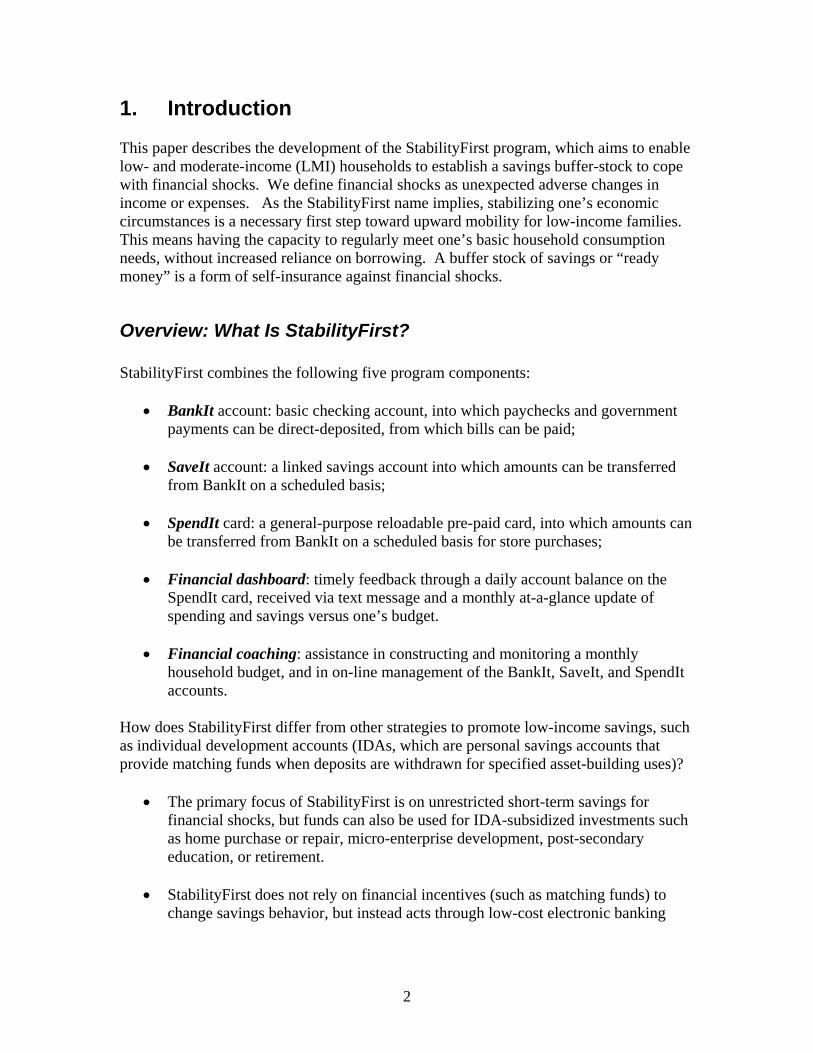
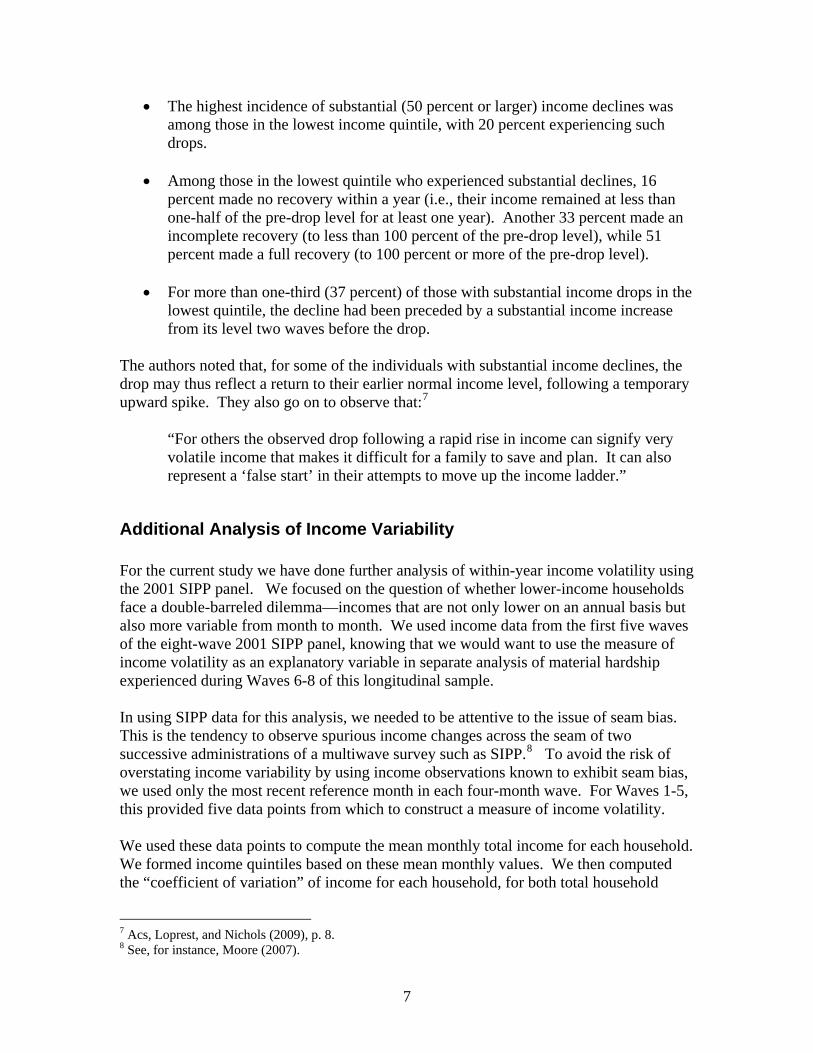
Household Flow-of-Funds: Unbanked or Underbanked Exhibit 1-1 shows a simplified flow-of-funds diagram for an unbanked or underbanked household.1 On the left-hand side, the sources of funds include: paper checks and electronic payments (noncash income, including electronic benefit transfers), cash income, and borrowing.2 On the right-hand side, the uses of funds include: bill payments and debt repayments (payments on prior consumption or investment), anticipated current spending needs (expected current consumption), financial shocks (unexpected current consumption needs), and asset-building (investments in real or financial assets or future income-earning capacity, as through education or training). The cobweb of lines that connect sources to uses reflects the “unstructured mental accounting” basis on which resources are applied to needs. Budgeting is informal. The allocation of resources to needs tends to be reactive. The dotted lines and dotted boxes in the exhibit indicate intermittent channels and lesser sources or uses.3 In the situation of an unbanked LMI household, the absence of a transaction account and any established short-term borrowing capacity leads to reliance on alternative financial services providers: check cashers, payday lenders, refund anticipation lenders, rent-to-own stores, pawnshops, etc. The associated fees and charges create a major leakage of funds along their way to expenditure. In 2004, an estimated $6 billion in finance charges were paid annually to payday lenders; in the 2008 tax filing season (for tax year 2007), more than $1 billion in fees were paid for refund anticipation loans and checks.4
1 This paper adopts the FDIC’s definitions of unbanked and underbanked households. Unbanked households are those in which no member currently has either a checking or savings account. Underbanked households are those with a checking or savings account, but that nonetheless made use of an alternative financial services provider at least once a year or had obtained a refund anticipation loan during the past five years. See Federal Deposit Insurance Corporation (2009). 2 For unbanked or underbanked LMI households, the sources of borrowing are diverse including: buying on layaway, pawnshops, refund anticipation loans, rent-to-own purchases, payday loans, cash advances from credit cards, borrowing from one’s pension or retirement, or short-term credit from friends, relatives, or finance companies. 3 The most insightful research on these issues is based on in-depth personal interviews with low-income single mothers. See Edin and Lein (1997) and Edin (1993). 4 See Stegman (2007) and National Consumer Law Center (2010).
3

In this pre-program schematic, savings are indicated as an underutilized channel. Those without a savings account have no ready mechanism for conserving funds, and cash on hand tends to be spent. Under this scenario, there is little ability to attend to financial shocks and asset-building.
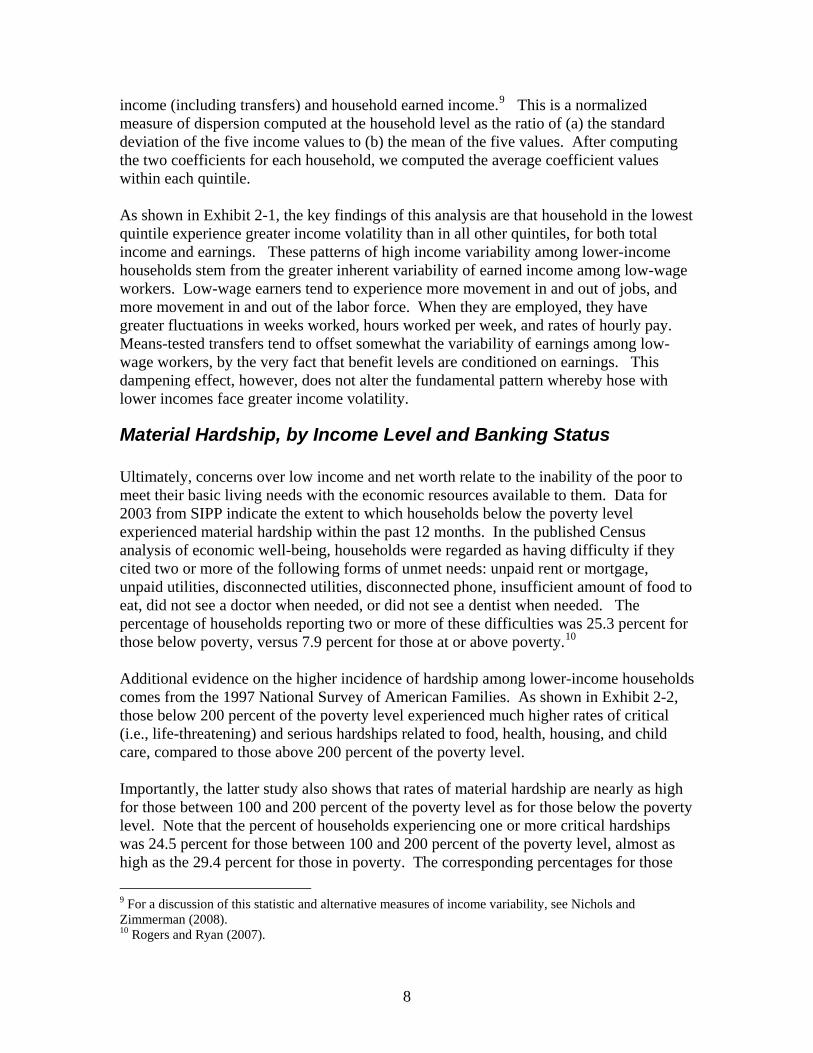
Household Flow-of-Funds: StabilityFirst Exhibit 1-2 shows the intended flow of funds under the StabilityFirst design. The BankIt account is the account in which incoming income is held. Electronic payments are direct-deposited. Under a budget established by the participant in consultation with the financial coach, deposits to savings are pre-committed (as pre-scheduled monthly or weekly transfers from BankIt to SaveIt). Regular bill payments and debt repayments can also be scheduled by electronic transfer or by pre-authorized check. To meet other anticipated household spending needs, a prescribed amount of funds (consistent with the household’s budget) is loaded each week onto the SpendIt card, a general-purpose reloadable pre-paid card. Every day a text message is sent to the participant’s cell phone, indicating the remaining balance on the SpendIt card. The card is used for point-of-sale retail purchases, and also (if necessary) to obtain cash through an allowable POS cash-back transaction. The SpendIt card can also be used to obtain cash at an ATM location. Funds remaining unspent at the end of each week are transferred from the SpendIt card account to the SaveIt account. The SaveIt account thus provides the buffer-stock of funds to cope with financial shocks, in the form of either a rise in spending or a fall in income.
4

2: Economic Shocks and Material Hardship Households across the economic spectrum are subject to unexpected changes in their economic needs or resources. We focus here on adverse economic events, referring to them as “shocks.” These events can take on a number of forms and can be categorized generally as follows:
Employment situation: loss of job, reduction in hours, reduction in job-related benefits;
Health status: sudden illness or accidental injury, onset of a mental health
condition;
Family composition, support network, or personal relationships: entry into the household of a dependent member, exit from the household of an income-earning member, separation, divorce, domestic violence, incarceration, loss of child support or informal child care, or other changes in the availability of support from (or the burden of support to) one’s network of extended family or friends;
Major consumer expenses: need for repairs to home and automobiles, replacement
of appliances;
Public income support: loss of eligibility or reduction in benefits (as through procedural noncompliance or expiration of time-limited benefits); and
Financial assets: loss in value of asset holdings.
In the economic life of any given household, such events may not be disruptive, if they are short-lived in duration, widely spaced in time, or small in relation to one’s economic resources. For those in the middle and upper ranges of the income distribution, financial setbacks may do nothing more than temporarily impede the growth of one’s income or net worth. To cope with minor or isolated shocks, there may be a drawdown of one’s net worth, by liquidating assets or incurring additional debt. The effects may be dampened by various forms of insurance coverage, and the status quo ante can be restored without hardship. It is also the case, however, that major or multiple economic shocks can lead to major hardship for persons at all income levels. For middle- and upper-income households this is evidenced by the heightened pace of recent bankruptcy filings.5 For those in lower-income ranges—the poor and the near-poor in income, with little available wealth, or access to additional public or private support—their vulnerability to
5 American Bankruptcy Institute (2009). Consumer filings include personal bankruptcy filings under Chapters 7 and 13 of the federal bankruptcy statute.
5
unexpected changes in expenses, income, or assets is especially pronounced. To begin with, such adverse events are more likely to occur for those with limited resources. A number of factors are at work. One is the nature of the labor force experience for lower-wage workers, with a much greater reliance on temporary or seasonal employment and much greater susceptibility to layoffs or reductions in hours. A second is the locationally related risks associated with lower-income neighborhoods and communities, including environmental health hazards (e.g., lead paint or communicable respiratory ailments) and higher rates of criminal victimization. A third is the higher rate of breakdown of automobiles, appliances, or other consumer durables, reflecting the lower quality and reliability of the products that are affordable to lower-income consumers. A fourth is the lack of insurance of various forms, including health, life, disability, unemployment, and automobile coverage. Moreover, when financial shocks occur for low-income families, these events have greater immediate potential for material hardship as these families are operating with smaller margins above a subsistence level of consumption. While middle and upper income families are able to reduce their consumption spending on discretionary items such as eating out, entertainment, or travel, those with low incomes have little that is discretionary in their current spending. For this reason, little in their budgets can be reduced without some level of material deprivation. This means that there is little time allowed for one to respond to an adverse event.
Variability of Monthly Household Income Recent analyses of data from the Survey of Income and Program Participation (SIPP) indicate that American households at all levels of the income distribution, but especially those with low incomes, experience substantial within-year variability in their incomes.
Acs, Loprest, and Nichols (2009) In an analysis of SIPP data pooled across multiple panels, Acs, Loprest, and Nichols (2009) examined within-year income changes among individuals aged 25 to 61 in families with children.6 They focused on the extent to which individuals experienced “substantial” income drops—defined as a decline of 50 percent or more within one year—by income quintile. Among those with such declines, they considered whether the individual’s monthly income subsequently recovered to its pre-drop level within a year and also whether the drop had been preceded by earlier income fluctuation. Income changes were measured in terms of changes in average monthly income from one four-month interval to another. (Four months is the duration of a SIPP survey “wave.”) Their findings (based on a pooled analysis of the 1996, 2001, and 2004 SIPP panels) were as follows:
6 Acs, Loprest, and Nichols (2009).
6
The highest incidence of substantial (50 percent or larger) income declines was among those in the lowest income quintile, with 20 percent experiencing such drops.
Among those in the lowest quintile who experienced substantial declines, 16
percent made no recovery within a year (i.e., their income remained at less than one-half of the pre-drop level for at least one year). Another 33 percent made an incomplete recovery (to less than 100 percent of the pre-drop level), while 51 percent made a full recovery (to 100 percent or more of the pre-drop level).
For more than one-third (37 percent) of those with substantial income drops in the
lowest quintile, the decline had been preceded by a substantial income increase from its level two waves before the drop.
The authors noted that, for some of the individuals with substantial income declines, the drop may thus reflect a return to their earlier normal income level, following a temporary upward spike. They also go on to observe that:7
“For others the observed drop following a rapid rise in income can signify very volatile income that makes it difficult for a family to save and plan. It can also represent a ‘false start’ in their attempts to move up the income ladder.”
Additional Analysis of Income Variability For the current study we have done further analysis of within-year income volatility using the 2001 SIPP panel. We focused on the question of whether lower-income households face a double-barreled dilemma—incomes that are not only lower on an annual basis but also more variable from month to month. We used income data from the first five waves of the eight-wave 2001 SIPP panel, knowing that we would want to use the measure of income volatility as an explanatory variable in separate analysis of material hardship experienced during Waves 6-8 of this longitudinal sample. In using SIPP data for this analysis, we needed to be attentive to the issue of seam bias. This is the tendency to observe spurious income changes across the seam of two successive administrations of a multiwave survey such as SIPP.8 To avoid the risk of overstating income variability by using income observations known to exhibit seam bias, we used only the most recent reference month in each four-month wave. For Waves 1-5, this provided five data points from which to construct a measure of income volatility. We used these data points to compute the mean monthly total income for each household. We formed income quintiles based on these mean monthly values. We then computed the “coefficient of variation” of income for each household, for both total household
7 Acs, Loprest, and Nichols (2009), p. 8. 8 See, for instance, Moore (2007).
7
income (including transfers) and household earned income.9 This is a normalized measure of dispersion computed at the household level as the ratio of (a) the standard deviation of the five income values to (b) the mean of the five values. After computing the two coefficients for each household, we computed the average coefficient values within each quintile. As shown in Exhibit 2-1, the key findings of this analysis are that household in the lowest quintile experience greater income volatility than in all other quintiles, for both total income and earnings. These patterns of high income variability among lower-income households stem from the greater inherent variability of earned income among low-wage workers. Low-wage earners tend to experience more movement in and out of jobs, and more movement in and out of the labor force. When they are employed, they have greater fluctuations in weeks worked, hours worked per week, and rates of hourly pay. Means-tested transfers tend to offset somewhat the variability of earnings among low-wage workers, by the very fact that benefit levels are conditioned on earnings. This dampening effect, however, does not alter the fundamental pattern whereby hose with lower incomes face greater income volatility.
Material Hardship, by Income Level and Banking Status Ultimately, concerns over low income and net worth relate to the inability of the poor to meet their basic living needs with the economic resources available to them. Data for 2003 from SIPP indicate the extent to which households below the poverty level experienced material hardship within the past 12 months. In the published Census analysis of economic well-being, households were regarded as having difficulty if they cited two or more of the following forms of unmet needs: unpaid rent or mortgage, unpaid utilities, disconnected utilities, disconnected phone, insufficient amount of food to eat, did not see a doctor when needed, or did not see a dentist when needed. The percentage of households reporting two or more of these difficulties was 25.3 percent for those below poverty, versus 7.9 percent for those at or above poverty.10 Additional evidence on the higher incidence of hardship among lower-income households comes from the 1997 National Survey of American Families. As shown in Exhibit 2-2, those below 200 percent of the poverty level experienced much higher rates of critical (i.e., life-threatening) and serious hardships related to food, health, housing, and child care, compared to those above 200 percent of the poverty level. Importantly, the latter study also shows that rates of material hardship are nearly as high for those between 100 and 200 percent of the poverty level as for those below the poverty level. Note that the percent of households experiencing one or more critical hardships was 24.5 percent for those between 100 and 200 percent of the poverty level, almost as high as the 29.4 percent for those in poverty. The corresponding percentages for those
9 For a discussion of this statistic and alternative measures of income variability, see Nichols and Zimmerman (2008). 10 Rogers and Ryan (2007).
8

experiencing one or more serious hardships were 63.2 and 74.1 percent, respectively. This pattern points to the fragility of economic circumstances among the near-poor: those with incomes above the poverty threshold but who remain vulnerable to financial shocks because they have little or no savings of their own, limited or no insurance coverage for some adverse events, and limited access to help from other sources. Analyses of the relationship between household financial circumstances and material hardship suggest the importance of access to credit. One of the earliest such studies, based on interviews with 1,617 non-Hispanic adult respondents in Chicago, found that access to a $500 loan was associated with as much a reduction in the incidence of hardship as a tripling of household income.11 The difficulty of borrowing, or the inability to maintain a cushion of savings, is thus a major barrier in avoiding hardship. Additional evidence comes from the previously cited Detroit Area Household Financial Services Survey, with respect to the greater vulnerability to material hardship (within the past twelve months) among those low and moderate income (LMI) households who are unbanked. Among the entire LMI sample, as shown in Exhibit 2-3, 18 percent had their phone disconnected, 17 percent did not have enough food, 10 percent had a utility shut off, 6 percent were evicted, and 4 percent filed for bankruptcy. An estimated 90 percent experienced one or more of these hardships within the past year. For each individual form of hardship (with the exception of bankruptcy), the incidence was twice as high (or more) for the unbanked respondents than those who were banked. Economic instability is a fact of life for families at all income levels, but it is especially problematic for the poor and near-poor. These households are already operating within narrow margins, in a range that is near subsistence levels of consumption. The volatility of their incomes and the unpredictability of their expenses can immediately jeopardize their ability to make ends meet. In contrast, middle- or upper-income households have some (perhaps a sizable) financial cushion to protect them against adverse events or poor decisions. The “lack of slack” among the poor and non-poor has been characterized as the “irony of poverty.” The tenuous circumstances for these households call upon them to make good decisions at the very time that one is least able to do so, facing a depletion of both financial resources and cognitive energies.
11 Mayer and Jencks (1989).
9
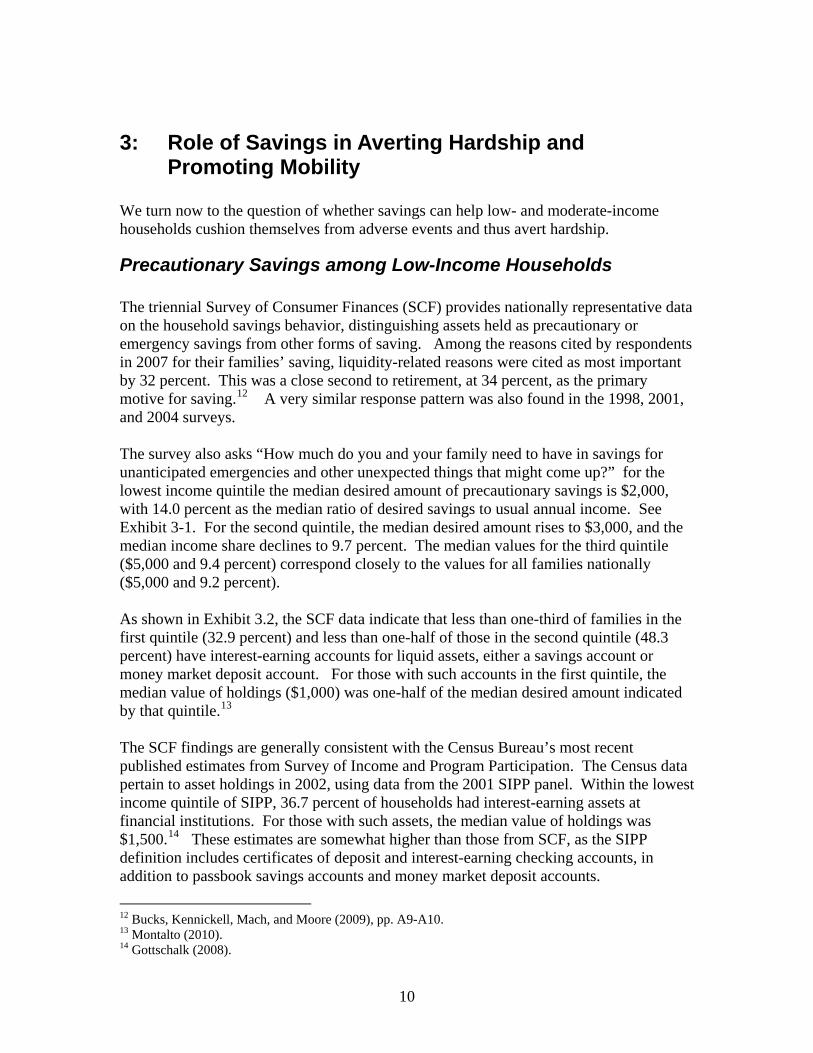
3: Role of Savings in Averting Hardship and Promoting Mobility
We turn now to the question of whether savings can help low- and moderate-income households cushion themselves from adverse events and thus avert hardship.
Precautionary Savings among Low-Income Households The triennial Survey of Consumer Finances (SCF) provides nationally representative data on the household savings behavior, distinguishing assets held as precautionary or emergency savings from other forms of saving. Among the reasons cited by respondents in 2007 for their families’ saving, liquidity-related reasons were cited as most important by 32 percent. This was a close second to retirement, at 34 percent, as the primary motive for saving.12 A very similar response pattern was also found in the 1998, 2001, and 2004 surveys. The survey also asks “How much do you and your family need to have in savings for unanticipated emergencies and other unexpected things that might come up?” for the lowest income quintile the median desired amount of precautionary savings is $2,000, with 14.0 percent as the median ratio of desired savings to usual annual income. See Exhibit 3-1. For the second quintile, the median desired amount rises to $3,000, and the median income share declines to 9.7 percent. The median values for the third quintile ($5,000 and 9.4 percent) correspond closely to the values for all families nationally ($5,000 and 9.2 percent). As shown in Exhibit 3.2, the SCF data indicate that less than one-third of families in the first quintile (32.9 percent) and less than one-half of those in the second quintile (48.3 percent) have interest-earning accounts for liquid assets, either a savings account or money market deposit account. For those with such accounts in the first quintile, the median value of holdings ($1,000) was one-half of the median desired amount indicated by that quintile.13 The SCF findings are generally consistent with the Census Bureau’s most recent published estimates from Survey of Income and Program Participation. The Census data pertain to asset holdings in 2002, using data from the 2001 SIPP panel. Within the lowest income quintile of SIPP, 36.7 percent of households had interest-earning assets at financial institutions. For those with such assets, the median value of holdings was $1,500.14 These estimates are somewhat higher than those from SCF, as the SIPP definition includes certificates of deposit and interest-earning checking accounts, in addition to passbook savings accounts and money market deposit accounts.
12 Bucks, Kennickell, Mach, and Moore (2009), pp. A9-A10. 13 Montalto (2010). 14 Gottschalk (2008).
10

Role of Savings in Averting Hardship Recent evidence comes from analysis by McKernan, Ratcliffe, and Vinopal, using the 1996 and 2001 SIPP panels. Dividing households into three income groups, this 2009 study estimated the percentage of households who experience general deprivation in the year after an adverse event of the following types: involuntary job loss, health-related work limitation, and a parent leaving the family (through death or divorce).15 Each household was classified as “liquid-asset poor” or “not liquid-asset poor” based on whether they had sufficient liquid assets to fund poverty-level consumption for three or more months. Being not liquid-asset poor was associated with a significantly lower rate of general deprivation following adverse events of all three types, for those in the bottom and middle thirds of the income distribution. As shown in Exhibit 3-3, having higher savings for those in the bottom third reduced the probability of general deprivation from 51 to 28 percent for involuntary job less, from 48 to 31 percent for health-related work limitation, and from 40 to 16 percent for a parent leaving the family. Multivariate analysis showed those at the higher savings level as having a 14 percent point lower probability of an adverse event resulting in general deprivation. Additional evidence of the effect of liquid assets on hardship comes from an analysis of 2001 SIPP panel data conducted for this study. That analysis focuses on the following eight measures of material hardship, all measured in the Adult Well-Being topical module (in Wave 8), the same measures that underlie the general deprivation outcome in the analysis by McKernan, Ratcliffe, and Vinopal. These measures were based on the following survey questions:
“During the past 12 months, has there been a time when you did not meet all of your essential expenses?” (unmet essential expenses)
“Was there any time in the past 12 months when you did not pay the full amount
of the rent or mortgage?” (missed housing payment)
“How about not paying the full amount of the gas, oil, or electricity bills? Was there a time in the past 12 months when that happened to you?” (missed utility payment)
“In the past 12 months did the gas or electric company turn off service, or the oil
company not deliver oil?” (utility shutoff)
15 McKernan, Ratcliffe, and Vinopal (2009). A household was considered “generally deprived” if it experienced two or more of the following hardships within the past twelve months: (1) food insecurity, (2) food insufficiency, (3) trouble paying basic bills, (4) not seeing a doctor when needed, (5) not seeing a dentist when needed, (6) inability to pay rent or mortgage, (7) inability to pay utility or medical bills, (8) having phone service disconnected (9) having gas or electric service cut off because of inability to pay, (10) eviction from home or apartment due to inability to pay.
11
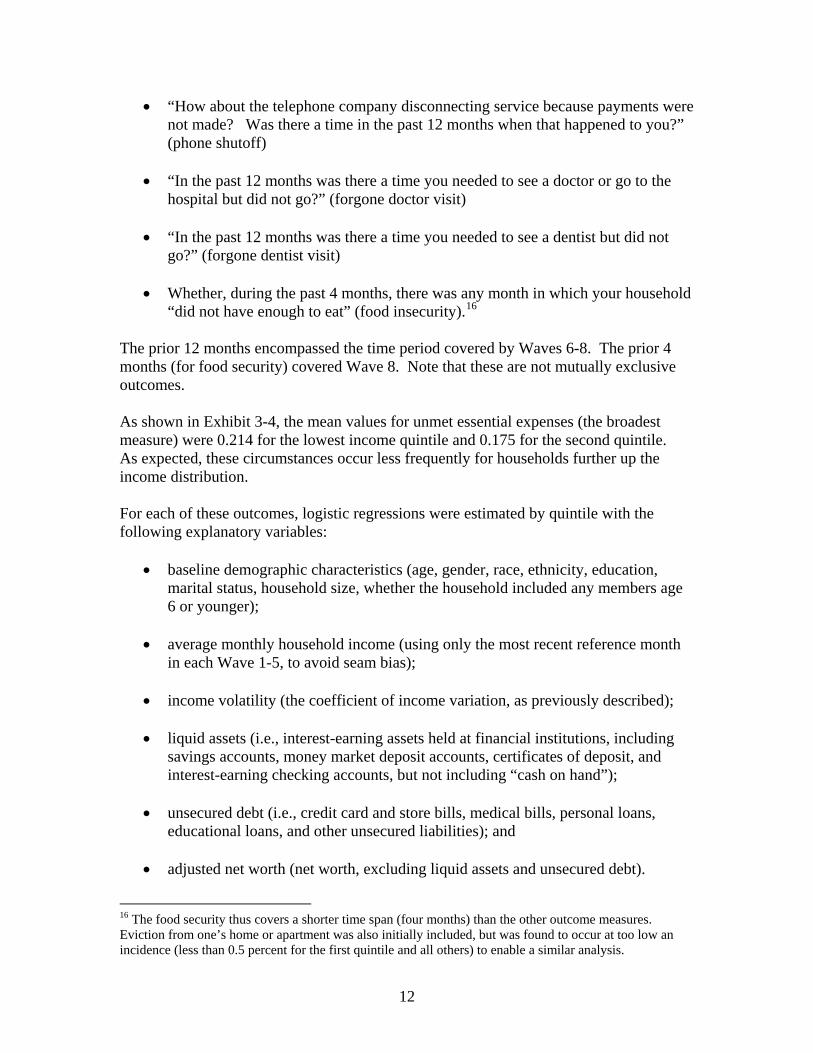
“How about the telephone company disconnecting service because payments were not made? Was there a time in the past 12 months when that happened to you?” (phone shutoff)
“In the past 12 months was there a time you needed to see a doctor or go to the
hospital but did not go?” (forgone doctor visit)
“In the past 12 months was there a time you needed to see a dentist but did not go?” (forgone dentist visit)
Whether, during the past 4 months, there was any month in which your household
“did not have enough to eat” (food insecurity).16 The prior 12 months encompassed the time period covered by Waves 6-8. The prior 4 months (for food security) covered Wave 8. Note that these are not mutually exclusive outcomes. As shown in Exhibit 3-4, the mean values for unmet essential expenses (the broadest measure) were 0.214 for the lowest income quintile and 0.175 for the second quintile. As expected, these circumstances occur less frequently for households further up the income distribution. For each of these outcomes, logistic regressions were estimated by quintile with the following explanatory variables:
baseline demographic characteristics (age, gender, race, ethnicity, education, marital status, household size, whether the household included any members age 6 or younger);
average monthly household income (using only the most recent reference month
in each Wave 1-5, to avoid seam bias);
income volatility (the coefficient of income variation, as previously described);
liquid assets (i.e., interest-earning assets held at financial institutions, including savings accounts, money market deposit accounts, certificates of deposit, and interest-earning checking accounts, but not including “cash on hand”);
unsecured debt (i.e., credit card and store bills, medical bills, personal loans,
educational loans, and other unsecured liabilities); and
adjusted net worth (net worth, excluding liquid assets and unsecured debt).
16 The food security thus covers a shorter time span (four months) than the other outcome measures. Eviction from one’s home or apartment was also initially included, but was found to occur at too low an incidence (less than 0.5 percent for the first quintile and all others) to enable a similar analysis.
12

The last three covariates were measured in Wave 3, using the topical module on Assets and Liabilities. The key covariate was the liquid assets variable, indicating the extent of emergency or precautionary savings. As expected, liquid assets had a negative estimated coefficient in all regressions, indicating that assets are associated with a lower probability of subsequent hardship. We focus here on the results for the regressions estimated for the lower two income quintiles. As shown in Exhibit 3-4, the estimated favorable effect of liquid assets was negative and:
strongly significant (at the 0.05 level or better) in both the bottom and second income quintiles for the following four outcomes: unmet essential expenses, missed utility payment, utility shut-off, and forgone doctor visit;
strongly significant (at the 0.05 level of better) in one but not both of the lower
income quintiles for the following three outcomes: phone shutoff, forgone dentist visit, and food insecurity; and
not statistically significant (at the 0.05 level) in either of the lower income
quintiles, for the remaining outcome: missed housing payment. We then used the estimated coefficients from these regressions to calculate the effects of an additional $1,000 in liquid assets on the incidence of hardship, evaluating these effects at the quintile-specific sample mean values. As indicated in Exhibit 3-4, these effects—although significantly nonzero—are small in magnitude. For instance, an additional $1,000 in liquid assets is associated with a reduction of 0.004 in the likelihood of a missed utility payment, whose mean value is 0.143. (These effects were similar in magnitude to those associated with an additional $100 in monthly income.) The effects of increased precautionary savings may be dampened by the time lag between the available Wave 3 measure of liquid assets and the hardship measures, which cover Waves 6-8 (or Wave 8 only, for food security). The small magnitude may also reflect the fact that households in the low-income households tend to hold their precautionary savings informally, as cash on hand. As indicated previously, only about one-third of those in the lowest income quintile own a savings account or money market deposit account.
Role of Savings in Promoting Mobility Additional evidence on the effects of savings on economic mobility comes from recent analysis comparing the factors that are related to upward household movement in the income distribution, both within one’s lifetime and across generations.17 The
17 See Cooper and Luengo-Prado (2009).
13

intragenerational findings are of greatest interest here. First, using 1984 and 1989 data from the Panel Study of Income Dynamics (PSID), Cooper and Luengo-Prado classified households according to their income quartile and whether they were high or low savers (above or below the median savings level, which was $30,700 in 2000 dollars). They then looked at the pattern of upward (or downward) movement of these same households in the income distribution between 1984-89 and 2003-2005, separately for the high savers and low savers. Exhibit 3-5 shows the findings in the form of transition matrices for the high and low savers. For those in the bottom income quartile in 1984-89, the probability of advancing to a higher income quartile by 2003-2005 was much greater for the high savers than for the low savers, 55 percent (35+16+4) versus 34 percent (25+7+2). Similarly, those beginning in the second quartile stood a greater chance of advancing upward if they were high savers, 47 percent (30+17) versus 36 percent (25+11). In contrast, savings appeared to be unrelated to the extent of downward mobility among those who began in one of the upper income quartiles.
14
4: Challenges Posed by Financial Shocks--Economics and Psychology
Financial shocks thus have major disruptive potential for lower-income families. Adverse events not only tend to occur more frequently for those with low incomes, but also—when they occur—tend to result in hardship low-income families are already at some level of economic impoverishment. The other all-too-obvious circumstance they face is that they have limited economic resources available to respond. This “lack of slack” is the reality of having less income and little or no wealth of one’s own.
Limited Access to Other Resources Perhaps not surprisingly, low-income households—ones having difficulty making ends meet, on a repeated basis—are rarely able to maintain a buffer stock of liquid assets. If they succeed in doing so initially, and use the funds to ward off hardship, they may find themselves unable to replenish (and maintain) these reserve funds to fend off the next shock. One reason for this is that, having experienced financial depletion, some find it difficult to resist temptation to spend any “excess” funds that are readily available to them. Because their buffer-stock is a “leaky bucket”, it does not function well as an emergency reserve. If a shock cannot be met by tapping one’s own resources or reducing one’s spending, the available options are to incur more debt, to turn to private support networks, or seek assistance through public “social safety net” programs. Each of these has limitations, as follows. Incurring more debt at non-exorbitant rates is a feasible option to middle- and upper-income households, as their credit-worthiness allows them to gain access to borrowing through home equity loans, other consumer loans, or credit card balances. For low-income consumers, however, credit is typically available only at high rates, through such sources as payday lenders or refund anticipation lenders. Private support networks--families, friends, churches, or other private charitable organizations—are a more typical and traditional means of overcoming shocks for low-income persons. Help is provided through either a gift or loan of cash or in-kind assistance (e.g., child care, transportation, housing). Whether such sources are able to meet one’s needs will of course depend on the extent of one’s network and whether the resources of these individuals or organizations are already stretched too thin, as may be the case when shocks emanate from local, regional, or national economic downturns. Seeking public support through social safety net programs—such as Temporary Assistance for Needy Families (TANF) or food stamps (now called Supplemental Nutrition Assistance Program, or SNAP)—to help cope with a financial shock may also
15

be ineffective. There are restrictions in TANF program coverage (e.g., asset tests) that may make a family ineligible. Benefit amounts may be based on one’s previous financial circumstances, not their current—worsening—situation. Delays in the expected receipt of benefits may also discourage families from applying.
Feedback between Financial and Cognitive Depletion When low-income households find themselves in economic uncertainty and instability, experiencing depletion of their assets and with insufficient income to make ends meet, their coping strategies often tend to be counterproductive. Their actions can trigger adverse financial consequences such as the following:
Penalties, charges, and escalating interest rates for late payment of credit card bills, utility bills, auto loans, mortgage loans, or other obligations;
Overdraft charges on credit or debit cards;
Excessive interest rates on payday loans, refund anticipation loans, layaway
purchases, rent-to-own transactions, personal lines of credit, or other borrowing;
Worsening of one’s credit score as delinquencies and total outstanding debt mount higher, hampering any upcoming efforts to obtain credit, insurance, or employment; and
Threatened utility shutoff, eviction, foreclosure, or bankruptcy.
Tending to worsen the financial peril is that the depletion of financial resources is coupled with a depletion of cognitive energies. Those energies are spent fighting fires, averting crises, and meeting the family’s most immediate material needs. Decision-making is slowed, as attention is divided and one becomes distracted and confused. Procrastination and myopia set in. Self-control is diminished. As stress and tension increases, miscalculations are more likely, and decisions become more error-prone. They may exhibit “ostrich behavior”—avoiding negative information and failing to take necessary action. In this stressful and distracted state of mind, it becomes difficult to bring adequate attention to the making full use of available private support networks or public benefits. One is more likely to yield to predatory marking practices from financial services providers. The mental strain brings poor decisions, with further squandered resources and forgone opportunities. Although a situation of dwindling financial resources cries out for discipline in spending, one’s resistance to temptation may actually be weakened. In a depleted state, one’s best intentions can become blurred and the ability to recognize and ward off temptation may be diminished. For instance, because low-income parents do not have the luxury of occasionally indulging their children through impulse purchases of toys or clothes, but
16
still want their children to enjoy the things that other children have, parents may be more likely to yield to temptation at the very time they can least afford it. Impulse purchases, if made, are likely to be even larger in proportion to income for the poor than for nonpoor families. Other, more subtle influences on behavior may also come into play. As household members come to perceive themselves as falling into a condition of economic scarcity, they may project upon themselves their stereotype of poor individuals—all too often, a mistaken unflattering stereotype of dependence and helplessness. This process of identification may contribute to a learned helplessness, compromising one’s ability to confront and respond to the economic situation that has presented itself. The interplay between financial depletion and cognitive depletion—and the resulting mismatch between intention and action—thus accentuates the vulnerability of low-income households to financial shocks. Adverse events can bring about a mutually reinforcing cycle of depletion and stress. A weakened sense of personal efficacy and self-control may lead to inaction or to follow the impulsive and counterproductive actions of others—for instance, in turning to high-cost borrowing. The prospect arises of a downward spiral, with circumstances cascading from bad to worse.
17

5. Behaviorally-Informed Program Design The preceding sections have set the context for describing the StabilityFirst program concept, for enabling low-income households to better manage their finances, accumulate a buffer stock of savings, and cope with financial shocks. To review, we have presented emerging evidence to support the following observations about the financial circumstances faced by lower-income households. First, their monthly incomes are more variable than for those in higher income ranges. Second, adverse events affecting either income or expenses (or both) are more frequent for lower-income households. Third, when these shocks occur, they carry a greater risk of economic hardship for those whose level of income (and consumption) is already low. Fourth, holdings of liquid assets appear to reduce the risk of hardship for those experiencing adverse events. At the same time as this increasing body of empirical evidence has emerged, there has also been considerable attention within the field of behavioral economics to the psychological influences that—combined with economic circumstances—make it difficult for low-income families to save. This section highlight these influences and how they inform the design of StabilityFirst.
Mental Accounting and Other Predispositions Building on the earlier research of Thaler, Kahneman, Twersky, Lowenstein, and others, Mullainathan and Shafir have considered how policies and programs to promote savings can be more effectively designed by incorporating a behavioral perspective.18 One focus of this research is “mental accounting.” This is the tendency for individuals to compartmentalize their income and wealth into separate accounts that link specific sources and amounts of funds to particular spending items. (Sometimes, this is done physically by storing money in separately labeled envelopes or jars.) Within this framework, money is not fungible, and individuals may make suboptimal decisions, not reallocating funds to uses that would make a greater contribution to the family’s well-being. Individuals may thus be observed as saving and borrowing at the same time. Such accounting schemes are typically adopted as a means of internal control to ensure that specific upcoming spending needs are met. These systems act as impediments to precautionary saving, which typically requires a reduction in consumption spending (assuming no increase in income or debt). When individuals engage in mental accounting, they develop a pre-commitment to particular purchases, setting money aside for those items. Also posing a behavioral obstacle is the fact that individuals are “loss averse.” That is, the utility loss associated with relinquishing something exceeds the utility gain associated with acquiring it. Mentally preparing to purchase an item puts one closer to possessing it; one is thereby reluctant to forgo its purchase, when the benefit of
18 See Mullainathan and Shafir (2009). Several of the earliest contributions to this line of research are Thaler (1985) and Thaler (1999). See also Thaler and Sunstein (2009).
18

doing so comes in uncertain future consumption—which is what one “buys” through precautionary saving . Other basic predispositions in human behavior militate against saving. As with mental accounting, these psychological tendencies are not specific to the low-income population. They include such “self control” matters as procrastination, inertia (“status quo bias”), temptation, impatience, and impulsiveness. Each of these inclinations tends to crowd out savings, even among individuals who have an intention to save.19
Commitment Devices With these psychological influences acting against savings, the implication for program design is to provide some form of commitment device that enables individuals to more effectively act on their intentions. This is the insight that underlies Thaler and Benartzi’s “Save More Tomorrow” program for increasing workers’ contributions to their retirement savings. In the words of Thaler and Sunstein:20
“Save More Tomorrow invites participants to commit themselves, in advance, to a series of contribution increases timed to coincide with pay raises. By synchronizing pay raises and savings increases, participants never see their take-home amounts go down, and they don’t view their increased retirement contributions as losses. Once someone joins the program, the saving increases are automatic, using inertia to increase savings rather than prevent savings.”
The situation of middle- and upper-income workers who are steadily employed over multi-year periods with the employer and whose earnings are rising over time through pay raises provides an opportunity to overcome the impediments to savings. These circumstances do not typically apply to lower-income workers, but the Save More Tomorrow model prompts the question: Are there any comparable opportunities among low-income families for overcoming their inability to save? There is some suggestive survey evidence that lower-income consumers find it easier to save for emergencies when they have adopted a budget plan that provides for savings and when they have a means of pre-committing some amount of their earnings to savings. The data were collected from a national survey of 1,000 respondents conducted in February 2008 by the Opinion Research Corporation for the Consumer Federation of America.21 All respondents had annual household incomes under $50,000. Results were tabulated separately for those with incomes under $25,000 (low income) and those between $25,000 and $50,000 (moderate income). For each of these income groups, the basic question addressed by the survey was whether there are budgetary practices and savings strategies that appear to distinguish low savers from high savers—respectively, those with less than or more than $500 in emergency savings.
19 For a useful discussion of these issues in the context of low-income savings, see Benton, Meier, and Sprenger (2007). 20 Thaler and Sunstein (2009), p. 115. See also Thaler and Benartzi (2004). 21 See Brobeck (2008).
19
As shown in Exhibit 5-1, the survey found that among low-income consumers the probability of being a high saver was above the sample average (36 percent) for those with spending plans, those with savings plans, and those saving through pre-authorized transfers from their checking account. The evidence was mixed for the moderate-income consumers, where the likelihood of being a high saver was above the sample average (62 percent) for those who had a spending plan with goals, but not for the other identified subgroups. The evidence from studies of middle-class workers is that a saving initiative works best as a default option. The foremost findings come from the study of automatic enrollment in 401(k) retirement programs, reported by Madrian and Shea (2001).
Broader Developments as Influences on Program Design Emerging developments in the market for low-cost financial services have established an evolving context for developing strategies to encourage low-income savings. Among these developments, which open avenues for program designs such as StabilityFirst, are the following:
Introduction of low-cost electronic banking products that enable unbanked individuals to open a basic checking account and a linked savings account.
Wider adoption throughout the retail sector of technologies that enable the use of
general-purpose prepaid reloadable cards for “point-of-sale” (POS) purchases.
Broader availability within the low-income population of cell phones and other mobile communication devices, and increased access among low- and moderate-income individuals to the internet—and thus to electronic banking services—from their homes, offices, schools, public libraries, and other venues.
Growing recognition of the need for financial education, counseling, and
coaching, and growing availability of such services from nonprofit program agencies.
Potential for household savings that exists in the billions of dollars currently paid
annually by low-income consumers to alternative financial services providers—payday lenders, pawn shops, rent-to-own stores, check cashers, refund anticipation lenders, etc.
The StabilityFirst program, as described in the opening section of this paper, was thus designed to take advantage of these circumstances and to apply insights from emerging research in behavioral economics. The design is focused on enabling low-income households to:
20

shift from cash-based finances to electronic transactions (as much as possible), consolidated income (into the BankIt account) reducing reliance on high-cost financial services for income receipt, bill payment, remittances, and other basic transactions;
control spending through monthly budgeting, use of a prepaid reloadable
spending card (the SpendIt card), combined with frequent (daily) reminders on one’s available card balance and end-of-month tracking of budgeted-versus-actual spending (the financial dashboard); and
precommit deposits into savings (the SaveIt account) from income and transfer
end-of-month unspent funds from the spending card into savings. A key element of the program model is the role of the financial coach as an established personal contact, to overcome the distrust and suspicion among the unbanked toward financial institutions and to provide guidance on the use of on-line banking services.
21

6. Implementation of the Pilot Test A small-scale pilot test of the StabilityFirst program has been launched at Central New Mexico (CNM) Community College in Albuquerque, New Mexico, to gain understanding of the operational feasibility of the program model. This section describes the planning and startup of the project. This test is an opportunity to learn from the experiences of 20 individuals who have been recruited to participate in a pilot program for an operational period of three months (through April 2010). The pilot test is not intended to provide estimates of program impact, as the sample is very small, the test period is intentionally short, and no control group or comparison group has been enrolled. Instead, the pilot test aims to assess the operational feasibility of the model and to enable further refinements to the intervention. If there is sufficient interest and funding to support further testing and evaluation, subsequent larger-scale and longer-term field projects may be undertaken. This “alpha test” is an initial exploratory test of product features and the level of coaching support and other organizational resources necessary for participants to adopt the financial products as tools for money management.
Project Partners The organizations participating in the pilot test include the host local agency, a financial partner, and an on-site research partner, as described below. The partnering arrangements were established in November-December 2009. The agency partner, Central New Mexico Community College, is operating the StabilityFirst program as an enhancement to its existing Center for Working Families program. CNM assigned two of its financial coaches to support the pilot test, each devoting a portion of their time over the two-month planning period (December 2009-January 2010), the three-month operational period (February-April 2010), and a one-month phase-down (May 2010). The operational setup and implementation of the product elements to be pilot-tested— BankIt, SpendIt, and SaveIt—requires technical expertise on electronic payment systems and financial products available in the prepaid card industry. Community Financial Resources (CFR) of Berkeley, California was selected for this role, having worked with other nonprofit social services providers in promoting low-income economic empowerment through low-cost tools for household financial management. In the language of the financial services industry, CFR is an “affinity partner,” connecting user groups (e.g., major employers, unions, or social service organizations) with appropriate financial products.
22
To provide the required functionality for the BankIt and SpendIt accounts, the StabilityFirst pilot test uses CFR’s existing low-cost, pre-paid reloadable card product. The CFR card employs the Visa debit-card platform. The issuing bank is MetaBank, and the transactions processor is MoneyNetwork, a subsidiary of the FirstData Corporation. For the SaveIt account, the pilot test uses ING DIRECT’s no-cost “Orange Savings Account.” A major advantage of the CFR and ING DIRECT products are their very low associated fees and charges. New Amsterdam Consulting (based in Phoenix, AZ) was selected as the on-site research partner, to conduct two rounds of qualitative interviews with the pilot test participants. The pre-test interviews were conducted in late January, with 17 of the 20 participants. The post-test round will occur in late April 2010. For completing each interview, the participant receives an incentive payment in the form of an electronic credit to their BankIt account ($10 for the pre-test interview and $20 for the post-test interview). Participants are also reimbursed for the basic maintenance fees for the BankIt account ($1 monthly) and the SpendIt card ($2.50 monthly) over the three-month operational period and for two cash-to-card deposits to their BankIt account (typically, $4 per deposit). To make the test operationally realistic, the participants have been responsible for the other fees and charges associated with their BankIt, SpendIt, and SaveIt account activity.
Sample Recruitment and Project Startup During the first three weeks of January 2010, CNM program staff recruited 20 pilot test participants, based on the following eligibility criteria:
18 years or older, with children (preferably, living with the participant),
employed part-time or full-time,
with annual household income at or below 200 percent of the federal poverty level,
enrolled as a CNM student and as a participant in CNM’s Center for Working Families (CWF) Program, and
with a Social Security number.
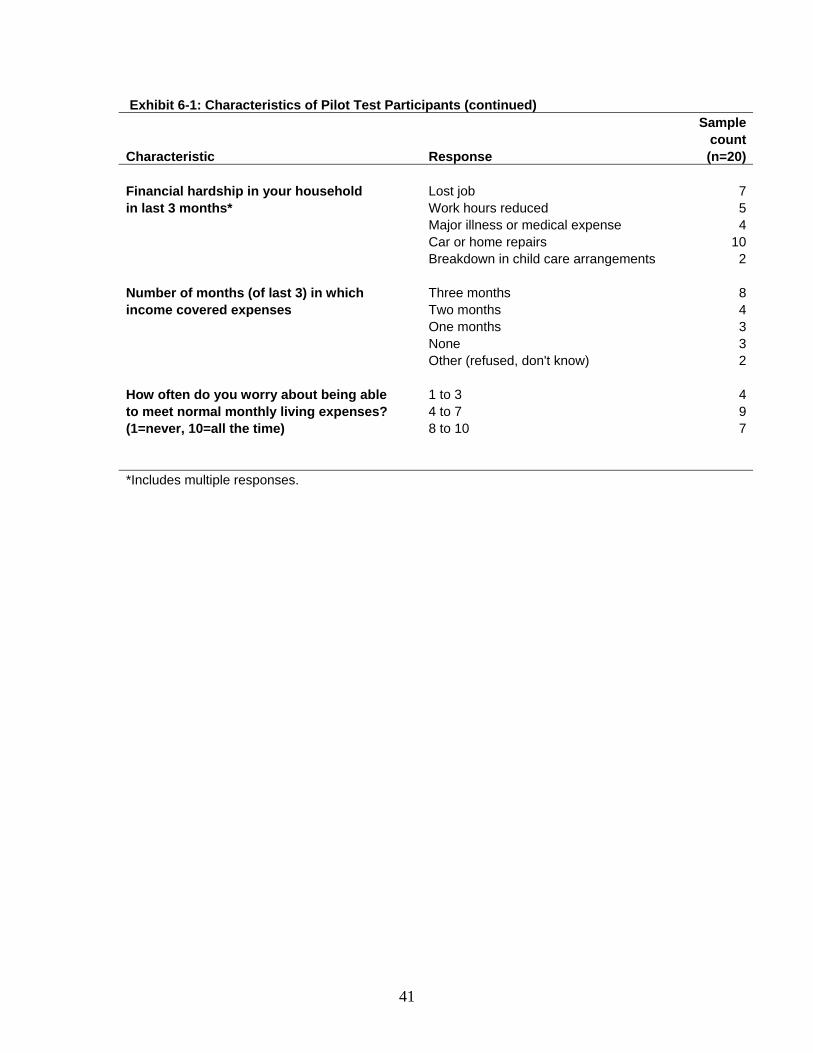
Email messages were sent to all participants on the CWF listserve, which includes about 600 students. About 45 expressed interest in the pilot test and were contacted by h a financial coach. Twenty individuals signed consent forms and entered the pilot test. Exhibit 6.1 displays the demographic and economic characteristics of the 20 participants, based on survey questionnaires completed in late January and early February.
At the end of the third week of January, CFR staff conducted a series of four group orientation meetings for the participants at CNM’s program offices. Each participant attended one of these two-hour sessions, to review the basics of the financial services provided under StabilityFirst, the role to be played by the CNM financial coaches, and the planned format of the end-of-month financial dashboard.
23

Beginning in late January, the two CNM financial coaches initiated one-on-one meetings with their participants in the program offices, equipped with desktop computers. The coaches were allowed to structure these meetings in keeping with their established coaching style. The following program steps were discussed in these sessions:
opening, activating, and using the BankIt, SpendIt, and SaveIt accounts;
constructing a monthly budget for income and expenses and accessing on-line transaction statements to compare actual versus budgeted amounts, using the financial dashboard tool (an Excel-based tool for tracking account flows);
identifying income sources and amounts to be direct-deposited or cash-deposited
into the BankIt account, and bills that might be automatically paid from the BankIt account;
directing the transfer of funds among the BankIt, SpendIt, and SaveIt accounts;
and
setting daily balance alerts via email or text message for the SpendIt account. The financial coaches maintained an “achievement timeline” for each participant to track progress. An early assessment of implementation lessons from the pilot test will be provided at the time of the Family Financial Security Symposium on April 19-20.
24

References Acs, Gregory, Pamela Loprest, and Austin Nichols. 2009. “Risk and Recovery: Documenting the Changing Risks to Family Incomes.” Perspectives on Low-Income Working Families, Brief 8, The Urban Institute, May 2009. American Bankruptcy Institute. 2009. “Consumer Bankruptcy Filings Surge Past One Million During First Nine Months of 2009.” Press release, October 2, 2009. Barr, Michael S. 2009. “Financial Services, Saving, and Borrowing Among Low- and Moderate-Income Households: Evidence from the Detroit Area Household Financial Services Survey.” In Rebecca M. Blank and Michael S. Barr (eds.), Insufficient Funds: Savings, Assets, Credit, and Banking Among Low-Income Households, National Poverty Center Series on Poverty and Public Policy, Russell Sage Foundation, pp. 66-96. Benton, Marques, Stephan Meier, and Charles Sprenger. 2007. “Overborrowing and Undersaving: Lessons and Policy Implications from Research in Behavioral Economics.” Discussion Paper 07-4, Federal Reserve Bank of Boston, Department of Public and Community Affairs and Center for Behavioral Economics and Decision Making, May 2007. Boushey, Heather, Chauna Brocht, Bethny Gundersen, and Jared Bernstein. 2001. Hardships in America: The Real Story of Working Families. Washington, DC: Economic Policy Institute. Brobeck, Stephen. 2008. “Understanding the Emergency Savings Needs of Low- and Moderate-Income Households: A Survey-Based Analysis of Impacts, Causes, and Remedies.” Consumer Federation of America, November 2008. Bucks, Brian K., Arthur B. Kennickell, Traci L. Mach, and Kevin B. Moore. 2009. “Changes in U.S. Family Finances from 2004 to 2007: Evidence from the Survey of Consumer Finances.” Federal Reserve Bulletin, February 2009, pp. A1-A56. Cooper, Daniel and Maria Luengo-Prado. 2009. “Savings and Economic Mobility.” In Reid Cramer, Rourke O’Brien, Daniel Cooper, and Maria Luengo-Prado, A Penny Saved Is Mobility Earned: Advancing Economic Mobility through Savings, The Pew Charitable Trusts, November 2009. Edin, Kathryn. 1993. There’s a Lot of Month Left at the End of the Money: How AFDC Recipients Make Ends Meet in Chicago. New York: Garland Press. Edin, Kathryn and Laura Lein. 1997. Making Ends Meet: How Single Mothers Survive Welfare and Low-Wage Work. New York: Russell Sage Foundation. Federal Deposit Insurance Corporation. 2009. FDIC National Survey of Unbanked and Underbanked Households, December 2009.
25

Gottschalk, Alfred O. 2008. “Net Worth and the Assets of Households: 2002.” Current Population Reports, P70-115, April 2008. Iceland, John. 2006. Poverty in America: A Handbook. Berkeley: University of California. Madrian, Brigitte C., and Dennis F. Shea. 2001. “The Power of Suggestion: Inertia in 401(k) Participation and Savings Behavior.” Quarterly Journal of Economics 116 (4): 1149-87. Mayer, Susuan and Christopher Jencks. 1989. “Poverty and the Distribution of Material Hardship.” Journal of Human Resources, Vol. 24, No. 1 (Winter 1989), pp. 88-114. McKernan, Signe-Mary, Caroline Ratcliffe, and Katie Vinopal. 2009. “Do Assets Help Families Cope with Adverse Events?” Perspectives on Low-Income Working Families, Brief 10, The Urban Institute, November 2009. Montalto, Catherine. 2010. “Statistic Sheet: Who is Saving.” Cited by the Consumer Federation of America in press release dated February 18, 2010. Moore, Jeffrey C. 2007. “Seam Bias in the 2004 SIPP Panel: Much Improved, but Much Bias Still Remains.” U.S. Census Bureau, Statistical Research Division, presented at the PSID Event History Calendar Research Conference, December 5-6, 2007. Mullainathan, Sendhil and Eldar Shafir. 2009. “Savings Policy and Decisionmaking in Low-Income Households.” In Rebecca M. Blank and Michael S. Barr (eds.), Insufficient Funds: Savings, Assets, Credit, and Banking Among Low-Income Households, National Poverty Center Series on Poverty and Public Policy, Russell Sage Foundation, pp. 121-145. National Consumer Law Center. 2010. “Beginning of the End?: Major Changes to Quick Tax Refund Loans Industry.” Press release, January 19, 2010. Nichols, Austin and Seth Zimmerman. 2008. “Measuring Trends in Income Variability.” Washington, DC: The Urban Institute. Rogers, Annette L. and Camille L. Ryan. “Extended Measures of Well-Being: Living Conditions in the United States, 2003.” Current Population Reports, Household Economic Studies, Report P70-110, U.S. Department of Commerce, Census Bureau April 2007. Stegman, Michael A. 2007. “Payday Lending.” Journal of Economic Perspectives, Volume 21, Number 1 (Winter 2007); pp. 169-190.
26
Thaler, Richard H. 1985. “Mental Accounting and Consumer Choice.” Marketing Science, Volume 4, Number 3 (Summer 1985); pp. 199-214. Thaler, Richard H. 1999. “Mental Accounting Matters.” Journal of Behavioral Decision-Making, 12: 183-206. Thaler, Richard H. and Shlomo Benartzi. 2004. “Save More Tomorrow: Using Behavioral Economics to Increase Employee Saving.” Journal of Political Economy 112, pp. S164-187. Thaler, Richard H. and Cass Sunstein. 2009. Nudge: Improving Decisions About Health, Wealth, and Happiness. New York, Penguin Books.
27

Exhibit 1-1:
4
Flow of Funds: Unbanked or Underbanked
Cash income
Asset-building
Anticipated current
spending needs
Paper checks and electronic payments
Sources of Funds Financial Practices/Products Uses of Funds
Borrowing
Bill payments and debt
repayments
Financial shocks
Unstructured mental accounting
Savings
Cash income
Sources of Funds Financial Practices/Products Uses of Funds
Borrowing
Bill payments and debt
repayments
Unstructured mental accounting
28
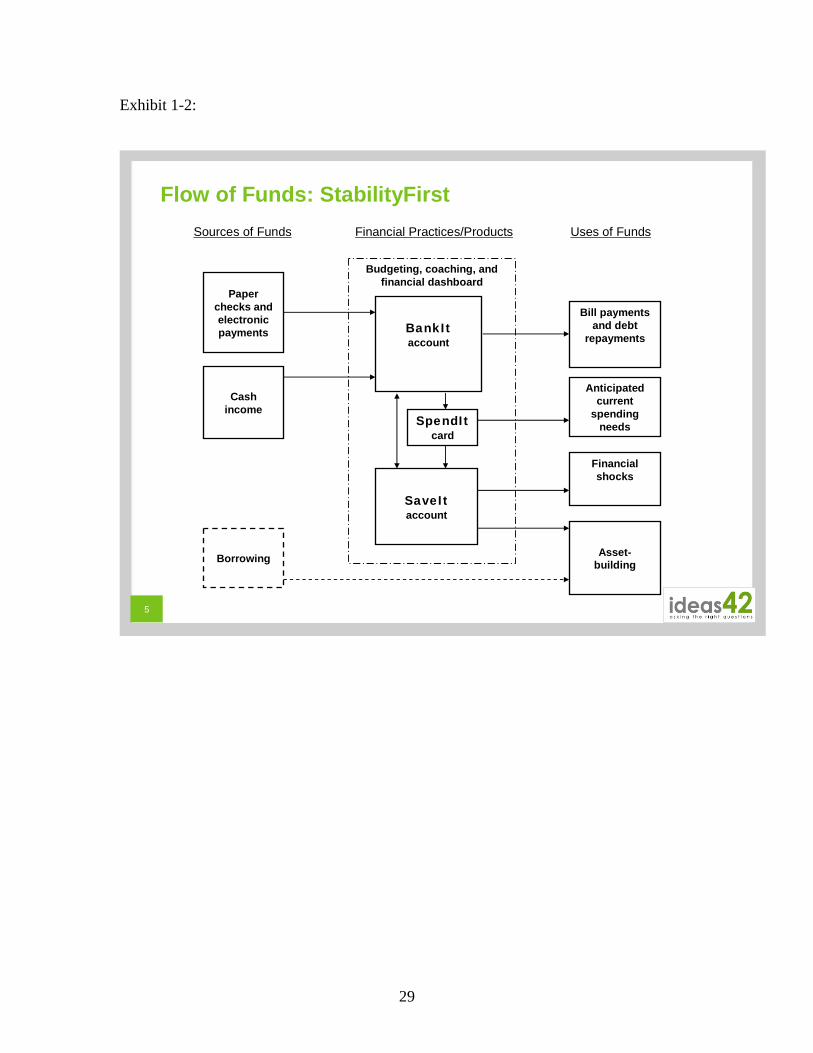
Exhibit 1-2:
5
Flow of Funds: StabilityFirst
Cash income
Asset-building
Anticipated current
spending needs
Paper checks and electronic payments
Sources of Funds Financial Practices/Products Uses of Funds
Borrowing
Bill payments and debt
repayments
Financial shocks
Budgeting, coaching, and financial dashboard
BankItaccount
SpendItcard
SaveItaccount
29
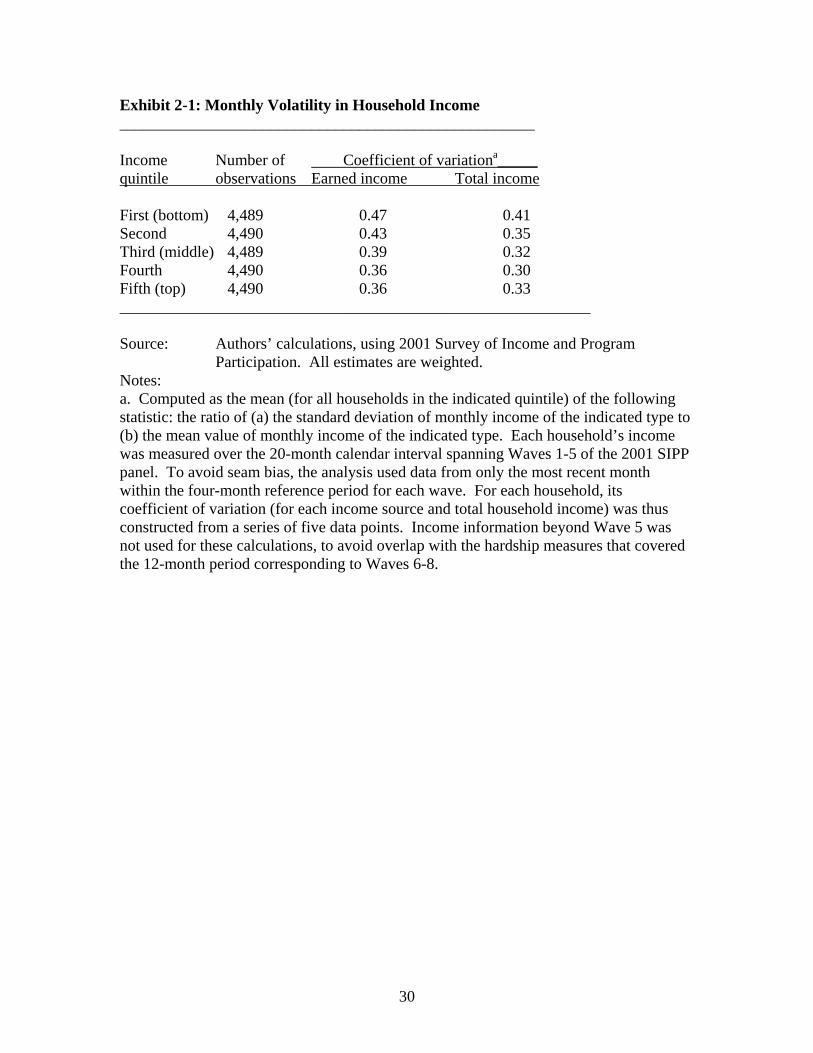
Exhibit 2-1: Monthly Volatility in Household Income ____________________________________________________ Income Number of Coefficient of variationa_____ quintile observations Earned income Total income First (bottom) 4,489 0.47 0.41 Second 4,490 0.43 0.35 Third (middle) 4,489 0.39 0.32 Fourth 4,490 0.36 0.30 Fifth (top) 4,490 0.36 0.33 ___________________________________________________________ Source: Authors’ calculations, using 2001 Survey of Income and Program
Participation. All estimates are weighted. Notes: a. Computed as the mean (for all households in the indicated quintile) of the following statistic: the ratio of (a) the standard deviation of monthly income of the indicated type to (b) the mean value of monthly income of the indicated type. Each household’s income was measured over the 20-month calendar interval spanning Waves 1-5 of the 2001 SIPP panel. To avoid seam bias, the analysis used data from only the most recent month within the four-month reference period for each wave. For each household, its coefficient of variation (for each income source and total household income) was thus constructed from a series of five data points. Income information beyond Wave 5 was not used for these calculations, to avoid overlap with the hardship measures that covered the 12-month period corresponding to Waves 6-8.
30

Exhibit 2-2: Indicators of Material Hardship ______________________________________________________________ Persons in families Persons in families below 200% of above 200% of Reported condition poverty level (%) poverty level (%) Critical (life-threatening) hardships Food insecurity Missed meals 17.5 3.4 Insufficient health care Did not receive or postponed medical care 12.7 8.0 Housing problems Doubling up with friends or family 2.4 0.3 One or more critical hardships 10.7 0 to 100% of poverty level 29.4 100 to 200% of poverty level 24.5 Serious hardships Food insecurity Worried about having enough food 41.1 11.0 Insufficient health care Emergency room is main source of care 7.3 2.3 No health insurance coverage 35.9 9.9 Housing problems Unable to make housing or utility payments 25.0 7.8 Telephone disconnected 10.4 3.0 Inadequate child care Child not in after-school activities 21.2 8.5 One or more serious hardships 30.1 0 to 100% of poverty level 74.1 100 to 200% of poverty level 63.2 _____________________________________________________________ Source: Boushey (2001), Tables 7 and 8. Data from the 1997 National Survey of America’s Families, for calendar year 1996. Cited in Iceland (2006).
31
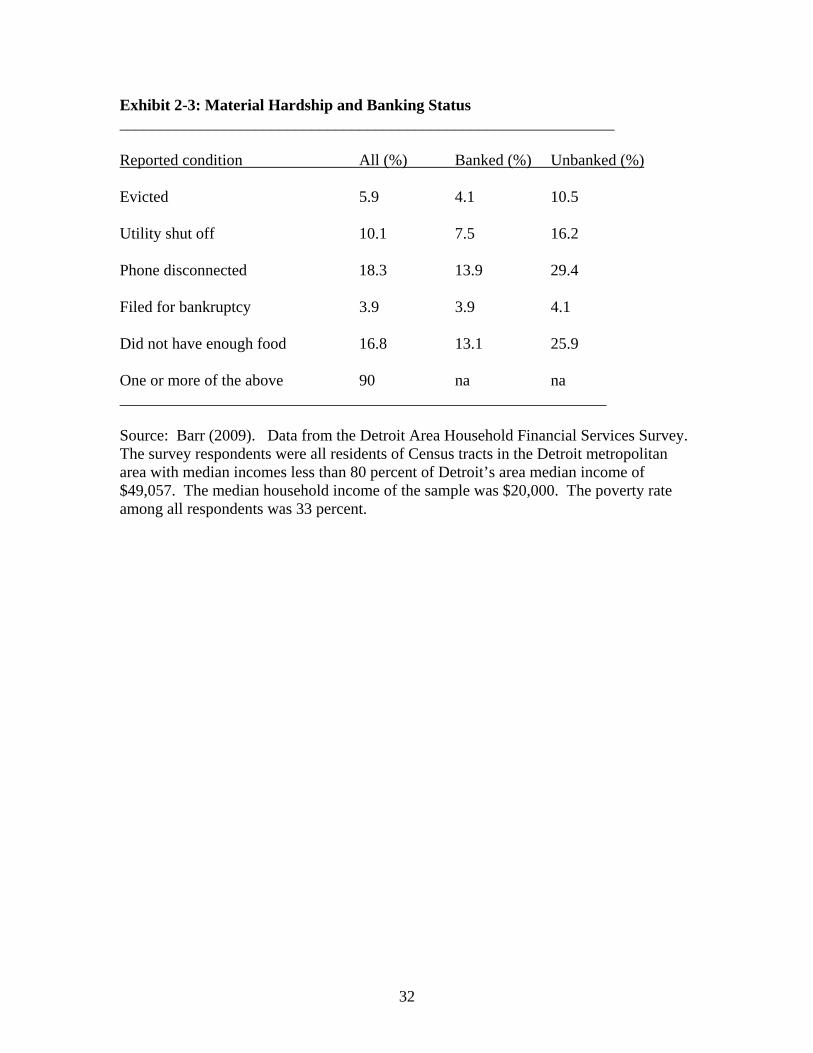
Exhibit 2-3: Material Hardship and Banking Status ______________________________________________________________ Reported condition All (%) Banked (%) Unbanked (%) Evicted 5.9 4.1 10.5 Utility shut off 10.1 7.5 16.2 Phone disconnected 18.3 13.9 29.4 Filed for bankruptcy 3.9 3.9 4.1 Did not have enough food 16.8 13.1 25.9 One or more of the above 90 na na _____________________________________________________________ Source: Barr (2009). Data from the Detroit Area Household Financial Services Survey. The survey respondents were all residents of Census tracts in the Detroit metropolitan area with median incomes less than 80 percent of Detroit’s area median income of $49,057. The median household income of the sample was $20,000. The poverty rate among all respondents was 33 percent.
32

Exhibit 3-1: Desired Amount of Savings for Emergencies Percentile of usual Median of ratio of desiredfamily income Median desired amount amount to usual income "How much do you and your family need to have in savings for anticipated emergencies and other things that may come up?" Lowest quintile $2,000 14.0%($0 to $20,600) Second quintile $3,000 9.7%($20,600 to $36,499) Middle quintile $5,000 9.4%($36,499 to $59,599) Fourth quintile $5,000 7.6%($59,600 to $98,199) Second-highest decile $10,000 8.1%($98,200 to $140,899) Highest decile $20,000 8.8%($140,900 and over) Source: Bucks, Kinneckell, Mach, and Moore 2009), p. A10.
33

Exhibit 3-2: Families with Savings Accounts or Money Market Deposit Accounts Percentile of usual Percentage of families Median value of holdings,family income with accounts for families with accounts Lowest quintile 32.9% $1,000($0 to $20,600) Second quintile 48.3% $1,500($20,600 to $36,499) Middle quintile 59.9% $2,500($36,499 to $59,599) Fourth quintile 67.0% $5,000($59,600 to $98,199) Second-highest decile 77.4% $10,000($98,200 to $140,899) Highest decile 85.5% $30,000($140,900 and over) Source: Montalto (2010), 2007 Survey of Consumer Finances.
34
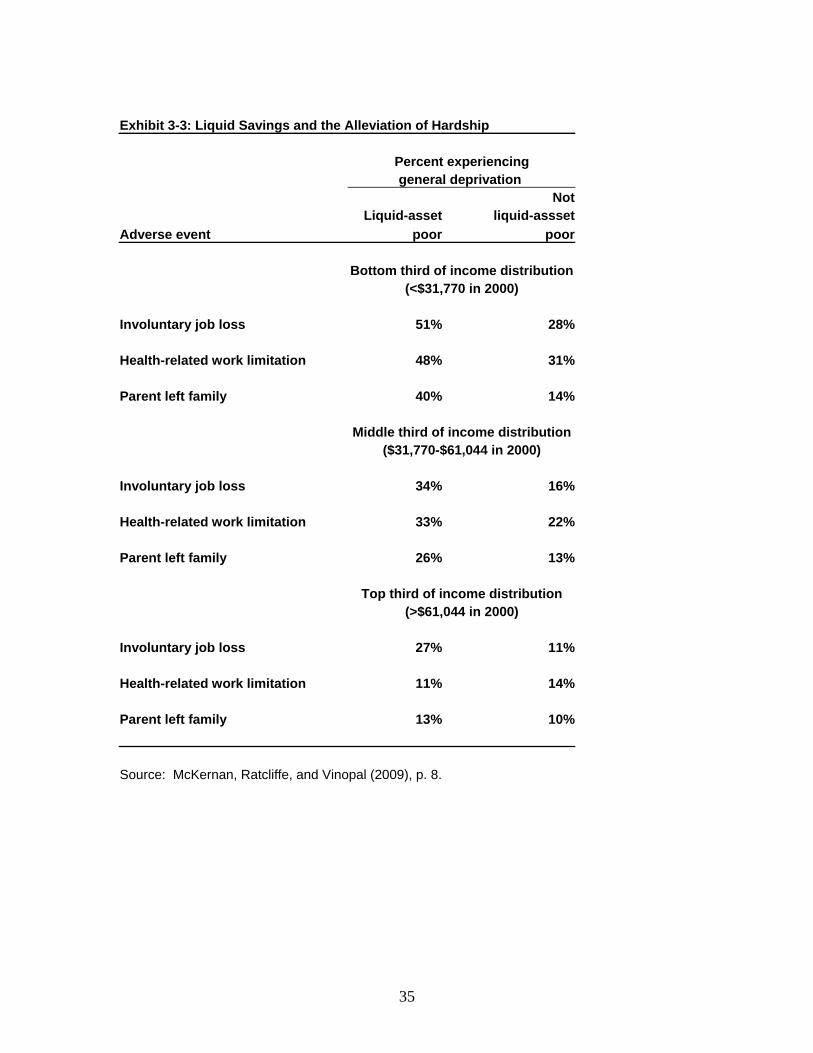
Exhibit 3-3: Liquid Savings and the Alleviation of Hardship Percent experiencing general deprivation Not Liquid-asset liquid-assset
Adverse event poor poor Bottom third of income distribution (<$31,770 in 2000) Involuntary job loss 51% 28% Health-related work limitation 48% 31% Parent left family 40% 14% Middle third of income distribution ($31,770-$61,044 in 2000) Involuntary job loss 34% 16% Health-related work limitation 33% 22% Parent left family 26% 13% Top third of income distribution (>$61,044 in 2000) Involuntary job loss 27% 11% Health-related work limitation 11% 14% Parent left family 13% 10%
Source: McKernan, Ratcliffe, and Vinopal (2009), p. 8.
35
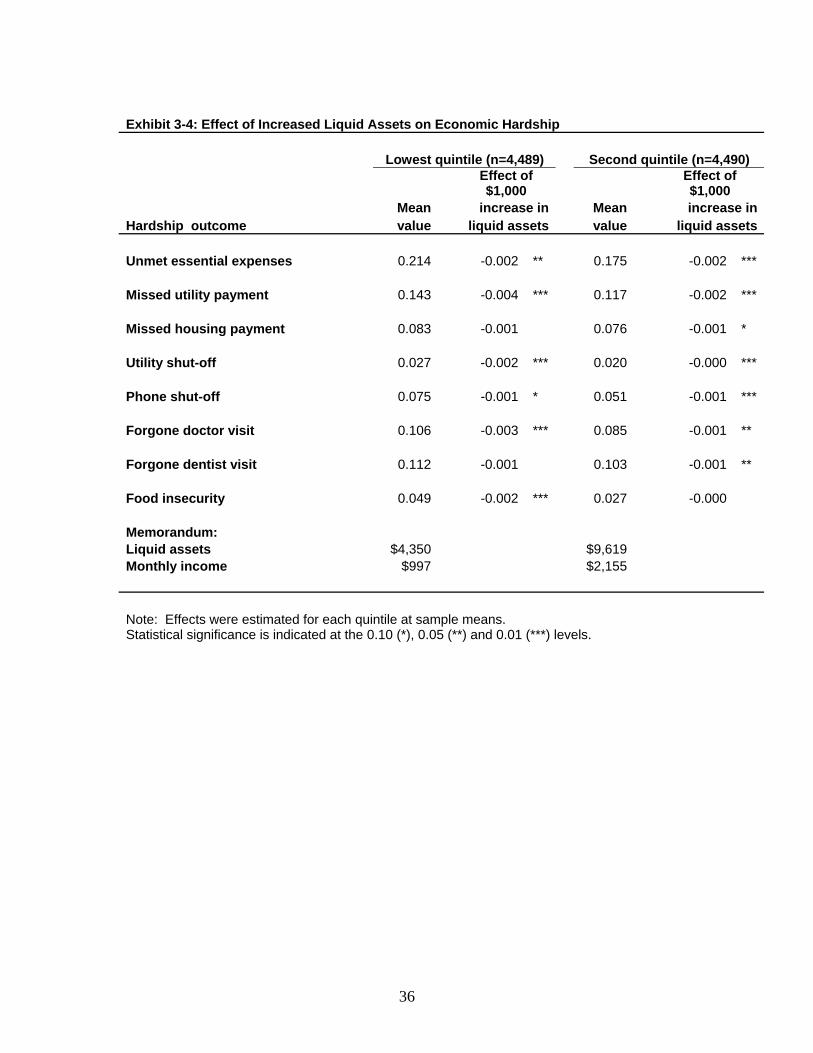
Exhibit 3-4: Effect of Increased Liquid Assets on Economic Hardship Lowest quintile (n=4,489) Second quintile (n=4,490)
Effect of $1,000
Effect of $1,000
Mean increase in Mean increase in Hardship outcome value liquid assets value liquid assets Unmet essential expenses 0.214 -0.002 ** 0.175 -0.002 *** Missed utility payment 0.143 -0.004 *** 0.117 -0.002 *** Missed housing payment 0.083 -0.001 0.076 -0.001 * Utility shut-off 0.027 -0.002 *** 0.020 -0.000 *** Phone shut-off 0.075 -0.001 * 0.051 -0.001 *** Forgone doctor visit 0.106 -0.003 *** 0.085 -0.001 ** Forgone dentist visit 0.112 -0.001 0.103 -0.001 ** Food insecurity 0.049 -0.002 *** 0.027 -0.000 Memorandum: Liquid assets $4,350 $9,619 Monthly income $997 $2,155 Note: Effects were estimated for each quintile at sample means. Statistical significance is indicated at the 0.10 (*), 0.05 (**) and 0.01 (***) levels.
36

Exhibit 3-5: Income Mobility for High and Low Savers Income quartile Income quartile in 2003-2005
in 1984-89 Bottom Second Third Top Total Percentage distribution, for high savers in 1984-89 Bottom 45 35 16 4 100 Second 17 37 30 17 100 Third 13 21 35 31 100 Top 6 11 21 63 100 Percentage distribution, for low savers in 1984-89 Bottom 66 25 7 2 100 Second 34 30 25 11 100 Third 13 20 33 34 100 Top 7 15 19 60 100 Source: Cooper and Luengo-Prado (2009).
37

Exhibit 5-1: Budgeting and Savings Habits Amount of emergency savings:
Characteristic Less than $500 $500 or more Low-income households (less than $25,000 in annual income) Had a spending plan with goals 34% 88% Had a savings plan with goals 11% 63% Had a spending plan that allowed 4% 56%meeting the savings goals Outside of work, saved 12% 54%automatically through pre-authorized transfers from checking Memorandum: Distribution of households 64% 36% Moderate-income households ($25,000 to $50,000 in annual income) Had a spending plan with goals 50% 78% Had a savings plan with goals 21% 61% Had a spending plan that allowed 10% 48%meeting the savings goals Outside of work, saved 16% 46%automatically through pre-authorized transfers from checking Memorandum: Distribution of households 38% 62% Source: Brobeck (2008). In all rows, differences are statistically significant at the 0.05 level.
38

Exhibit 6-1: Characteristics of Pilot Test Participants Sample countCharacteristic Response (n=20) Age (2009 - year of birth) 18 to 29 7 30 to 39 7 40 to 49 4 50 and over 2 Country of birth U.S. 19 Other 1 Gender Male 7 Female 13 Current marital status Married, living with spouse 3 Living with partner or significant other 3 Divorced 1 Married, but separated 3 Widowed 2 Single, never married 8 Race/ethnicity Black Hispanic 0 Black Non-Hispanic 1 White Hispanic 13 White Non-Hispanic 3 Asian 0 American Indian or Alaskan Native 1 Hawaiian or Pacific Islander 0 Other (including multi-racial) 2 Language usually spoken at home English 15 English and Spanish 5 Children living at home with you 0 5 1 6 2 6 More than 2 3 Current housing situation Own one's own home 3 Rent one's own home or apartment 11 Live with others, pay no rent 0 Live with others, contribute to rent 3 Live in public housing, pay no rent 0 Live in public housing, pay rent 1 Live in home/apartment using Sec. 8 voucher 2
39
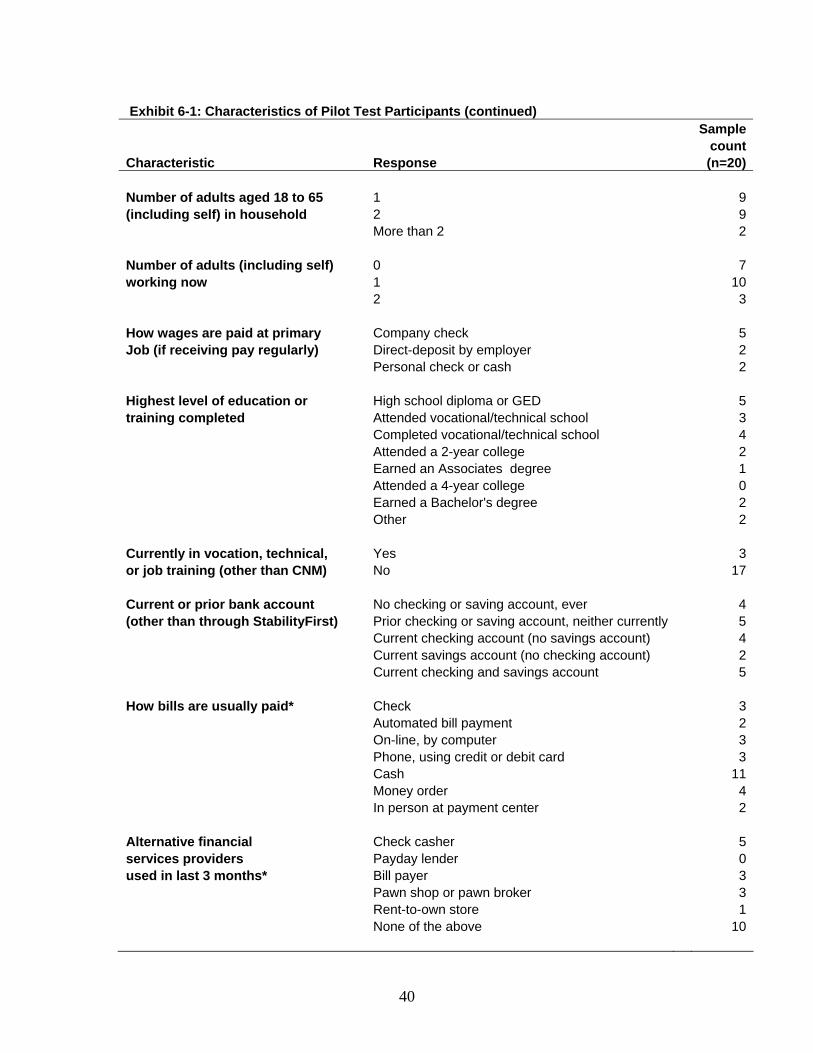
Exhibit 6-1: Characteristics of Pilot Test Participants (continued) Sample countCharacteristic Response (n=20) Number of adults aged 18 to 65 1 9(including self) in household 2 9 More than 2 2 Number of adults (including self) 0 7working now 1 10 2 3 How wages are paid at primary Company check 5Job (if receiving pay regularly) Direct-deposit by employer 2 Personal check or cash 2 Highest level of education or High school diploma or GED 5training completed Attended vocational/technical school 3 Completed vocational/technical school 4 Attended a 2-year college 2 Earned an Associates degree 1 Attended a 4-year college 0 Earned a Bachelor's degree 2 Other 2 Currently in vocation, technical, Yes 3or job training (other than CNM) No 17 Current or prior bank account No checking or saving account, ever 4(other than through StabilityFirst) Prior checking or saving account, neither currently 5 Current checking account (no savings account) 4 Current savings account (no checking account) 2 Current checking and savings account 5 How bills are usually paid* Check 3 Automated bill payment 2 On-line, by computer 3 Phone, using credit or debit card 3 Cash 11 Money order 4 In person at payment center 2 Alternative financial Check casher 5services providers Payday lender 0used in last 3 months* Bill payer 3 Pawn shop or pawn broker 3 Rent-to-own store 1 None of the above 10
40
41
Exhibit 6-1: Characteristics of Pilot Test Participants (continued) Sample countCharacteristic Response (n=20) Financial hardship in your household Lost job 7in last 3 months* Work hours reduced 5 Major illness or medical expense 4 Car or home repairs 10 Breakdown in child care arrangements 2 Number of months (of last 3) in which Three months 8income covered expenses Two months 4 One months 3 None 3 Other (refused, don't know) 2 How often do you worry about being able 1 to 3 4to meet normal monthly living expenses? 4 to 7 9(1=never, 10=all the time) 8 to 10 7 *Includes multiple responses.