Embed Size (px)
Citation preview

P1: FRD
April 18, 2000 17:41 Annual Reviews AR097-09
?Annu. Rev. Polit. Sci. 2000. 3:183–219
Copyrightc© 2000 by Annual Reviews. All rights reserved
ECONOMIC DETERMINANTS
OF ELECTORAL OUTCOMES
Michael S. Lewis-BeckDept. of Political Science, University of Iowa, Iowa City, Iowa 52242;e-mail: [email protected]
Mary StegmaierDept. of Government and Foreign Affairs, University of Virginia, Charlottesville,Virginia 22901; e-mail: [email protected]
■ Abstract Economic conditions shape election outcomes in the world’s democra-cies. Good times keep parties in office, bad times cast them out. This proposition isrobust, as the voluminous body of research reviewed here demonstrates. The strongfindings at the macro level are founded on the economic voter, who holds the govern-ment responsible for economic performance, rewarding or punishing it at the ballotbox. Although voters do not look exclusively at economic issues, they generally weighthose more heavily than any others, regardless of the democracy they vote in.
INTRODUCTION
In his pivotal book,Political Control of the Economy, Tufte (1978:65) articulatedwhat he called a basic principle:
When you think economics, think elections;When you think elections, think economics.
More than 20 years have passed since this axiom was articulated. Is it true? Inparticular, is economics the driving force behind electoral outcomes in democra-cies? And, if so, how does it work? These are the leading questions this essayattempts to answer by distilling the research literature. [For earlier literature re-views, see Monroe (1984), Kiewiet & Rivers (1985), Lewis-Beck (1988:chs. 2 and3), Schneider & Frey (1988), Nannestad & Paldam (1994), Anderson (1995:ch. 3),Norpoth (1996a).] The task is not simple. The flow of scholarly papers on the topichas changed from a trickle to a torrent of over 300 articles and books on economicsand elections. What holds this disparate collection of publications together is theirtests of the economic voter hypothesis. In its elementary reward-punishment ver-sion, that hypothesis may be stated as follows: The citizen votes for the governmentif the economy is doing all right; otherwise, the vote is against. The inspirationfor the hypothesis, now widespread in the scholarly literature, comes from Key
1094-2939/00/0623-0183$14.00 183
Ann
u. R
ev. P
olit.
Sci
. 200
0.3:
183-
219.
Dow
nloa
ded
from
arj
ourn
als.
annu
alre
view
s.or
gby
Uni
vers
ity o
f A
rizo
na L
ibra
ry o
n 01
/10/
09. F
or p
erso
nal u
se o
nly.
P1: FRD
April 18, 2000 17:41 Annual Reviews AR097-09
?184 LEWIS-BECK ¥ STEGMAIER
(1964:568). In the press, economic voting is routinely used as a sweeping expla-nation of electoral outcomes. For example,New York Timesjournalists concludedthat in the 1992 US presidential race, “More than any other issue, the economywas Bill Clinton’s ticket to the presidency” (Rosenbaum & Lohr 1996).
The research at hand tests this claim from every possible angle. Fortunately,economics and elections is a subfield of political science (and economics) wheremuch has been learned. Increasingly refined tools of theory and method have beensuccessfully applied to ever richer data bases.
We divide this presentation into four sections. The first section considers UnitedStates elections, since they have been the most extensively investigated. Presi-dential support is examined first, then congressional. Methodological issues arediscussed at appropriate points and, ultimately, generalizations are offered aboutthe impact of economics on the American voter. The second section explores acomparative example, the French presidential and National Assembly elections.The comparison is especially useful because French elections exhibit institutionaldifferences that highlight the conditional aspects of economic voting. The thirdsection reviews the findings of selected other nations that have been fairly heavilyresearched, Britain and Denmark in particular. The fourth section is truly com-parative, evaluating the studies that have examined economic voting in a sampleof nations, rather than in one nation alone. Finally, we draw conclusions about theplace of economics in democratic voting models.
THE MOST STUDIED NATION: The United States
By far, there are more economic voting studies on the United States than on anyother country. Therefore, we begin with that case, which in some ways definesthe lines of debate for work elsewhere. We look first at presidential popularity andvote functions, then examine individual-level survey data on presidential voting.After that,we turn to congressional vote functions and survey data on House ofRepresentative elections.
US Presidential Popularity Functions
There are two streams of work treating economic influences on US presiden-tial elections, vote functions and popularity functions. [Nannestad & Paldam(1994:213) call these “VP-functions.”)] In popularity functions, the dependentvariable is job approval rating from a public opinion poll, and in vote functions itis vote choice itself.
The earliest research on popularity functions was by Mueller (1970, 1973),and, at least conceptually, it continues to shape current efforts. Data are aggregatetime series gathered over the post–World War II period. The percentage of thepublic approving of how the president is handling his job, according to a Galluppoll, is the variable to be explained. The independent variables, besides the econ-omy, are war, political scandal, international crisis, and term cycles. Examples ofsuch a model in appear in Table 1. These efforts by Norpoth (1985:179) and Beck
Ann
u. R
ev. P
olit.
Sci
. 200
0.3:
183-
219.
Dow
nloa
ded
from
arj
ourn
als.
annu
alre
view
s.or
gby
Uni
vers
ity o
f A
rizo
na L
ibra
ry o
n 01
/10/
09. F
or p
erso
nal u
se o
nly.

P1: FRD
April 18, 2000 17:41 Annual Reviews AR097-09
?ECONOMIC DETERMINANTS OF ELECTORAL OUTCOMES 185
TABLE 1 Earlier examples of US popularity functions
Variable (1)a (2)b (3)c
Popularity lagged 0.84∗ 0.89∗
Food inflation −0.49∗ −0.26∗
Inflation −139.33
Inflation lagged −306.42∗
Unemployment 0.93
Unemployment change −2.76∗ −1.65∗
Vietnam 0.97∗ −0.41 −1.12
Watergate −2.96∗ −2.64 −1.85
Rally around the flag 2.54∗
Inauguration 19.95∗
Term dummies
Kennedy 14.46∗ 13.86∗
Johnson 18.43∗ 20.93∗
Nixon 18.46∗ 15.07∗
Ford 33.86∗ 22.90∗
Carter 18.15∗ 17.41∗
Reagan 22.17∗ 15.93∗
Constant −1.32∗ 10.07∗ 7.02∗
Random MA(2) 0.37∗
R-squared 0.88 0.90
Adjusted R-squared 0.69
Degrees of freedom 121 388
N 80
∗ =Statistical significance at 0.05 one-tail, or better.a(1) Quarterly presidential popularity, 1961:1–1980:4 (from the monthly Gallup Poll percent-age who approve of how the current president is handling his job), differenced and predictedfrom differenced economic variables (inflation, inflation lagged one quarter, unemployment)and dummies for the Vietnam War, Watergate, the rally-around-the-flag effect, inauguration,and presidential term, with ARIMA (autoregressive integrated moving averages) transferfunction estimation (Norpoth 1985:179).b(2) Quarterly presidential popularity, 1953:2–1986:2 (from the monthly Gallup Poll), pre-dicted from its lagged value, contemporaneous economic variables (inflation of food prices,change in the unemployment rate), a Vietnam variable (number of soldiers killed), and dum-mies for Watergate and each new administration, with OLS (ordinary least squares) estimation(Beck 1991:94).c(3) Monthly presidential popularity, 1953:3–1986:6, with the same independent variablesand OLS estimation as in column 2 (Beck 1991:94).
Ann
u. R
ev. P
olit.
Sci
. 200
0.3:
183-
219.
Dow
nloa
ded
from
arj
ourn
als.
annu
alre
view
s.or
gby
Uni
vers
ity o
f A
rizo
na L
ibra
ry o
n 01
/10/
09. F
or p
erso
nal u
se o
nly.

P1: FRD
April 18, 2000 17:41 Annual Reviews AR097-09
?186 LEWIS-BECK ¥ STEGMAIER
(1991:94) are representative of the first wave of US popularity function estimation(Frey & Schneider 1978a, Kernell 1978, Monroe 1978, Golden & Poterba 1977,Kenski 1980, Hibbs et al 1982). Fairly long time series (monthly or quarterly)on presidential approval (invariably Gallup ratings) were predicted from a fewmacroeconomic indicators (unemployment, income, gross national product, infla-tion) and several political variables (almost always measured with dummies). Animportant conclusion of these studies was summed up by Norpoth (1985:180) asfollows: “There can be little doubt that the economy matters for presidential pop-ularity.” However, beyond that generalization, much remained unsettled. Whateconomic variables count? What is the lag structure? The estimates of Table 1illustrate these concerns. In column 1, unemployment has no statistically signi-ficant effect, whereas in column 2 it does. In column 1, inflation has no statisti-cally significant contemporaneous effect, only a significant lagged effect. But incolumn 2, the statistically significant inflation effect is lagged. In column 3, thespecification is the same as in column 2, but the analysis is on monthly rather thanquarterly data. The inflation and unemployment effects are again significant andthe magnitudes are naturally reduced (although by about one half rather than onethird, which raises the interesting question of the proper level of aggregation).
Despite the lack of resolution, the search for the preferred macroeconomicindicators, and their lagged effects pattern, has been largely abandoned. In thesecond wave of popularity function work, objective economic measures havebeen replaced with subjective ones. The models now contain aggregate perceptualevaluations of general economic performance instead of hard data on unemploy-ment, inflation, income, or growth. A summary of responses from two types ofquestions, such as these posed by the Michigan Survey of Consumer Attitudes andBehavior since the 1960s, are most often used.
Q1. Would you say that at the present time business conditions are better orworse than a year ago?
Q2. [H]ow about a year from now, do you expect that in the country as awhole business conditions will be better, or worse than they are at present, orjust about the same?
The first item is retrospective, asking the respondent to assess the performance ofthe national economy over the past year. The second item again asks for a nationaleconomic assessment, but over the forthcoming year, so it is prospective. The itemshave certain advantages. First, their responses appear to combine and weigh allthe objective macroeconomic measures. For example, if 60% of respondents saybusiness conditions are better and only 20% say they are worse, then on balance theoverall economy looks good that year (60− 20 = + 40). Second, assuming thatvoters respond to their interpretation of the economy rather than to its objectivecondition, the economic effects on the vote might be more strongly and moreaccurately recorded (but see Kramer 1983). Third, the presence of a prospectiveas well as a retrospective measure facilitates the testing of whether economic votersare sophisticated or naive. Chappell & Keech (1985, 1991) have argued that voters
Ann
u. R
ev. P
olit.
Sci
. 200
0.3:
183-
219.
Dow
nloa
ded
from
arj
ourn
als.
annu
alre
view
s.or
gby
Uni
vers
ity o
f A
rizo
na L
ibra
ry o
n 01
/10/
09. F
or p
erso
nal u
se o
nly.

P1: FRD
April 18, 2000 17:41 Annual Reviews AR097-09
?ECONOMIC DETERMINANTS OF ELECTORAL OUTCOMES 187
TABLE 2 Later examples of US popularity functions (figures inparentheses are standard errors)
Variable (1)a (2)b (3)c
Political variables † ‡ ‡Popularity lagged 0.81∗ 0.79∗
(0.04) (0.04)
Retrospective business 0.10∗ 0.03(0.03) (0.02)
Prospective business −0.007 0.08∗(0.065) (0.03)
Retrospective personal 0.10(0.07)
Prospective personal 0.11(0.09)
Adjusted R-squared 0.84 0.90 0.91
N 136 141 147
∗ =Statistical significance at 0.05 one-tail, or better.†=Coefficients for political variables in the model not shown: presidential change scored 1for each quarter a fresh president assumes office, 0 otherwise; dummies for the Watergateand Iran-Contra scandals and the Gulf War; a Vietnam variable scored as percentage publicapproval of the war.‡=Coefficients for political variables in the model not shown: dummies for every adminis-tration, Watergate, the Iran hostage incident, and the Gulf War; Vietnam War deaths; countervariables for important events.a(1) Quarterly presidential popularity (Gallup approval percentage), 1960:1—1993:4, pre-dicted from the political variables (†), retrospective business (scored percentage who callbusiness conditions “better” over the last year− percentage who say “worse”), and prospec-tive business (scored percentage who say business conditions will be “better” next year−percentage who say “worse”), estimated with conditional least squares and an AR(1) (firstorder autoreprssive) correction (Norpoth 1996b:783).b(2) Quarterly presidential popularity (Gallup percentage approval), 1954—1996, predictedfrom the political variables (‡), popularity lagged, retrospective business (the same item as incolumn 1, scored on a 200-point scale as a net measure of positive and negative evaluation),and retrospective personal (a net measure of those who reported family finances “better”−those who said “worse”), estimated from OLS. (Erikson et al 2000).c(3) The same variables as in column 2 except for the economic variables, which here areprospective business (a net measure of those who said business conditions in the next 12months would be “good”− those who said “bad”) and prospective personal (a net measure ofthose who said a year from now family finances would be “better”− those who said “worse”).
rate the president according to the economic future his policies will deliver. Incontrast to this sophisticated prospective voter is the naive retrospective voter,who merely judges the president according to the economic performance of theimmediate past. In the terms of MacKuen et al (1992), prospective voters behavemore as bankers, retrospective voters as peasants.
A central controversy in popularity function research today is whether economicvoters are retrospective or prospective. Table 2 reports some illustrative results on
Ann
u. R
ev. P
olit.
Sci
. 200
0.3:
183-
219.
Dow
nloa
ded
from
arj
ourn
als.
annu
alre
view
s.or
gby
Uni
vers
ity o
f A
rizo
na L
ibra
ry o
n 01
/10/
09. F
or p
erso
nal u
se o
nly.

P1: FRD
April 18, 2000 17:41 Annual Reviews AR097-09
?188 LEWIS-BECK ¥ STEGMAIER
this issue. In column 1 are estimates for a Norpoth (1996b:783) model, supportinghis consistent finding of “a substantial influence of retrospective views of theeconomy, but not with any [influence] for economic expectations.” Columns 2and 3, by contrast, show Erikson et al’s (2000) dominant result: “Voters respondin terms of their expectation of the future level of prosperity.” Thus, two leadingscholars, looking at essentially the same data, and following model specificationsthat are conceptually similar, arrive at estimates that yield opposite conclusions.One discovers an exclusively retrospective economic voter, the other an exclusivelyprospective economic voter. To complicate matters further, the middle position—the economic voter is retrospective and prospective in more or less equal amounts—is advocated by Clarke & Stewart (1994), in their own careful analysis of thepresidential approval data.
Why these conflicting results? It is worth recalling the phrase, “God is in thedetails.” Although on the surface the models of Table 2 appear similar, thereare differences. First, the time series cover different periods, 1960–1993 versus1954–1996. Second, the political variables, though conceptually alike, are notmeasured the same way. In column 1, a general dummy stands for an adminstra-tion change, the Vietnam War is tracked in terms of public approval, and there is no“events” or “rally” variable. By way of contrast, column 2 uses specific dummiesfor each administration, tracks the Vietnam War in terms of soldiers killed, andincludes a variable for tracking special “events.” Third, column 1 is estimatedwith Box-Tiao intervention analysis and an AR(1) error correction, whereas col-umn 2 uses a lagged dependent variable on the right-hand side as a control, afterwhich ordinary least squares (OLS) is applied. Fourth, multicollinearity may berendering coefficients unstable, subject to serious change from one specification tothe next. For example, the retrospective item correlates 0.84 with the prospectiveitem “good-bad times next 12 months” (Norpoth 1996b:785). Once these pointsare considered, it is less surprising that differences are observed.
US Presidential Vote Functions
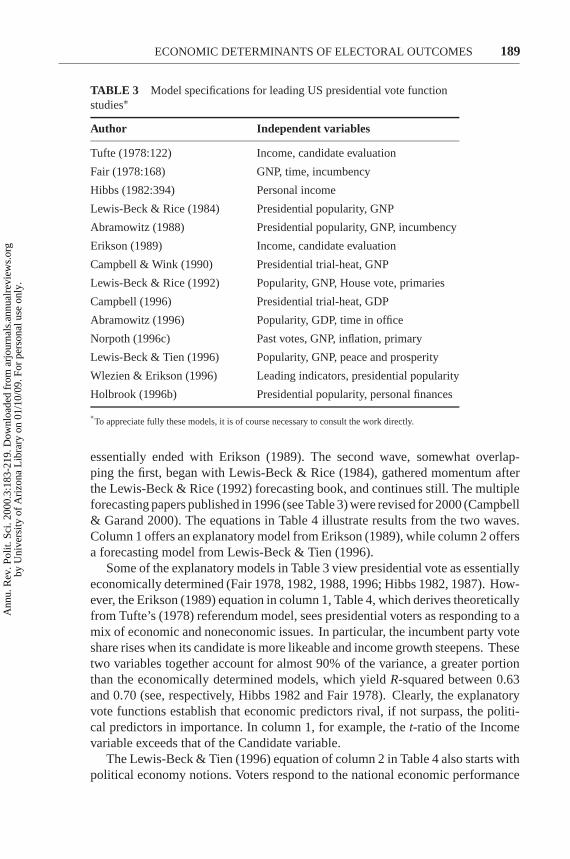
Although scholars have enthusiastically pursued the study of presidential popular-ity functions, some of that enthusiasm seems misplaced, since they fail to measurethe variable of ultimate interest—presidential vote. The plentiful work on votefunctions looks directly at macroeconomic effects on election outcomes, usuallymeasured as the incumbent party share of the two-party popular vote, in an an-nual post–World War II time series. Table 3 summarizes the model specificationsfrom most of the major studies. All are single-equation regression models with nomore than four independent variables. There is invariably an economic measure,usually gross national product (GNP) or gross domestic product (GDP), with a lagstructure that is seldom the same from model to model. Most models contain acandidate evaluation measure, usually presidential popularity itself.
Vote function research has experienced two waves, the first stressing expla-nation, the second stressing forecasting. The first began with Tufte (1978) and
Ann
u. R
ev. P
olit.
Sci
. 200
0.3:
183-
219.
Dow
nloa
ded
from
arj
ourn
als.
annu
alre
view
s.or
gby
Uni
vers
ity o
f A
rizo
na L
ibra
ry o
n 01
/10/
09. F
or p
erso
nal u
se o
nly.
P1: FRD
April 18, 2000 17:41 Annual Reviews AR097-09
?ECONOMIC DETERMINANTS OF ELECTORAL OUTCOMES 189
TABLE 3 Model specifications for leading US presidential vote functionstudies∗
Author Independent variables
Tufte (1978:122) Income, candidate evaluation
Fair (1978:168) GNP, time, incumbency
Hibbs (1982:394) Personal income
Lewis-Beck & Rice (1984) Presidential popularity, GNP
Abramowitz (1988) Presidential popularity, GNP, incumbency
Erikson (1989) Income, candidate evaluation
Campbell & Wink (1990) Presidential trial-heat, GNP
Lewis-Beck & Rice (1992) Popularity, GNP, House vote, primaries
Campbell (1996) Presidential trial-heat, GDP
Abramowitz (1996) Popularity, GDP, time in office
Norpoth (1996c) Past votes, GNP, inflation, primary
Lewis-Beck & Tien (1996) Popularity, GNP, peace and prosperity
Wlezien & Erikson (1996) Leading indicators, presidential popularity
Holbrook (1996b) Presidential popularity, personal finances
∗To appreciate fully these models, it is of course necessary to consult the work directly.
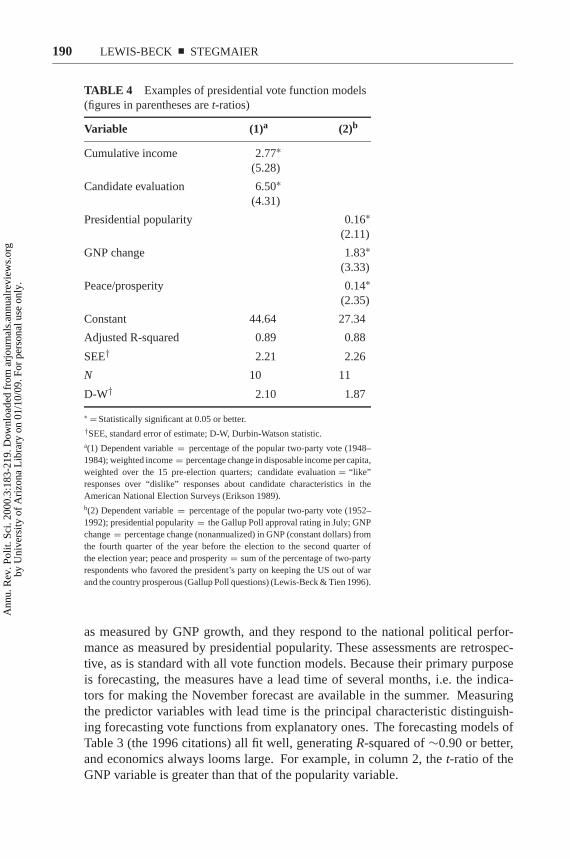
essentially ended with Erikson (1989). The second wave, somewhat overlap-ping the first, began with Lewis-Beck & Rice (1984), gathered momentum afterthe Lewis-Beck & Rice (1992) forecasting book, and continues still. The multipleforecasting papers published in 1996 (see Table 3) were revised for 2000 (Campbell& Garand 2000). The equations in Table 4 illustrate results from the two waves.Column 1 offers an explanatory model from Erikson (1989), while column 2 offersa forecasting model from Lewis-Beck & Tien (1996).
Some of the explanatory models in Table 3 view presidential vote as essentiallyeconomically determined (Fair 1978, 1982, 1988, 1996; Hibbs 1982, 1987). How-ever, the Erikson (1989) equation in column 1, Table 4, which derives theoreticallyfrom Tufte’s (1978) referendum model, sees presidential voters as responding to amix of economic and noneconomic issues. In particular, the incumbent party voteshare rises when its candidate is more likeable and income growth steepens. Thesetwo variables together account for almost 90% of the variance, a greater portionthan the economically determined models, which yieldR-squared between 0.63and 0.70 (see, respectively, Hibbs 1982 and Fair 1978). Clearly, the explanatoryvote functions establish that economic predictors rival, if not surpass, the politi-cal predictors in importance. In column 1, for example, thet-ratio of the Incomevariable exceeds that of the Candidate variable.
The Lewis-Beck & Tien (1996) equation of column 2 in Table 4 also starts withpolitical economy notions. Voters respond to the national economic performance
Ann
u. R
ev. P
olit.
Sci
. 200
0.3:
183-
219.
Dow
nloa
ded
from
arj
ourn
als.
annu
alre
view
s.or
gby
Uni
vers
ity o
f A
rizo
na L
ibra
ry o
n 01
/10/
09. F
or p
erso
nal u
se o
nly.
P1: FRD
April 18, 2000 17:41 Annual Reviews AR097-09
?190 LEWIS-BECK ¥ STEGMAIER
TABLE 4 Examples of presidential vote function models(figures in parentheses aret-ratios)
Variable (1)a (2)b
Cumulative income 2.77∗(5.28)
Candidate evaluation 6.50∗(4.31)
Presidential popularity 0.16∗(2.11)
GNP change 1.83∗(3.33)
Peace/prosperity 0.14∗(2.35)
Constant 44.64 27.34
Adjusted R-squared 0.89 0.88
SEE† 2.21 2.26
N 10 11
D-W† 2.10 1.87
∗ =Statistically significant at 0.05 or better.†SEE, standard error of estimate; D-W, Durbin-Watson statistic.a(1) Dependent variable= percentage of the popular two-party vote (1948–1984); weighted income= percentage change in disposable income per capita,weighted over the 15 pre-election quarters; candidate evaluation= “like”responses over “dislike” responses about candidate characteristics in theAmerican National Election Surveys (Erikson 1989).b(2) Dependent variable= percentage of the popular two-party vote (1952–1992); presidential popularity= the Gallup Poll approval rating in July; GNPchange= percentage change (nonannualized) in GNP (constant dollars) fromthe fourth quarter of the year before the election to the second quarter ofthe election year; peace and prosperity= sum of the percentage of two-partyrespondents who favored the president’s party on keeping the US out of warand the country prosperous (Gallup Poll questions) (Lewis-Beck & Tien 1996).
as measured by GNP growth, and they respond to the national political perfor-mance as measured by presidential popularity. These assessments are retrospec-tive, as is standard with all vote function models. Because their primary purposeis forecasting, the measures have a lead time of several months, i.e. the indica-tors for making the November forecast are available in the summer. Measuringthe predictor variables with lead time is the principal characteristic distinguish-ing forecasting vote functions from explanatory ones. The forecasting models ofTable 3 (the 1996 citations) all fit well, generatingR-squared of∼0.90 or better,and economics always looms large. For example, in column 2, thet-ratio of theGNP variable is greater than that of the popularity variable.
Ann
u. R
ev. P
olit.
Sci
. 200
0.3:
183-
219.
Dow
nloa
ded
from
arj
ourn
als.
annu
alre
view
s.or
gby
Uni
vers
ity o
f A
rizo
na L
ibra
ry o
n 01
/10/
09. F
or p
erso
nal u
se o
nly.
P1: FRD
April 18, 2000 17:41 Annual Reviews AR097-09
?ECONOMIC DETERMINANTS OF ELECTORAL OUTCOMES 191
The model of column 2, in addition, uses both prospective (prosperity as-sessment) and retrospective (GNP) economic factors. Uniquely, it gives evidencethat presidential voters look to the future—which party is more likely to bringprosperity—as well as the economic past. This finding bears on a developingstrand of work concerning the “rationality” of economic voting in presidentialelections. Are presidential voters naively retrospective, evaluating election-yeareconomic growth, or do they prospectively “focus only on that portion of growthlikely to persist after the election” (Alesina et al 1993:14)? From their own analy-sis, these researchers rejected the rational choice idea, concluding that “the effectsof the economy on voting are consistent with naive retrospective voting” (Alesinaet al 1993:26). However, Suzuki & Chappell (1996:235), on the basis of their votefunction, could not reject the rational voter view. They claimed that presidentialvoting behavior reveals “marginal voters’ awareness of economic constraints andthe implications of vote choices for their long-term economic well-being.”
US Presidential Election Surveys
Although virtually all the vote function investigations suggest strong economicvoting effects, this is merely an inference from aggregates to individuals. Untilvoters themselves are examined directly, and economic evaluations linked tochoice, the impressive time series results are open to the charge of ecologicalfallacy. In terms of theory, how might American voters translate the economy intoa vote? The pioneering work of Key (1966:61) provides a guiding perspective:“The patterns of flow of the major streams of shifting voters graphically reflect theelectorate in its great, and perhaps principal, role as an appraiser of past events,past performance, and past actions. It judges retrospectively.” Applying the Keyargument, Fiorina (1978, 1981:26) came up with the retrospective economic voterhypothesis of “an electorate that treats elections ... as referenda on the incumbentadministration’s handling of the economy.”
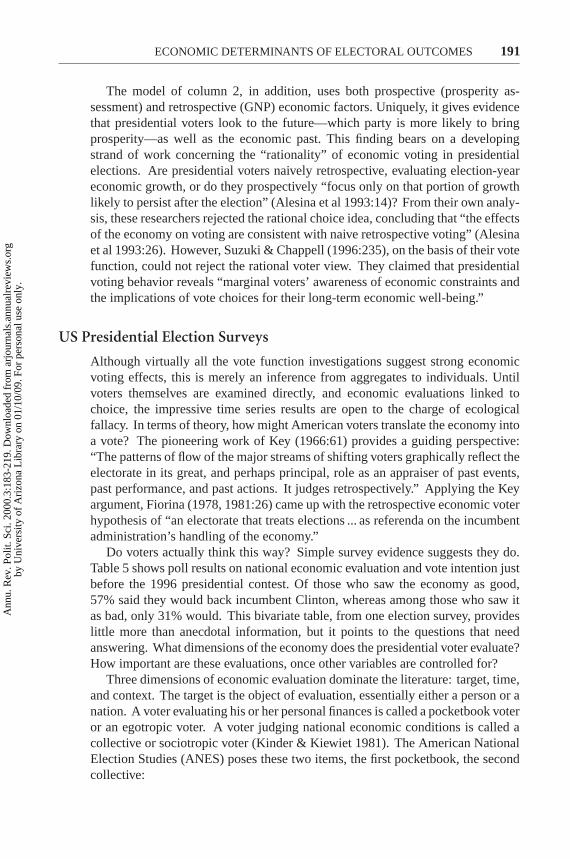
Do voters actually think this way? Simple survey evidence suggests they do.Table 5 shows poll results on national economic evaluation and vote intention justbefore the 1996 presidential contest. Of those who saw the economy as good,57% said they would back incumbent Clinton, whereas among those who saw itas bad, only 31% would. This bivariate table, from one election survey, provideslittle more than anecdotal information, but it points to the questions that needanswering. What dimensions of the economy does the presidential voter evaluate?How important are these evaluations, once other variables are controlled for?
Three dimensions of economic evaluation dominate the literature: target, time,and context. The target is the object of evaluation, essentially either a person or anation. A voter evaluating his or her personal finances is called a pocketbook voteror an egotropic voter. A voter judging national economic conditions is called acollective or sociotropic voter (Kinder & Kiewiet 1981). The American NationalElection Studies (ANES) poses these two items, the first pocketbook, the secondcollective:
Ann
u. R
ev. P
olit.
Sci
. 200
0.3:
183-
219.
Dow
nloa
ded
from
arj
ourn
als.
annu
alre
view
s.or
gby
Uni
vers
ity o
f A
rizo
na L
ibra
ry o
n 01
/10/
09. F
or p
erso
nal u
se o
nly.

P1: FRD
April 18, 2000 17:41 Annual Reviews AR097-09
?192 LEWIS-BECK ¥ STEGMAIER
TABLE 5 National economic assessment and voteintention, September 1996∗
Candidate National economy National economyPreference good (%) bad (%)
Clinton 57 31
Dole 30 50
Perot 5 8
Other 8 11response
Column 100 100percent
∗TotalN = 1281. Respondents were asked to evaluate the national economy
as “good” or “bad” and to state their candidate preference. These data areassembled from theNew York Times/CBS News Polltaken September 2–4,1996 (New York Times1996).
During the last few years has your financial situation been getting better,getting worse, or has it stayed the same?
Would you say that at present business conditions are better or worse thanthey were a year ago?
The time dimension refers to whether the voter is looking at the economic pastor the economic future. The above items point the respondent to “the last fewyears” or “a year ago.” Therefore, they are backward looking, or retrospective.If instead they asked about the next few years or the coming year, they would beforward looking, or prospective. The third dimension, context, considers whetherthe economic target is explicitly linked to policy (Lewis-Beck 1988:39; see alsoFiorina 1981:8081). For example, the second item changes from a simple to acomplex context with the addition of the parenthetical phrase: “Would you saythat at present [government policy is making] business conditions better or worsethan they were a year ago?”
There are other dimensions, but these three—target, time, and context—haveproduced the biggest yield, almost exclusively from the ANES data. Therefore,we focus on these findings. In the first phase of this work, the central issue con-cerned pocketbook versus sociotropic effects. In Table 6 are illustrative equationsestimated for the 1976 presidential election. The model of column 1 explores, in apreliminary way, the effect of central retrospective economic evaluations (Fiorina1981:40). The model of column 2, by Kiewiet (1983:98), offers a more extensivespecification, including controls on party identification and a host of economicissues (most of which are not shown because they failed to achieve statisticalsignificance). The pocketbook variable, “financial situation,” consistently fails toreach a conventional level of statistical significance. The only significant personal
Ann
u. R
ev. P
olit.
Sci
. 200
0.3:
183-
219.
Dow
nloa
ded
from
arj
ourn
als.
annu
alre
view
s.or
gby
Uni
vers
ity o
f A
rizo
na L
ibra
ry o
n 01
/10/
09. F
or p
erso
nal u
se o
nly.

P1: FRD
April 18, 2000 17:41 Annual Reviews AR097-09
?ECONOMIC DETERMINANTS OF ELECTORAL OUTCOMES 193
TABLE 6 Pocketbook vs sociotropic economic voting in the1976 election
(1)a (2)b
Financial situationsame −0.03better −0.06 −0.02worse −0.19
Head of household not 0.21†
unemployed
Business conditionssame −0.08better 0.35‡ 0.53‡
worse −0.15
Government inflation policyfair 0.07good 0.42‡
Government unemployment policyfair 0.21†
good 0.21
Approve of Ford 1.39‡
Approve Nixon pardon 0.85‡
Civil rightstoo fast 0.19†
too slow −0.43†
Republican 0.67‡
Democrat −0.73‡
Percent correctly predicted 80.1
Pseudo-R-squared 0.40
N 1379 923
†p< 0.05.‡p< 0.01.a(1) The dependent variable is dichtomous (1= Ford, 0= Carter). The coding of theindependent variables, all from the 1976 ANES, is described in Fiorina (1981:36–40).The estimation procedure is probit.b(2) The dependent variable, the data source, and the estimation procedure are thesame as in column 1. The coding of the independent variables is described by Kiewiet(1983:95–99). The following independent variables were included in the anal-ysis but are not in the table because they failed to reach statistical significance: the“personal economic experiences” variables of inflation, declining income, unemploy-ment, taxes, and general economic problems; the “national economic assessments”variables of inflation, taxes, more government programs, less government spending,and general economic problems.
Ann
u. R
ev. P
olit.
Sci
. 200
0.3:
183-
219.
Dow
nloa
ded
from
arj
ourn
als.
annu
alre
view
s.or
gby
Uni
vers
ity o
f A
rizo
na L
ibra
ry o
n 01
/10/
09. F
or p
erso
nal u
se o
nly.

P1: FRD
April 18, 2000 17:41 Annual Reviews AR097-09
?194 LEWIS-BECK ¥ STEGMAIER
economic effect depends on whether the head of the respondent’s household isemployed (“head not unemployed” in column 2).
These results typify the literature, which concludes that in US presidentialelections, there is little pocketbook voting. Kiewiet (1983:35) concluded that, ingeneral, the probability of a presidential incumbent vote shifts only 13% even ifall economic opinion moves from “worse than a year ago” to “better than a yearago.” A pooled survey analysis arrived at a comparable estimate of rather faintpocketbook effects (Markus 1988). By contrast, sociotropic voting is relativelystrong. According to column 1 of Table 6, favorable judgments of governmentpolicies on unemployment and inflation heightened the likelihood of a vote for theincumbent president. Furthermore, as shown in both columns 1 and 2, when voterssee that general business conditions have improved, they are more likely to supportthe incumbent. In conclusion, Kiewiet (1983:99) remarked that sociotropic factorsseem to have had an impressive effect on voting decisions.
Generally speaking, in US presidential elections, sociotropic evaluations arefound, and they are unambiguously stronger than the pocketbook evaluations(Kinder & Kiewiet 1979, 1981). In his seminal book, Kiewiet (1983) reinforcedthis judgment, based on his analyses of presidential elections from 1960 to 1980.Subsequent studies of more recent contests continue to show strong collective ef-fects and weak to nonexistent personal economic effects. [On the 1984 election,see Kinder et al (1989); on 1984 and 1988, see Lanoue (1994); on 1956–1988, seeMarkus (1992); on 1992 and 1996, see Alvarez & Nagler (1995, 1998).]
Look at results from the 1992 and 1996 presidential elections. In a multinomialprobit estimation, Alvarez & Nagler(1995) found that, in 1992, family financial sit-uation did not have a statistically significant impact on presidential choice, whereasthe assessment of the national economy was very influential. Similarly, from theiranalysis of the 1996 ANES data, they concluded that “the national economy hada strong effect in returning Clinton to office in 1996.... The overwhelming impactof the economy in 1992 was not just a fluke” (Alvarez & Nagler 1998:1360–62).They observed that economic perceptions had a much greater impact on choicethan perceptions about other issues. If a group of voters shifted their nationaleconomic assessment from “worse” to “better,” the probability of their voting forClinton rose by 0.38. This rise was much smaller for other issue shifts. Whena group’s opinion on Social Security shifted from wanting it increased (0.56) towanting it cut (0.42), their likelihood of voting for Clinton shifted by 0.14; whentheir opinion on welfare shifted from “increase” (0.57) to “cut” (0.49), the likeli-hood of a Clinton vote shifted by 0.08; when their opinion on abortion shifted frompro-choice (0.59) to pro-life (0.29), the likelihood of a Clinton vote shifted by 0.30.Economics has a greater effect than all these other issues, including abortion.
The research reviewed thus far has focused on retrospective economic voting,which forms the bulk of the empirical evidence. However, there is some investi-gation of prospective effects. Its theoretical impetus comes from Downs, ratherthan Key. According to Downs (1957:39), “When a man votes, he is helping toselect the government which will govern him during the coming election period....
Ann
u. R
ev. P
olit.
Sci
. 200
0.3:
183-
219.
Dow
nloa
ded
from
arj
ourn
als.
annu
alre
view
s.or
gby
Uni
vers
ity o
f A
rizo
na L
ibra
ry o
n 01
/10/
09. F
or p
erso
nal u
se o
nly.

P1: FRD
April 18, 2000 17:41 Annual Reviews AR097-09
?ECONOMIC DETERMINANTS OF ELECTORAL OUTCOMES 195
He makes his decision by comparing future performances he expects from thecompeting parties.” Fiorina (1981:139) explored the impact of 1976 ANES itemson future economic expectations that asked whether the problems of inflation andunemployment “would be handled better by the Democrats, by the Republicans, orabout the same by both.” He found that they outperformed complex collective ret-rospective items (Fiorina 1981:170). Lewis-Beck (1988:121), examining a specialbattery of Michigan Consumer Survey questions, showed that prospective personalfinances (a year from now you will be better off ) were a statistically significant pre-dictor of 1984 presidential vote intention, whereas retrospective personal financesitems were not. In contrast, Lanoue (1994) found significant prospective effectsoperating in the 1988 presidential election but not in the 1984 election. Conductingan extensive investigation of the ANES presidential election surveys 1956–1988,Lockerbie (1992) learned that prospective economic voting effects were pervasiveand were much stronger than retrospective effects. He calculated that, overall,prospective items had 43% of the impact of party identification. Although this isan impressive conclusion, it is undercut by the author’s admitted difficulties withitem consistency across the surveys.
In sum, the survey evidence shows that economic voting is a regular featureof US presidential elections, always representing an important, not to say themost important, issue in the campaign. Still, arguments persist in the researchliterature about the nature of its presence. Are the apparent economic effects apsychological artifact of placing the economic questions too close to the votequestions in the survey instrument, as Sears & Lau (1983) contended, at least forthe pocketbook items? A proximity analysis of ANES economic evaluation andvoting items by Lewis-Beck (1985) indicated that this hypothesized effect was notoccurring. However, he did go on to agree with Sears & Lau that these contextualeffects could take place in certain surveys, such as exit polls (Lewis-Beck 1988:50).As a general rule, prudence requires that key economic and political survey itemsbe placed at a distance from each other, in order to avoid a reactivity bias.
Working with a special question battery in the Michigan Consumer Surveysprior to the 1984 presidential contest, Lewis-Beck (1988:121) separated the eco-nomic and political items by about 70 questions to forestall this contextual bias.Besides the expected impact of collective economic evaluations, he found signif-icant pocketbook effects, but only of a prospective type (Lewis-Beck 1988:121).The finding is of special interest because it employed panel data, to better controlfor party identification (i.e. July vote intention was predicted from January partyidentification). Panel data have seldom been used in the economic voting litera-ture, and then only for the purpose of getting less endogenous measures of partyidentification (see especially Fiorina 1981:98).
Utilizing panel data to explore the temporal dynamic of individual economicvoting seems the next frontier in US presidential survey studies. When individ-uals are surveyed at two or more points in time, their evaluations can record realeconomic change; the variation observed is more likely to be causal. Positive re-sults would help rule out Kramer’s (1983) standing dissent that in a survey cross
Ann
u. R
ev. P
olit.
Sci
. 200
0.3:
183-
219.
Dow
nloa
ded
from
arj
ourn
als.
annu
alre
view
s.or
gby
Uni
vers
ity o
f A
rizo
na L
ibra
ry o
n 01
/10/
09. F
or p
erso
nal u
se o
nly.
P1: FRD
April 18, 2000 17:41 Annual Reviews AR097-09
?196 LEWIS-BECK ¥ STEGMAIER
section there can be no “real” variance because there is only one economy beingmeasured at one point in time. Further, the particular pattern of reported economicchange observed in panel data would tap into regional variations in economic con-ditions, which have been largely neglected. Finally, the panel approach promisesto overcome the biases that may persist even when cross sections and time seriesare pooled (Kiewiet & Rivers 1985:225).
US Congressional Voting
One might argue that economic voting research in the United States really beganin the congressional arena, with a seminal paper by Kramer. His thesis was thatwhen congressional voters judged economic performance to be satisfactory, theyvoted for the party of the president; otherwise, they did not (Kramer 1971:131).To test this proposition, he examined the effects of the macroeconomic indicatorsof inflation, unemployment, and income on House election outcomes in aggregatetime series models (1896–1964, excluding 1912, 1918, 1942, and 1944). Incomewas found to have a statistically significant impact; a 1% decline in real per capitapersonal income produced a 0.5% fall in the House vote share of the incumbentparty (Kramer 1971:140–41). Leading economists quickly attacked this finding,chiefly on the grounds that it made little sense for voters to think about the economythis way (Stigler 1973, Arcelus & Meltzer 1975). In response, Kramer carried outfurther analysis and arrived at the even stronger conclusion that “all three economicvariables do influence congressional elections” (Goodman & Kramer 1975:1264).
Writing at about the same time, Tufte (1975, 1978) also uncovered potenteconomic effects on the congressional vote. He theorized that House electionsheld between presidential terms were referenda on the economic and politicalperformance of the president. This straightfoward notion, coupled with powerfulempirical results, helped spark numerous aggregate time series models featuringeconomic conditions and congressional elections. Table 7 gives three examples.In column 1 is Tufte’s (1978:112) original midterm equation for a standardizedHouse vote change, in which two highly significant independent variables, presi-dential approval and change in per capita disposable income, explain most of thevariance. In column 2 is the Hibbs (1982:410) midterm equation, where roughlythree quarters of the variance in incumbent House vote is attributable to incomechange (geometrically weighted). In column 3 is a preliminary Lewis-Beck & Rice(1992:63) extension, which modifies the dependent variable to examine directlyincumbent-party seat change and which incorporates presidential-year elections.According to the model in column 3, economic effects remain strong, with a 1%rise in the growth rate of real disposable income generating a six-seat gain for thepresident’s party. All three models, in sum, show important economic effects.
The results of Table 7 give some idea of the contours of political economymodels for House elections. A few examples for the Senate could be trotted out,and they do show the importance of economic conditions in that arena (Abramowitz& Segal 1986, Lewis-Beck & Rice 1992:ch. 5). The Senate still seems to be the
Ann
u. R
ev. P
olit.
Sci
. 200
0.3:
183-
219.
Dow
nloa
ded
from
arj
ourn
als.
annu
alre
view
s.or
gby
Uni
vers
ity o
f A
rizo
na L
ibra
ry o
n 01
/10/
09. F
or p
erso
nal u
se o
nly.

P1: FRD
April 18, 2000 17:41 Annual Reviews AR097-09
?ECONOMIC DETERMINANTS OF ELECTORAL OUTCOMES 197
TABLE 7 Selected models of congressional electionoutcomes (figures in parentheses are standard errors;∗ =statistically significant at 0.05 or better)
Variable (1)a (2)b (3)c
Income 0.62∗ 0.93∗ 6.20∗(0.17) (0.21) (1.93)
Popularity 0.13∗ 0.60∗(0.04) (0.30)
Midterm 29.08∗(7.90)
Constant −10.74 −3.15 −63.75
R-squared 0.825 0.76 0.66
N 8 9 22
a(1) The dependent variable= standardized vote loss of president’s party (per-centage share corrected for average over eight previous elections); independentvariables= income (the election-year change in real disposable income percapita) and popularity (Gallup presidential approval rating just before the elec-tion); N = midterm elections 1946–1974 (Tufte 1978:108–13).b(2) The dependent variable= standardized vote loss; independent variable=geometrically weighted average income (values closer to the election areweighted more heavily);N = midterm elections 1946–1978 (Hibbs 1982:410).c(3) The dependent variable= seat change for president’s party; independentvariables= income (growth rate of real disposable income six months priorto the election) and popularity (presidential job approval in the June Gallup).Midterm = a dummy for whether it is a midterm or on-year election;N =House elections 1948–1990 (Lewis-Beck & Rice 1992:60–66).
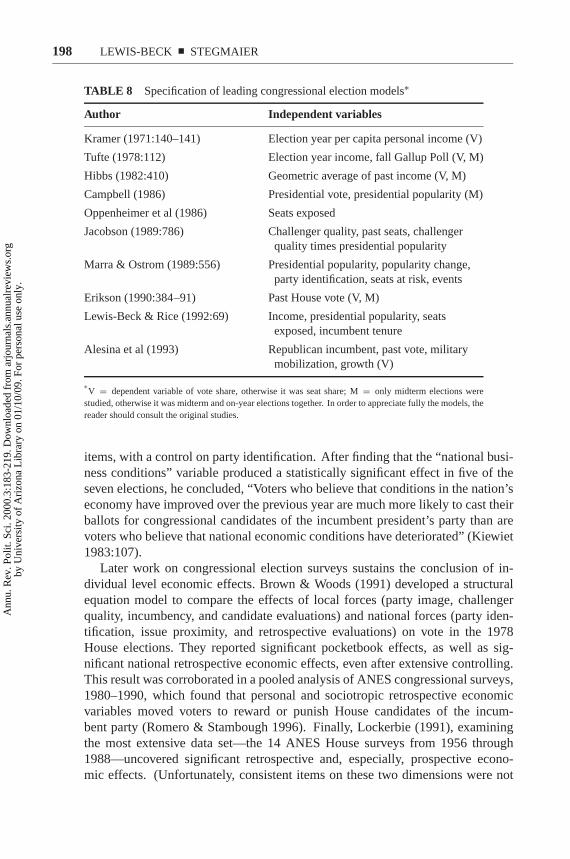
“forgotten side” of the economics and congressional elections debate (Hibbing &Alford 1982). But for the House, many aggregate time series models have beendeveloped. Table 8 shows ten such House models and their explanatory variables.Some models focus only on midterm elections, whereas others include presidentialelection years as well. Further, the dependent variable is sometimes vote shareand sometimes seat share. Regardless of these distinctions, or of the differentindependent variables over different time series, all produce good statistical fits,usually withR-squared values of∼0.8 or more.
Economics is almost always measured with a version of income. In some mod-els, economics shows a significant effect, but in others it does not. In a few cases,the lack of economic effect is because economic variables are absent from the equa-tion (Campbell 1986, Oppenheimer et al 1986). But in other cases, economicsfails to register significance despite its presence in the specification (Jacobson1989, Marra & Ostrom 1989, Erikson 1990, Alesina et al 1993). To resolve thesecontradictory findings, it is important to look at individual voters. Kiewiet (1983:102–7) sequentially analyzed the House election surveys from the ANES, 1958–1980, estimating a series of probit equations containing a battery of economic
Ann
u. R
ev. P
olit.
Sci
. 200
0.3:
183-
219.
Dow
nloa
ded
from
arj
ourn
als.
annu
alre
view
s.or
gby
Uni
vers
ity o
f A
rizo
na L
ibra
ry o
n 01
/10/
09. F
or p
erso
nal u
se o
nly.
P1: FRD
April 18, 2000 17:41 Annual Reviews AR097-09
?198 LEWIS-BECK ¥ STEGMAIER
TABLE 8 Specification of leading congressional election models∗
Author Independent variables
Kramer (1971:140–141) Election year per capita personal income (V)
Tufte (1978:112) Election year income, fall Gallup Poll (V, M)
Hibbs (1982:410) Geometric average of past income (V, M)
Campbell (1986) Presidential vote, presidential popularity (M)
Oppenheimer et al (1986) Seats exposed
Jacobson (1989:786) Challenger quality, past seats, challengerquality times presidential popularity
Marra & Ostrom (1989:556) Presidential popularity, popularity change,party identification, seats at risk, events
Erikson (1990:384–91) Past House vote (V, M)
Lewis-Beck & Rice (1992:69) Income, presidential popularity, seatsexposed, incumbent tenure
Alesina et al (1993) Republican incumbent, past vote, militarymobilization, growth (V)
∗V = dependent variable of vote share, otherwise it was seat share; M= only midterm elections were
studied, otherwise it was midterm and on-year elections together. In order to appreciate fully the models, thereader should consult the original studies.
items, with a control on party identification. After finding that the “national busi-ness conditions” variable produced a statistically significant effect in five of theseven elections, he concluded, “Voters who believe that conditions in the nation’seconomy have improved over the previous year are much more likely to cast theirballots for congressional candidates of the incumbent president’s party than arevoters who believe that national economic conditions have deteriorated” (Kiewiet1983:107).
Later work on congressional election surveys sustains the conclusion of in-dividual level economic effects. Brown & Woods (1991) developed a structuralequation model to compare the effects of local forces (party image, challengerquality, incumbency, and candidate evaluations) and national forces (party iden-tification, issue proximity, and retrospective evaluations) on vote in the 1978House elections. They reported significant pocketbook effects, as well as sig-nificant national retrospective economic effects, even after extensive controlling.This result was corroborated in a pooled analysis of ANES congressional surveys,1980–1990, which found that personal and sociotropic retrospective economicvariables moved voters to reward or punish House candidates of the incum-bent party (Romero & Stambough 1996). Finally, Lockerbie (1991), examiningthe most extensive data set—the 14 ANES House surveys from 1956 through1988—uncovered significant retrospective and, especially, prospective econo-mic effects. (Unfortunately, consistent items on these two dimensions were not
Ann
u. R
ev. P
olit.
Sci
. 200
0.3:
183-
219.
Dow
nloa
ded
from
arj
ourn
als.
annu
alre
view
s.or
gby
Uni
vers
ity o
f A
rizo
na L
ibra
ry o
n 01
/10/
09. F
or p
erso
nal u
se o
nly.

P1: FRD
April 18, 2000 17:41 Annual Reviews AR097-09
?ECONOMIC DETERMINANTS OF ELECTORAL OUTCOMES 199
available across the surveys.) All told, the survey work on economic voting atthe congressional level seems to establish the proposition that in House elections,voters do punish the president’s party for economic bad times and reward it forgood times.
The aggregate time series models that fail to show the connection betweeneconomics and elections appear to suffer from faulty measurement, specification,or analysis. This assessment is reinforced by Kiewiet & Udell’s (1998) thoroughreexamination of the original Kramer (1971) model. Using a longer time series(1892–1992) and improved measures, they showed that “regardless of the con-struction of alternative data series for GNP and unemployment, and regardless ofthe particular specification that was employed, a century of economic and politicaldata uphold Kramer’s basic findings: electoral support for congressional candi-dates of the incumbent party increases along with income and job growth, anddecreases with higher rates of inflation” (Kiewiet & Udell 1998).
A MUCH-STUDIED NATION: France
Economic voting theory is transnational (Eulau & Lewis-Beck 1985:1) and meritstesting in any democracy. Thus far, we have examined only the US case because byfar the most research has been done on that case. The American work, however,encouraging as it is, can do no more than suggest that economics is a strongforce in other electoral systems. Indeed, it may be that the US case is uniqueand holds no generalizations about economic voting. Therefore, a comparativelook is important. We begin with a simple comparison to one other democracy—France. The theoretical argument for the comparison rests on the common claimthat, among the advanced democracies, the US and France are exceptional (seeHoffman 1992:25). A Franco-American comparison, then, offers a tough test. Ifeconomic voting is vigorous in France, the notion that it is a powerful cross-nationalmodel receives support. Furthermore, because many French electoral institutionsare different, the comparison allows signficant refinements of the conditions underwhich economic effects may vary. As with the US case, we first look at popularityfunctions, then vote functions, and finally individual-level survey data.
French Popularity Functions
Popularity functions for the French executive—the president or the prime minis-ter—are plentiful. Typically, the dependent variable is the percentage who res-pond positively to the Institut Fran¸cais d’Opinion Publique (IFOP) national surveysample question, “Are you satisfied with X as President (Prime Minister)?” Theusual economic independent variables are income, inflation, and unemployment,controlled on a series of political dummies. The leader in this research, workingsince the late 1970s, has been Lafay. In Table 9 are two of his popularity functions,the first for the president, the second for the prime minister. Essentially, as in the
Ann
u. R
ev. P
olit.
Sci
. 200
0.3:
183-
219.
Dow
nloa
ded
from
arj
ourn
als.
annu
alre
view
s.or
gby
Uni
vers
ity o
f A
rizo
na L
ibra
ry o
n 01
/10/
09. F
or p
erso
nal u
se o
nly.

P1: FRD
April 18, 2000 17:41 Annual Reviews AR097-09
?TABLE 9 Two French popularity functions (figures inparentheses aret-ratios)
(1)a (2)b
Inflation −0.028∗(3.4)
Perceived inflation 0.30∗(2.7)
Unemployment −0.103∗(6.6)
Perceived unemployment −0.26∗(1.8)
Income 0.029∗(3.1)
Collective prospective 0.16(1.4)
Exchange rate −0.253∗(6.8)
Barre Plan −0.310∗(4.7)
PM dummiesMauroy 0.707∗ 37.25∗
(7.0) (9.7)Fabius 28.89∗
(9.1)Chirac 19.40∗
(4.4)
R-squared 0.77 0.93
Degrees of freedom 104 91
∗Statistical significance at 0.05 one-tail, or better.a(1) The dependent variable= logit of the proportion “satisfied” with thepresident in a monthly IFOP (Institut Fran¸cais d’Opinion Publique) poll,measured monthly 1974–1983; the independent variables= inflation (rateover 6 months, lagged one month), unemployment (rate lagged one month),income (real disposable growth over 15 months, lagged one month), ex-change rate (francs per dollar, lagged one month). The Barre Plan= adummy for that prime minister’s economic plan, PM dummy for the Social-ists in government in and after June 1981; the estimation is weighted leastsquares (Lafay 1985:92–93).b(2) The dependent variable= popularity of the prime minister (percen-tage of respondents finding the prime minister “reliable” in a Societ´eFrancaise d’enquˆetes par sondage poll), monthly data from December 1978to April 1987; independent variables= perceived inflation (percentage whothink government is doing a good job against inflation), perceived unem-ployment (percentage who think government is doing a good job againstunemployment), collective prospective evaluation (percentage who thinkconditions will improve in the near future); Mauroy, Fabius, Chirac=dummy variables for each new prime minister; other independent variables(not shown) are lagged values of perceived inflation, perceived unemploy-ment, and the dependent variable. Estimation is with OLS (Lafay 1991:131).
Ann
u. R
ev. P
olit.
Sci
. 200
0.3:
183-
219.
Dow
nloa
ded
from
arj
ourn
als.
annu
alre
view
s.or
gby
Uni
vers
ity o
f A
rizo
na L
ibra
ry o
n 01
/10/
09. F
or p
erso
nal u
se o
nly.

P1: FRD
April 18, 2000 17:41 Annual Reviews AR097-09
?ECONOMIC DETERMINANTS OF ELECTORAL OUTCOMES 201
US models, popularity is seen as a function of macroeconomic indicators (realor perceived)—income, inflation, and unemployment—plus dummies for politicalevents and adminstrations.
These results are typical of the French case in that they show statistically signifi-cant economic effects and snug model fits. Numerous French popularity functionshave been estimated by various scholars, and all but one (i.e. Lecaillon 1981)demonstrate an economic impact (see reviews in Lafay 1985, 1991). What is notclear is which of the three leading indicators—unemployment, income, or infla-tion—is most important. Nor is the lag structure clear. For example, the presiden-tial popularity model of column 1 has long-distributed lagged economic effectsof up to 15 months, whereas the model of Lewis-Beck (1980) has short, simplelagged effects from two months prior. Another underdeveloped issue is retrospec-tive versus prospective economic impacts on popularity. (The coefficient of thecollective prospective variable in column 1, Table 9, is the only empirical test ofthis idea. The result is suggestive, but falls short of statistical significance at the0.05 level.)
French National Voting
In France, popularity function work has been largely set aside in favor of votefunction work, where popularity is sometimes an independent variable. Lafay &Servais (1995:xv) found that popularity (of the parties) before an election washighly predictive of the result, and they made a very accurate forecast of the1995 Chirac presidential victory. Presidential popularity itself (i.e. percent ofrespondents satisfied with the president) is highly correlated with presidentialvote on the second round (r = 0.77), and it generates a comparable prediction(Lewis-Beck 1995). However, the macroeconomy alone is also very predictive.Table 10 shows selected vote function models for French elections.
In column 1, a measure of the economic growth rate accounts for almost all thevariation in presidential election outcomes across the Fifth Republic. This effectholds only if the president is the “political economic incumbent,” i.e. the chief pub-lic manager of the economy (Lewis-Beck 1997:321). If the president commands aruling coalition in the National Assembly, then he has been responsible for shap-ing the economic policy of the nation. Under cohabitation, however, where thepresident and the prime minister are of rival coalitions, then the political economicincumbent becomes the prime minister. (This explains why, in the equation ofcolumn 1, the GNP variable is scored 0 for 1995. No economic performance wasattributed to the Socialist President Mitterrand, since the prime minister was theGaullist Balladur). French voters, then, are assumed to be rather sophisticated,appropriately shifting the target of economic responsibility (more on this below).
Vote function work on the French case actually began with legislative, ratherthan presidential, elections. The pathbreaking research of Rosa & Amson (1976)examined National Assembly contests from 1920 to 1973. They found that thevote share of leftist parties was heavily determined by fluctuations in inflation,
Ann
u. R
ev. P
olit.
Sci
. 200
0.3:
183-
219.
Dow
nloa
ded
from
arj
ourn
als.
annu
alre
view
s.or
gby
Uni
vers
ity o
f A
rizo
na L
ibra
ry o
n 01
/10/
09. F
or p
erso
nal u
se o
nly.

P1: FRD
April 18, 2000 17:41 Annual Reviews AR097-09
?202 LEWIS-BECK ¥ STEGMAIER
TABLE 10 Selected French vote functions (figures in parenthesesaret-ratios)
Variable (1)a (2)b (3)c
Popularity −0.38∗(3.69)
GNP 1.27∗ −0.13(7.48) (0.05)
Presidential vote 0.71∗(7.69)
Unemployment −4.73∗(4.93)
Ideology 3.76∗(4.27)
Instability −1.31∗(1.90)
Constant 47.26∗ 68.28∗ 11.39∗(59.79) (14.73) (2.43)
R-squared 0.93 0.73
Adjusted R-squared 0.92 0.65 0.71
SEE† 1.14 3.40 3.22
D-W† 2.47 1.82
N 6 10 110
∗Statistical significance at 0.05 one-tail, or better.†SEE, standard error of estimate; D-W, Durbin-Watson statistic.a(1) The dependent variable= the percentage of second round presidential votes receivedby the candidate of incumbent party coalition, 1965–1995; independent variable= GNP(growth rate for the election year, except 1995 is coded 0); estimation= OLS (Lewis-Beck1997:322).b(2) The dependent variable= percentage of first round National Assembly votes going tothe opposition, 1958–1993; independent variables= presidential popularity six monthsbefore in an IFOP poll and GNP (the growth rate in the quarter six months before theelection). Estimation= OLS (Lewis-Beck 1995:40).c(3) The dependent variable= percent of first round National Assembly vote going tothe ruling coalition, by region (1978, 1981, 1986, 1988, 1993); independent variables=presidential vote [percentage of the last presidential vote (first round) going to candidatesof the current ruling coalition], unemployment (change in the rate the year prior to theelection), ideology [dummy to indicate whether since 1973 the region is ideologically (leftversus right) voting consistently with the incumbent], instability (a dummy to indicatewhether the legislative majority has switched ideologically at least twice since 1973).Estimation= OLS (Jerome et al 1999).
Ann
u. R
ev. P
olit.
Sci
. 200
0.3:
183-
219.
Dow
nloa
ded
from
arj
ourn
als.
annu
alre
view
s.or
gby
Uni
vers
ity o
f A
rizo
na L
ibra
ry o
n 01
/10/
09. F
or p
erso
nal u
se o
nly.

P1: FRD
April 18, 2000 17:41 Annual Reviews AR097-09
?ECONOMIC DETERMINANTS OF ELECTORAL OUTCOMES 203
unemployment, and income. In column 2 of Table 10 is a legislative vote func-tion for Fifth Republic elections. It is similar in cast to many post–World War IIUS congressional election models. Opposition vote share is largely accountedfor by presidential popularity and economic growth. (In contrast to the US case,collinearity plagues such models. For the variables of column 2, growth andpopularity are correlated at 0.98.) This model, applied ex ante to forecast the1997 National Assembly elections, surprised conventional wisdom by accuratelypredicting the defeat of the Right (Fauvelle-Aymar & Lewis-Beck 1997). Column3 displays a somewhat different vote function, using a pooled time series designfirst pursued in France by Lafay (1993). Legislative election results from the 22official regions of France are pooled across the 1978–1993 contests, yielding amuch larger sample than the traditional vote functions allowed. The strategy per-mits detailed modeling of the region’s political history and ideological tendencies,in addition to establishing strong economic effects. Specifically, the unemploy-ment coefficient indicates that a one-percentage-point increase in the rate costs theruling party coalition about 5% of the first-round vote (J´erome et al 1999).
One limitation of the VP function literature is that it says nothing directly abouthow individual voters actually perceive and act on the economy. Several surveyinvestigations, however, do point to the mental processes of the French economicvoter. Table 11 provides selected vote equations estimated on individual surveyrespondents. The first, in column 1, is an idealized model in which legislative voteintention is held to be determined strictly by economic evaluations. TheR-squaredindicates that the economy, by itself, is capable of explaining a fair amount ofvariance in support for the ruling parliamentary coalition. There are no personalretrospective effects, a typical French finding. But collective effects, both ret-rospective and prospective, appear strong. For example, considered as a linearprobability model, the equation says that, if the voter sees the economic future aslikely to be improved, as opposed to made worse, the probability of an incum-bent vote rises by 42% (Lewis-Beck 1988:56). Economic effects in presidentialelections are assessed in column 2. This more fully specified model, estimated onsecond-ballot voters of the second and final ballot in the 1995 contest, demon-strates a similar pattern: no significant personal effects, but significant collectiveeffects, especially prospective. Indeed, “the belief that Chirac would bring a bettereconomy seems a decisive factor in his victory” (Lewis-Beck 1997:261).
The French electoral system has institutional features that allow the testingof economic voting under different rules. The influence of the two-ballot systemis an example. On the first ballot of the 1995 presidential contest, there wereeight leading candidates. With this wide array of choices, subtleties of economicvoting can be explored. Lewis-Beck (1997:251–61) found support for a numberof intriguing hypotheses. First, the closer the candidate was to the center of power,the more prevalent economic voting became. For instance, economic effectswere highly visible in voting for the major party candidates—Gaullist, Socialist,Communist, National Front—but scarcely noticeable for minor party candidates.A second discovery was that voters were sophisticated, able under cohabitation to
Ann
u. R
ev. P
olit.
Sci
. 200
0.3:
183-
219.
Dow
nloa
ded
from
arj
ourn
als.
annu
alre
view
s.or
gby
Uni
vers
ity o
f A
rizo
na L
ibra
ry o
n 01
/10/
09. F
or p
erso
nal u
se o
nly.

P1: FRD
April 18, 2000 17:41 Annual Reviews AR097-09
?TABLE 11 Selected survey models of the individual French vote
(1)a (2)b (3)c
Personal . .Retrospective 0.00 0.02Collective . .Retrospective 0.06∗∗∗ −0.09∗ 0.43∗PersonalProspective −0.09∗CollectiveProspective 0.21∗∗∗ −0.40∗∗PersonalComplex −0.03CollectiveComplex 0.03Anger 0.08∗∗∗Religion −0.34∗∗ −0.24∗∗∗Class 0.70∗∗ 0.14∗∗Ideology 1.82∗∗ 2.46∗∗∗Cohabitation 0.22∗∗∗Cohabitation× Economics −0.24∗∗∗R-squared/percent correct 0.28 88.3% 74.9%N 642 2321 5684
∗Statistical significance at 0.10.∗∗
Statistical significance at 0.05.∗∗∗
Statistical significance at 0.01.a(1) The dependent variable= vote intention based on the question, “If there were a General Electiontomorrow which party would you support”; ruling coalition (Socialist, Communist, MRG, PSU= 1);opposition (Gaullists, Radical UDF, CDS/UDF, PR/UDF, Ecologist, National Front= 0). Independentvariables are personal retrospective (personal finances scored from 5= “a lot better” to 1 = “worse”);collective retrospective (national economy, scored from 5= “a lot better” to 1 = “worse”); collectiveprospective [a year from now government policies will have “improved” (= 1) the economy, “not mademuch difference”= 2, “made worse”= 3]; personal complex [the impact of government policies on personalfinances was “good” (= 3) to “bad” (= 1)]; collective complex [the impact of government policies on theeconomy has been “good” (= 3) to “bad” (= 1)]; anger (feel angry over government economic policies,from “never”= 5 to “always”= 1. All the variables were measured in 1984 in Euro-Barometer No. 21, andestimation is OLS (Lewis-Beck 1988:56).b(2) The dependent variable= second ballot 1995 presidential vote (1= Chirac, 0= Jospin). Economicindependent variables are personal retrospective, personal prospective, collective retrospective, and collectiveprospective economic evalutions (better= 1 to worse= 5); religion, i.e attendance at Mass (from 1=“several times a week” to 6= “never” or not Catholic); class, i.e. self-employed (1= farmers, business,artisans, liberal professionals, 0= other) and white-collar (1= salaried, not blue-collar, 0= other), whichwas not shown because it was not significant ; ideology [right-left self-placement from 7 (extreme right) to 1(extreme left)]. The data are from the 1995 French National Election Survey; estimation is logit (Lewis-Beck1997).c(3) The dependent variable is a dichotomy, vote intention for incumbent party scored 1 (Socialists if theprime minister is Socialist, RPR-UDF if the prime minister is RPR-UDF), 0= otherwise. The independentvariable of economics is the collective retrospective evaluation of the national economy (1= better to−1 = worse). The remaining independent variables are ideology (left to right, from−1 to +1);religion = 1 for regular Mass attenders, 0 for irregular Mass attenders,−1 = otherwise. Class= 1for blue collar workers,= −1 for self-employed, and 0= other; cohabitation= 1 for a cohabitation period(1986–1988, 1993–1995); cohabitation× Economics= an interaction term, the estimation is logit. Thedata are from a Euro-Barometer pool, 1984–1994 (Lewis-Beck & Nadeau 2000).
Ann
u. R
ev. P
olit.
Sci
. 200
0.3:
183-
219.
Dow
nloa
ded
from
arj
ourn
als.
annu
alre
view
s.or
gby
Uni
vers
ity o
f A
rizo
na L
ibra
ry o
n 01
/10/
09. F
or p
erso
nal u
se o
nly.
P1: FRD
April 18, 2000 17:41 Annual Reviews AR097-09
?ECONOMIC DETERMINANTS OF ELECTORAL OUTCOMES 205
place economic responsibility with the prime minister and his party rather than thepresident. That is, a perception of economic downturn took first-ballot votes fromPrime Minister Balladur, a Gaullist candidate, but gave first-ballot votes to Jospin,the Socialist candidate. Third, cohabitation, another institutional feature of theFrench system, has its own effects on economic voting, as the equation in column3 shows. In National Assembly elections, the impact of collective retrospectivevoting is cut in half if the contest occurs during a cohabitation period. Apparently,voters recognize that a prime minister who must work with a president from a rivalcoalition is inevitably a less effective economic manager; therefore, they mete outless praise or blame at the legislative ballot box (Lewis-Beck & Nadeau 2000).
OTHER SINGLE-NATION STUDIES: Britain, Denmark,and the Rest
The economic voting hypothesis has been pursued in other country studies. Afterthe United States and France, the most commonly studied countries are Britainand Denmark. Economic voting effects, sometimes rather strong ones, have beenuncovered in virtually all these studies.
BRITAIN
Popularity functions characterize the research on Britain (but for a thoughtfulexception, see Hibbing 1987). This emphasis is no surprise; the first popularityfunction paper ever published (Goodhart & Bhansali 1970) was on the Britishcase. This pathbreaking article posed the question that has now been repeatedworldwide: “[H]ow far were swings in political popularity affected by economiccircumstances?” (Goodhart & Bhansali 1970:45). The authors sought to modelgovernment popularity, measured from a public opinion time series on vote in-tention in the now familiar way, as a function of key macroeconomic indicatorsand electoral trends. According to their results, government support was stronglyresponsive to the inflation rate and the unemployment level. Their bold confir-mation of the political-economy idea sparked other papers, some of which sup-ported the idea (Frey & Schneider 1978b, Pissarides 1980, Whiteley 1986) andsome of which did not (Miller & Mackie 1973, Mosley 1978, Chrystal & Alt1981).
The apparent impasse over the modeling of British popularity functions wasbroken with the introduction of Falklands (Malvinas) War variables. Some re-searchers found that Falklands effects dwarfed economic effects (Dunleavy &Husbands 1985, Clarke et al 1986, Norpoth 1987). Others found massive eco-nomic effects and trivial Falklands effects (Sanders et al 1987). The economicvariables they identified were personal economic expectations, the unemploymentrate, the exchange rate, and the public sector borrowing requirement.
Ann
u. R
ev. P
olit.
Sci
. 200
0.3:
183-
219.
Dow
nloa
ded
from
arj
ourn
als.
annu
alre
view
s.or
gby
Uni
vers
ity o
f A
rizo
na L
ibra
ry o
n 01
/10/
09. F
or p
erso
nal u
se o
nly.

P1: FRD
April 18, 2000 17:41 Annual Reviews AR097-09
?206 LEWIS-BECK ¥ STEGMAIER
Since the Falklands War, British popularity function work has evolved in focus,examining the more general question of the dimensions of economic voting—retrospective or prospective, personal or collective (Clarke & Stewart 1995, Price& Sanders 1995, Clarke et al 1997). In the models, objective macroeconomicindicators are giving way to aggregated economic perceptions based on monthlysurveys. For example, in the Sanders et al (1991:166) study, the personal expecta-tions index was built from the monthly Gallup item, “How do you think the financialsituation of your household will change over the next twelve months?” Besidesthis aggregated personal prospective measure, there are personal retrospective,collective prospective, and national retrospective measures. In Britain, Sanders(1991, 1993) has championed the determining role of the personal prospectivedimension for government popularity.
Sanders (2000) has summarized many of the findings–and much of the contro-versy—surrounding economic voting in the United Kingdom today. Monthly pop-ularity is modeled in an extended time series, 1974–1997, with controls imposedfor the Falklands War and the Thatcher removal. He found that the macroeco-nomic indicators of inflation and unemployment have no effect. However, sub-jective economic assessments—personal expectations, inflation perceptions, andunemployment perceptions—have significant, predictable effects. (It is worth not-ing that whereas the personal assessment is prospective, the collective assessmentsof inflation and the economy are retrospective). He concluded that “voters rewardgovernment with their support if their economic prospects look good and if theyperceive that unemployment and inflation are falling; they inflict punishment bywithdrawing their support if expectations are falling or if they perceive that unem-ployment or inflation are rising” (Sanders 2000).
Denmark
Denmark provides a useful European contrast to the British case. Economic vot-ing research on this small, continental, multiparty democracy has yielded differentresults. The first Danish popularity function paper, which in standard fashionlinked objective macroeconomics with government support, showed that that linksnapped in the 1970s (Paldam & Schneider 1980). In a recent effort by Nannestad& Paldam (2000), the dependent variable was government support (as a monthlyaverage of different polls between 1986 and 1997), where the government wasfour times a Conservative-Liberal–led coalition and once a Social Democratic–led coalition (1993–1997). The focus has switched to the effects of perceptualmeasures of the economy, aggregated from the monthly government ConsumerConfidence Index—sociotropic retrospective, sociotropic prospective, egotropicretrospective, and egotropic prospective. After an extensive series of tests, theauthors concluded that during 1986–1997, “the level of government support inDenmark is not influenced by the level of the variables measuring economic eval-uation” and that, based on their data, “there simply was no economic voting inDenmark during this period” (Nannestad & Paldam 2000).
Ann
u. R
ev. P
olit.
Sci
. 200
0.3:
183-
219.
Dow
nloa
ded
from
arj
ourn
als.
annu
alre
view
s.or
gby
Uni
vers
ity o
f A
rizo
na L
ibra
ry o
n 01
/10/
09. F
or p
erso
nal u
se o
nly.

P1: FRD
April 18, 2000 17:41 Annual Reviews AR097-09
?ECONOMIC DETERMINANTS OF ELECTORAL OUTCOMES 207
Nevertheless, cross-sectional survey research by these and other investiga-tors has found substantial economic voting in this period. Nannestad & Paldam(1995) examined multiple surveys from 1990 to 1993, containing a battery of13 economic evaluation questions and vote intention questions. They found per-vasive economic voting, but it took an unusual form—egotropic effects dominatedsociotropic effects, which were extremely weak. Thus, they presented the strongestcase for pocketbook voting in the entire economics and elections survey literature.Their explanation for the result is the “cultural hypothesis. In a welfare state thegovernmentis responsible for the economy of the individual, so it is only rea-sonable that he hold it responsible in his voting” (Nannestad & Paldam 1995:57,italics in original). Furthermore, they have replicated the result in an elaborate,pooled, cross-sectional time series design, described in “From the Pocketbook ofthe Welfare Man” (Nannestad & Paldam 1997).
Despite the allure of the unique claim, the Danish “pocketbook voter” hasnot been discovered by other researchers. Hibbs (1993) strongly argued againstits existence, saying that collective societies foster sociotropic, not egotropic,voters. Borre (1997), employing surveys of the 1987, 1990, and 1994 generalelections, estimated economic voting models for each. The dependent variablewas dichotomous (vote for a government party or not), the control variables weresocial class and left-right ideology, and the economic variables were a personalretrospective item (on family economic situation) and a collective retrospectiveitem (on the economic situation of the country). He found that there were neversignificant pocketbook effects, but there were always significant collective effects(Borre 1997:357). He concluded that evaluation of the national economy “exertsa considerable effect on the vote ... those who believe the economy has improveda lot give the government on the average a 28 percent higher vote than those whobelieve the economy has deteriorated a lot” (Borre 1997:359).
In sum, Borre’s conclusions are essentially the opposite of Nannestad &Paldam’s. Why the differences? Hibbs (1993:21) asserted that the unusual re-sults of Nannestad & Paldam stem, at least in part, from their failure to use astandard simple retrospective item on the national economy. But Nannestad &Paldam (1994) claimed that they examined such an item, along with four othersociotropic measures, and still came to the same conclusion. The puzzle of theDanish case has yet to be solved.
Other Single-Nation Studies
Besides Denmark and Britain, economic voting studies have been carried out inmany other democracies. At least one paper can be cited for virtually every estab-lished democracy, and work is under way on at least some of the new democracies.However, to take the risk of characterization, the relevant research in most of theseremaining nations tends to be represented by one investigator, one approach, oreven one article. This characterization implies nothing about the quality of thework, but it does mean that these single-country findings are short on the dynamic
Ann
u. R
ev. P
olit.
Sci
. 200
0.3:
183-
219.
Dow
nloa
ded
from
arj
ourn
als.
annu
alre
view
s.or
gby
Uni
vers
ity o
f A
rizo
na L
ibra
ry o
n 01
/10/
09. F
or p
erso
nal u
se o
nly.
P1: FRD
April 18, 2000 17:41 Annual Reviews AR097-09
?208 LEWIS-BECK ¥ STEGMAIER
needed to sustain a review narrative. Therefore, we simply list economic and elec-tions publications from selected other democracies: Canada (Clarke & Kornberg1992, Nadeau & Blais 1993); Germany (Feld & Kirchg¨assner 2000); Italy(Bellucci 1991); Japan (Anderson & Ishii 1997); Mexico (Brophy-Baermann1994); the Netherlands (Irwin & Van Holsteyn 1997); Poland (Powers & Cox1997); Russia (Colton 1996); Spain (Lancaster & Lewis-Beck 1989). Consultingthese works or their authors will give the reader a good start on the relevant dataand issues for modeling the economic vote in the country of interest. The list islimited to English language publications, as we assume that area specialists versedin the language of the country can more effectively pursue an in-depth search.
MULTIPLE-NATION STUDIES
So far, we have looked at how economic voting theory stands up in individualdemocracies. On the basis of that research review, it is safe to say that economicforces impose a heavy and variegated rule on elections in the United States, France,Britain, and Demark. These countries are certainly not identical. The steady streamof positive results issuing from them increases our confidence and knowledgeabout the generalizability of political economic effects. But what of other nations?Are these positive results peculiar to these four? As a check against this small-sample problem (N = 4), we need studies that examine many nations. Fortunately,there are several such studies. Most sample the high-income democracies, suchas the nations of Western Europe. But there is a growing body of comparativeeconomic voting research on the low-income democracies, and some relevantresearch even samples from the world’s population of democracies.
The High-Income Democracies
Paldam (1991) was the first to look at a pooled vote function. He considered17 high-income democracies (Australia, Belgium, Canada, Denmark, Ireland,Finland, France, Germany, the Netherlands, Italy, Japan, New Zealand, Norway,Austria, Sweden, the United Kingdom, and the United States), which yielded anaggregated data base of 197 elections, over the time period 1948–1985. The de-pendent variable was percentage point vote change for the government from oneelection to the next, the economic independent variables were inflation, growth,and unemployment (at different lags), and the controls were a series of institu-tional variables (country size, number of parties, left-right rule, years in power,and majority-minority government). Paldam (1991:25) commented that the eco-nomic results “are either insignificant or explain very little indeed.” By contrast,another pooled vote function analysis of similar design, but limited to five nations(Britain, France, Germany, Italy, and Spain) and 27 elections (1967–1987), foundthat rising unemployment and inflation significantly lowered the number of seatswon by the ruling coalition (Lewis-Beck & Mitchell 1990).
Ann
u. R
ev. P
olit.
Sci
. 200
0.3:
183-
219.
Dow
nloa
ded
from
arj
ourn
als.
annu
alre
view
s.or
gby
Uni
vers
ity o
f A
rizo
na L
ibra
ry o
n 01
/10/
09. F
or p
erso
nal u
se o
nly.
P1: FRD
April 18, 2000 17:41 Annual Reviews AR097-09
?ECONOMIC DETERMINANTS OF ELECTORAL OUTCOMES 209
Following these two studies, Powell & Whitten (1993) conducted an economicvoting analysis on∼100 aggregated elections, 1969–1988, from a cross sectionof 19 industrialized nations. They reported that economic voting depends on po-litical context, defined as voting cohesion in government, nature of the committeesystem, strength of the bicameral opposition, minority government status, andcoalition government status. These conditions determine whether responsibilityfor economic policy is clear. In countries with clear lines of responsibility, GDPgrowth and unemployment (directly and interactively) significantly affected thegovernment vote; however, in countries where policy responsibility is unclear,none of these variables were significant. Chappell & Veiga (2000) have examinedthe responsibility hypothesis in their own pooled analysis of 136 elections from13 Western European countries (Austria, Belgium, Denmark, Finland, France,Germany, Ireland, Italy, the Netherlands, Portugal, Spain, Sweden, and the UnitedKingdom). Responsibility variables—main party, coalition government, minoritygovernment, and openness—do not significantly influence change in governmentsupport. However, the inflation rate does. “Our strongest finding is that voterspunish increases in inflation” (Chappell & Veiga 2000).
These aggregate, essentially Western European, pooled studies are contradic-tory. Some show economic effects, some do not. Among the studies that show aneffect, there is dispute about whether the effect depends on political context. Thesedisagreements can be partly resolved by looking at individual voters in these coun-tries. Lewis-Beck (1988) estimated the same individual economic voting model onelection survey data from five Western European nations. Although he uncoveredno pocketbook effects, he found sharp collective retrospective and prospective ef-fects. Further, “Changing economic conditions exert a force on Western Europeanvoters that approaches and sometimes exceeds the force of more traditional factors”(Lewis-Beck 1988:85). He discovered that economic voting varied in strength bycountry; it was strongest in Britain, followed by Spain, Germany, France, andItaly in that order (Lewis-Beck 1988:105). The key variable accounting for thispattern was “coalitional complexity,” i.e. the number of parties in the ruling coali-tion (Lewis-Beck 1988:108). At one extreme was Britain, with one ruling party,and at the other extreme was Italy, with five parties in the ruling coalition. Aneconomically disgruntled voter may have difficulty deciding which party to blamewhen several parties govern (Anderson 1995). With a multiparty ruling coalition,there is a “diffusion of government responsibility” and incumbent alternatives fordissent (Lewis-Beck 1986:341).
These particular individual-level survey findings by Lewis-Beck reinforce theaggregate findings of Powell & Whitten on the conditioning role of “clarity ofresponsibility.” Anderson (2000) further developed this line of argument, in a con-vincing, pooled cross-sectional examination of 1994 Eurobarometer surveys from13 European countries: Belgium, Denmark, France, Germany, Greece, Ireland,Italy, Luxembourg, the Netherlands, Norway, Portugal, Spain, and the UnitedKingdom. For example, he found statistically significant retrospective sociotropiceffects in countries with either low or high clarity of responsibility (using the
Ann
u. R
ev. P
olit.
Sci
. 200
0.3:
183-
219.
Dow
nloa
ded
from
arj
ourn
als.
annu
alre
view
s.or
gby
Uni
vers
ity o
f A
rizo
na L
ibra
ry o
n 01
/10/
09. F
or p
erso
nal u
se o
nly.

P1: FRD
April 18, 2000 17:41 Annual Reviews AR097-09
?210 LEWIS-BECK ¥ STEGMAIER
Powell & Whitten measure). However, the effect was 1.5 times greater in thehigh-clarity group than in the low-clarity group. Overall, Anderson concludedthat “voters’ ability to express discontent with economic performance is enhancedwhen accountablity is simple. Voters’ economic assessments have stronger effectson government support when it is clear who the target is, when the target is sizable,and when voters have only a limited number of viable alternatives to throw theirsupport to” (Anderson 2000).
The Low-Income Democracies
The low-income democracies have been the subject of much less economic vot-ing research than the United States and Western Europe. Nevertheless, importantwork has begun. Pacek (1994) provided the first comparative look at macroeco-nomic conditions and electoral outcomes in Eastern Europe. Examining 1990–1992 district-level data for Poland, Czechoslovakia, and Bulgaria, he found thatrising unemployment lowered the vote support for reformist incumbent adminis-trations. A more recent Eastern European analysis (Fidrmuc 2000) examined apooled county-level data set on 1992–1998 elections from the Czech Republic,Hungary, Poland, and Slovakia (N = 442). Fidrmuc found that change in the voteshare of the government was significantly influenced, in the expected direction, byunemployment change and wage growth. According to Fidrmuc (2000), “there isindeed a strong relationship between economic developments and voting behav-ior in the post-communist societies.” Survey research results to underpin thesemacro-level findings are scarce. But Anderson et al (2000) have compared politi-cal economy models of the vote for Nicaragua and Hungary, using election surveydata. According to their analysis of the 1994 Hungarian parliamentary election(and the 1990 Nicaraguan election), incumbent vote was significantly influencedby collective retrospective and collective prospective economic evaluations.
Remmer (1991:785) analyzed 21 presidential elections in 12 Latin Americancountries and claimed that her “results provide some support for the view that in-cumbents pay the price for short-term economic setbacks.” Moreover, she reportedthat her results provide a Latin American extension of the political economy con-nection found in US and Western European elections. Pacek & Radcliff (1995) con-ducted a more general analysis of economics and elections in the developing world.They studied observations on 52 elections in eight nations: Botswana, Costa Rica,India, Jamaica, Sri Lanka, Trinidad and Tobago, Uruguay, and Venezuela. Thedependent variable was incumbent vote share in presidential elections, regressedon the economic independent variable of change in real per capita GNP, plus con-trols (including a lagged dependent variable and country dummies). They foundstrong economic effects: “[E]ach percentage point decline in real per capita GrossDomestic Product [costs] the incumbent governments about 1.1% of the vote”(Pacek & Radcliff 1995:735). They concluded “that economic conditions may befar more important determinants of the vote in developing countries than in theWest, at least when times are bad.”
Ann
u. R
ev. P
olit.
Sci
. 200
0.3:
183-
219.
Dow
nloa
ded
from
arj
ourn
als.
annu
alre
view
s.or
gby
Uni
vers
ity o
f A
rizo
na L
ibra
ry o
n 01
/10/
09. F
or p
erso
nal u
se o
nly.

P1: FRD
April 18, 2000 17:41 Annual Reviews AR097-09
?ECONOMIC DETERMINANTS OF ELECTORAL OUTCOMES 211
Finally, Wilkin et al (1997) sampled from the world’s list of democracies, de-veloping and developed (N = 38 elections, 1998–1994). They reported that for“every percentage point of GDP growth in the election year, [the major incum-bent] party stands to gain 1.4 per cent of the vote” (Wilkin et al 1997:307). Theirfitting conclusion was that “regardless of the complexities of the politicalcontext—whether it is fragmented party systems, coalition governments, dividedcontrol, or lack of party cohesion—voters around the world find a way of translat-ing economic demands into partisan support” (Wilkin et al 1997:314).
SUMMARY AND CONCLUSION
Economics and elections form a tight weave. When anchoring economic threadssnag, governments can fall. We have reviewed these interlacings at the macro andmicro levels, in the electorate and in the elector. Electorates, the “nation as voter,”are strongly affected by global economic fluctuations, real and perceived. Forall democratic nations that have received a reasonable amount of study, plausibleeconomic indicators, objective or subjective, can be shown to account for muchof the variance in government support. In multivariate competition, controllingfor other aggregate issue measures, the economic indicators hold their own. In-deed, the savvy modeler, given the choice of only one predictor, would do wellto select an economic measure. Which one? The answer varies from countryto country. It could be unemployment, inflation, or growth, perhaps measuredperceptively, perhaps at a lag. That measurement variability is not a theoreticalweakness. Rather, it incorporates, as it should, the institutional history of eco-nomic performance and statistical reporting in that particular country. Also, it isin harmony with the value of specifying political context, as is done in the posi-tive cross-national studies. Electoral institutions, which shape the distribution ofpolitical economic responsibility in a nation, can affect much. Where governmentis led by one party, rather than several in coalition, the economy-polity link isespecially firm.
The powerful relationship between the economy and the electorate in democ-racies the world over comes from the economic responsiveness of the electors,the individual voters. Among the issues on the typical voter’s agenda, none ismore consistently present, nor generally has a stronger impact, than the econ-omy. Citizen dissatisfaction with economic performance substantially increasesthe probability of a vote against the incumbent. In a sense, it is even more impor-tant than long-term factors such as partisan identification, because of its greatervolatility. Opinion on economic performance—satisfied versus dissatisfied—canalter dramatically from one election to the next, whereas party identification andother long-term forces change little. Thus, the fall of a government is more likelyto come from a shift in economic evaluations than from a shift in party attachments.
What is the psychology of the economic vote? The classic reward-punishmentmodel appears sound. Voters, regardless of the democracy in which they live,
Ann
u. R
ev. P
olit.
Sci
. 200
0.3:
183-
219.
Dow
nloa
ded
from
arj
ourn
als.
annu
alre
view
s.or
gby
Uni
vers
ity o
f A
rizo
na L
ibra
ry o
n 01
/10/
09. F
or p
erso
nal u
se o
nly.
P1: FRD
April 18, 2000 17:41 Annual Reviews AR097-09
?212 LEWIS-BECK ¥ STEGMAIER
assess national economic conditions and reward or punish the politicians respon-sible for those conditions. When judging the economy, they tend to look at multipleindicators rather than a single one (e.g. only unemployment) and arrive finally at asummary view. That view is subjective; it comes from an internal calculus that mayuse unique weights, and it is based on impressions from various sources, as well ason hard numbers from statistical reports. For example, a voter may decide that theeconomy has done badly over the last year. This collective retrospective judgmentwill tend to produce a vote against a party in government. Moreover, economicvoters are not naive. They discern when a party is more clearly responsible foreconomic policy, and adjust the likelihood of their sanction accordingly. Further,they are capable of prospective judgments on party promises, in conjunction withretrospective judgments of party performance.
We have evaluated the evidence from economics and elections research, drawnconclusions about the state of our knowledge, and provided a depiction of theeconomic voter. We have covered much, but space limitations prevented us fromcovering everything. This review has focused on national (i.e. presidential, leg-islative) elections, to the exclusion of gubernatorial, state, primary, or local elec-tions (Simon et al 1991, Lewis-Beck & Rice 1992:ch. 7, Bowler & Donovan1994, Mondardi 1994, Partin 1995, J´erome & Lewis-Beck 1999). The dependentvariable of vote was always about party or candidate share, never vote turnout(Rosenstone 1982, Pacek & Radcliff 1995, Southwell 1996). The overarchinghypothesis tested was the symmetric reward or punishment of the incumbent. Theidea that economic voting is asymmetric, with mostly punishment and little reward(or vice versa), was not pursued (Bloom & Price 1975, Lewis-Beck 1988:ch. 5,Radcliff 1994). Nor was the policy-oriented hypothesis pursued. It stresses thatthe economic voter favors a different party for different problems, e.g. Democratsare considered better at dealing with unemployment, regardless of incumbency sta-tus (Weatherford 1978, Kiewiet 1983:99, Parker 1986, Hibbs 1992). This missingliterature is not huge, but it does exist.
What should the agenda for future research be? Since economic voters actlargely on their perceptions of the national economy, it is important to know whatthey actually know about the economy. Data on the economic information ofthe average voter are being gathered, but more work should be done (Holbrook &Garand 1996, Blendon et al 1997, Paldam & Nannestad 2000). Because a good dealof the average voter’s economic information must come from the media, establish-ing these media connections is in order (Behr & Iyengar 1985, Mutz 1994, Goidel& Langley 1995, Hetherington 1996, Holbrook 1996a, Haller & Norpoth 1997).This work, and actually almost all extant economic voting research, assumes themost relevant evaluation dimension is global economic output, i.e. “How is thenation’s economy doing?” But economic distribution may be an emerging relevantdimension. That is, what are the electoral effects of rising income inequality andinsecurity? We can cite no published scientific paper on that exciting question. An-other area where little research has been done is the impact of electoral institutions
Ann
u. R
ev. P
olit.
Sci
. 200
0.3:
183-
219.
Dow
nloa
ded
from
arj
ourn
als.
annu
alre
view
s.or
gby
Uni
vers
ity o
f A
rizo
na L
ibra
ry o
n 01
/10/
09. F
or p
erso
nal u
se o
nly.
P1: FRD
April 18, 2000 17:41 Annual Reviews AR097-09
?ECONOMIC DETERMINANTS OF ELECTORAL OUTCOMES 213
on economic voting within single countries. The French research is suggestive andsignals possibilities for work in other countries. Within Europe generally, thereis also the question of the effects of the European Union on economic voting na-tionally and for the European Parliament. Finally, little is known about economicvoting in Third World countries (although this is changing, as the papers reviewedhere attest). One imagines that the reward-punishment paradigm can be extendedto transitional democracies in Africa, for example. However, different dimensions,such as economic globalization, may emerge as more important. In fact, in thelong run, increasing globalization may change the character of economic votingin western nations as well.
Visit the Annual Reviews home page at www.AnnualReviews.org
LITERATURE CITED
Abramowitz A. 1988. An improved model forpredicting presidential election outcomes.PS21:843–47
Abramowitz A. 1996. Bill and Al’s excellentadventure: forecasting the 1996 presidentialelection.Am. Polit. Q.24:434–42
Abramowitz A, Segal J. 1986. Determinants ofthe outcomes of Senate elections.J. Polit.48:433–40
Alesina A, Londregan J, Rosenthal H. 1993.A model of the political economy of theUnited States.Am. Polit. Sci. Rev.87:12–33
Alvarez RM, Nagler J. 1995. Economics, issuesand the Perot candidacy: voter choice in the1992 presidential elections.Am. J. Polit. Sci.39:714–44
Alvarez RM, Nagler J. 1998. Economics, enti-tlements, and social issues: voter choice inthe 1996 presidential election.Am. J. Polit.Sci.42:1349–63
Anderson CJ. 1995.Blaming the Government:Citizens and the Economy in Five EuropeanDemocracies.Armonk, NY: Sharpe
Anderson CJ. 2000. Economic voting and po-litical context: a comparative perspective.Electoral Stud. In press
Anderson CJ, Ishii J. 1997. The political econ-omy of election outcomes in Japan.Br. J.Polit. Sci.27:619–30
Anderson L, Lewis-Beck MS, Stegmaier M.
2000. Post-socialist democratization: a com-parative political economy model of the votefor Hungary and Nicaragua.Studiji Politolo-hichnoho Tsentru Geneza. Lviv, Ukraine: Inpress
Arcelus F, Meltzer AH. 1975. The effects ofaggregate economic variables on congres-sional elections.Am. Polit. Sci. Rev.69:1232–40
Beck N. 1991. The economy and presidentialapproval: an information theoretic perspec-tive. See Norpoth et al 1991, pp. 85–102
Behr R, Iyengar S. 1985. Television news, real-world cues, and changes in the public agenda.Public Opin. Q.49:38–57
Bellucci P. 1991. Italian economic voting: a de-viant case or making a case for a better the-ory?, 1953–1979. See Norpoth et al 1991, pp.63–84
Blendon RJ, Benson JM, Brodie M, Morin R,Altman DE, et al. 1997. Bridging the gapbetween the public’s and economists’ viewsof the economy.J. Polit. Econ. Persp.11(3):105–18
Bloom H, Price D. 1975. Voter response toshort-run economic conditions: the asym-metric effect of prosperity and recession.Am.Polit. Sci. Rev.69:124–54
Borre O. 1997. Economic voting in Danish elec-toral surveys 1987–1994.Scand. Polit. Stud.20(4):347–65
Ann
u. R
ev. P
olit.
Sci
. 200
0.3:
183-
219.
Dow
nloa
ded
from
arj
ourn
als.
annu
alre
view
s.or
gby
Uni
vers
ity o
f A
rizo
na L
ibra
ry o
n 01
/10/
09. F
or p
erso
nal u
se o
nly.

P1: FRD
April 18, 2000 17:41 Annual Reviews AR097-09
?214 LEWIS-BECK ¥ STEGMAIER
Bowler S, Donovan T. 1994. Economic condi-tions and voting on ballot propositions.Am.Polit. Q.22:27–40
Brophy-Baermann M. 1994. Economics andelections: the Mexican case.Soc. Sci. Q.75:125–35
Brown RD, Woods JA. 1991. Toward a model ofcongressional elections.J. Polit.53:454–73
Campbell J. 1986. Forecasting the 1986 mid-term elections to the House of Representa-tives.PS:83–87
Campbell J. 1996. Polls and votes: the trial-heatpresidential election forecasting model, cer-tainty, and political campaigns.Am. Polit. Q.24:408–33
Campbell J, Garand J, eds. 2000.Before theVote: Forecasting American National Elec-tions. Thousand Oaks, CA: Sage
Campbell J, Wink K. 1990. Trial-heat forecastsof the presidential vote.Am. Polit. Q.18:251–69
Chappell H, Keech W. 1985. A new view of po-litical accountability of economic perfor-mance.Am. Polit. Sci. Rev.79:10–27
Chappell H, Keech W. 1991. Explaining aggre-gate evaluations of economic performance.See Norpoth et al 1991, pp. 207–20
Chappell H, Veiga LG. 2000. Economics andelections in Western Europe: 1960–1997.Electoral Stud.19: In press
Chrystal KA, Alt JE. 1981. Some problems informulating and testing a politico-economicmodel of the United Kingdom.Econ. J.91:730–36
Clarke H, Kornberg A. 1992. Support for theCanadian Federal Progressive ConservativeParty since 1988: the impact of economicevaluations and economic issues.Can. J.Polit. Sci.25:29–53
Clarke H, Stewart M. 1994. Prospections, ret-rospections, and rationality: the “bankers”model of presidential approval.Am. J. Polit.Sci.38:104–23
Clarke H, Stewart M. 1995. Economic evalua-tions, prime ministerial approval and govern-ing party support: rival models considered.Br. J. Polit. Sci.25:145–70
Clarke H, Stewart M, Whiteley P. 1997. Torytrends: party identification and the dynam-ics of conservative support since 1992.Br. J.Polit. Sci.27:299–319
Clarke H, Stewart M, Zuk G. 1986. Politics,economics and party popularity in Britain,1979–1983.Electoral Stud.5:123–41
Colton TJ. 1996. Economics and voting in Rus-sia.Post-Soviet Aff.12(4):289–317
Downs A. 1957.An Economic Theory of Demo-cracy. New York: Harper & Row
Dunleavy P, Husbands CT. 1985.British Demo-cracy at the Crossroads: Voting and PartyCompetition in the 1980s. London: Allen &Unwin
Erikson RS. 1989. Economic conditions and thepresidential vote.Am. Polit. Sci. Rev.83(2):568–73
Erikson RS. 1990. Economic conditions andthe congressional vote: a review of themacrolevel evidence.Am. J. Polit. Sci.34:373–99
Erikson RS, MacKuen MB, Stimson JA. 2000.Bankers or peasants revisited: economic ex-pectations and presidential approval.Elec-toral Stud.19: In press
Eulau H, Lewis-Beck MS, eds. 1985.Econo-mic Conditions and Electoral Outcomes:The United States and Western Europe. NewYork: Agathon
Fair R. 1978. The effect of economic events onvotes for president.Rev. Econ. Stat.60:159–73
Fair R. 1982. The effect of economic events onvotes for president: 1980 results.Rev. Econ.Stat.63:322–25
Fair R. 1988. The effect of economic events onvotes for president: 1984 update.Polit. Be-hav.10:168–77
Fair R. 1996. Econometrics and presidentialelections.J. Polit. Econ. Persp.10:89–102
Fauvelle-Aymar C, Lewis-Beck MS. 1997.L’Iowa donne l’opposition gagnante.Libe-ration 4978(23 mai):15
Feld LP, Kirchgassner G. 2000. Official andhidden unemployment and the popularityof government: an econometric analysis of
Ann
u. R
ev. P
olit.
Sci
. 200
0.3:
183-
219.
Dow
nloa
ded
from
arj
ourn
als.
annu
alre
view
s.or
gby
Uni
vers
ity o
f A
rizo
na L
ibra
ry o
n 01
/10/
09. F
or p
erso
nal u
se o
nly.

P1: FRD
April 18, 2000 17:41 Annual Reviews AR097-09
?ECONOMIC DETERMINANTS OF ELECTORAL OUTCOMES 215
the Kohl government.Electoral Stud.19: Inpress
Fidrmuc J. 2000. Economics of voting in post-communist countries.Electoral Stud.In press
Fiorina M. 1978. Economic retrospective vot-ing in American national elections: a micro-analysis.Am. J. Polit. Sci.22:426–43
Fiorina M. 1981.Retrospective Voting in Amer-ican National Elections. New Haven, CT:Yale Univ. Press
Frey BS, Schneider F. 1978a. An empiricalstudy of politico-economic interaction in theU.S.Rev. Econ. Stat.60:174–83
Frey BS, Schneider F. 1978b. A politico-breakeconomic model of the United Kingdom.Econ. J.88:243–53
Goidel RK, Langley RE. 1995. Media cover-age of the economy and aggregate economicevaluations: uncovering evidence of indirectmedia effects.Polit. Res. Q.48:313–28
Golden D, Poterba J. 1980. The price of pop-ularity: the political business cycle reexam-ined. Am. J. Polit. Sci.24:696–714
Goodhart CAE, Bhansali RJ. 1970. Politicaleconomy.Polit. Stud.18:43–106
Goodman S, Kramer G. 1975. Comment onArcelus and Meltzer, the effect of aggregateeconomic conditions on congressional elec-tions.Am. Polit. Sci. Rev.69:1255–65
Haller HB, Norpoth H. 1997. Reality bites:news exposure and economic opinion.Pub-lic Opin. Q.61:555–75
Hetherington M. 1996. The media’s role informing voters’ national economic evalua-tions in 1992.Am. J. Polit. Sci.40:372–95
Hibbing J. 1987. On the issues surrounding eco-nomic voting: looking to the British case foranswers.Comp. Polit. Stud.20:3–33
Hibbing J, Alford J. 1982. Economic conditionsand the forgotten side of congress: a forayin U.S. Senate elections.Br. J. Polit. Sci.12:505–13
Hibbs DA. 1982. President Reagan’s mandatefrom the 1980 elections: a shift to the right?Am. Polit. Q.10:387–420
Hibbs DA. 1987.The American Political Eco-nomy: Macroeconomics and Electoral Poli-
tics. Cambridge, MA: Harvard Univ. PressHibbs DA. 1992. Partisan theory after fifteen
years.Eur. J. Polit. Economy8:361–73Hibbs DA. 1993.Solidarity or Egoism? Aar-
hus, Denmark: Aarhus Univ. PressHibbs D, Rivers D, Vasilatos N. 1982. On the
demand for economic outcomes: macroeco-nomic performance and mass political sup-port in the United States, Great Britain, andGermany.J. Polit.43:426–62
Hoffman S. 1992. Delusions of world order.NYRev. Books39(7):37–43
Holbrook T. 1996a.Do Campaigns Matter?Thousand Oaks, CA: Sage
Holbrook T. 1996b. Reading the political tealeaves: a forecasting model of contemporarypresidential elections.Am. Polit. Q.24:506–19
Holbrook T, Garand J. 1996. Homo economus?Economic information and economic voting.Polit. Res. Q.49:351–75
Irwin G, Van Holsteyn J. 1997. Where to gofrom here? Revamping electoral politics inthe Netherlands.West Eur. Polit.20(2):93–118
Jacobson GC. 1989. Strategic politicians andthe dynamics of U.S. House elections, 1946–86.Am. Polit. Sci. Rev.83:773–93
Jerome B, Jerome V, Lewis-Beck MS. 1999.Polls fail in France: forecasts of the 1997legislative election.Int. J. Polit. Forecasting15:175–84
Jerome B, Lewis-Beck MS. 1999. Is local pol-itics local? French evidence.Eur. J. Polit.Res.35(March):181–97
Kenski H. 1977. The impact of economic con-ditions on presidential popularity.J. Polit.39:764–73
Kernell S. 1978. Explaining presidential popu-larity. Am. Polit. Sci. Rev.71:44–66
Key VO. 1964.Politics, Parties, and PressureGroups.New York: Crowell. 5th ed.
Key VO. 1966. The Responsible Electorate.New York: Vintage
Kiewiet DR. 1983.Macroeconomics and Mi-cropolitics: The Electoral Effects of Econo-mic Issues. Chicago: Univ. Chicago Press
Ann
u. R
ev. P
olit.
Sci
. 200
0.3:
183-
219.
Dow
nloa
ded
from
arj
ourn
als.
annu
alre
view
s.or
gby
Uni
vers
ity o
f A
rizo
na L
ibra
ry o
n 01
/10/
09. F
or p
erso
nal u
se o
nly.
P1: FRD
April 18, 2000 17:41 Annual Reviews AR097-09
?216 LEWIS-BECK ¥ STEGMAIER
Kiewiet DR, Rivers D. 1985. A retrospectiveon retrospective voting. InEconomic Condi-tions and Electoral Outcomes: The UnitedStates and Western Europe, ed. H Eulau, MSLewis-Beck, pp. 207–31
Kiewiet DR, Udell M. 1998. Twenty-five yearsafter Kramer: an assessment of economic ret-rospective voting based upon improved esti-mates of income and unemployment.Econ.Polit. 10:219–48
Kinder D, Adams G, Gronke PW. 1989. Eco-nomics and politics in the 1984 Ameri-can presidential election.Am. J. Polit. Sci.33:491–515
Kinder D, Kiewiet DR. 1979. Economic dis-content and political behavior: the role ofpersonal grievances and collective economicjudgements in congressional voting.Am. J.Polit. Sci.23:495–527
Kinder D, Kiewiet DR. 1981. Sociotropic pol-itics: the American case.Br. J. Polit. Sci.11(April):129–41
Kramer G. 1971. Short-term fluctuations in U.S.voting behavior, 1896–1964.Am. Polit. Sci.Rev.65:131–43
Kramer G. 1983. The ecological fallacy revis-ited: aggregate- versus individual-level find-ings on economics and elections, and so-ciotropic voting.Am. Polit. Sci. Rev.77:92–111
Lafay JD. 1985. Important political changeand the stability of the popularity func-tion: before and after the French gen-eral election of 1981. InEconomic Condi-tions and Electoral Outcomes: The UnitedStates and Western Europe. ed. H Eulau,MS Lewis-Beck, pp. 78–97. New York:Agathon
Lafay JD. 1991. Political dyarchy and popular-ity functions: lessons from the 1986 Frenchexperience. See Norpoth et al 1991, pp. 123–39
Lafay. JD 1993. Les pr´evisions des mod`elespolitico-economiques.Figaro (19 mars):IX
Lafay JD, Servais M. 1995. Des sondages pr´ee-lectoraux aux mod`eles politico-econometri-ques.Figaro(4 mai):XV
Lancaster T, Lewis-Beck MS. 1989. Regionalvote support: the Spanish case.Int. Stud. Q.33:29–43
Lanoue DJ. 1994. Retrospective and prospec-tive voting in presidential-year elections.Polit. Res. Q.47:193–205
Lecaillon J. 1981. Popularit´e des gouverne-ments et popularit´e economique.Consum-mation3:17–50
Lewis-Beck MS. 1980. Economic conditionsand executive popularity: the French expe-rience.Am. J. Polit. Sci.24:306–23
Lewis-Beck MS. 1986. Comparative economicvoting: Britain, France, Germany, Italy.Am.J. Polit. Sci.30:315–46
Lewis-Beck MS. 1985. Pocketbook voting inUS national election studies: fact or artifact?Am. J. Polit. Sci.29:348–56
Lewis-Beck MS. 1988.Economics and Elec-tions: The Major Western Democracies. AnnArbor: Univ. Michigan Press
Lewis-Beck MS. 1995. Comparaison de pr´evi-sion des ´elections pr´esidentielles en France etauxEtats-Unis.J. Societe Stat. Paris136(1):29–45
Lewis-Beck MS. 1997. Who’s the chief? Eco-nomic voting under a dual executive.Eur. J.Polit. Res.31(3):315–25
Lewis-Beck MS, Mitchell G. 1990. Modelostransnacionales de voto economico: estudiode un conjunto de paises europeos.RevistaInst. Estud. Econ.4:65–81
Lewis-Beck MS, Nadeau R. 2000. French elec-toral institutions and the economic vote.Electoral Stud.19: In press
Lewis-Beck MS, Rice T. 1984. ForecastingU.S. House elections.Legis. Stud. Q.9:475–86
Lewis-Beck MS, Rice T. 1992.ForecastingElections.Washington, DC: CongressionalQuarterly Press
Lewis-Beck MS, Tien C. 1996. The future inforecasting: prospective presidential models.Am. Polit. Q.24:468–91
Lockerbie B. 1991. Prospective economic vot-ing in U.S. House elections, 1956–1988.Legis. Stud. Q.16:239–61
Ann
u. R
ev. P
olit.
Sci
. 200
0.3:
183-
219.
Dow
nloa
ded
from
arj
ourn
als.
annu
alre
view
s.or
gby
Uni
vers
ity o
f A
rizo
na L
ibra
ry o
n 01
/10/
09. F
or p
erso
nal u
se o
nly.

P1: FRD
April 18, 2000 17:41 Annual Reviews AR097-09
?ECONOMIC DETERMINANTS OF ELECTORAL OUTCOMES 217
Lockerbie B. 1992. Prospective voting in pres-idential elections, 1956–1988.Am. Polit. Q.20:308–25
MacKuen M, Erikson R, Stimson J. 1992. Peas-ants or bankers? The American electorateand the U.S. economy.Am. Polit. Sci. Rev.86:597–611
Markus G. 1988. The impact of personal andnational economic conditions on the presi-dential vote: a pooled cross-sectional analy-sis.Am. J. Polit. Sci.32:137–54
Markus G. 1992. The impact of personal andnational economic conditions on presiden-tial voting, 1956– 1988.Am. J. Polit. Sci.36:829–34
Marra RF, Ostrom CW. 1989. Explaining seatchange in the U.S. House of Representatives,1950–1986.Am. J. Polit. Sci.33:541–69
Miller WL, Mackie M. 1973. The electoral cy-cle and the asymmetry of government and theopposition popularity: an alternative modelof the relationship between economic con-ditions and political popularity.Polit. Stud.621:263–79
Mondardi F. 1994. Primary voters as retrospec-tive voters.Am. Polit. Q.22:88–103
Monroe KR. 1978. Economic influences onpresidential popularity.Public Opin. Q.42:360–69
Monroe KR. 1984.Presidential Popularity andthe Economy. New York: Praeger
Mosley P. 1978. Images of the “floating voter”:or the “political business cycle” revisited.Polit. Stud.26:375–94
Mueller J. 1970. Presidential popularity fromTruman to Johnson.Am. Polit. Sci. Rev.64:18–34
Mueller J. 1973.War, Presidents, and PublicOpinion. New York: Wiley
Mutz D. 1994. Contextualizing personal expe-rience: the role of the mass media.J. Polit.56:689–715
Nadeau R, Blais A. 1993. Explaining electionsoutcomes in Canada: economy and politics.Can. J. Polit. Sci.26:775–90
Nannestad P, Paldam M. 1994. The VP func-tion: a survey of the literature on vote and
popularity functions after 25 years.PublicChoice79:213–45
Nannestad P, Paldam M. 1995. It’s the govern-ment’s fault! A cross-section study of eco-nomic voting in Denmark, 1990/93.Eur. J.Polit. Res.28:33–62
Nannestad P, Paldam M. 1997. From the pock-etbook of the welfare man: a pooled cross-section study of economic voting in Den-mark, 1986–1992.Br. J. Polit. Sci.27:119–37
Nannestad P, Paldam M. 2000. Into Pandora’sbox of economic evaluations. A study ofthe Danish macro VP-function 1986–1997.Electoral Stud.19: In press
Norpoth H. 1985. Politics, economics and thecycle of presidential popularity. InEco-nomics and Electoral Outcomes, ed. H Eu-lau, MS Lewis-Beck, pp. 167–86. New York:Agathon
Norpoth H. 1987. Guns and butter and govern-ment popularity in Great Britain.Am. Polit.Sci. Rev.81:949–60
Norpoth H. 1996a. The economy. InCompar-ing Democracies: Elections and Voting inGlobal Perspective, ed. L LeDuc, RG Niemi,P Norris, pp. 299–318. Thousand Oaks, CA:Sage
Norpoth H. 1996b. Presidents and the prospec-tive voter.J. Polit.58:776–92
Norpoth H. 1996c. Of time and candidates: aforecast for 1996.Am. Polit. Q.24:443–67
Norpoth H, Lewis-Beck MS, Lafay JD. 1991.Economics and Politics: The Calculus ofSupport. Ann Arbor: Univ. Michigan Press
Oppenheimer B, Stimson J, Waterman R. 1986.Interpreting U.S. congressional elections: theexposure thesis.Legis. Stud. Q.11:227–47
Pacek AC. 1994. Macroeconomic conditionsand electoral politics in East Central Europe.Am. J. Polit. Sci.38:723–44
Pacek AC, Radcliff B. 1995. Economic votingand the welfare state: a cross-national anal-ysis.J. Polit.57:44–61
Paldam M. 1991. How robust is the vote func-tion? A study of seventeen nations over fourdecades. See Norpoth et al 1991, pp. 9–32
Ann
u. R
ev. P
olit.
Sci
. 200
0.3:
183-
219.
Dow
nloa
ded
from
arj
ourn
als.
annu
alre
view
s.or
gby
Uni
vers
ity o
f A
rizo
na L
ibra
ry o
n 01
/10/
09. F
or p
erso
nal u
se o
nly.

P1: FRD
April 18, 2000 17:41 Annual Reviews AR097-09
?218 LEWIS-BECK ¥ STEGMAIER
Paldam M, Nannestad P. 2000. What do votersknow about the economy? A study of Dan-ish data, 1990–1993.Electoral Stud.19: Inpress
Paldam M, Schneider F. 1980. The macro-economic aspects of government and opposi-tion popularity in Denmark 1957–1978.Natl.Økonomisk Tidsskrift118:149–70
Parker G. 1986. Economic partisan advantagesin congressional contests: 1938–1978.Pub-lic Opin. Q.50:387–401
Partin R. 1995. Economic conditions and gu-bernatorial elections: is the state executiveheld accountable?Am. Polit. Q. 23:81–95
Pissarides CA. 1980. British government pop-ularity and economic performance.Econ. J.90:569–81
Powell GB, Whitten GD. 1993. A cross-nation-al analysis of economic voting: taking ac-count of the political context.Am. J. Polit.Sci.37:391–414
Powers DV, Cox JH. 1997. Echoes from thepast: the relationship between satisfactionwith economic reforms and voting behaviorin Poland.Am. Polit. Sci. Rev.91:617–33
Price S, Sanders D. 1995. Economic expecta-tions and voting intentions in the UK, 1979–1987: a pooled cross-section approach.Polit.Stud.43:451–71
Radcliff B. 1994. Reward without punishment:economic conditions and the vote.Polit. Res.Q. 47(3):721–31
Remmer KL. 1991. The political impact of eco-nomic crisis in Latin America in the 1980s.Am. Polit. Sci. Rev.85:777–800
Romero DW, Stambough SJ. 1996. Personaleconomic well-being and the individual votefor congress: a pooled analysis, 1980–1990.Polit. Res. Q.49:607–16
Rosa JJ, Amson D. 1976. Conditions ´economi-ques et elections: une analyse politico-´eco-nometrique (1920–1973).Rev. Franc¸aise Sci.Polit. 26:1101–24
Rosenbaum DE, Lohr S. 1996.NY Times.Aug 3
Rosenstone S. 1982. Economic adversity and
voter turnout.Am. J. Polit. Sci.26:25–46Sanders D. 1991. Government popularity and
the next general election.Polit. Q. 62:235–61
Sanders D. 2000. The real economy and the per-ceived economy in popularity functions: howmuch do the voters need to know?ElectoralStud.19: In press
Sanders D, Marsh D, Ward H. 1991. Macroeco-nomics, the Falklands War and the popularityof the Thatcher government: a contrary view.Br. J. Polit. Sci.20:161–84
Sanders D, Ward H, Marsh D, Fletcher T. 1987.Government popularity and the FalklandsWar: a reassessment.Br. J. Polit. Sci.17:281–313
Sears DO Lau RR. 1983. Inducing apparentlyself-interested political preferences.Am. J.Polit. Sci.27:223–52
Schneider F, Frey BS. 1988. Politico-economicmodels of macroeconomic policy: a reviewof empirical evidence. InPolitical BusinessCycles, ed. T Willett. Durham, NC: DukeUniv. Press
Simon DM, Ostrom CW, Marra RF. 1991. Thepresident, referendum voting, and subnation-al elections in the United States.Am. Polit.Sci. Rev.85:1175–92
Southwell PL. 1996. Economic salience anddifferential abstention in presidential elec-tions.Am. Polit. Q.24:221–36
Stigler G. 1973. General economic conditionsand national elections.Am. Econ. Rev. Pap.Proc.63:160–67
Suzuki M, Chappell HW. 1996. The rational-ity of economic voting revisited.J. Polit.58:224–36
Tufte ER. 1975. Determinants of the outcomesof midterm congressional elections.Am.Polit. Sci. Rev.69:812–26
Tufte ER. 1978. Political Control of theEconomy. Princeton, NJ: Princeton Univ.Press
Weatherford MS. 1978. Economic conditionsand electoral outcomes: class differences inthe political response to recession.Am. J.Polit. Sci.22:917–38
Ann
u. R
ev. P
olit.
Sci
. 200
0.3:
183-
219.
Dow
nloa
ded
from
arj
ourn
als.
annu
alre
view
s.or
gby
Uni
vers
ity o
f A
rizo
na L
ibra
ry o
n 01
/10/
09. F
or p
erso
nal u
se o
nly.

P1: FRD
April 18, 2000 17:41 Annual Reviews AR097-09
?ECONOMIC DETERMINANTS OF ELECTORAL OUTCOMES 219
Whiteley PF. 1986. Macroeconomic perfor-mance and government popularity in Britain:the short-run dynamics.Eur. J. Polit. Res.14:45–61
Wilkin S, Haller B, Norporth H. 1997. From
Argentina to Zambia: a world-wide test ofeconomic voting.Electoral Stud.16:301–16
Wlezien C, Erikson R. 1996. Temporal horizonsand presidential election forecasts.Am. Polit.Q. 24:492–505
Ann
u. R
ev. P
olit.
Sci
. 200
0.3:
183-
219.
Dow
nloa
ded
from
arj
ourn
als.
annu
alre
view
s.or
gby
Uni
vers
ity o
f A
rizo
na L
ibra
ry o
n 01
/10/
09. F
or p
erso
nal u
se o
nly.

Annual Review of Political Science Volume 3, 2000
CONTENTSPREFERENCE FORMATION, James N. Druckman, Arthur Lupia 1CONSTRUCTING EFFECTIVE ENVIRONMENTAL REGIMES, George W. Downs 25GLOBALIZATION AND POLITICS, Suzanne Berger 43ALLIANCES: Why Write Them Down, James D. Morrow 63WHEELS WITHIN WHEELS: Rethinking the Asian Crisis and the Asian Model, Robert Wade 85POST-SOVIET POLITICS, David D. Laitin 117INTERNATIONAL INSTITUTIONS AND SYSTEM TRANSFORMATION, Harold K. Jacobson 149SUCCESS AND FAILURE IN FOREIGN POLICY, David A. Baldwin 167ECONOMIC DETERMINANTS OF ELECTORAL OUTCOMES, Michael S. Lewis-Beck, Mary Stegmaier 183EMOTIONS IN POLITICS, G. E. Marcus 221THE CAUSES AND CONSEQUENCES OF ARMS RACES, Charles L. Glaser 251CONSTITUTIONAL POLITICAL ECONOMY: On the Possibility of Combining Rational Choice Theory and Comparative Politics, Schofield Norman 277FOUCAULT STEALS POLITICAL SCIENCE, Paul R. Brass 305ASSESSING THE CAPACITY OF MASS ELECTORATES, Philip E. Converse 331UNIONS IN DECLINE? What Has Changed and Why, Michael Wallerstein, Bruce Western 355THE BRITISH CONSTITUTION: Labour's Constitutional Revolution, Robert Hazell, David Sinclair 379THE CONTINUED SIGNIFICANCE OF CLASS VOTING, Geoffrey Evans 401
THE PSYCHOLOGICAL FOUNDATIONS OF IDENTITY POLITICS, Kristen Renwick Monroe, James Hankin, Renée Bukovchik Van Vechten 419ELECTORAL REALIGNMENTS, David R. Mayhew 449POLITICAL TRUST AND TRUSTWORTHINESS, Margaret Levi, Laura Stoker 475CONSOCIATIONAL DEMOCRACY, Rudy B. Andeweg 509
Ann
u. R
ev. P
olit.
Sci
. 200
0.3:
183-
219.
Dow
nloa
ded
from
arj
ourn
als.
annu
alre
view
s.or
gby
Uni
vers
ity o
f A
rizo
na L
ibra
ry o
n 01
/10/
09. F
or p
erso
nal u
se o
nly.