Embed Size (px)
Citation preview

April 17, 2015Amsterdam, Netherlands
Smart Distribution System Applications
Carl Yates, M.A.Sc., P.Eng., General Manager
Delivering Quality & Value For Over 70 Years
History of Halifax Water
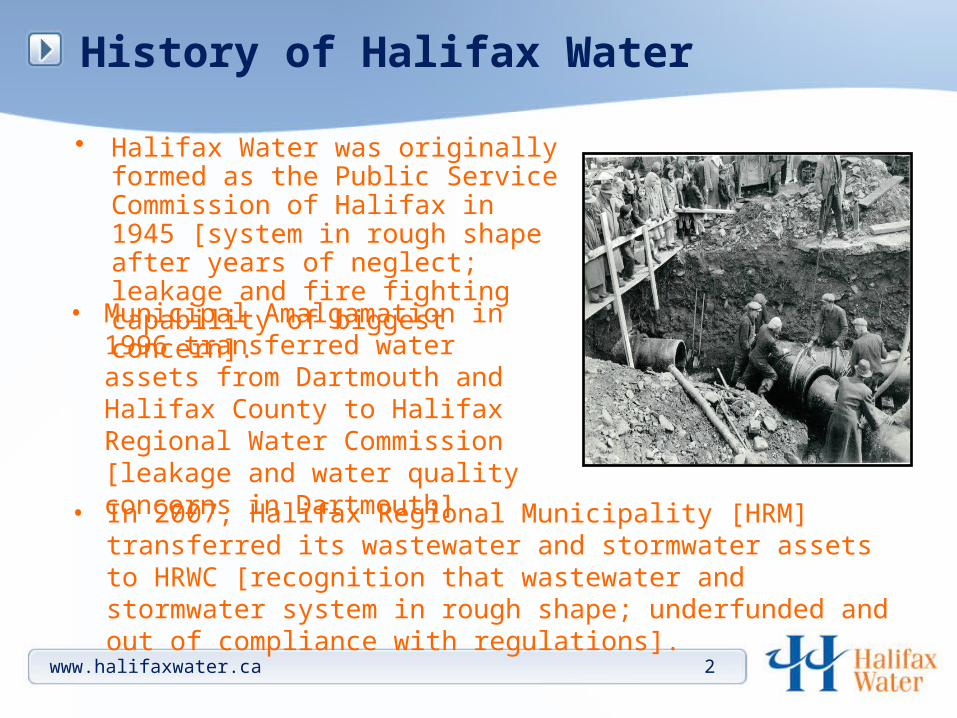
• Halifax Water was originally formed as the Public Service Commission of Halifax in 1945 [system in rough shape after years of neglect; leakage and fire fighting capability of biggest concern].
• Municipal Amalgamation in 1996 transferred water assets from Dartmouth and Halifax County to Halifax Regional Water Commission [leakage and water quality concerns in Dartmouth]
• In 2007, Halifax Regional Municipality [HRM] transferred its wastewater and stormwater assets to HRWC [recognition that wastewater and stormwater system in rough shape; underfunded and out of compliance with regulations].
www.halifaxwater.ca 2
Assets
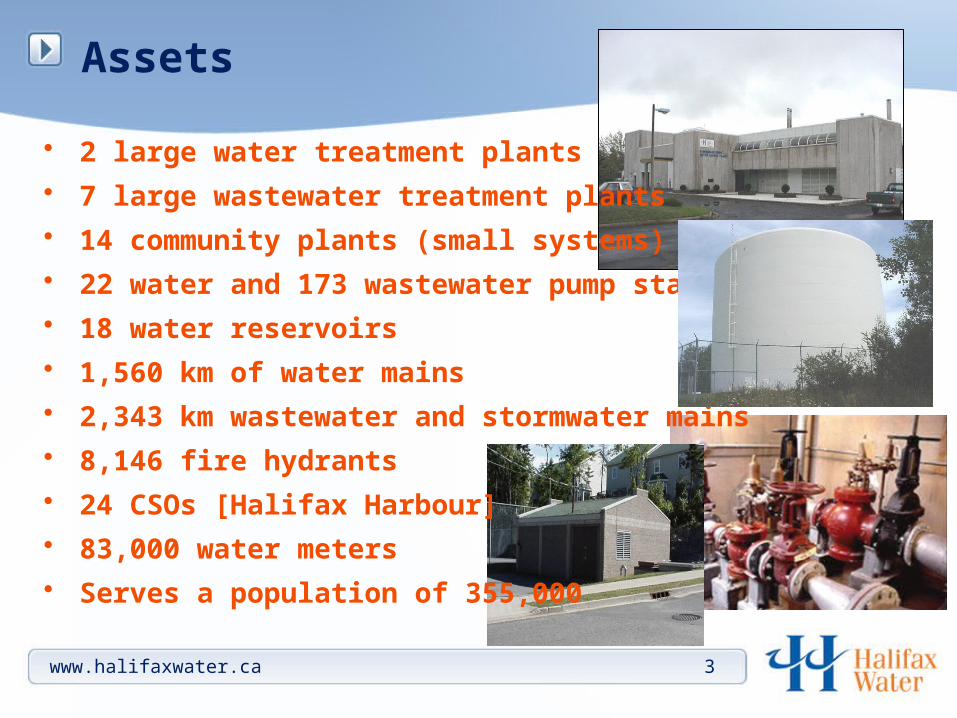
• 2 large water treatment plants
• 7 large wastewater treatment plants
• 14 community plants (small systems)
• 22 water and 173 wastewater pump stations
• 18 water reservoirs
• 1,560 km of water mains
• 2,343 km wastewater and stormwater mains
• 8,146 fire hydrants
• 24 CSOs [Halifax Harbour]
• 83,000 water meters
• Serves a population of 355,000
3www.halifaxwater.ca
Current Smart Applications
• Water Loss Control
• Advanced Pressure Management
• Water Quality - Chlorine Monitoring/Injection
• Energy Optimization/Recovery
• SCADA Upgrades
www.halifaxwater.ca 4
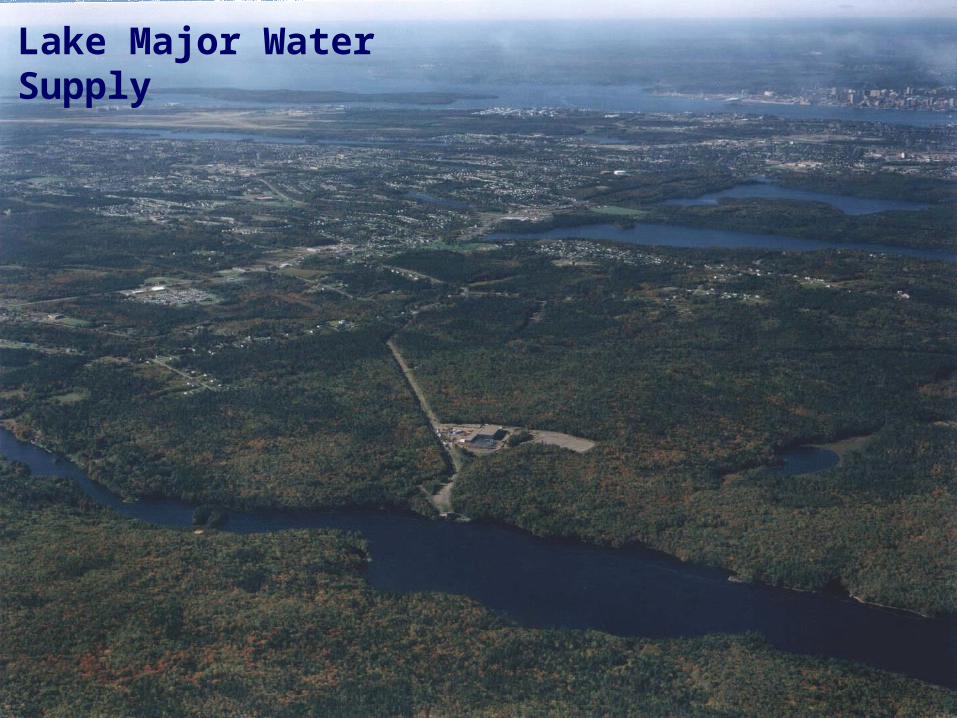
Lake Major Water Supply
Water Loss Control
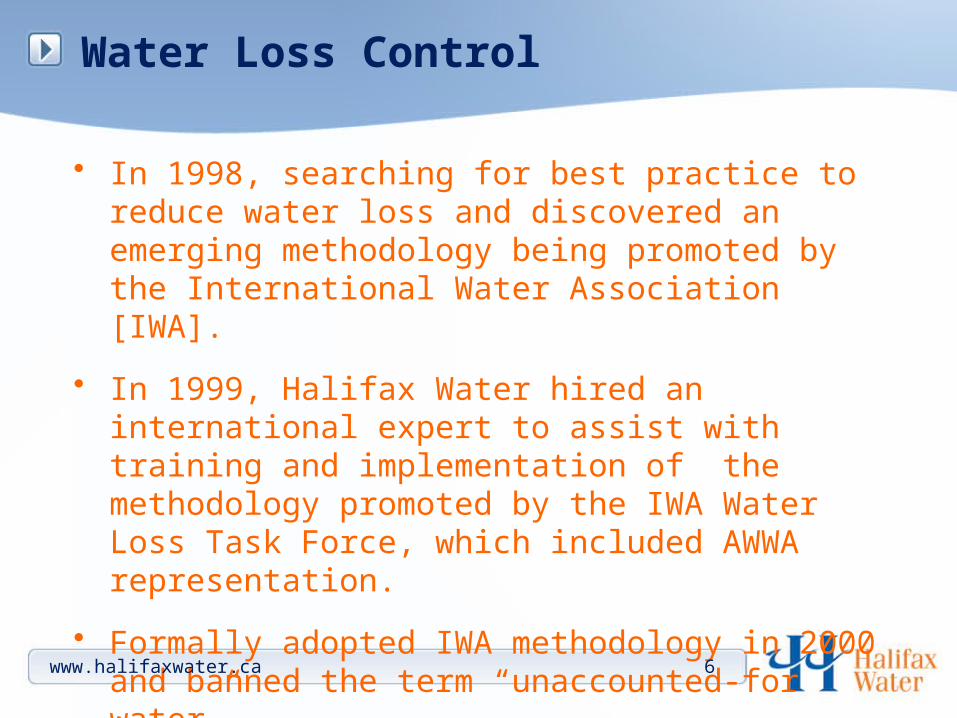
• In 1998, searching for best practice to reduce water loss and discovered an emerging methodology being promoted by the International Water Association [IWA].
• In 1999, Halifax Water hired an international expert to assist with training and implementation of the methodology promoted by the IWA Water Loss Task Force, which included AWWA representation.
• Formally adopted IWA methodology in 2000 and banned the term “unaccounted-for water”.
www.halifaxwater.ca 6
www.halifaxwater.ca 7
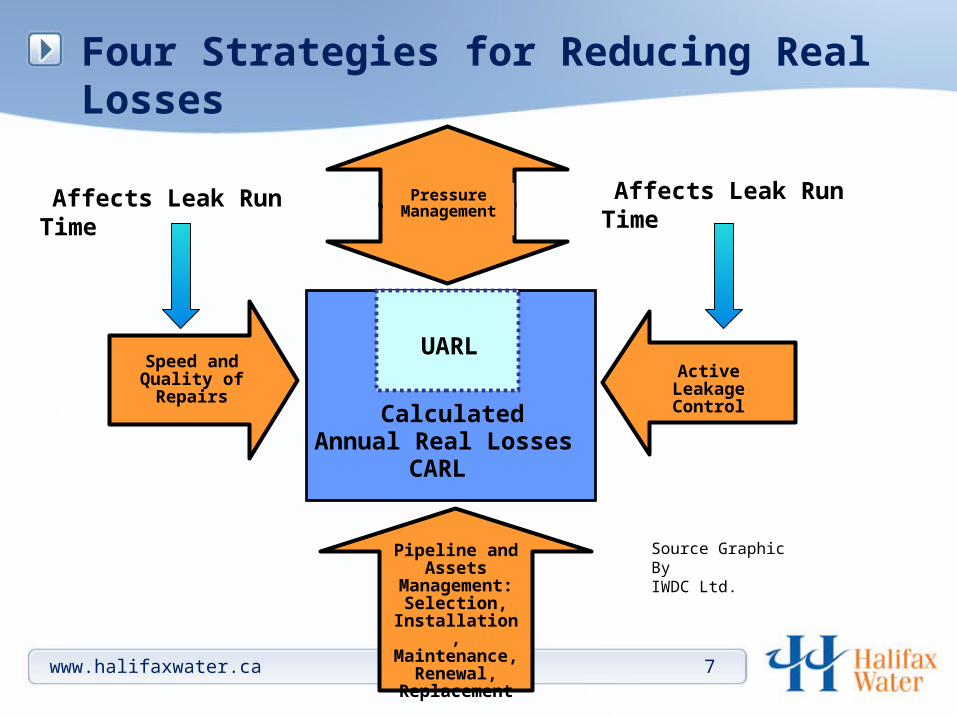
Four Strategies for Reducing Real Losses
Source Graphic ByIWDC Ltd.
Active Leakage Control
Speed andQuality of Repairs
Pipeline and Assets
Management: Selection, Installation, Maintenance, Renewal, Replacemen
t
UARL
Calculated Annual Real Losses
CARL
PressureManagemen
t
Affects Leak Run Time Affects Leak Run Time
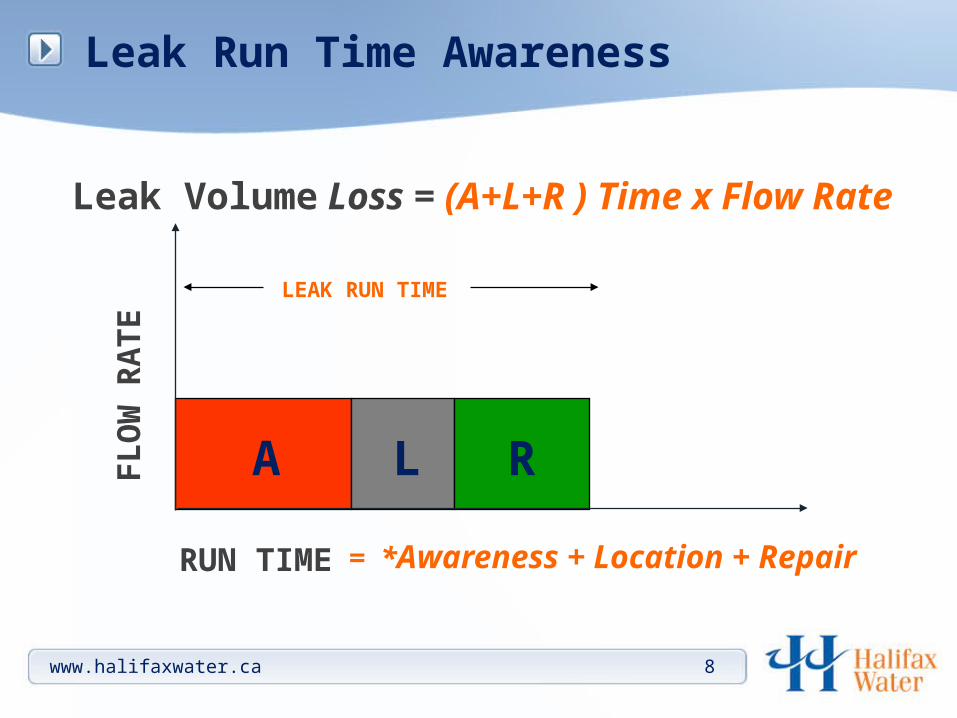
Leak Run Time Awareness
A L R
LEAK RUN TIME
FL
OW
RA
TE
RUN TIME
Leak Volume Loss = (A+L+R ) Time x Flow Rate
= *Awareness + Location + Repair
www.halifaxwater.ca 8
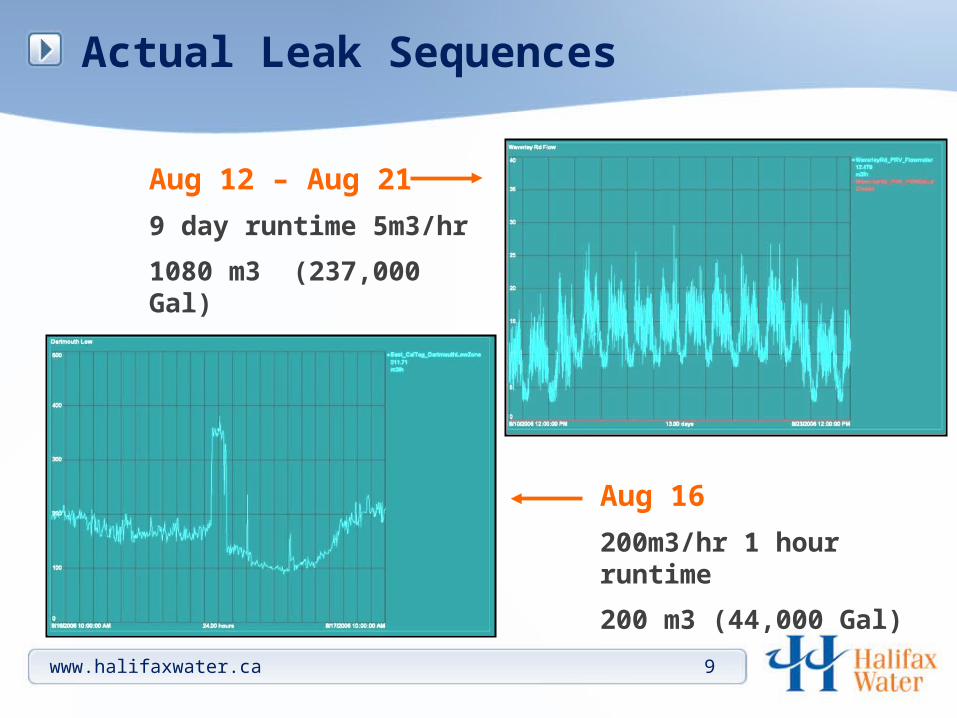
Actual Leak Sequences
Aug 12 – Aug 21
9 day runtime 5m3/hr
1080 m3 (237,000 Gal)
Aug 16
200m3/hr 1 hour runtime
200 m3 (44,000 Gal)
www.halifaxwater.ca 9
Managing Leak Run Time
www.halifaxwater.ca 10
• The key to managing leak run time for the overall reduction of real losses is awareness of and the willingness to repair leaks.
• The key is finding the leak early when it is a small
• How does a utility become aware of unreported leaks?
District Metered Areas
• District Metered Areas (DMA’s) can provide the awareness of leakage in near real time.
• Allows monitoring of leaks via SCADA
• Manageable zones in distribution system for acoustic leak detection
• Ongoing monitoring of minimum night flows [3 to 4 am in the morning]
• If you can measure it, you can manage it
www.halifaxwater.ca 11

www.halifaxwater.ca 12
www.halifaxwater.ca 13
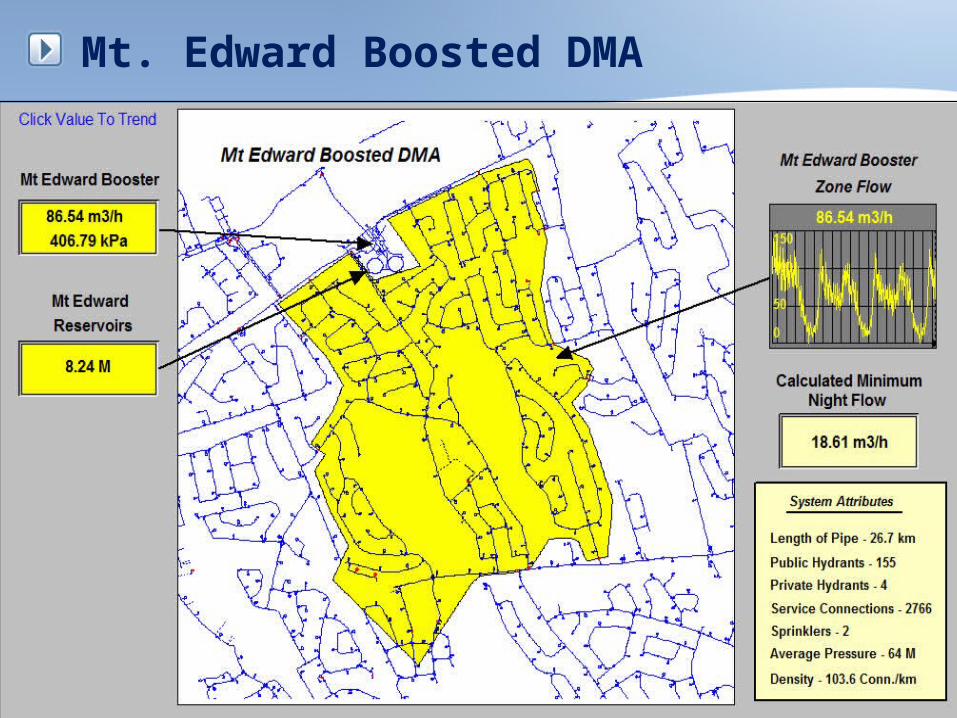
Mt. Edward Boosted DMA
www.halifaxwater.ca 14
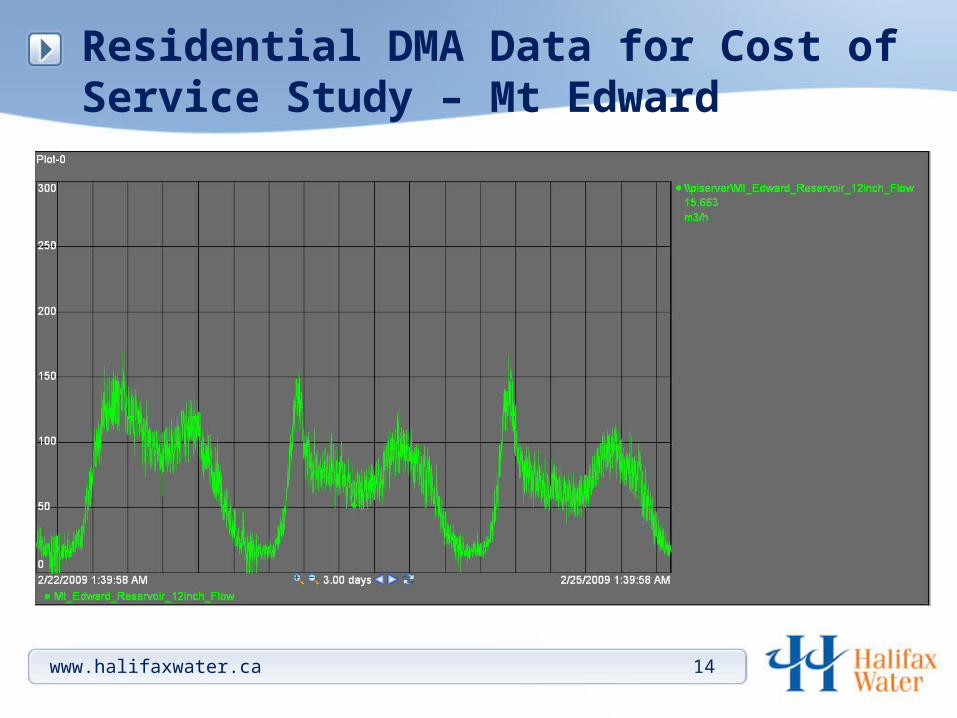
Residential DMA Data for Cost of Service Study – Mt Edward
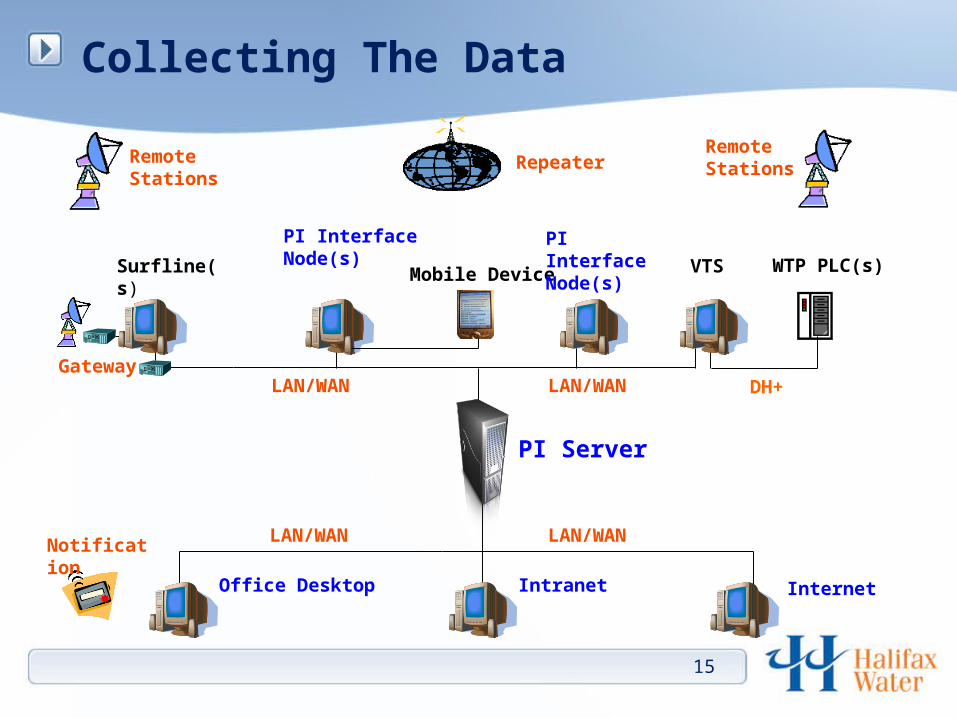
PI Server
LAN/WANLAN/WAN
Surfline(s) VTS WTP PLC(s)
Remote Stations
Notification
RepeaterRemote Stations
PI Interface Node(s)
GatewayLAN/WAN DH+
Mobile Device
15
Office Desktop Intranet Internet
LAN/WAN
PI Interface Node(s)
Collecting The Data
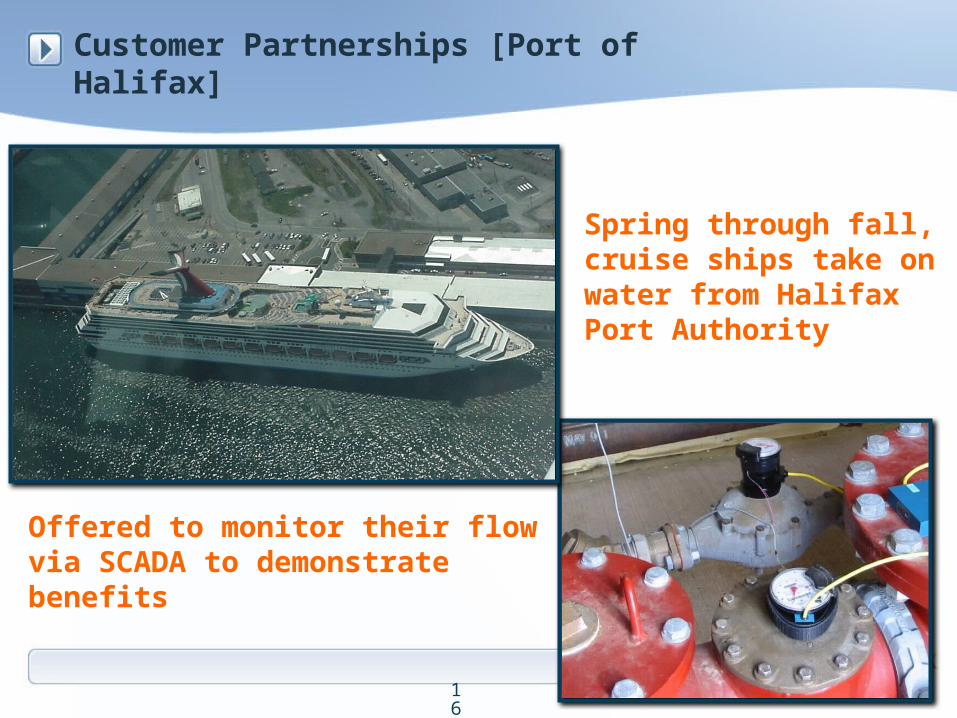
Customer Partnerships [Port of Halifax]
Offered to monitor their flow via SCADA to demonstrate benefits
Spring through fall, cruise ships take on water from Halifax Port Authority
16
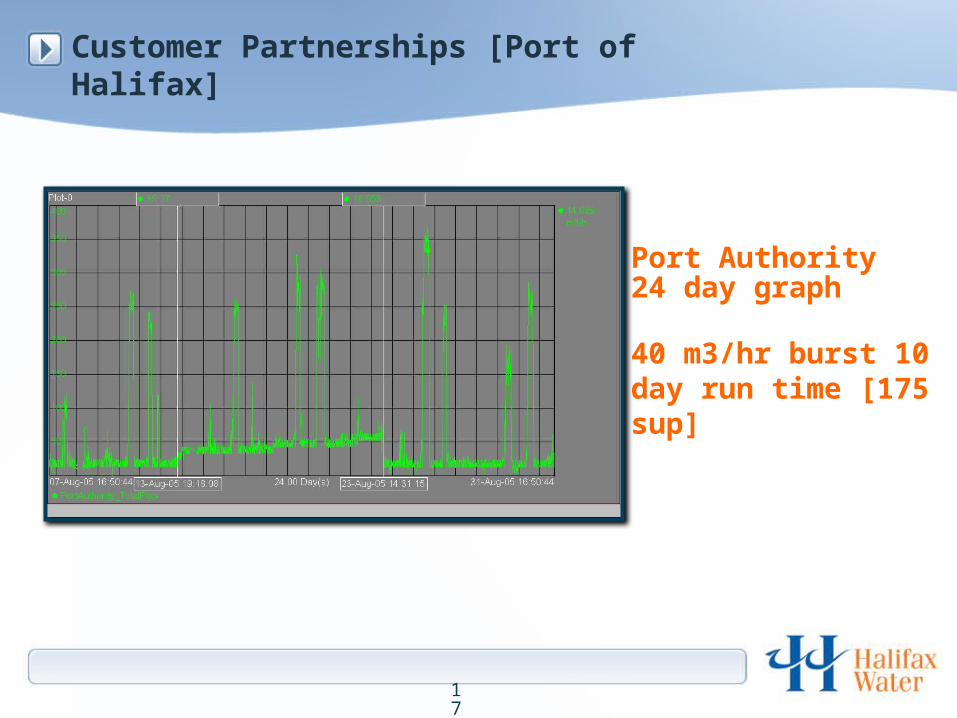
Customer Partnerships [Port of Halifax]
Port Authority 24 day graph
40 m3/hr burst 10 day run time [175 sup]
17
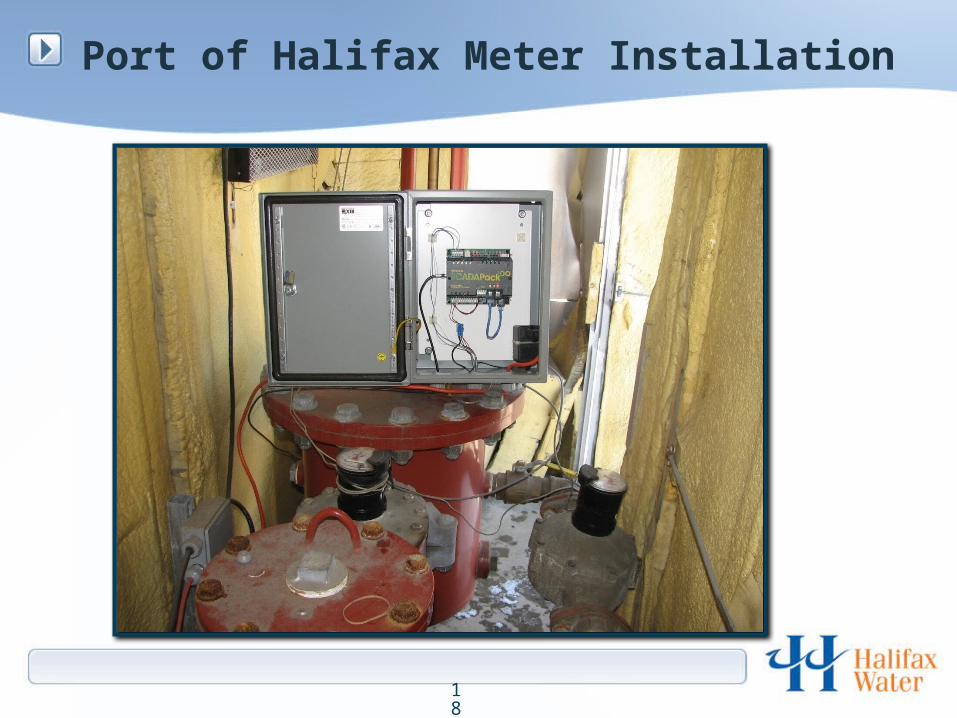
Port of Halifax Meter Installation
18
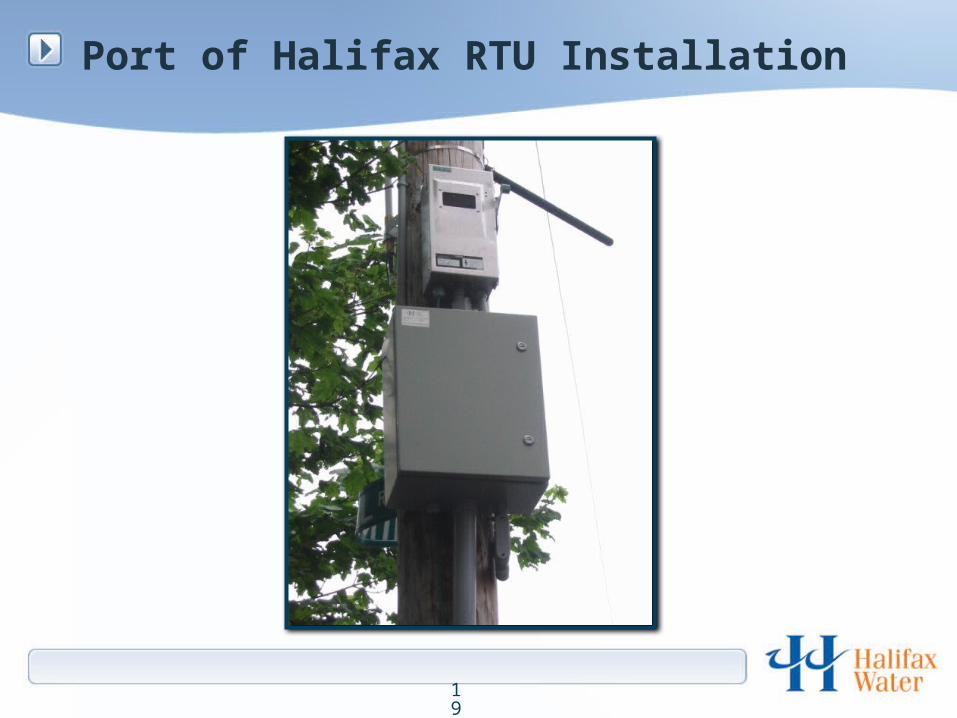
Port of Halifax RTU Installation
19
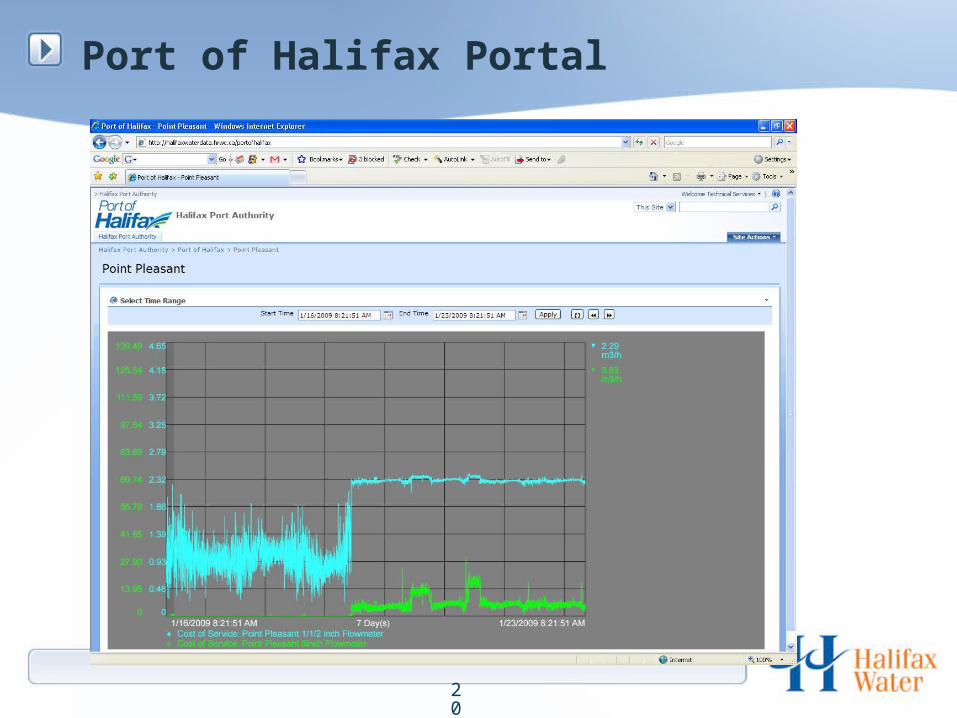
Port of Halifax Portal
20
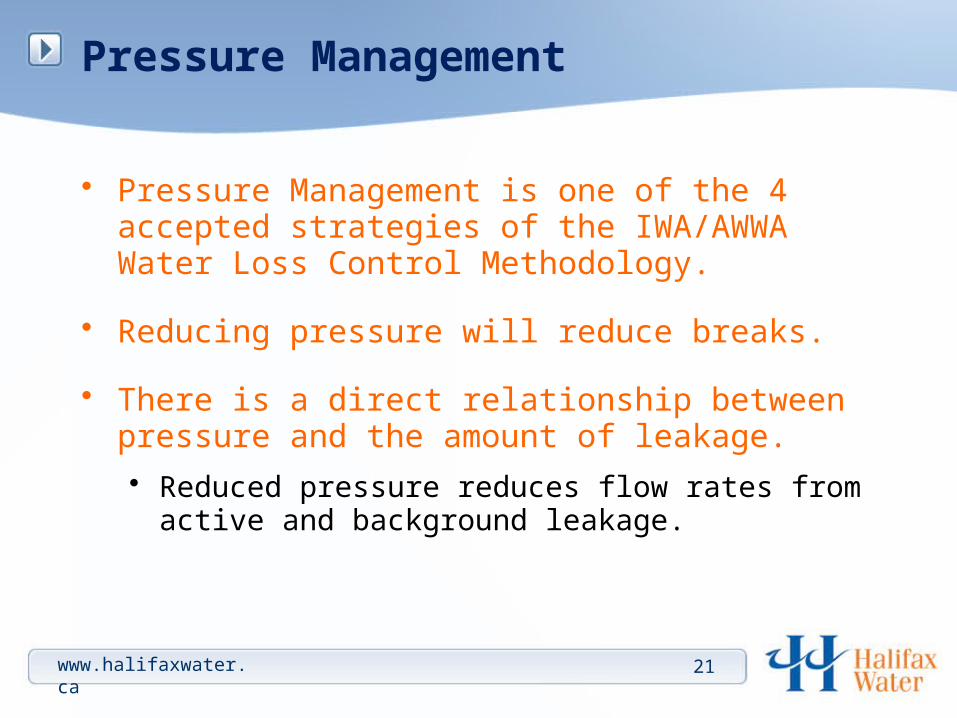
Pressure Management
• Pressure Management is one of the 4 accepted strategies of the IWA/AWWA Water Loss Control Methodology.
• Reducing pressure will reduce breaks.
• There is a direct relationship between pressure and the amount of leakage.
• Reduced pressure reduces flow rates from active and background leakage.
21www.halifaxwater.ca
www.halifaxwater.ca 22
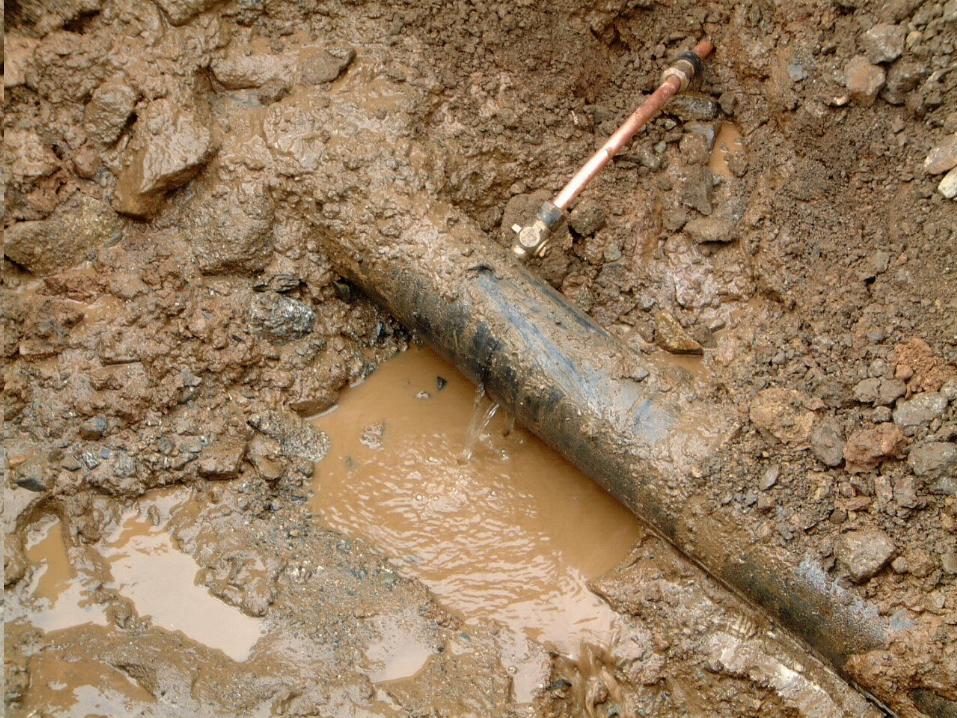
Water Mains-Under Pressure
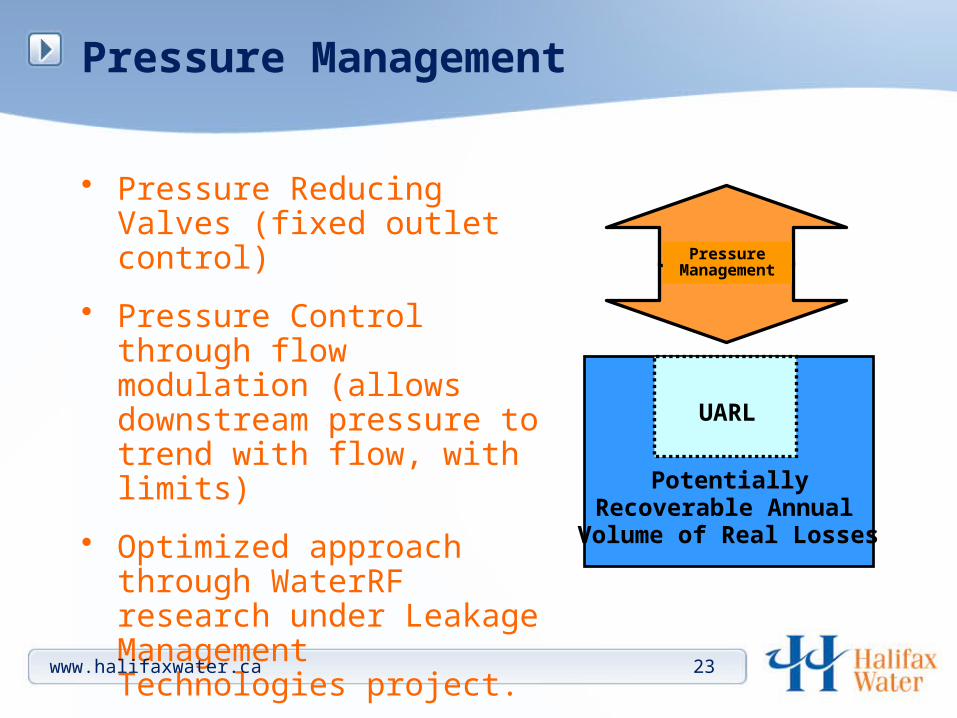
Pressure Management
• Pressure Reducing Valves (fixed outlet control)
• Pressure Control through flow modulation (allows downstream pressure to trend with flow, with limits)
• Optimized approach through WaterRF research under Leakage Management Technologies project.
www.halifaxwater.ca 23
UARL
Potentially Recoverable Annual
Volume of Real Losses
PressureManagemen
t

www.hrwc.ca Slide 24
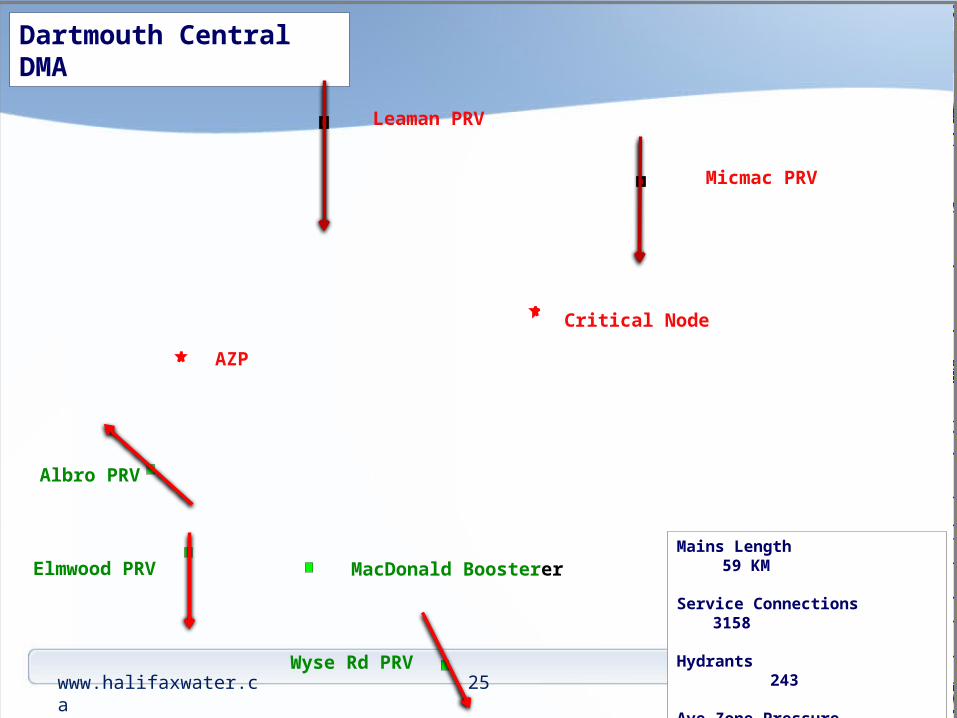
Dartmouth Central
www.halifaxwater.ca 25%U
%U
%U
%U
%U
%U
(X
Micmac PRV
Leaman PRV
Albro PRV
Elmwood PRV
Wyse Rd PRV
MacDonald Boosterer
Critical Node
AZP
Mains Length 59 KM
Service Connections 3158
Hydrants 243
Ave Zone Pressure 56M
Critical Node Press 32M
Dartmouth Central DMA
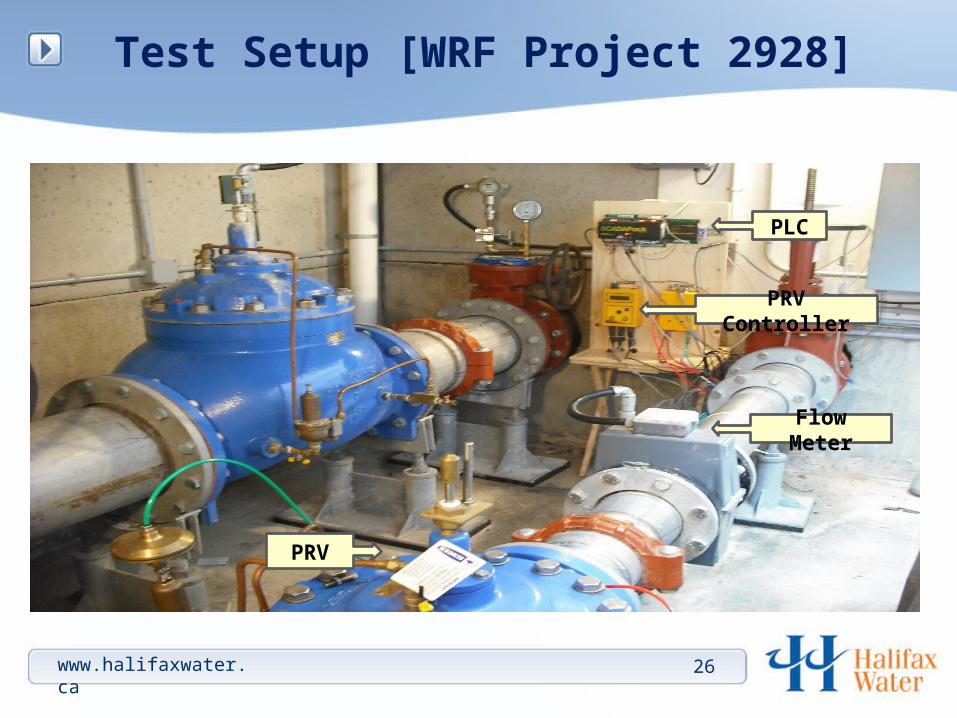
Test Setup [WRF Project 2928]
PLC
PRV Controller
Flow Meter
PRV
26www.halifaxwater.ca
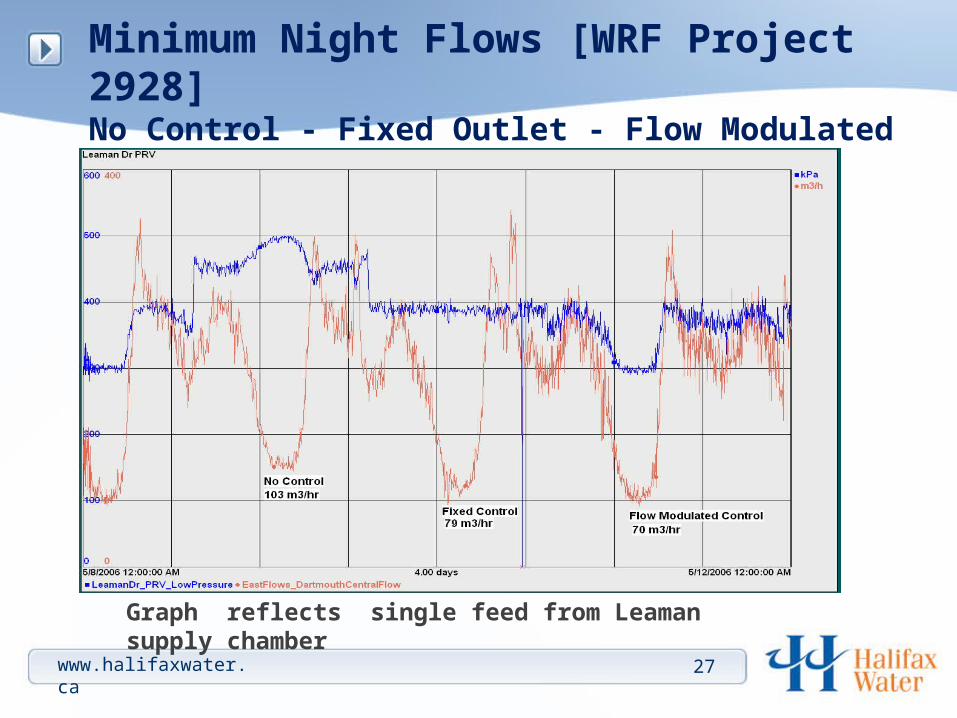
Minimum Night Flows [WRF Project 2928]No Control - Fixed Outlet - Flow Modulated
Graph reflects single feed from Leaman supply chamber
27www.halifaxwater.ca
Advanced Dual Supply Pressure Control
• Challenge - Apply flow modulated pressure control in a DMA with two supply feeds.
• Problem - An increase in output from one supply chamber causes a reduction in flow at the second supply chamber, eventually shutting the second feed in.
• Solution - Establish communications between the supply chambers. Develop a control algorithm that combines the individual flows into a single DMA demand flow that is used as the control variable for both supply chambers.
www.halifaxwater.ca 28
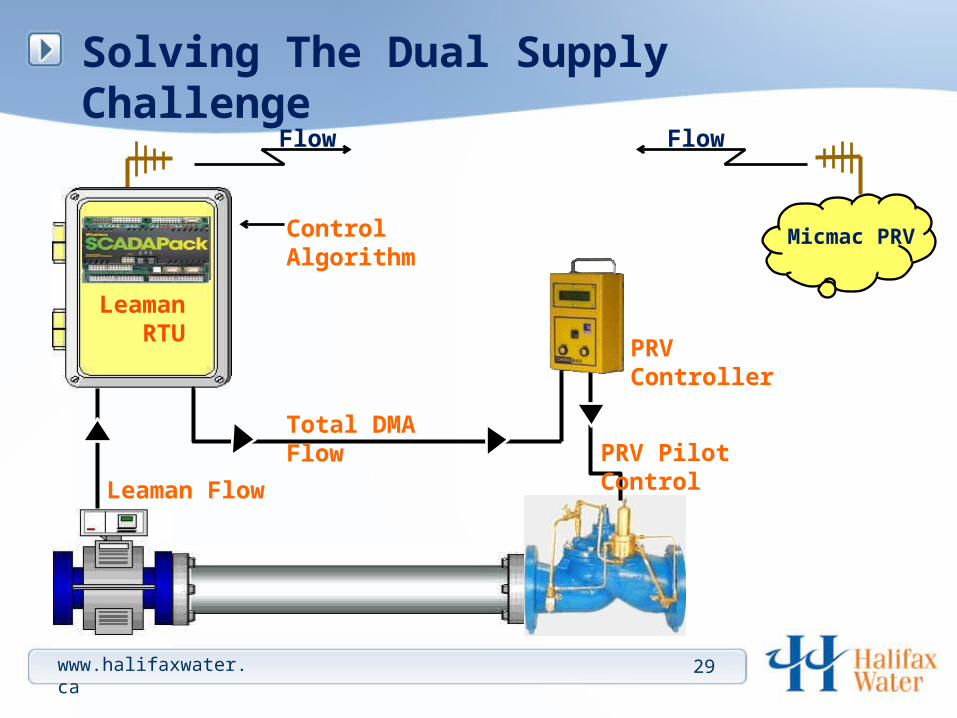
Solving The Dual Supply Challenge
Control Algorithm
PRV Controller
Leaman RTU
Total DMA Flow
Leaman Flow
PRV Pilot Control
Micmac PRV
Flow Flow
29www.halifaxwater.ca
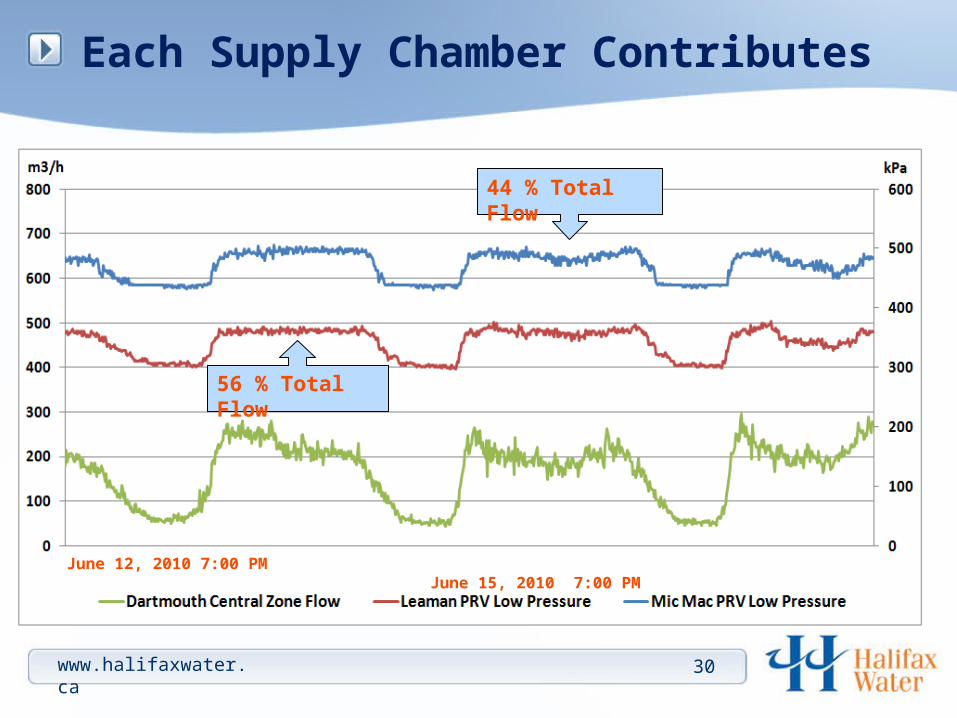
Each Supply Chamber Contributes
June 12, 2010 7:00 PM June 15, 2010 7:00 PM
56 % Total Flow
44 % Total Flow
30www.halifaxwater.ca
Chlorine CT Application
• Minimum chlorine contact time prior to customer consumption is a regulatory requirement
• For quality assurance and efficient operation, application developed for plant operations to optimize chlorine use and optimize public health protection
• Real time online CT calculation provides operators instant confirmation
• Real time alarming and archived records
31
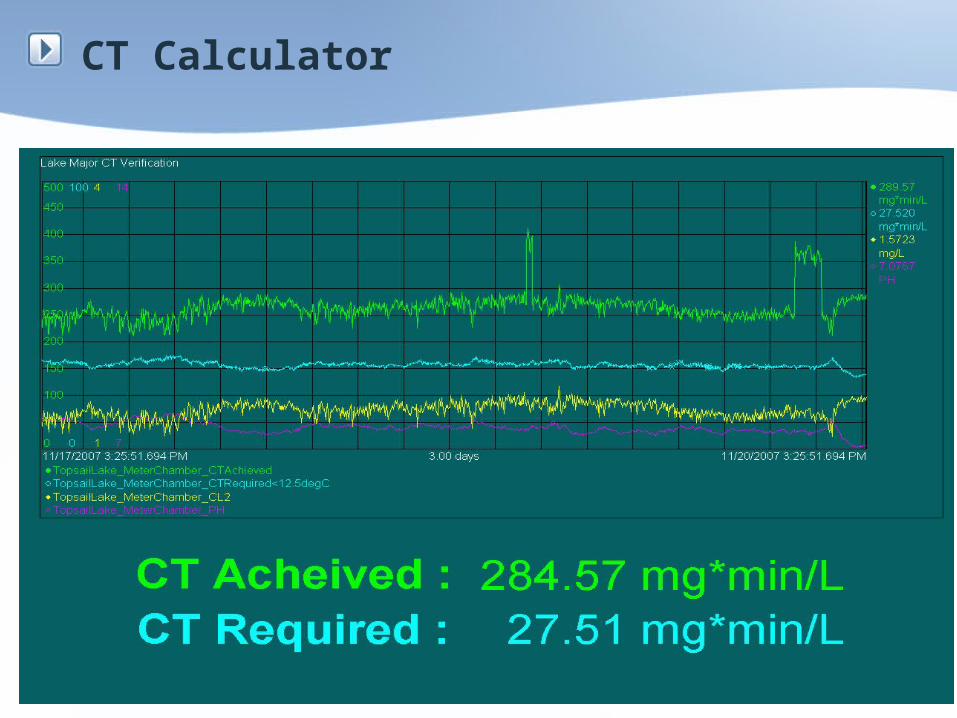
CT Calculator
www.hrwc.ca Slide 33Slide 33
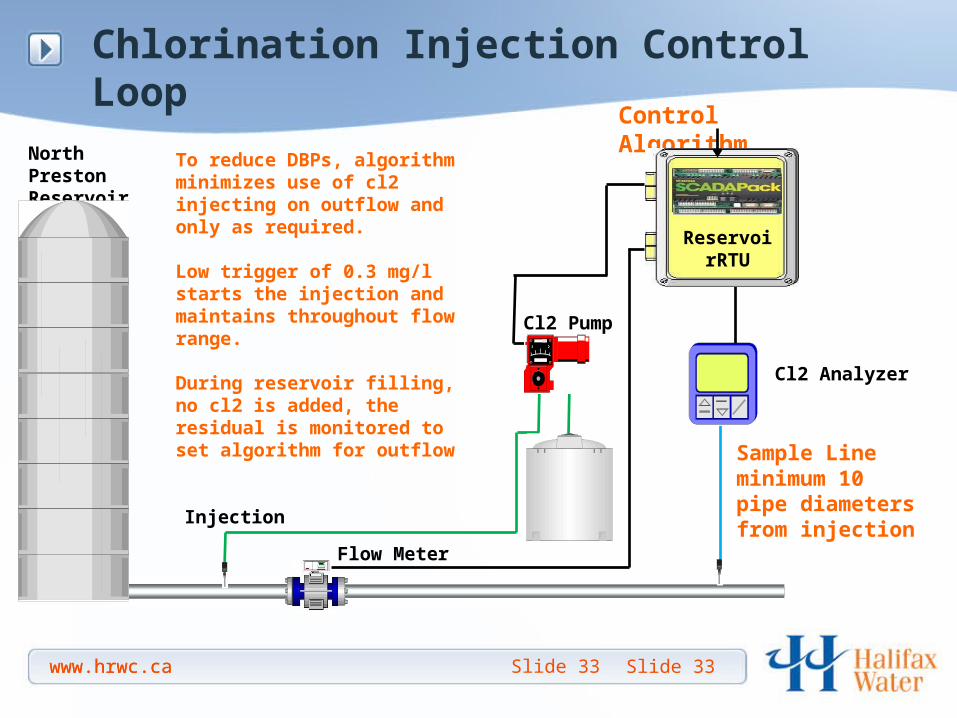
Chlorination Injection Control Loop
www.hrwc.ca
North Preston Reservoir
Control Algorithm
0.4
ReservoirRTU
Sample Line minimum 10 pipe diameters from injection
Cl2 Analyzer
Cl2 Pump
Hypo
Flow Meter
Injection
To reduce DBPs, algorithm minimizes use of cl2 injecting on outflow and only as required.
Low trigger of 0.3 mg/l starts the injection and maintains throughout flow range.
During reservoir filling, no cl2 is added, the residual is monitored to set algorithm for outflow
34
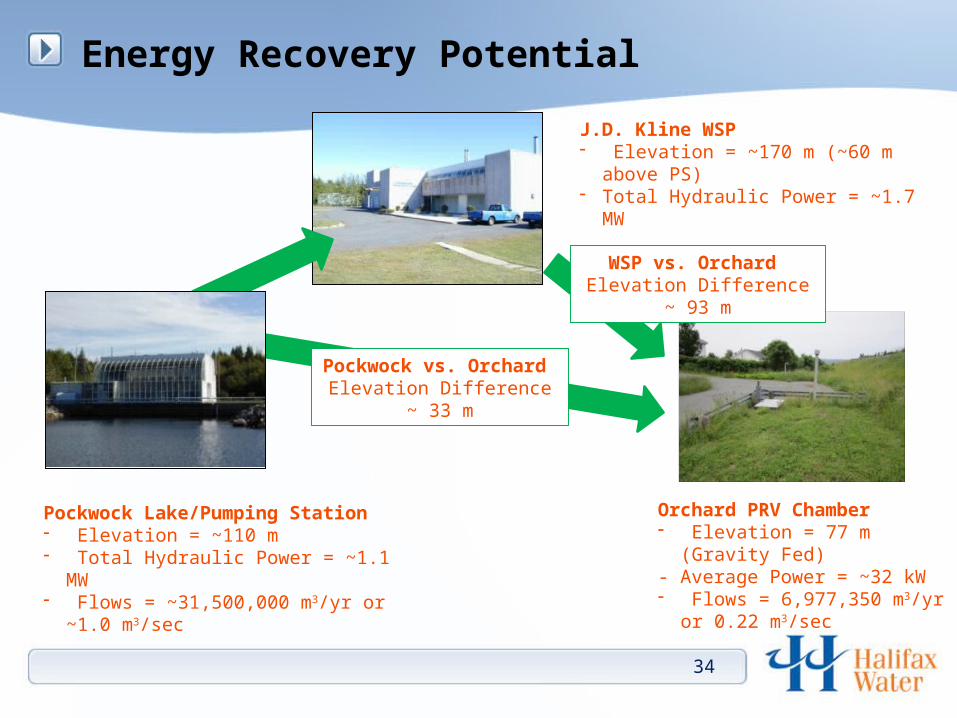
Pockwock Lake/Pumping Station- Elevation = ~110 m- Total Hydraulic Power = ~1.1 MW- Flows = ~31,500,000 m3/yr or ~1.0
m3/sec
J.D. Kline WSP- Elevation = ~170 m (~60 m above PS)- Total Hydraulic Power = ~1.7 MW
Orchard PRV Chamber- Elevation = 77 m (Gravity Fed)- Average Power = ~32 kW- Flows = 6,977,350 m3/yr or
0.22 m3/sec
Energy Recovery Potential
Pockwock vs. Orchard Elevation Difference ~ 33 m
WSP vs. Orchard Elevation Difference ~ 93 m
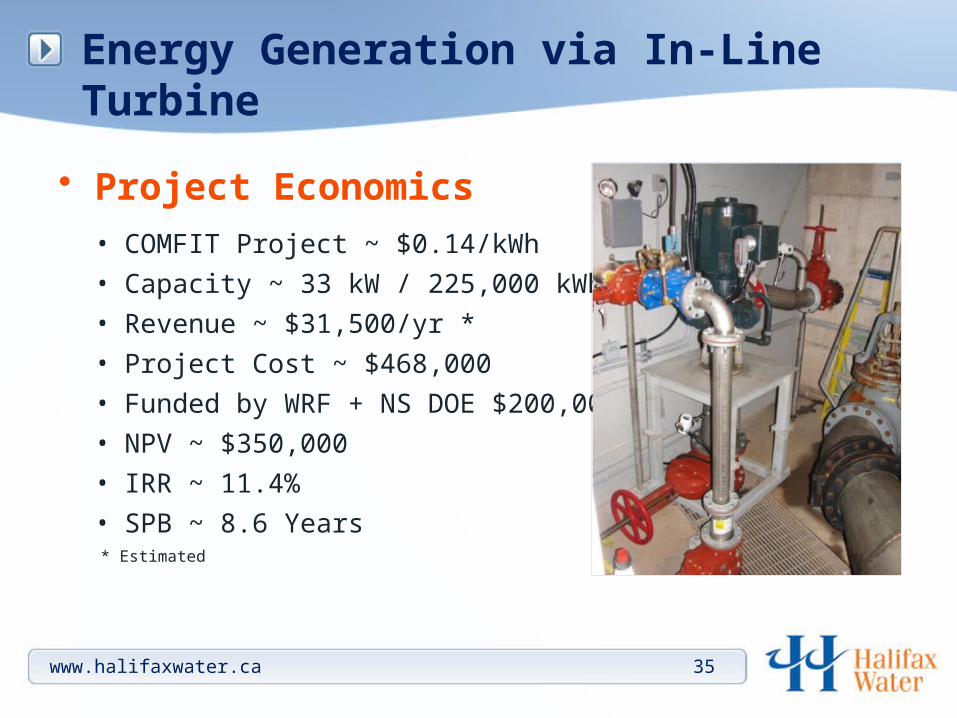
Energy Generation via In-Line Turbine
• Project Economics• COMFIT Project ~ $0.14/kWh
• Capacity ~ 33 kW / 225,000 kWh/yr *
• Revenue ~ $31,500/yr *
• Project Cost ~ $468,000
• Funded by WRF + NS DOE $200,000
• NPV ~ $350,000
• IRR ~ 11.4%
• SPB ~ 8.6 Years* Estimated
www.halifaxwater.ca 35
www.halifaxwater.ca 36
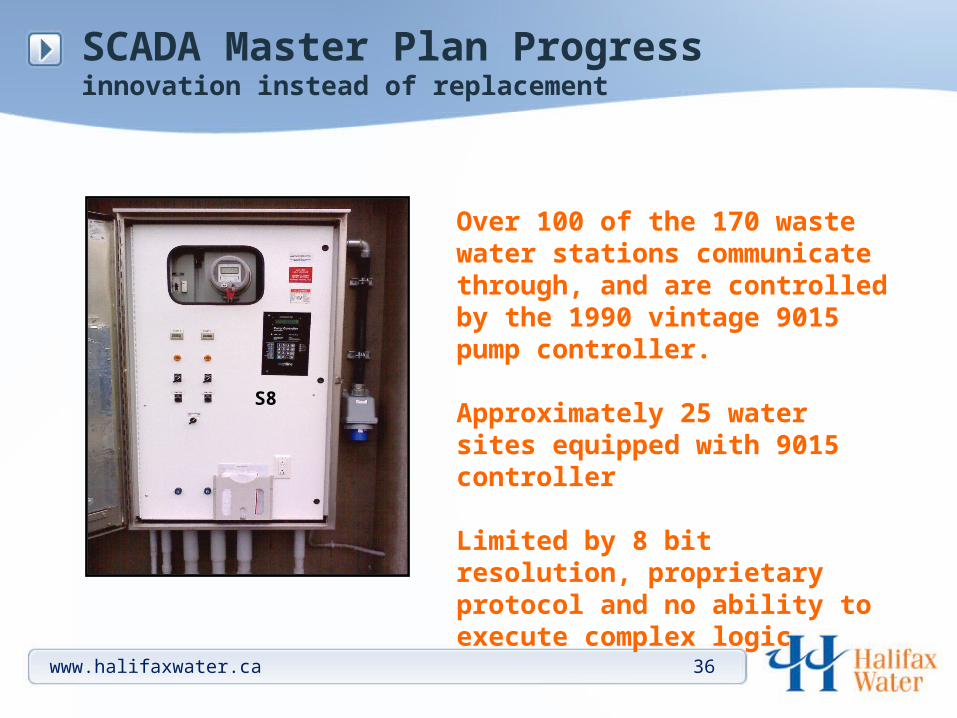
SCADA Master Plan Progressinnovation instead of replacement
Over 100 of the 170 waste water stations communicate through, and are controlled by the 1990 vintage 9015 pump controller.
Approximately 25 water sites equipped with 9015 controller
Limited by 8 bit resolution, proprietary protocol and no ability to execute complex logic
S8
www.halifaxwater.ca 37
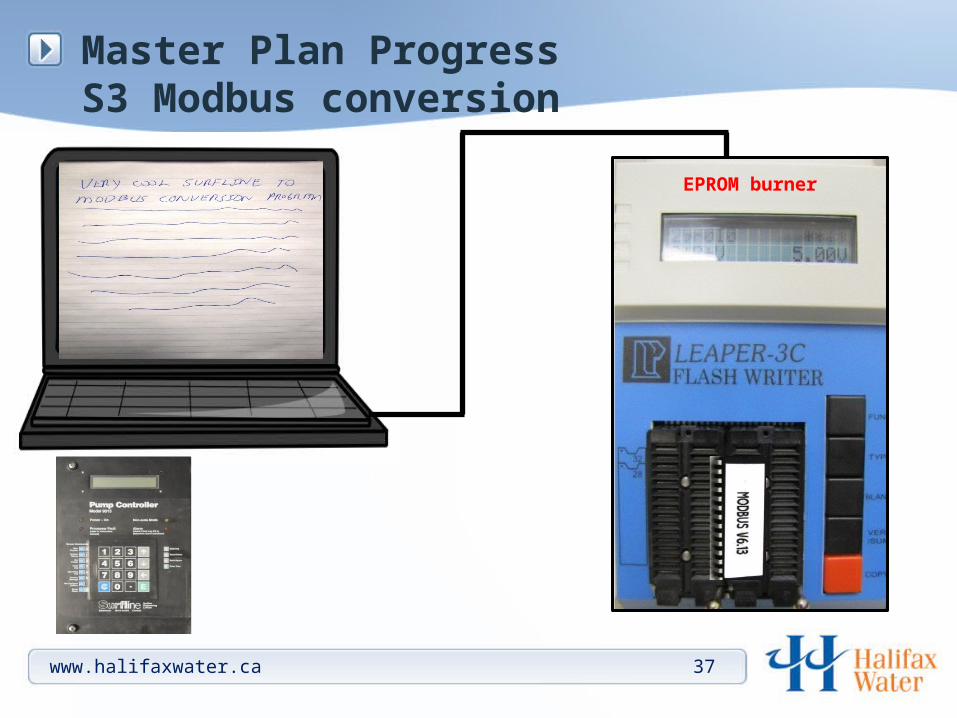
Master Plan ProgressS3 Modbus conversion
EPROM burner
www.halifaxwater.ca 38
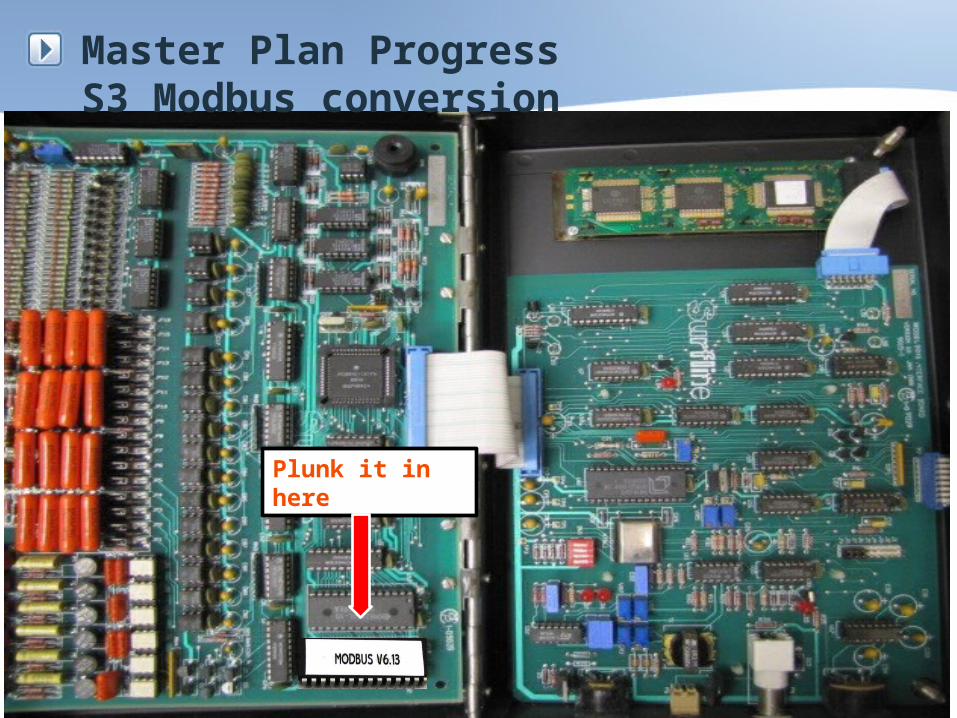
Plunk it in here
Master Plan ProgressS3 Modbus conversion
www.halifaxwater.ca 39
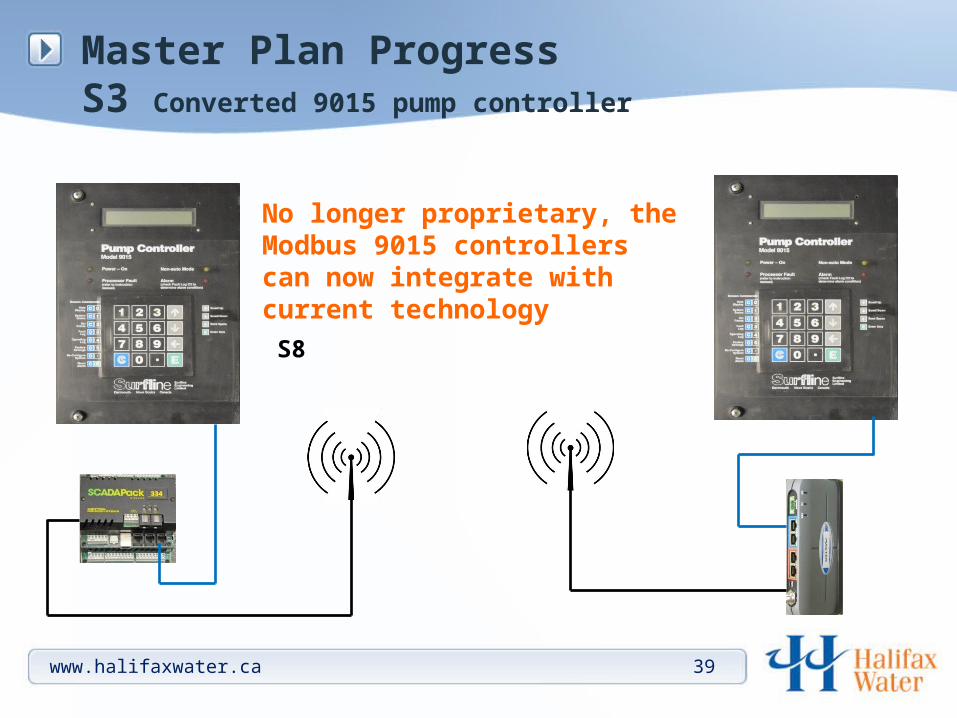
No longer proprietary, the Modbus 9015 controllers can now integrate with current technology
Master Plan ProgressS3 Converted 9015 pump controller
S8
Future Applications
• Advanced Meter Infrastructure [AMI]
• Smart Pipes
• Asset Management
www.halifaxwater.ca 40
Advanced Meter Infrastructure
• Currently looking at feasibility to implement AMI
• Recognized that AMI is much more than obtaining data for customer billing
• AMI facilitates two way communication between utility and customer
• Customer alerts for premise leakage
• Provides minimum night usage to compare to flows within DMAs
www.halifaxwater.ca 41
Smart Pipes
• Instrumentation built in to pipe walls to:
• Measure pressure• Detect leakage• Monitor corrosion
www.halifaxwater.ca 42
Asset Management
• Currently developing Computerised Maintenance Management System
• Currently developing Customer Relationship Management System
www.halifaxwater.ca 43

Do not follow where the path may lead. Go instead where there is no path and blaze a trail.
www.halifaxwater.ca