Embed Size (px)
Citation preview
Preliminary Program• Highlights• Symposia• Award Sessions• Schedule-at-a-Glance• Training Sessions
April 15-19 • Chicago, Illinois 2015
2
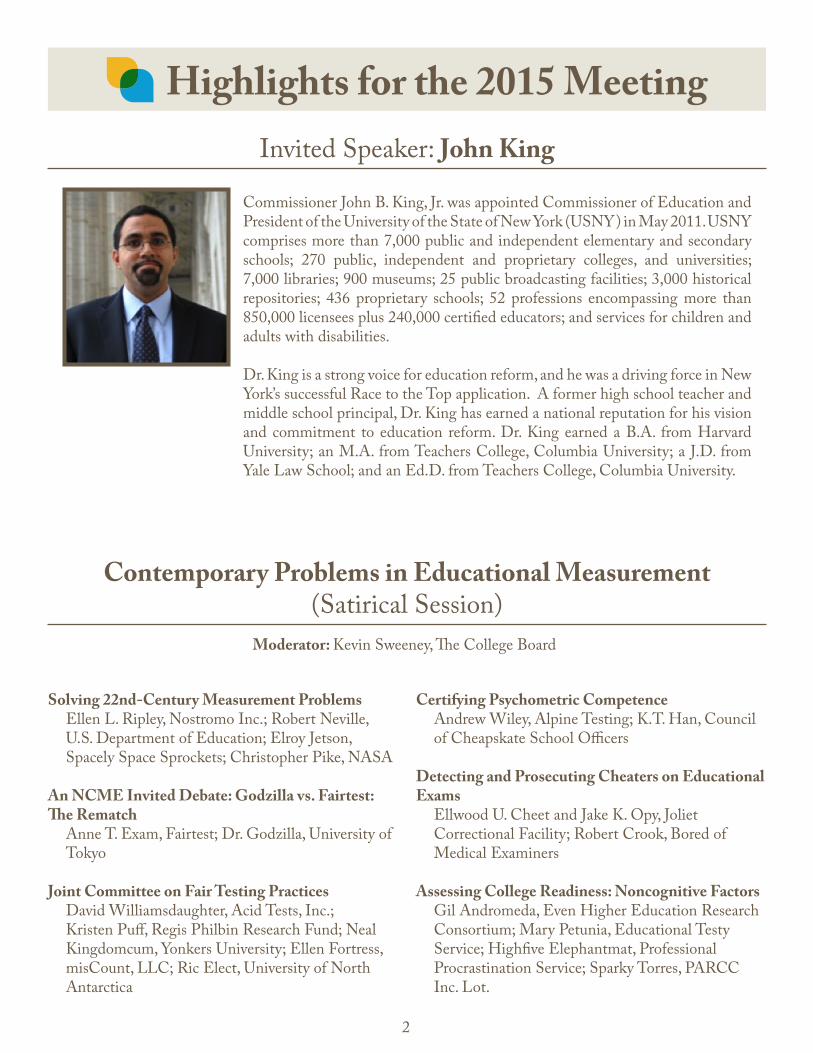
Highlights for the 2015 MeetingInvited Speaker: John King
Commissioner John B. King, Jr. was appointed Commissioner of Education and President of the University of the State of New York (USNY) in May 2011. USNY comprises more than 7,000 public and independent elementary and secondary schools; 270 public, independent and proprietary colleges, and universities; 7,000 libraries; 900 museums; 25 public broadcasting facilities; 3,000 historical repositories; 436 proprietary schools; 52 professions encompassing more than 850,000 licensees plus 240,000 certified educators; and services for children and adults with disabilities.
Dr. King is a strong voice for education reform, and he was a driving force in New York’s successful Race to the Top application. A former high school teacher and middle school principal, Dr. King has earned a national reputation for his vision and commitment to education reform. Dr. King earned a B.A. from Harvard University; an M.A. from Teachers College, Columbia University; a J.D. from Yale Law School; and an Ed.D. from Teachers College, Columbia University.
Contemporary Problems in Educational Measurement (Satirical Session)
Solving 22nd-Century Measurement ProblemsEllen L. Ripley, Nostromo Inc.; Robert Neville, U.S. Department of Education; Elroy Jetson, Spacely Space Sprockets; Christopher Pike, NASA
An NCME Invited Debate: Godzilla vs. Fairtest: The Rematch
Anne T. Exam, Fairtest; Dr. Godzilla, University of Tokyo
Joint Committee on Fair Testing PracticesDavid Williamsdaughter, Acid Tests, Inc.; Kristen Puff, Regis Philbin Research Fund; Neal Kingdomcum, Yonkers University; Ellen Fortress, misCount, LLC; Ric Elect, University of North Antarctica
Certifying Psychometric CompetenceAndrew Wiley, Alpine Testing; K.T. Han, Council of Cheapskate School Officers
Detecting and Prosecuting Cheaters on Educational Exams
Ellwood U. Cheet and Jake K. Opy, Joliet Correctional Facility; Robert Crook, Bored of Medical Examiners
Assessing College Readiness: Noncognitive FactorsGil Andromeda, Even Higher Education Research Consortium; Mary Petunia, Educational Testy Service; Highfive Elephantmat, Professional Procrastination Service; Sparky Torres, PARCC Inc. Lot.
Moderator: Kevin Sweeney, The College Board
3
Highlights for the 2015 MeetingPoint-Counterpoint Sessions
The Importance of Instructional Sensitivity: A Colloquy Among Combatants
Moderator: Henry Braun, Boston CollegeJim Popham, University of California Los AngelesNeil Kingston, University of KansasJon Fremer, Caveon Test SecurityDenny Way, Pearson
The Myth of Equal Measurement Units in Educational Testing
Derek Briggs, University of Colorado BoulderWim van der Linden, CTB McGraw-HillModerator: Terry Ackermann, University of North Carolina Greensboro
Joint & Committee Sponsored Invited Symposia
NCME-NATD SymposiumImplementing the Common Core Assessments at the District and School Levels: Voices from the Field - Overcoming Challenges, Making it Work
Organizer: Zollie Stevenson, Jr., Howard University/NATD President-Elect
Moderator: Elvia Noriega, Richardson Independent School District (TX)/NATD Secretary
Didi Swartz, Chicago Public Schools (Illinois) (PARCC)Melanie Stewart, Milwaukee Public Schools (Wisconsin) (SMARTER Balanced)Dale Whittington, Shaker Heights Public Schools (Ohio) (PARCC)Brad McMillan, Wake County (NC) Public Schools (SMARTER Balanced)
NCME Diversity and Testing Committee SymposiumExploring the Implications of the “Fairness” Chapter of the 2014 Standards for Educational and Psychological Testing
Moderator: Meagan Karvonen, CETE, University of Kansas
PresentersLaurie Wise, HumRROPerspectives from a Co-Chair of the Standards Development CommitteeLinda Cook, retiredPerspectives from a Co-Chair of the Fairness Chapter
DiscussantsEdynn Sato, PearsonReflections from a Test ContractorPeggy Carr, NCESReflections from NAEP Brian Gong, NCIEAReflections from an Organization Providing Technical Assistance on State Assessment Systems
4
Highlights for the 2015 MeetingInvited Symposia
Advances in Score ReportingModerator/Discussant: Ron HambletonUniversity of Massachusetts AmherstSandip Sinharay, CTB McGraw-HillShelby Haberman, ETSJohn Behrens, PearsonApril L. Zenisky, University of Massachusetts Amherst
Measurement and Implementation Challenges in Early Childhood Education
Moderator/Discussant: Michael Rodriguez, University of MinnesotaAlisha Wackerle-Hollman, University of MinnesotaMegan Cox, Minnesota Department of EducationRyan Kettler, Rutgers, The State University of New JerseyScott McConnell, University of MinnesotaKristen Huff, Regents Research Fund
Standard Setting in the Common Core World: PARCC and SBAC Experiences
Moderator: Leslie Keng, PearsonDiscussant: Lauress Wise, HumRROMichael Bunch, Measurement Inc.Enis Dogan, PARCC Inc.Julie Miles, PearsonJoe Willhoft, Smarter Balanced Assessment Consortium
A Dialogue for Addressing Measurement and Data Gaps in Education
Organizers: Joshua Marland & Lisa Keller, University of Massachusetts AmherstKristen Huff, Regents Research FundCharlie DePascale, NCIEADrey Martone, The College of Saint Rose
Quality Focus: Experiences from a Number of Assessment Programs
Chair/Moderator: Judith Monsaas, University of North GeorgiaDiscussant: Henry Braun, Boston CollegeKristen Huff, Regents Research FundMarianne Perie, CETE, University of KansasJoe Willhoft, Smarter Balanced Assessment ConsortiumGloria Zyskowski, Texas Education Agency
Career Award AddressPresenter: David Thissen, University of North Carolina at Chapel Hill
5
Highlights for the 2015 MeetingAward Session
Jason Millman AwardThe Innovative Applications of Response Time in Detecting Aberrant Behaviors in Standardized Testing
Chun WangUniversity of Minnesota
Two mixture hierarchical models based on response accuracy and response times will be introduced, and demonstrate how the new models can be used to detect aberrant behaviors—rapid guessing and cheating behaviors. The performance of the new model-based approach is also compared to residual-based fit indices.
Alicia Cascallar AwardCovariate and Mixture Extensions of Diagnostic Classification Models
Yoon Soo ParkUniversity of Illinois at Chicago
Diagnostic classification models (DCMs) classify examinees into attribute mastery profiles. This study presents extensions of DCMs that incorporate mixture distributions to examine differential attribute functioning among latent subgroups. Covariates are specified at the attribute and higher-order latent trait levels to explain differences in attribute structures, response probability, and latent classification.
Brenda Loyd AwardEstimation of Complex Generalized Linear Mixed Models for Measurement and Growth
MinJeong JeonThe Ohio State University
In this talk, I will present my dissertation that addresses estimation methods and applications of complex generalized linear mixed models for measurement and growth. I will briefly explain two noble maximum likelihood techniques that I developed–variational maximization-maximization (VMM) and Monte Carlo local likelihood (MCLL) algorithms. I will also present a proposed autoregressive growth model and its implication in measurement.
Bradley Hanson AwardA Multilevel Testlet Model for Mixed-Format Tests
Hong JiaoUniversity of Maryland, College Park
This research project proposes a multilevel testlet model for mixed-format tests consisting of both dichotomous and polytomous items. This modeling approach can tackle multiple psychometric issues such as dual local dependence due to item and person and complex sampling in testlet-based in applying conventional item response theory (IRT) models. Parameter estimation accuracy will be evaluated under simulated study conditions. Further the proposed model will be compared with three competing models in terms of parameter recovery for mixed-format tests.
6
Schedule-at-a-GlanceWednesday, April 15 and Thursday, April 16, 2015
Pre-Conference Training Sessions (available at an additional fee)
Thursday, April 16, 20154:00 p.m.–7:00 p.m. NCME Board of Directors Meeting
Friday April 17, 2015 6:30 p.m.–8:00 p.m. NCME and AERA Division D Joint Reception
Saturday, April 18, 20158:00 a.m.–9:30 a.m.2014 NCME Breakfast and Business Meeting
Saturday, April 18, 2015 9:30 a.m.–10:15 a.m.Presidential Address“Educational Measurement: What Lies Ahead”Lauress Wise
Sunday, April 19, 2015 5:45 a.m.–7:00 a.m. Meet in the lobby of the InterContinental Hotel NCME Fitness Run/Walk
Sunday, April 19, 20156:30 a.m.–7:30 a.m.YogaPlease join us for the first inaugural sunrise yoga sponsored by NCME. We will start promptly at 6:30 a.m. for one hour on Sunday April 19 on the balcony of the Grand Ballroom (InterContinental Hotel, 8th Floor). There will be a $10 reservation fee that covers your mat rental. NO EXPERIENCE NECESSARY. Just bring your body and your mind, and our instructor, Pierce (www.piercedoerr.com) will do the rest. Floor space is limited, so sign up soon. Namaste.
Sunday, April 19, 2015 12:30 p.m.–2:00 p.m. Past Presidents Luncheon
Sunday, April 19, 2015 4:00 p.m.–7:00 p.m. NCME Board of Directors Meeting
7
Registration and HousingRegistration
All NCME attendees must register through AERA. Please visit the link below for information on registration, housing, and travel. The headquarters hotel for the NCME Annual Meeting is the InterContinental Hotel, located a short walk from the Sheraton Chicago Hotel and Towers (0.5 miles).
TO REGISTER:•Go to http://www.aera.net•Click “Login” at the top right
Current and former AERA Members:Log in with your AERA username and passwordAll Others:Create a user account by clicking on “Activate or Create My Account”
•Once logged in, click on “My AERA” at the top right
•Scroll down to the 2015 AERA Annual Meeting heading and click on “Registration and Housing Now Open! Click here to register”
•Verify your contact information and click “Continue” at the bottom of the page
•Complete the Demographics page and click “Proceed”
•Complete the registration•Click “Checkout Now” in the Shopping Cart
section to enter payment information
•Once you complete your registration, you can make your online hotel reservation by clicking the “Hotel Reservation” button in the upper left side of the registration confirmation summary screen.
Once you arrive on-site at the meeting, please register at the AERA registration area to pickup your badge and NCME final program. AERA On-Site registration will be located at the Sheraton Chicago Hotel and Towers (a short walk from the InterContinental Hotel). A copy of the final program will be available on the NCME website.
NCME Headquarters Hotel: InterContinental Chicago HotelOften regarded as Chicago's answer to the Champs-Elysées, the "Magnificent Mile" is a broad boulevard lined with exclusive shops, museums, and trendy restaurants. Experience this lively scene in all its brilliance from the InterContinental Chicago - the only downtown Chicago hotel with a front entrance on this world-famous thoroughfare. Immerse yourself in the enchanting atmosphere of the Windy City.
Hotel Amenities• 24-hour front desk•Express check-out•Fitness center•Spa•Restaurants, Bar/Lounge•Concierge•Business center•Garage parking 24 hours a day, and Valet parking•Dry cleaning/Laundry service
•Safety deposit box•Gift Shop•Currency Exchange• Indoor Pool•Public Transportation Nearby
Sleeping Room Amenities• Room Service• Internet Access• Cable TV• Hairdryer• In-room movies• Iron/ironing boards• Mini bar• Pets allowed
Secure your hotel reservations at: https://aws.passkey.com/event/12381530/owner/14227/rooms/list?sort=default#sthash.aiA1ey53.dpuf
8
Pre-Conference Training Sessions
Wednesday, April 15, 2015, and Thursday, April 16, 2015
The 2015 NCME Pre-Conference Training Sessions will be held at the InterContinental Hotel in Chicago, on Wednesday, April 15, 2015, and Thursday April 16, 2015.
• Advance registration for the training sessions is strongly encouraged. The only way to register in advance for the training sessions is to use the AERA online registration system. There is a link to online registration on the NCME website at www.ncme.org.
• Registration on site will be available only for those training sessions that have not been filled through advance registration.
• Patricipants should download the software required prior to the training sessions. Internet connectivity will be available for a few selected training sessions only with an added fee and as noted below.
Wednesday, April 15, 2015 Full Day Sessions
NCME018:00 a.m.-5:00 p.m.Leveraging Open Source Software & Tools for Statistics/Measurement ResearchDamian Betebenner, Adam VanIwaarden, and Ruhan Circi
Fee: $115Maximum Attendance: 30Wireless Internet Service Provided
Measurement and statistics specialists have used software for decades with tools like SPSS, SAS, and Stata and more recently the open source software environment R. The expansion of the importance of software goes well beyond software packages data analysts use. Development tools alter the way that people work, collaborate, and disseminate the results of their efforts. This training session will introduce users to the rapidly expanding universe of open source tools available that can be used to increase the transparency and reproducibility of their research while simultaneously enhancing productivity, collaboration, and dissemination.
In this full-day session, participants will be introduced to open modern software analysis and development tools and show how, through rich, real-life working examples, they can be combined to enhance the goal of producing transparent and reproducible research. Example projects will be presented to participants that range from a dissertation, to a prototype for a published article, to a multi-state/national data analysis project.

9
Pre-Conference Training Sessions Wednesday, April 15, 2015 Full Day Sessions—continued
NCME028:00 a.m.-5:00 p.m.flexMIRT®: Flexible Multilevel Multidimensional Item Analysis and Test ScoringLi Cai and Carrie R. Houts
Fee: $115Maximum Attendance: 40Wireless Internet Service Provided
There has been a tremendous amount of progress in item response theory (IRT) in the past two decades, resulting in interesting new software implementations for research and operational use. flexMIRT® is an IRT software package which offers multilevel, multidimensional, and multiple group item response models. flexMIRT also offers users the ability to obtain recently developed model fit indices, fit diagnostic classification models, and models with non-normal latent densities. This training session is intended to provide a broad overview of the features of flexMIRT® as well as hands-on experience using the software. Attendees will receive a free two-month trial version of flexMIRT. It is assumed that attendees will be familiar with IRT. It would be helpful if the attendees could bring their own devices running Windows 7 or above.
flexMIRT® fits a variety of unidimensional and multidimensional IRT models as well as extended diagnostic classification models, to single-level and multilevel data using maximum marginal likelihood (or optionally modal Bayes) estimation. It produces IRT scale scores using maximum likelihood (ML), maximum a posteriori (MAP), and expected a posteriori (EAP) estimation. It (optionally) produces summed-score to IRT scale score (EAP) conversion tables for single-level IRT models. As for the item types, flexMIRT® can estimate any combination of 3-parameter logistic (3PL) model, logistic graded response model (which includes 2PL and 1PL as special cases), and the nominal categories model (including any of its restricted sub-models such as generalized partial credit model, partial credit model, and rating scale model) for both single-level and multilevel data, in any number of groups. The availability of generalized dimension reduction EM algorithm as well as the Metropolis-Hastings Robbins-Monro (MH-RM) algorithms, coupled with arbitrary user-defined parameter constraints, make flexMIRT® one of the most flexible IRT software programs either commercially or freely available today.
flexMIRT® also has some of the richest psychometric and statistical features. flexMIRT® supports several methods for estimating item parameter standard errors. A multitude of model fit statistics for dimensionality analysis, item-fit testing, and latent variable normality diagnosis are included in flexMIRT®. Its multiple-group estimation features easily facilitate studies involving differential item function (DIF) and test linking (including vertical scaling).Another innovation in flexMIRT® is its ability to relax the ubiquitous multivariate normality assumption made in virtually all IRT models. With an extended dimension reduction algorithm, it supports the non-parametric estimation of latent density shapes using empirical histograms for both unidimensional and hierarchical (e.g., bifactor and testlet response theory) item factor models, and in any number of groups, with support for constraints on group means and variances. This feature is also fully integrated into the built-in Monte Carlo simulation module that can generate data from any model implemented in flexMIRT®.
10
Pre-Conference Training Sessions
Windows-based flexMIRT® has an intuitive syntax and friendly graphical user interface (GUI), available in both 32-bit and 64-bit flavors. A newly-designed memory allocation scheme helps flexMIRT® efficiently handle thousands of items and millions of respondents, with no imposed upper limit on the size of the problem.
Note: bring a laptop computer running Windows 7 or above.
NCME038:00 a.m.-5:00 p.m.Optimal Test DesignWim J. van der Linden, Qi Diao, and Jie Li
Fee: $115Maximum Attendance: 50Publication Provided: Linear Models for Optimal Test DesignWireless Internet Service Provided
The topic of IRT-based test assembly was introduced by Birnbaum in his contribution to the well-known book by Lord and Novick (1969). Its basic idea exists of the assembly of a test form to have an information function matching a target function for the intended application.
Although intuitively convincing, Birnbaum’s procedure was not practical yet. In practice, test forms are never assembled to meet a statistical target only; they always have to meet a potentially large variety of other specifications as well, for instance, blueprints for its content, certain answer key distributions, a given time slot, exclusion of specific combinations of items, or bounds on their total word count. In fact, as will be demonstrated by our examples in the training session, it is not unusual for real-world test-assembly problems to involve hundreds of additional constraints on the selection of the items. It is not immediately clear how to meet each of them while manipulating a test-information function with respect to a target as suggested by Birnbaum.
But even without any of these constraints, the job of picking an optimal combination of items is already impossible. The reason is an instance of the well-known combinatorial explosion. The number of possible different test forms of length n from a pool of I items is equal to In, generally a prohibitively large number. For instance, even for a pool of only I=50 items, the number of different forms of n=10 items is already much greater than the current world population. Only methods with mathematically proven optimality are able to deal with such explosions of possibilities; we will never know if a solution proposed by a method based on a heuristic idea, or just by manual selection, will be the best available from the item bank.
Practical test-assembly methods are even more complicated in that we hardly ever assemble just one single form consisting of discrete items at a time. Often, we need a set of forms required to be completely parallel, possibly with constraints on the item overlap between some or all of them. Or a set that addresses systematical differences in expected achievements between groups of test takers. Or the item pool may consist of items organized around common stimuli and we have to impose bounds on the numbers of items selected per stimulus. Even when assembling one form at a time, it seems prudent to keep an eye on the assembly of all future forms. In order to avoid deterioration of test quality over time we may already want to compromise between what is taken from and left in the pool early on.
Wednesday, April 15, 2015 Full Day Sessions—continued
11
Pre-Conference Training Sessions
Finally, real-world testing programs with frequently assembled forms tailored to specific applications that are delivered electronically generally require fast algorithms to produce them. Ideally, we should be able to assemble them in real time. The requirement of real-time solutions even becomes mandatory when tests are assembled adaptively rather than as fixed forms.
The goal of this training session is to show that all these problems can be solved by treating test assembly as an instance of combinatorial optimization. The basic methodology exists of translating all test specifications in a set of constraints with an objective function, model the objective function and constraints using binary decision variables, and having a standard mathematical solver find the solution to the optimization problem (van der Linden, 2005).
The first lecture part of the workshop introduces the principles of item-response theory (IRT) required for test development, reflects on the history of test design, explains Birnbaum’s approach to IRT-based test assembly, and shows how his approach can be implemented to be useful for nearly every practical form of test assembly using the methodology of constrained combinatorial optimization. The second lecture introduces the core methodology and shows how every content, statistical, and practical test specification can be modeled as an objective for or constraint on item selection from an IRT-calibrated item pool. The third lecture demonstrates the use of the methodology for the selection of a variety of single-form test assembly problems as well as problems of simultaneous selection of multiple forms that have to be parallel is systematically different in content and/or statistical characteristics. All models will be illustrated with examples from real-world testing programs. The final lecture addresses the topic of adaptive testing as a special version of optimal constrained test assembly implemented through a shadow-test approach. It shows how the approach can be used to implement every form of linear-on-the-fly, multistage, or adaptive testing and discusses how such problems as content balancing, item exposure control, and control of differential speededness can be solved just by selecting the right combination of constraints for the test-assembly model.
In addition to the lectures, participants will be offered demos of the Optimal Test Designer™ and ShadowCAT™ programs and work with lpSolveAPI for R on the test-assembly problems presented by Diao and van der Linden (2011) during computer exercises.
NCME048:00 a.m.-5:00 p.m.An Introduction to Diagnostic Classification ModelingLaine Bradshaw
Fee: $115Maximum Attendance: 25Wireless Internet Service Provided
Diagnostic classification models (DCMs) can efficiently provide reliable feedback from multidimensional tests. First, this workshop provides a semi-technical introduction to the terms and techniques used for diagnosing what students know. Then, participants will gain hands-on experience estimating and interpreting DCMs using software provided for participants’ own laptops.
Wednesday, April 15, 2015 Full Day Sessions—continued
12
Pre-Conference Training Sessions Wednesday, April 15, 2015 Full Day Sessions—continued
Upon completion of the workshop, participants will be able to understand the rationale and motivation for using diagnostic classification models. Furthermore, participants will be able to understand the types of data typically used in diagnostic measurement along with the information that can be obtained from implementing diagnostic models. Participants will become well-versed in the state-of-the-art techniques currently used in practice and will be able to use and estimate diagnostic measurement models on their own.
From a practical point-of-view, participants will see how to develop instruments for diagnosing student abilities and how to create easy-to-use score reports. Additionally, participants will be able to interpret results from diagnostic measurement analyses to evaluate student mastery profiles and understand how to use profiles to inform instructional plans that focus on a multidimensional view of student progress in achievement. Finally, participants will be able to interpret research articles using diagnostic measurement techniques, thereby allowing students a better opportunity to integrate such methods into their active research programs.
Wednesday, April 15, 2015 Half-Day Morning SessionsNCME058:00 a.m.-12:00 noonAn Introduction to Equating in RAnthony Albano
Fee: $65Maximum Attendance: 75Wireless Internet Service Provided
This training session introduces participants to observed-score and item response theory (IRT) equating methods through a series of exercises involving analysis of real data within the statistical environment R. Researchers and practitioners are invited to participate. A background in introductory statistics and experience using R are recommended but not required.
Many testing programs collect data on multiple forms administered across time and/or across different samples of individuals. These programs include large-scale applications, such as in licensure and admissions testing, and smaller-scale applications, such as in classroom assessment and intervention studies. In each case, practitioners and researchers can utilize equating procedures to convert multiple test forms to a common measurement scale.
Experience has shown that individuals tasked with equating often lack the education and training required to do so. The misuse of equating procedures can result in invalid score interpretations. This session provides participants with a brief and practical induction to equating principles and concepts and to the procedures needed to effectively use equating. The session begins with an introduction to R and to observed-score equating and IRT methods. The majority of the session is then devoted to a series of exercises requiring participants to prepare and analyze provided data from a variety of test administration designs. These exercises address presmoothing and equating using observed-score methods, equating/linking using IRT methods, and visualizing, summarizing, and evaluating results.
13
Pre-Conference Training Sessions Wednesday, April 15, 2015 Half-Day Morning Sessions—continued
A background in introductory statistics and experience using R are recommended but not required. Participants should bring their own computers, with R (R Core Team, 2014) and the most recent version of the equate package (Albano, 2014) installed. Electronic training materials will be provided via email at least one week prior to the conference.
NCME068:00 a.m.-12:00 noonA Practitioner’s Guide to Growth ModelsKatherine Furgol Castellano and Andrew Ho
Fee: $65Maximum Attendance: 40Publication Provided: A Practitioner’s Guide to Growth ModelsWireless Internet Service Provided
Practitioners use growth models to support inferences about student learning, educator effectiveness, and large-scale educational progress. In educational accountability systems, growth models have become increasingly complex, combining statistical models with calculations motivated by policy decisions. As the stakes on growth models rise, so does the importance of understanding their intricacies.
This training session reviews and compares seven popular growth models—including gain-based models, categorical models, projection models, and Student Growth Percentiles—by answering six critical questions for each model. These questions help to identify, for example, the primary interpretations each growth model supports, the data requirements of each model, and possible unintended consequences of using each model in an accountability system.
By the end of the session, participants should be able to articulate contrasts between popular growth models as well as actively compare growth model results using real datasets in Excel and/or R.
NCME078:00 a.m.-12:00 noonUsing Visual Displays to Inform Assessment Development and ValidationBrett P. Foley
Fee: $55Maximum Attendance: 50
The development of an assessment program draws on the expertise of testing professionals for procedural guidance and the knowledge and judgment of subject matter experts (SMEs) who are familiar with the content and testing population of interest. In addition to development, consumers of test results (e.g., students, parents, candidates, policymakers, public), rely on score reports and related documentation to help interpret test scores. In this
14
workshop, we illustrate how visual displays can help inform steps of the test development and validation process, from program design to item writing and review to communicating results through score reporting. Relevant examples of visual displays are provided for various development activities in a range of testing settings (e.g., education, licensure, certification). Presenters will provide step-by-step instruction on how to create the various displays using readily available software. Participants should bring a laptop or similar device loaded with Microsoft Excel (2010 version highly recommended). Panelists will receive flash drives with Excel files and instructions for creating and adapting the visuals discussed in the workshop.
With any session involving technology integration, there is a tendency to overload participants with software features. To respond to this challenge, presenters will provide some illustrations, but intersperse the hands-on opportunities to discussion of visual displays principles to allow for greater depth of participation by participants; panelists will also be given videos providing instruction for each activity for later reference and review.
Objectives are to provide assessment developers, users, and consumers: a) relevant examples of visual data displays designed to facilitate test development and validation processes (e.g., program design, content specification, item writing, item review, standard setting, score reporting); and b) experience creating such displays.
NCME081:00 p.m.-5:00 p.m.A Graphical and Nonlinear Mixed Model Approach to IRT with the R Package FlirtFrank Rijmen and Minjeong Jeon
Fee: $65Maximum Attendance: 30Wireless Internet Service Provided
The first goal of the workshop is to show how generalized linear and nonlinear mixed models offer a powerful statistical framework for item response theory models. Ability dimensions in item response theory models are conceptualized as random effects in the mixed model framework, and the responses to items correspond to repeated measurements of the same individual. Random effects are unobserved or latent variables that correspond to sources of individual differences. They account for the dependencies that are typically observed among responses clustered within the same person. The advantages of working within this overarching framework are substantial. First, the common framework helps to understand the commonalities and differences between various item response theory models. Second, models can be extended—at least conceptually—in a straightforward way. Third, theoretical and empirical findings can be more easily communicated with a larger research community through the use of a common terminology.
The second goal of the workshop is to show how the parameters of multidimensional item response theory models can be estimated with an efficient EM algorithm that is embedded within a graphical model framework. Maximum likelihood estimation of model parameters in generalized linear and nonlinear mixed models involves integration over the space of all random effects. In general, the integrals have no closed-form solution. Numerical integration over the joint space of all latent variables becomes computationally very demanding as the number of dimensions
Pre-Conference Training Sessions Wednesday, April 15, 2015 Half-Day Morning Sessions—continued
15
grows. This technical challenge has hampered the use of multidimensional item response theory in operational settings. However, depending on the conditional independence relations between the dimensions one is willing to assume, the actual computational cost can be lowered by exploiting these conditional relations during parameter estimation. In particular, the set of conditional independence relations implied by a model can be used to partition the joint space of all latent variables into smaller subsets that are conditionally independent. As a consequence, numerical integration by enumeration over the joint latent space can be replaced by a sequence of integrations over smaller subsets of latent variables. The gain in efficiency can be dramatic in some cases. Graphical model theory offers a general procedure for exploiting conditional independence relations during parameter estimation.
Thirdly, we will present the recently developed R package flirt (flexible item response theory modeling). The package relies on an integration of generalized linear and nonlinear mixed models on the one hand, and graphical models on the other hand. As a result, it is more general and efficient than other existing R packages for item response theory models. The participants will have the opportunity to familiarize themselves with the flirt package during various hands-on sessions throughout the workshop.
NCME091:00 p.m.-5:00 p.m.An Overview of Operational Psychometric Work in Real WorldJongPil Kim, Laura Kramer, Jinghua Liu, Hyeonjoo Oh, and Ye Tong
Fee: $55Maximum Attendance: 30
The purpose of this training session is to provide an overview of psychometric work that is routinely performed by testing organizations. The work scope includes evaluation of items and test forms written and assembled by test development specialists, item analysis and test analysis, equating and scaling, score reporting, field test design, standard setting, etc. These statistical activities are conducted with specific purposes of ensuring the quality of a testing program’s reported scores and supporting appropriate interpretations of these scores. This training session describes the interpretation and communication of analysis results to test score users as well. This training session will focus on four topics: 1) outline of operational psychometric activities across different testing companies, 2) hands-on activities related to item review and test form review, 3) hands-on activities related to reviewing and interpreting equating output and making decisions; and 4) discussion session regarding factors that affect operational psychometric activities such as testing mode comparability. The current training facilitates various professional psychometric skills and research knowledge, as well as describes the applications of recent methodological developments adopted in practice. Hands-on examples and activities will also be included as part of the training session to provide the participants some real world examples. Representatives from different testing organizations and University research centers will present various topics related to processes in an operational cycle.
Many graduate students and junior level psychometricians have knowledge on psychometrics and measurement theory but may not have enough opportunities to expose themselves to the real world psychometrics work. We are hoping that through this training session, participants will get a glimpse of the entire operational cycle, as
Pre-Conference Training Sessions Wednesday, April 15, 2015 Half-Day Afternoon Sessions
16
Pre-Conference Training Sessions Wednesday, April 15, 2015 Half-Day Afternoon Sessions—continued
well as gain some understanding of the challenges and practical constraints that psychometricians face at testing organizations. After the training, we are expecting participants are able to evaluate item analysis and equating results. Each presenter will directly interact with training participants and work together with them. Questions and answers will be encouraged and entertained at any point during the session.
Wednesday, April 15, 2015NCME101:00 p.m.-5:00 p.m.Cognitive Lab Techniques: An Overview, Framework, and Some PracticeMeirav Ariel‐Attali, Irvin R. Katz, and Jung Aa Moon
Fee: $55Maximum Attendance: 15
Cognitive labs have become increasingly popular over the past decades as methods for gathering detailed data on the processes by which test‐takers understand and solve assessment items and tasks. Cognitive labs result in data that may inform a wide variety of research and practical issues in the field of educational measurement, ranging from assessment development (e.g., “are test takers confused by the phrasing of this item?”) to validity (e.g., “does this item engage the expected knowledge and skills from test takers?”). For example, within validity, cognitive labs can provide evidence on response process validity (AERA, APA, & NCME, 1999), help detect construct‐irrelevant factors affecting test‐taker performance, and address various fairness and accessibility issues.
Nonetheless, even a quick review of the Procedures section of a few cognitive lab studies reveals that the phrase “cognitive labs” is used to describe different techniques (Arieli‐Attali et al., 2011): think aloud or verbal reports as in Ericsson and Simon’s (1984) methodology (e.g., Barkaoui, 2011; Baxter, & Glaser, 1998; Katz, 1994), cognitive interview and/or retrospective verbalization (e.g., Almond et al. 2009; Hansen, 2009; Snow & Katz, 2009), stimulated retrospective (Feng & Sand, 2013), and others. How are researchers or practitioners to know what techniques yield the right type of data to address particular research or practical questions? A poorly designed cognitive lab can yield data that do not help address the question of interest or, worse yet, lead to unwarranted conclusions (cf. Leighton, 2004).
By the end of the workshop, attendees should have a greater appreciation for the range and variety of cognitive lab techniques as well as a framework for organizing the techniques in terms of their related research questions. This understanding should aid attendees in their own work on conducting cognitive labs, in interpreting data from cognitive labs, and in critically reading research literature that utilize cognitive lab techniques.
17
Thursday, April 16, 2015 Full Day Sessions
NCME118:00 a.m.-5:00 p.m.Multidimensional Item Response Theory: Theory and Applications and SoftwareLihua Yao, Mark Reckase, and Richard Schwarz
Fee: $105Maximum Attendance: 30Publication Provided: Multidimensional Item Response Theory
Theories and applications of multidimensional item response theory model (MIRT) and Multidimensional Computer Adaptive testing (MCAT) and MIRT linking are discussed. Software BMIRT, LinkMIRT, SimuMIRT, and SIMUMCAT are demonstrated. BMIRT (Yao, 2003) is a computer program that estimates item and ability parameters in the multidimensional multi-group IRT framework; exploratory and confirmatory approaches are supported. LinkMIRT (Yao, 2004) is linking software that links two sets of item parameters onto the same scale in the MIRT framework. SimuMIRT is software that simulates data for various MIRT models. SimuMCAT (Yao, 2011) is a computer program for MCAT simulation, which has five MCAT item selection procedures with item exposure control methods and content constraints. This session is intended for researchers who are interested in learning and understanding MIRT, MIRT linking, and MCAT and their applications and who are working with dichotomous or polytomous data that is multidimensional in nature. BMIRT supports the three-parameter logistic model, generalized two-parameter partial credit model, graded-response, rater model, and testlet-effect models.
Participants should bring laptop computers and any data they would like to use. Participants are required to download the free software to the laptop they intend to use prior to the session at www.BMIRT.com for the hands on experience. Participants are required to download the Java Runtime Environment or JRE to the laptop computer.
This workshop will introduce MIRT, MIRT linking theory, and MCAT and conduct hands-on experience using BMIRT, LinkMIRT, SimuMIRT, and SIMUMCAT. There are demonstrations and discussions of results and output. Extensive uses of representative examples included with the program are used to guide learning. Hands-on activities are 50% of the session.
The participants will: a) learn the associated concepts and gain a comprehensive understanding of MIRT, MIRT linking, and Multidimensional CAT; b) know the applications of MIRT, MIRT linking, and MCAT; c) understand appropriate uses of BMIRT, LinkMIRT, SimuMIRT, and SIMUMCAT; d) understand the data input requirements and formats, and; e) understand and be able to interpret the output files.
Pre-Conference Training Sessions
18
Pre-Conference Training Sessions Thursday, April 16, 2015 Full Day Sessions—continued
NCME128:00 a.m.-5:00 p.m.Generalizability Theory and ApplicationsRobert L. Brennan
Fee: $105Maximum Attendance: 30Publication Provided: Generalizability Theory
Generalizability theory liberalizes and extends classical test theory. In particular, generalizability theory enables an investigator to disentangle multiple sources of error through the application of analysis of variance procedures to assess the dependability of measurements.
The primary goals of this training session are to enable participants to understand the basic principles of generalizability theory, to conduct relatively straightforward generalizability analyses, and to interpret and use the results of such analyses. Mathematical and statistical foundations will be treated only minimally. Major emphasis will be placed upon quickly enabling participants to conduct and interpret relatively straightforward generalizability analyses, then more complicated ones. Examples will include various types of performance assessments.
In general, the goals of this training session are to enable participants to understand the basic principles of generalizability theory, to conduct G(eneralizability) studies and D(ecision) studies, and to interpret and use the results of generalizability analyses. More specifically, the objectives of this training session are as follows:
A) Basic Principles1) An understanding of principal similarities and differences between generalizability theory and other
psychometric theories;2) An understanding of principal similarities and differences between generalizability theory and analysis of
variance;3) Knowledge and understanding of the fundamental concepts in generalizability theory, including universe
of admissible observations, universe of generalization, G studies and D studies, facets and objects of measurement, variance components, universe score, variance, error variances, and generalizability coefficients.
B) Computational and Estimation Procedures4) Ability to compute by hand, or with a hand calculator, estimates of variance components and other
parameters in generalizability theory for simple designs, given mean squares;5) Ability to employ computer programs such as GENOVA to estimate parameters for real data sets and
balanced designs;6) Knowledge of the characteristics of estimates of variance components, and other parameters in
generalizability theory.C) Applications
7) Ability to appropriately interpret results from generalizability analyses;8) Ability to design reasonable and useful G and D studies;9) Ability to conduct generalizability analyses with not-too-complicated real data sets;10) An understanding of appropriate and inappropriate uses of generalizability theory.
All attendees are asked to bring a laptop computer.
19
Pre-Conference Training Sessions
NCME138:00 a.m.-5:00 p.m.Bayesian Networks in Educational AssessmentRussell G. Almond, Robert J. Mislevy, David M. Williamson, and Duanli Yan
Fee: $105Maximum Attendance: 30Publication Provided: Bayesian Networks in Educational Assessment
The Bayesian paradigm provides a convenient mathematical system for reasoning about evidence. Bayesian networks provide a graphical language for describing and reasoning in complex models. This allows assessment designers to build scoring that have fidelity to cognitive theories, are mathematically tractable and can be refined with data. (Book is included).
This course will provide the background information on Bayesian networks, Graphical Models and related inference and representation methods and provide examples of their use in educational assessment. Although the course will review the Evidence Centered Design framework for representing measurement models in educational assessments using graphs, the primary goal is to review the work done in other communities for psychometricians and psychologists.
Then, after a brief overview of the most commonly used Bayesian network tools, it will provide a well-received interactive hands-on session on using Bayesian network tool on small examples for Bayesian inference, manipulating graphical models and applications in educational assessment. It will also review the existing body of literature on graphical models from other disciplines (in particular, the Uncertainty in Artificial Intelligence literature). The course will consist of a series of lectures interspersed with formative assessment, and hands-on examples. The live examples will provide illustrative examples of graphical models in education with some live computations.
Topics covered are evidence-centered assessment design, basic Bayesian network representations and computations, available software for manipulating Bayesian networks, refining Bayesian networks using data, and example systems using Bayesian networks. The last application was the focus of the presenter’s 2000 NCME Award for Outstanding Scientific or Technical Contribution to Educational Measurement.
The training course consists of the following 5 sessions:
1. Evidence Centered Design2. Graphical Models 3. Graphical Modeling Tools and Applications4. Refining Graphical Models with Data 5. ACED: ECD in Action Demonstration.
Thursday, April 16, 2015 Full Day Sessions—continued
20
Pre-Conference Training Sessions Thursday, April 16, 2015 Half-Day Morning Sessions
NCME148:00 a.m.-12:00 noonItem Response Theory with jMetrik and Psychometric Programming with JavaPatrick Meyer
Fee: $55Maximum Attendance: 50
jMetrik is an open source program for psychometrics. It is a user-friendly program that incorporates a common data source and a variety of procedures for measurement such as tools for classical test theory, item response theory, scale linking and score equating. Among the psychometric procedures are marginal maximum likelihood estimation of item parameters in the three parameter logistic model (3PLM) and generalized partial credit mode (GPCM). As a pure Java application, jMetrik runs on windows, Linux, or Mac OSX operating systems using either 32- or 64-bit processors. This workshop teaches participants to use jMetrik for applications of item response theory. It also introduces them to programming with Java and the source code that drives jMetrik.
In the first part of the workshop, participants will use jMetrik to analyze test data. They will use jMetrik to estimate item and person parameters for the 3PLM and GPCM. Participants will also learn to create various plots such as item characteristic curves and information functions.
jMetrik is built entirely with the Java programming language. Source code is divided into two main libraries: jmetrik and psychometrics. The jmetrik library provides the interface and database related functionality, while the psychometrics library contains the measurement-related code such as classes for item response models and MMLE. Working with these libraries requires an understanding of object oriented programming and the Java language.
Many people are familiar with statistical and psychometric programming with R, SAS, and other software, but they are less familiar with lower-level languages such as Java. In the second part of this workshop, participants will be introduced to object oriented programming with Java and how to code, compile and execute their own program. They will then learn about the psychometrics library and how to use it for item response theory, building their own application or adding functionality to the library.
NCME158:00 a.m.-12:00 noonLanding Your Dream Job for Graduate StudentsDeborah J. Harris, Nathan Wall, and Xin Li
Fee: $30Maximum Attendance: 30
This training session will address practical topics graduate students in measurement are interested in regarding finding a job and starting a career, concentrating on what to do now while they are still in school to best prepare for
21
Pre-Conference Training Sessions Thursday, April 16, 2015 Half-Day Morning Sessions—continued
a job (including finding a dissertation topic, selecting a committee, maximizing experiences while still a student, including networking, internships, and volunteering, what types of coursework an employer looks for, and what would make a good job talk), how to locate, interview for, and obtain a job (including how to find where jobs are, how to apply for jobs—targeting cover letters, references, and resumes), and the interview process (job talks, questions to ask, negotiating an offer), and what’s next after they have started their first post PhD job (including adjusting to the environment, establishing a career path, publishing, finding mentors, balancing work and life, and becoming active in the profession).
NCME168:00 a.m.-12:00 noonFundamentals of Item Response Theory and Computerized Adaptive TestingDavid J. Weiss and Alper Sahin
Fee: $65Maximum Attendance: 20Wireless Internet Service Provided
Computerized adaptive tests (CAT) have had substantial impact over the past decade, especially after they were put into use by state-led consortia (e.g. Smarter Balanced, WIDA) for accountability purposes. The rise of CAT in educational measurement has manifested itself in a need to train educational researchers, practitioners, and educational managers on Item Response Theory (IRT) and CAT.
This training session will address the basics and fundamentals of IRT and CAT. It will provide the participants with a broad overview of what IRT and CAT are and how they can be implemented by educational institutions. In addition, attendees will have some practical demonstrations on how to use some specialized IRT and CAT software (e.g. CATsim and Xcalibre). Participants will be actively involved in the training through group discussions and some practice activities. They will also be provided with electronic copies of the materials including the PowerPoint presentations and related handouts used in the session. The intended audience includes graduate students, multi-field educational researchers, practitioners, and educational management professionals who have little or no knowledge of IRT and CAT.
Upon completion of this training session, participants will be able to build the prerequisite knowledge base for developing their own IRT-based research or CATs and develop an understanding of how the assessment systems of the 21st century function. In parallel with this, the participants will also develop the rationale and motivation to use CAT for accountability purposes.
NCME178:00 a.m.-12:00 noonAnalyzing NAEP Data Using Marginal Estimation Approach with the AMEmmanuel Sikali
Fee: $65Maximum Attendance: 20Wireless Internet Service Provided
22
Pre-Conference Training Sessions Thursday, April 16, 2015 Half-Day Morning Sessions—continued
The National Assessment of Educational Progress (NAEP) is the only nationally representative and continuing assessment of what America’s students know and can do in various subject areas. Assessments are conducted periodically in mathematics, reading, science, writing, the arts, civics, and other subjects. Since NAEP assessments are administered uniformly using the same sets of test booklets across the nation, NAEP results serve as a common metric for all states and selected urban districts, attracting many researchers’ interests in conducting studies using NAEP data. However, NAEP data pose a lot of challenges for researchers due to its special design features.
NAEP assessments do not focus on individual students’ achievement. The aim is to document achievement at group level. Students take different but overlapping combinations of portions of the entire pool of items. No one student receives enough test questions to provide an accurate test score. Instead, statistical methods are used to calculate score distributions for groups of students directly from answers given by many students, without the intermediate step of calculating scores of individual students. This procedure allows coverage of a large number of items in targeted content frameworks. Because of this approach, however, NAEP does not provide scores for individual participants. Instead, multiple plausible values are provided for each participant for secondary data analysts’ research.
The unique psychometric and sampling features of NAEP require special considerations in analyzing NAEP data, prohibiting researchers from using common statistical software packages (e.g., SAS or SPSS) without appropriate handling. In addition, analyzing NAEP data with plausible values requires analysis to be limited to the variables and interaction terms included in a conditioning model to produce plausible values. This workshop will introduce users to the psychometric design of NAEP, sampling procedures and data analysis strategies required by these design features. These include marginal maximum likelihood estimation approach to computing scale scores, and appropriate variance estimation procedures. NCES released a mini-sample public-use NAEP data file in 2011. This data file provides a great opportunity to illustrate statistical analysis with NAEP data. Analyzing NAEP data using direct estimation approach allows researchers to investigate interactions among variables that were not included in the conditioning model.
Upon completion of this training seminar, it is expected that participants will:
•Be familiar with the psychometric and sampling design, content, and research utility of the NAEP assessments;
•Understand the need for using weighting and variance estimation variables correctly; •Be able to analyze complex NAEP data based on marginal estimation approach using the AM software; •Know the resources available to them at the National Center for Education Statistics (NCES) they can tap
for assistance in their research.
At the start of the seminar, we will assess attendees’ skills and knowledge by having them share their research interests, previous work in the area, and level of expertise in working with large data sets, complex sample design, and weighting and variance estimation procedures. This will help as we focus the lectures in each session.
We also will provide participants with electronic hard copies of all slideshow presentations and related handouts. Handouts will include descriptions of the survey instruments, examples illustrating how to use the AM software, and links to the NAEP website.
The workshop will be structured to help participants meet the goals described in the summary. Participants will have the opportunity to reflect on how the information shared is relevant to their own research interests.
23
Pre-Conference Training Sessions
NCME181:00 p.m.-5:00 p.m.Using IRT for Standard Setting in Performance-Based AssessmentsBoaz Shulruf and Philip Jones
Fee: $55Maximum Attendance: 30
Item Response Theory and related models are complex statistical techniques, mostly used for improving test and item quality with limited application in standard setting. This workshop demonstrates how the Rasch model could be used for standard setting in performance-based assessments including the advantages and limitations of this approach.
IRT models utilise the information in tests to estimate person and items parameters. This workshop will focus on applying IRT, particularly the Rasch model, for setting standards in educational assessment. Most of the currently used standard setting methods rely upon panels of judges to make decisions on the expected performance of a minimally competent examinee in a given test, either at the whole test or at an item level. Some methods use information obtained from IRT analyses to support judges' decisions (Clauser, Mee, Baldwin, Margolis, & Dillon, 2009; Wang, 2003).
The practical challenge in standard setting is to make a defensible decision on scores that are neither clearly pass nor clearly fail, hence borderline. Ben-David phrased it well by defining the purpose of standard setting to “separate the non-competent from the competent” (Ben-David, 2000, p. 120). This challenge is particularly difficult in examinations that use grading systems that include the category or score range of a "borderline performance’"(e.g., clinical examinations, open-ended type of examination). However, if the main purpose of the assessment is to distinguish between competence and incompetence, a borderline grade fails to do so (Boursicot, Roberts, & Pell, 2007; Roberts, Newble, Jolly, Reed, & Hampton, 2006; Schoonheim-Klein et al., 2009; Wilkinson, Newble, & Frampton, 2001).
To address this critical issue, a myriad of standard setting methods have been developed, aiming to identify a cut-score on a continuous scale that best distinguishes between competent and incompetent examinees (Cizek & Bunch, 2007; Kane, 2013; Zieky, 2012). Nonetheless, despite this broad range of methods, concerns about reliability, validity and acceptability of these cut-scores remain due particularly to unavoidable bias related to judges’ decisions (Chang, Dziuban, Hynes, & Olson, 1996; Wayne, Cohen, Makoul, & McGaghie, 2008).
Improving the reliability of judge-based methods normally requires recruiting a large number of experts who need to go through a lengthy and expensive process (Ben-David, 2000; Brannick, Erol-Korkmaz, & Prewett, 2011; Cizek & Bunch, 2007; Hurtz & Auerbach, 2003; Wayne et al., 2005). Moreover, once a judge-based standard is set, it may be different to the original standard intended by the item/examination writers. This may add further confusion as it is not clear which standard should prevail (Cizek & Bunch, 2007).
The current workshop provides practical and defensible solutions to some of the issues mentioned above: 1) introducing an effective method to determine borderline scores which minimise judges’ biases; 2) introducing the
Thursday, April 16, 2015 Half-Day Afternoon Sessions

24
Pre-Conference Training Sessions Thursday, April 16, 2015 Half-Day Afternoon Sessions—continued
use of the Rasch model in setting standards at the item level as well as the whole test level; and 3) introducing a technically simpler method to the Rasch model.
The Rasch Borderline Method (RBM) and related methods discussed in this workshop will demonstrate how defensible Pass/Fail decisions could be made at the item and test levels while minimising the impact of judges’ attributes/biases on those decisions (Chang et al., 1996; Wayne et al., 2008). In the workshop we will also introduce results from new simulation studies demonstrating that the accuracy of a Rasch based standard setting method exceeds 70% with approximately 10% false positive and 18% false negative rates.
NCME191:00 p.m.-5:00 p.m.An Introduction to Using R for Quantitative MethodsBrian Habing and Jessalyn Smith
Fee: $65Maximum Attendance: 48Wireless Internet Service Provided
R has become a favorite of researchers. This half-day course will interactively cover some of the most useful aspects for data analysis and statistical methods. This course is designed for those who are interested in using R for applying quantitative methods but have no previous experience with R.
This session is designed to introduce the statistical package R so that the attendees will both be able to use R for basic statistical analyses and have an understanding of how it can be used in their own teaching, research, or operational work. This will include guidance on becoming familiar with R, selecting appropriate packages for carrying out more advanced methods, and providing selected custom designed functions to easily produce output in a format similar to that presented in most text books.
NCME201:00 p.m.-5:00 p.m.Advances in Measuring 21st Century Skills: Constructs, Development, and ScoringPatrick Kyllonen
Fee: $55Maximum Attendance: 40
The workshop begins with an overview of the issues involved in assessing noncognitive skills. We identify a number of frameworks, such as 21st century skills (e.g., ATC21S, NRC), and school frameworks (e.g., University of Chicago Consortium on Chicago School Research, the California Office to Reform Education, the INDEX Mission Skills Assessment), and discuss overlaps with the five-factor personality model. We review methods for assessing noncognitive skills: self, teacher, and peer assessments, anchoring vignettes, single and multiple dimensional forced
25
Pre-Conference Training Sessions Thursday, April 16, 2015 Half-Day Afternoon Sessions—continued
choice and ranking methods, situational judgment tests, and implicit association and conditional reasoning tests. We review classical and IRT-based scoring methods for each assessment, and discuss pros and cons. We also discuss score reporting, to highlight current status, comparisons, and trends, and review approaches for collecting and analyzing data on background variables.
We examine the use of certain methods in detail, including anchoring vignettes, forced-choice and ranking methods, and situational judgment tests. For anchoring vignettes we review writing from construct and item definitions, administering, scoring (primarily nonparametric scoring), and reporting. We review what is known and discuss item development procedures starting from construct definitions and using those to create vignettes at various levels on the trait continuum (e.g., low, medium, and high skill). We also discuss practical matters such as whether to administer them before or after items, and with or separately from items. We discuss scoring anchoring vignettes, and provide hands-on practice. Participants will be shown how to write code to score anchoring vignette tasks. We review item analysis techniques and discuss reporting on vignette-adjusted scores.
For forced-choice methods we review approaches (e.g., pairs, sets of 3, sets of 4; asking for “more like,” “least like,” and both, other ranking methods), and review advantages and disadvantages of ipsative and quasi-ipsative scoring approaches, using both classical and IRT. We review findings to help participants understand when one might use forced-choice approaches.
For situational judgment testing, we review item development, including approaches for collecting critical incident data from experts, and transforming such data into test items. We compare testlet and single statement rating scale items, and multiple-choice items, both “select-the-best,” “select-the-worst,” and “select what you would do” formats. Participants receive hands-on experience in developing SJT items. Both classical and item-response theory scoring approaches are reviewed, in particular the nominal response model for scoring, along with visualization plots for determining appropriate scoring models. We review issues in reporting.
NCME211:00 p.m.-5:00 p.m.Understanding Automated Scoring: Theory and PracticePeter W. Foltz, Claudia Leacock, and David Williamson
Fee: $65Maximum Attendance: 40Wireless Internet Provided
Automated scoring of constructed responses is increasingly used for formative and summative assessments. The goal of this session is to open up the black box and enable a practitioner’s understanding of automated scoring: what it is; what it does and does not do well; and how to use it.
Even as debate rages about whether computers should assign scores to essays, the reality is that automated scoring systems (AES) are part of the assessment landscape. Why? There are clear advantages of automated scoring in terms of reporting time, costs, objectivity, consistency, transparency and feedback.There are also major challenges:
26
Pre-Conference Training Sessions Thursday, April 16, 2015 Half-Day Afternoon Sessions—continued
automated scoring systems cannot read or understand an essay in the way that humans can, nor are they designed to recognize novelty and they cannot evaluate many aspects of higher-order reasoning. The goal of this workshop is to tease apart what automated scoring systems can do well, what they cannot do well, and what are reasonable short-term expectations for how it can be used based on current research. The workshop is designed to provide practical advice and considerations for practitioners about what automated scoring is, how it works, how it can be applied, and what decisions need to be made in integrating these systems into formative and summative assessments.
Opening the black box.We will provide an in-depth orientation to the various methods that are used to create an AES to evaluate both written and spoken assessment responses. Text-processing techniques are deployed to evaluate essays, content-based short-text responses. Speech processing techniques are currently used to evaluate spoken responses. These systems are driven by constructing features and manipulating using statistical tools of NLP/Speech processing and Machine Learning. Other NLP/Speech based systems are used to detect plagiarism, gaming and at-risk essays.We will discuss methods of constructing features and methods of assembling them into scores. We will contrast NLP/Speech tools/orientation to those of psychometric tools, drawing parallels to the measurement concepts the audience might be more familiar with (e.g., polytomous items; conditional dependence problems). Finally, we will distinguish scoring from feedback. Participants will have the opportunity to write (or copy and paste) essays into two operational essay scoring systems to learn about how the systems are used.
Putting systems into operational practice.Designing and implementing an AES system is only the first step. Turning it into an operational system and deploying it is a topic that is usually completely overlooked in research papers on automated scoring. We will describe different models of deployment and their processes. Steps include preprocessing of the textual data, filtering unscorable essays and diverting to hand-scoring, model building, assigning a score and reporting it.
Evaluation of automated scoring systems.The workshop will describe different approaches to the performance of AES systems. The most common approach is evaluation relative to human scores such as exact or adjacent agreement and quadratic weighted kappa. However, flaws in human scoring are well known so that measurement relative to human scores may not be the best evaluation metric. Systems can also be evaluated relative to external criteria and relative to construct definitions. Finally, we will address the most important question “what is good enough for system deployment?”
Maintaining systems over time.Another critical topic that will be covered is how to maintain an automated scoring system over time. Managing changes to the engines as they are improved has many implications. In addition, as a prompt ages, there are trends/drift over time in both human scores and nature of responses. The workshop will describe how to incorporate these considerations into operational practice.
Open issues, future directions, and general discussion.The workshop will conclude with a discussion about appropriate applications of automated scoring, issues for its implementation and where the field is going. This section will contrast the current state of tools and knowledge about

27
Pre-Conference Training Sessions Thursday, April 16, 2015 Half-Day Afternoon Sessions—continued
selected response with approaches for automated scoring of constructed responses. It will examine mechanisms by which the automated scoring can blend some selected response approaches and human constructed response scoring. Finally, the workshop will end with a general discussion about what the field needs, both in terms of NLP/Speech and psychometrics, to strengthen the operational use of automated scoring and provide some predictions for the future.