Embed Size (px)
Citation preview

1
April 11, 2007 Reflections on Declining Crime in Chicagoby Wesley G. Skogan
This report examines recent crime trends in Chicago. It describes what happened in thecity, and addresses the issue of why crime has declined so precipitously. The drop in crime in theUnited States was one of the most important social facts of the late 20 Century, and, in manyth
places, this decline has continued unabated in the 21 Century. However, the post-1991 drop inst
crime remains one of the least understood social facts of our time. Many studies of crime declinefocus only on easily available measures, and none encompass the full range of explanations thathave been advanced to explain it. Research conducted during the 1990s sometimes identifiedfactors that could not explain the continued drop in crime in the 2000s. Studies of the “national”decline overlook the fact that violent crime is extremely concentrated in a few big cities, and thatchanging conditions there have extraordinary leverage over the crime rate for the nation as awhole.1
The report draws upon the conclusions of this research plus well-established theoriesabout the causes of crime. Where possible, it matches them up with data from Chicago for the14-year period 1991-2005. The findings challenge some popular explanations for declining crime– for example, that it was due to the state’s growing prison population, an increase in the numberof police, or the city’s improving economic fortunes. The data indicate these cannot account formuch of the decline in crime in Chicago. Other explanations hew more closely to the facts, but inmany instances there simply is not enough information to adequately test potentially importantexplanations for the decline of crime in Chicago. The potential influence of both an improvementin the quality (as opposed to quantity) of policing and the mobilization of communities aroundcommunity policing and crime prevention fall in this category. Where appropriate, I havetherefore added my own judgment about these matters to the mix of data and research, and in theconclusion I advance a scenario which might account for the post-1991 drop in crime in Chicago.There is also a discussion of what this review tells us about priorities for future research.
Crime Trends in Chicago
Crime peaked in Chicago in 1991, then began its long decline. By 2005, violent crime(which includes murder, rape, robbery and aggravated assault) declined by 59 percent. Propertycrime (burglary, property theft and auto theft) dropped by 43 percent. Figure 1 describes thesetrends. It presents crime totals rather than yearly crime rates, because the city’s populationchanged hardly at all during the 1990s. As the Figure illustrates, the largest decline was in2
robbery, which went down by 64 percent. Robbery is seen by many as a bellwether indicator ofurban trends, because it combines theft, risk to life and limb (a gun is often involved) andpredatory intent. Homicide and sexual assault, the least frequent of the offenses presented here,are graphed on a separate scale so their trends are visible. Murder dropped by 52 percent, a3
decline that was magnified by a 2003-2004 dip of 25 percent. Sexual assault dropped 55 percent.4
The assault category encompasses many kinds of offenses, including domestic violence, gangbattles, bar brawls, and outbursts of violence on school grounds, as well as disputes betweenneighbors. Aggravated assault (the most serious offenses in this category) dropped by 54 percent.
2
In the property-crimecategory, auto theft wasdown by 52 percent. Thisoffense is accurately reportedby victims and recorded bypolice, due to the high valueof the average loss and thefact that most cars and trucksare insured against theft.Stolen vehicles are alsosometimes recovered,another reason to makeaccurate reports. Burglaryalso went down by 52, andburglaries just of residencesand garages dropped by 50percent.
There are other waysof classifying the same offenses, and some important alternate crime categories also registeredsubstantial declines. An offense of special significance is gun crime, for in many ways it is gun5
use that differentiates American violence from that of other nations. Combining all offenses in6
which a firearm was used in some way, there was a 64 percent drop in the level of gun crime inChicago. Another offense category that resonates with the public is “street crime.” To create astreet-crime index, violent incidents of all kinds were classified by their location, to identifycrimes that took place on the street or sidewalks, in alleys and parks, along the lakefront, or inparking lots and driveways. Crimes in this category declined by 55 percent between 1991 and2004.
An important feature of the decline in crime in Chicago is that it was extremelywidespread. Virtually every neighborhood in the city benefitted. The smallest geographical unitused by Chicago Police Department is the police beat. To gauge the breadth of the drop in crime,I calculated whether crime went up or down between 1991 and 2005 in each of the city’s 279beats. Property crime went up in five beats and down in 274 beats. Violent crime went up in 167
beats (5.4 percent of the total) and declined in 263 beats. The only community areas withsubstantial percentage increases in violent crime over this period were Hegewisch, West Elsdon,West Lawn and Ashburn. Among the city’s 77 community areas, property crime went up (by 5percent) only in Clearing.
3
Another way todescribe the breadth of crimedecline in Chicago is togroup the city’s police beatsby their racial composition,based on the 1990 census.8
The resulting areas differ insize, so Figure 2 reportsyearly rates of crime per100,000 persons living ineach. As it illustrates, crimedeclined most dramatically inAfrican-Americancommunities, where robberydropped by 65 percent andhomicide by 49 percent.Other trends there included a53 percent drop in rape and a38 percent decline in assault.
Robbery in principally white areas (where it was already quite low) dropped by 51 percent, whilefor Latinos the decline was 64 percent. Gun crime dropped by 65 percent in predominantlyAfrican-American areas, and it was down by 60 percent in heavily Latino beats. Burglary fell by48 percent in largely African-American beats; for whites the comparable figure was also 48percent, and for Latinos it was also 57 percent. On the other hand, motor vehicle theft (which isnot shown here) dropped the most in predominantly white areas, by 63 percent, while it wasdown 38 percent in African-American beats and 58 percent in largely Latino areas. By the mid-2000s, Chicagoans in most neighborhoods had seen tremendous improvement in the quality oftheir lives, due to the broad-based nature of the drop in crime in the city. That said, the levelingoff and even slightly increasing rate of crime in predominately African American beats evident inFigure 2 bears watching.
Finally, the magnitude of this decline can be further illustrated by calculating “what if?”numbers. These forecast what crime would have looked like if it had not dropped over the 1991period and, instead, had remained at its 1991 level. For example, in the real world 10,803 personswere murdered during 1991-2005. However, if homicide had continued at its 1991 pace, by theend of 2005 the total would have been just over 13,900; another 3,100 people would have died.Other “what if” numbers are even greater. In that hypothetical world there would have been about656,750 robbery victims rather than 382,200 robbery victims. There would have been 16,000more sexual assaults, 250,000 more burglaries, and 222,000 more auto thefts, if crime had notdropped as it did. The decline in crime registered in Chicago over this 15-year period has hadtremendous consequences for its residents.
But why did crime drop so precipitously? There has been a great deal of debate about thisquestion, for Chicago is not the only city experiencing a substantial drop in crime during the

4
same period. Explanations for the decline in crime range from “a” (alcohol use, which is down)to “z” (zero tolerance policing, which is up). Some of these claims have been tested with data;other claims are based on relevant research but there are no data on them over time; and somereflect who has the microphone. The sections below examine most of the serious claims. Like allstudies of this issue, the data to test some is more adequate than for others. Moreover, there is notalways a correspondence between the quantity or quality of the data and the potential significanceof the findings. Sometimes there is no data at all, but this is not evidence of the importance of theclaim, but merely of what research has been funded and published. In each case, when I address aclaim I will draw upon what we know from research on crime around the country as well as uponthe data for Chicago. This may tell us something about the general effects of forces at work inChicago, and this research will also be a source of the specific statistical estimates of the impactof well-researched causal factors on violent and property crime.
Demography
One of the most fundamental features of the kinds of crimes considered in this report isthat offending is disproportionally concentrated among the young. Youths age 15-24 or so are byfar the most likely to be arrested and to admit high levels of involvement in crime when they areinterviewed by researchers. Because of the general aging of the American population during the1990s – a result of the greying of the large post-WWII baby-boom generation – many havespeculated the national drop in crime was due to a declining number of youths in high-risk agecategories. This was particularly true during the early years of declining crime, when the size ofthe youth cohort was declining. However, toward the end of the 20 Century the 15-24 age9 th
group began to grow again, as the grandchildren of the boomers (the so-called “second echo” ofthe original baby boom) aged into higher-risk categories. During this period the growth of the 15-24 age cohort was touted by forecasters as putting new upward pressure on crime rates.10
Table 1: Trends in Age 1990-200011
percent of the city’s
population
percent male
age category 1990 2000 1990 2000
10-14 6.8%
190,488
6.9%
200,802
50.3 50.7
15-19 7.2
200,988
6.9
200,962
50.8 51.3
20-24 8.4
235,616
8.3
239,252
50.1 50.0
25-39 10.0
278,694
9.7
280,588
49.9 49.8
total age 15-24 15.6
436,604
15.1
440,214
50.4 50.1
Table 1 presents an age profile of Chicagoans in 1990 and again in 2000, a time periodwhich brackets two-thirds of the decline in crime to date. As the Table indicates, the age

5
structure of the city’s population changed only slightly during this span. There wereproportionally fewer people in the highest-risk age category by 2000, but the difference wassmall. In absolute terms (remember that the city’s population grew by 0.6 percent) the number ofresidents age 15-24 actually increased slightly. Of course, it is more accurately the number ofyoung males in the population that is most significant, for they are far more likely to get introuble. Table 1 illustrates that the city’s gender distribution remained almost completelyunchanged between 1990 and 2000.
None of the very small changes in the city’s population described in Table 1 couldaccount for a large drop in crime. But unlike the country as a whole, there was no significantincrease in the number of young people beginning in the late 1990s, so this factor also did notplace any upward pressure on the local crime rate. Note, too, the risk of females being arrested inChicago has been on the increase, especially for violence. In 1991, 12 percent of arrestees forviolent crimes were females, a figure that rose to over 20 percent by 2004. This matches closely anational trend. Because of their numbers, any changes in offending rates among women are of12
great significance for the criminal justice system as well as for society.
Economic Conditions
Many have attributed the decline in crime to the vigor of the American economy, whichgrew steadily between 1993 and 2001. During that period unemployment fell nationwide byalmost a third and real incomes rose for many groups. Declining unemployment plus an increasein the minimum wage during the 1990s contributed to increasing affluence at the low-income endof the economic spectrum. Research indicates both wages and employment possibilities primarilyhave their effect on crime in this end of the labor market. One study concluded that together theyexplained almost one-third of the national decline in crime during the 1990s. There may also be13
an effect of income inequality on crime, but this moved in the opposite direction during the1990s, toward an increase in wealth at the upper end of the economic spectrum.14
Table 2: Citywide Trends in Poverty and Prosperity 1990-20001990 2000 1990 2000
persons in poverty 21.6%15
592,298
19.6%
556,791
female-headed
households16
10.7%
109,821
10.0%
105,705
families in poverty 18.317
116,641
16.6
105,752
high school
graduates18
66.0
1,153,871
71.8
1,304,122
owner-occupied
households19
41.5
425,259
43.8
464,865
college graduates20
(age 25 and older)
19.5
339,862
25.5
462,783
median household
income (adjusted to
1999 dollars)
$34,433 $38,625 households below
$20,000 (1999 dollars)
25.6
261,966
26.6
282,907
However, the economic changes registered in Chicago over this period were adisappointing response to a near-decade of national good times, and they could not explain largedecreases in crime. Chicagoans became better off, but not by much. Table 2 presents measures of
6
the extent of poverty and prosperity in Chicago 1990 and 2000, years that bracket much of thedecline in crime.
As Table 2 indicates, poverty declined fractionally between 1990 and 2000. Thepercentage of all Chicagoans living below the poverty line dropped by two percentage points, soabout 35,500 people were better off in 2000 than in 1990. The number of families in povertydropped by only 1.7 percent. The proportion of households consisting of children living withsingle mothers (an important poverty measure) only went down 0.7 percent, and there were only4,100 fewer of these extremely vulnerable families in 2000 than in 1990. Overall unemployment(which is not shown in Table 2) was also down a bit, from 11.3 percent in 1990 to 10.1 percent in2000. In 1990, 1,207,000 Chicagoans were employed; in 2000 the total was 1,220,000, a gain of21
about 13,000 in the labor force. Adjusted for inflation, median household income (the point thatsplits the number of households in half) rose 12 percent, from just over $34,000 to more than$38,000 per year. This was a healthy 12 percent increase. However, in 2000 slightly moreChicagoans fell at or below a low-income cutoff of $20,000 per year. Most of the economicimprovement seen in the city was concentrated nearer the top of the income distribution. Overthis period income inequality rose, because much of the growing affluence of the city wasconcentrated in the above–$100,000 category.22
Two prosperity-related measures are also included in Table 2: home ownership andeducation. Home ownership went up by only 2.3 percent over this period. On the other hand,between 1990 and 2000, the percentage of Chicagoans with a high school diploma rose from 66percent to almost 72 percent, and the percentage of college graduates rose an impressive sixpercentage points. By 2000, the number of Chicagoans who were not high school graduates haddeclined by more than 81,000. However, these slight-to-modest changes for the better in theeconomic health of the city were unlikely to have accounted for the tremendous decline in crimeregistered in Chicago.
But criminologists know that it is more important to look at the economic condition ofyouths. As noted above, crime is a young persons’ game, and crime rates are likely to be mostsensitive to changes in opportunities in the legitimate labor market for young people. Staying in23
school is also important. Compared to school leavers, students who remain in school get intomuch less trouble with the law, and they are much more likely to succeed in the job market asyoung adults. Most of the crime considered in this report is committed by young men with littleeducation, few skills, and a checkered job history. The left-hand panel of Table 3 examinestrends for a key group of youths, those age 16-19. Persons in this age group are in the midst ofchoosing between remaining in school and searching for a job. The latter may have already founda job or dropped out of the labor force in discouragement. Between 1990 and 2000 there wereonly very tiny changes in the economic condition of youths age 16-19. In 2000 they were a littlemore likely to still be in school or working, and they were slightly less likely to be unemployedor to have dropped out of the labor force. These changes were positive, but they were very smallin magnitude.

7
Table 3: Economic Trends Among Youths, 1990-2000percent of civilian labor
force*, age 16-1924
1990 2000 percent of persons in
poverty, by age25
1990 2000
in school 72.6%
118,408
73.4%
119,239
age 12-17 31.0%
70,234
26.6%
61,332
working 10.4
17,042
10.8
17,577
age 18-24 24.4
73,510
24.0
73,394
unemployed but
looking for a job
5.3
8,594
5.0
8,090
labor force drop-out 11.5
18,688
10.8
17,513
*Note: this table does not include a very small number of armed forces members. In principle this table
includes locally incarcerated youths in the “not in labor force” category, but they may not be represented
with much accuracy.
The right-hand panel of Table 3 examines changes in youth poverty during the 1990s. In
2000, Chicagoans age 12-17 were less likely to be living in poverty; in fact, there were almost9,000 fewer poor children in this category. However, among youths 18-24 (the age group athighest risk of serious offending) there was no progress at all. There is no evidence of shifts inprosperity among youths that were large enough to account for declining crime in Chicago duringthe 1990s. To the contrary, the real news is the high level of youth poverty in both decades,26
among both age groups. Even in 2000 about one-quarter of all the city’s young people were poor.
Incarceration
One of the liveliest debates concerning crime policy is over the impact of mountingnational incarceration rates. In June 2005, 2.9 million people were locked up nationally, three-quarters of them in prisons and the remainder in city and county jails. Analysts differ in theirmethodologies, but in the main, they attribute somewhere between one quarter and one third ofthe decline in crime to prisons alone. 27
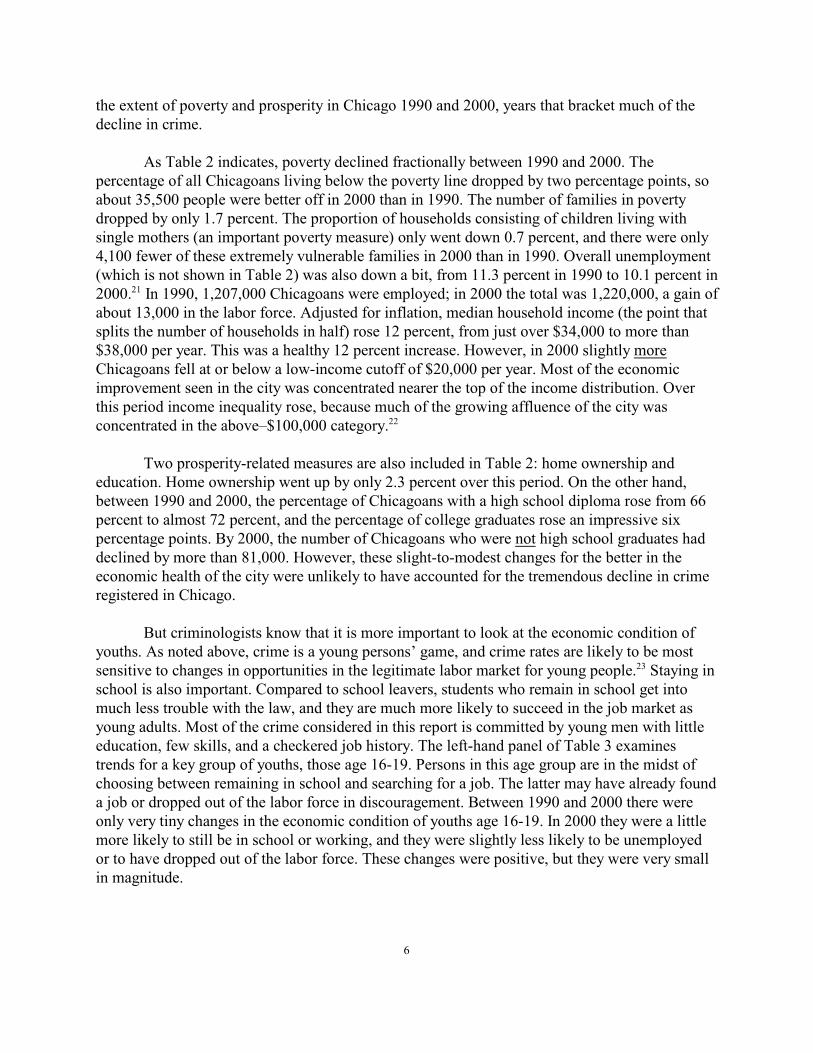
Prison and jail populations grew locally as well. Figure 3 illustrates trends in the numberof Illinois’ prisoners from Chicago, and the population of the county jail. The former is an28
estimate, based on county prisoner counts and arrests. Between 1991 and 2005 the number ofstate prisoners from Cook County grew by 35 percent, and the average yearly jail populationexpanded by 38 percent. Projecting the effect of these incarceration figures requires an estimateof the number of state prisoners who are sent from Chicago itself. I based this estimate on yearlycity-county arrest ratios for serious crimes. For example, in recent years this ratio has been29
about 2/3 from the city versus 1/3 from the remainder of the county. Second, I used the findingsof research on the extent to which imprisoning offenders impacts crime. Prisons (and to a lesserextent jails; see below) influence crime rates through the reduction in crime that occurs becauseinmates cannot commit offenses while behind bars. The deterrent effect of fear of going to prisonalso keeps people from offending in the first place, or from re-offending in the future. There hasbeen some research on the impact of yearly changes in incarceration rates on crime which can beapplied to Chicago’s prison population, to see how that could affect the next year’s crime rate.
8
Estimates of the prisonincarceration effect vary fromplace to place, crime to crime,and study to study. However,the consensus figure is about20 percent of the increase ordecrease in prison populationsis translated to subsequentchanges in the property crimerate. For violent crime, the30
most commonly-discussedfigures are 15 percent and 20percent. Both estimates willbe used here.31
Figure 4 summarizes crime trends predicted using these formulas. It presents both theactual violent crime figures and the level of crime predicted by changes in estimated prisonincarceration rates for the city, using crime in 1991 as the starting point. As the Figure illustrates,by any account changes in the size of the prison population in Illinois could explain only afraction of the decline in crime registered in Chicago. The number of prisoners in Illinoisincreased by 64 percent between 1991 and 2005. However, in part because crime in Chicago wasdropping faster than elsewhere in the state and in the remainder of Cook County, Chicago’sestimated prisoner count grew by only 35 percent between 1991 and 2005. Relying on pastresearch, this change in incarceration levels probably translated into a 5 percent drop in propertycrime during the period, and to a 5 percent to 7 percent decline in violent crime. Projections inthe Figure that are based on these assumptions are the “minimum impact” estimate and the“maximum impact estimate” of the effect of incarceration on violent crime in Chicago. The32
disjuncture between estimates of the impact of incarceration and the 60 percent decrease inrecorded violence between 1991 and 2005 is apparent.
What estimates of the impact of prison could have accounted for the actual drop in crime?Because the best minimum and maximum estimates of the impact of prison on Chicago crimeincorporate assumptions about the impact of prison, the Figure also presents the implications ofmaking an assumption that would closely fit the decline in crime during the first part of theperiod considered here. With 1991 as a starting point, the “maxi” forecast presented thereassumes that 100 percent of yearly changes in the city’s prison head count were translated intocrime reduction. However, even this maximal estimate, which lies far outside the bounds of whatdata and theory indicates is likely, fails to track Chicago’s declining violent crime rate after thelate 1990s. It further illustrates that changing levels of incarceration could not account for thecontinued drop in Chicago crime during the 2000s, because Illinois’ prisons stopped growing andthe city’s share of the now-stagnant inmate population kept dropping. The State’s head count

9
peaked in 2001 at 45,630,dropped to 43,140 in 2002, andstood at just over 44,700 in2005. All of the statewidegrowth in prisons since 1991had occurred by the year 2000.Chicago’s (estimated) prisonercount peaked in 1999 at18,400, after which the city’sshare of state prisoners beganto decline even more sharply.None of these trends line upwith the continued drop incrime in the city, which haspersisted for at least anotherhalf-decade. Incarceration wasa widely trumpeted solution tothe crime problem during aperiod when prisons were
expanding and crime was dropping, but crime in Chicago continued to drop sharply even afterthe State’s enthusiasm for incarceration waned.
Growth in the county’s jail population also could not account for the decline in crime.Research on crime reduction has focused on prisons, but many of those arrested by the policeserve at most a short jail sentence. Jails are places of short-term confinement, and inmates comeand go rapidly. In the course of a year the Cook County jail admits as many as nine times the33
number of people it holds at any one time. Some admittees go on to prison. However, most areeither quickly released on bail, diverted to an electronic monitoring or day reporting program,returned to community programs, or are fairly promptly sentenced to the time they have alreadyserved. There has been no applicable research on the preventive effects of jail on city crime rates.However, during the 1990s and 2000s there was a considerable increase in Cook County’sinmate population; the numbers were presented in Figure 4 above. During virtually the entireperiod the jail population has been space driven, expanding as new facilities are opened butperennially crowded beyond its designed capacity. Inmates have been sleeping on the floor at thejail on a continuous basis since 1988. Between 1991 and 2005 successive expansions of the jailplus systematic overcrowding led to a 38 percent increase in its average daily population, from7,590 to 10,572 inmates. Because the number of persons arrested for personal and property34
offenses in Chicago was declining during the same period, in the aggregate the jail was receivingan increasing percentage of those arrested, which could have increased its deterrent effectiveness.However, even using a generous estimate of the deterrent impact of a spell in jail, the rise in thecounty’s inmate population could not explain much of the decline in crime in the city, predictingat most a 2.6 percent drop in violence and a 3 percent decline in property offenses.35

10
There are issues about prisons that need to be watched carefully. The first is the adverseimpact of the removal of large numbers of men from already fragile communities. While their(temporary) disappearance may lend some degree of safety to the community, it is not withoutcost. Their stigma gets transferred to family, friends, and to the community as a whole.Breadwinners are lost; and many families have to reorganize and build new care networks if theyare to survive. Children go fatherless, spousal relationships become unglued, and everyone maysuffer a loss of self-worth and self-esteem. The return of large numbers of ex-offenders in turn36
further undermines the community, increasing the concentration of poverty, alienation from legalinstitutions, cynicism regarding conventional authority, and the stigma associated with “reentryrecycling.” The fate of those who are released from prison is also a critical issue. As the prison37
population has stabilized, the number of inmates being released each year now approximates thenumber admitted. The numbers are large: in the year ending June 2002, 38,000 adults werereleased, and in 2005 it was 39,200. How many have returned to Chicago over time is38
unknown, but a 2004 study found that 54 percent of a sample of adult releasees (or almost 20,000of them) were returning to Chicago. Their fate could exercise a great deal of influence on trends39
in crime. Generally the fate of recently released inmates is strongly tied to the well-being of thecommunities to which they return. In Chicago, this has disproportionally been to some of thecity’s most disadvantaged neighborhoods. There are only limited programs for recent returnees,40
yet they have to succeed on the job market fairly quickly if they are to avoid getting into troubleagain. However, their employment prospects are poor, and many do not succeed. The three-yearrecidivism rate for releasees from Illinois’ prisons is about 40 percent, and the five-year rate is 54percent.41
Policing
Increasing incarceration rates are not the only widely-touted explanation for decliningcrime. Beginning in the 1990s, police leaders joined politicians in stepping forward to claim ashare of the credit. Many cities tried to hire more police, facilitated by the Crime Act of 1994,which set aside federal funds to support police salaries. Police chiefs also claimed credit because,they argued, they were policing “smarter.” They were focusing their efforts on crime hot spots,using computer technology to identify crime trends, and adopting community policing programsthat brought them more cooperation from the neighborhoods they served.
A claim which can be evaluated is that increasing the size of the police force helpedaccount for declining crime during the 1990s and 2000s. Figure 5 traces the growth of theChicago Police Department over this period. The number of police officers in Chicago increasedfrom 12,132 to 13,423, or 10.6 percent. Most of the increase was during the 1990s. The numberof police in the city peaked in 1999 (at this point it was up by 13 percent) and then declined a bit.In light of the cost of adding officers to the force, this represented a significant financialcommitment by the city.

11
How much of adecrease in crime could weexpect from an increase in thenumber of police officers ofthis magnitude? There is not aclear consensus on the point,but I will use prominentlyrecommended estimates of 43percent for violent crime and50 percent for propertycrime. Figure 6 compares42
trends in reported violent andproperty crime with the levelspredicted by these formulae.43
As the Figure indicates, a 10percent increase in the size ofthe police force, when half orless of that change istranslated into a reduction in
crime, cannot explain the overall trend in crime in the city during the 1990s and 2000s. Based onthese calculations, growth in the number of police could account for only about 4.4 percent of thedecline in violent crime and 5.1 percent of the drop in property crime. This was far from the dipChicagoans actually enjoyed over this period. Furthermore, the number of police serving Chicagopeaked in 1999 and was essentially stable after that. Crime, on the other hand, dropped just asquickly in the 2000s as it had in the 1990s.
Presumably, increasedand perhaps more effectivepolicing have much of theireffect on crime through theability of the police toapprehend offenders. Somefraction of the deterrent effectof policing is through theexperience – or fear – of beingarrested and possibly spendingsome time in behind bars. Theprincipal determinant of howmany people are arrested inChicago is the amount ofcrime. As a result, as crimedeclined so did violent andproperty crime arrests. Toaccount for this, Figure 5

12
(presented earlier) accounted for declining crime by presenting trends in the ratio of arrests tocrimes. For example, in 1991 Chicago police arrested about 55,200 property crime offenders,while in the same year that they recorded just over 231,000 property crimes, for a ratio of .24. Bythis measure, property crime offenders were at about the same risk of being arrested throughoutthe course of the 1990s. But in the 2000s that risk diminished somewhat. Police kept even withviolent crime during the 1990s as well, but then did a bit better during the 2000s, as the ratio ofarrests to crimes in that category went up noticeably. Because of the virtually automaticconnection between the number of crimes and some large fraction of arrests, there are noconsensus estimates of how arrests independently affect the crime rate. It is notable that violentcrime had leveled off in the years prior to 2003, then began to drop again at the same time as thismeasure of arrest effectiveness went up. However, police arrest effectiveness remained relativelyunchanged for most of this period. In the violent crime category the arrests-to-crime ratio roseonly recently, after years of declining crime, so arrest effectiveness probably could not accountfor much of the steady drop in crime over the entire period.
Did crime go down because police were policing more intelligently? The world ofpolicing was in ferment throughout the period considered here. It was a time during which bothnew policing strategies and refinements on tried-and-true tactics promised more effectiveness.Some of the tactical refinements included focused hot spot policing and increasing sophisticationin the timing and management of traditional crackdowns on street drug markets. Focused patrolsand traffic stops aimed specifically at reducing gun carrying became more prominent. Targeted“quality of life policing,” which calls for aggressive arrest policies to counter seemingly minorcrimes such as public drinking, graffiti writing and panhandling, was credited by some as atheory-driven approach to reducing more serious crime. Even aggressive traffic enforcement44
has been shown to deter crime across large samples of cities. Identifying and taking action at45
locations that are the source of repeat calls for police assistance became routine. Problem solvingpolicing became more popular, especially projects linking police with health, safety, housing andother service and regulatory agencies, for this provided them with new tools for addressingchronic concentrations of crime. Around the country, all of these efforts were increasingly guidedby sophisticated police information systems that helped managers discover and respond morenimbly to opportunities to prevent crime. Information technology was increasingly employed bymanagerial accountability systems (such as New York City’s famous “CompStat” process) thatput new pressure on police leaders to perform effectively. Collectively, these strategic initiativeswere characterized as the “smarter policing” of the 1990s and later. Many attribute the drop incrime to increasing police effectiveness during this era. Community policing, which had its rootsin the 1980s, also rose to prominence during the 1990s; its possible role in reducing crime will beconsidered in a later section of this report, under community factors.46
These programs and others were adopted in Chicago. By the early 2000s, Chicago policehad developed a managerial system and computer resources that could support a focus on crimehot spots and make better use of gang intelligence. District and unit commanders are heldresponsible for identifying and responding effectively to emerging crime patterns, including atreview sessions held weekly at police headquarters. The plan is to “put cops on the dots”identified using the department’s information technology and gang intelligence. Beginning in

13
2004, more than 500 officers are assigned to two special squads that are deployed fromheadquarters on a short-term basis to anticipated trouble spots, in order to interrupt violencebefore it breaks out or spreads further. Other units aggressively arrest and question offenders inthe vicinity of recent shootings, pressing them to identify the shooters and the sources for guns.Officially designated gang and drug hot spots (there are currently about 90) are a special focus; in2004 police dispersed more than 53,000 individuals and made 314 arrests in these areas.47
Roadside safety checks and saturation patrols routinely flood areas identified as crime hot spots.Each year police gather information during several hundred thousand traffic stops that do notresult in an arrest or citation, for use as an investigative database. Most recently, remotelycontrolled cameras have been placed on more than a hundred utility poles around the city in orderto monitor street drug markets. Narcotics teams have shifted their focus to building complexcases against networks of dealers and wholesale distributors, using criminal conspiracy charges.Earlier Chicago made a great deal of progress in focusing city health and safety inspections andthe delivery of municipal services on problem buildings and neighborhoods. Police officers alsoparticipate in multi-agency teams to conduct strategically targeted code violation inspections. Inthe second half of the 1990s, an aggressive campaign was launched against trouble-makingestablishments that sell liquor. “Vote dry” campaigns at election time, aggressive inspections,and successful strategies to revoke the licenses of offending merchants have increased theorderliness of the liquor distribution business. As early as 1993, the patrol division began tofundamentally reorganize how officers went about their daily business. Hundreds of teams ofofficers were formed and assigned particular beats. The 911 dispatching system was reconfiguredto keep teams working in their own areas. Officers, and later thousands of neighborhoodresidents, were trained in problem solving techniques during the mid-1990s. Over much of theperiod there was increasing coordination between Chicago police and other state and federalenforcement agencies. A 2005 report by the University of Illinois details many of theseinnovations.48
The difficulty is finding ways to measure the breadth and depth of these diverse effortsover the post-1990 era, in order to capture their contribution to the local drop in crime. Broadly-focused national or multi-city studies do not even attempt to do this because there are noconvenient over-time data on the quality, as opposed to quantity, of policing. A recent review of49
research on policing finds evidence supporting the effectiveness of many of the highly focusedpolicing efforts described here, but those conclusions are based on the findings of city-by-cityexperiments and evaluations. Research on the drop in crime focuses on the number of police,50
but it is surely what police do, rather than how many are on the payroll, that has an impact on thestreet. As the review above suggested, there is no reason to think what police do has stayed thesame over time. But even a single-city focus does not yield the right information for making astatistical estimate of the impact of the quality of policing. As I indicated, the upward shift in“arrest effectiveness” illustrated in Figure 5 is consistent with my description of changing policestrategies, but it is far from definitive evidence that those innovations were effective. And, thereare other difficulties. The drop in crime in Chicago began well before the innovations describedabove, and it began three years before the citywide implementation of the city’s communitypolicing program. This does not mean that these efforts could not have helped later. Chicagocrime continued to drop well into the 2000s, while the decline faltered in some larger cities after

14
2000. (For example, Detroit, Philadelphia, Dallas and Phoenix are cities where homicide beganto trend the wrong direction in the new millennium.) In the conclusion I will consider thepossibility that different factors could come into play at different points during the fairly longtime period considered here, and policing strategies could be among them. But the bottom line isthat there is an absence of evidence concerning the aggregate, over-time impact of innovations inpolicing in Chicago.
Drugs, Guns and Gangs
This section examines the impact of three highly interrelated features of crime inAmerica: drugs, guns and gangs. There is good reason to consider them together, for they areinterrelated and together lie at the core of big-city crime problems.
Drugs. A popular explanation for the decline in crime which began in the early 1990swas an apparent waning of interest in crack cocaine. It is argued that a crack cocaine epidemicduring the late 1980s fueled an expansion of street drug markets. This in turn precipitated warsamong gangs over control of these markets, with a subsequent widespread diffusion of guns forboth offensive and defensive purposes. Young men in big cities were in particular drawn into thedrugs-gangs-guns nexus. Killings by them (and of them) accounted for much of the upsurge inviolence that characterized the late 1980s. Then, it is argued, the crack market changed. Whatsupposedly happened remains vague: crack markets are variously described as “maturing,”“stabilizing,” “waning,” “ebbing,” “becoming less lucrative,” and facing “diminished demand.”However, broad multi-city studies typically do not have much independent information on drugsat all. Their conclusions may draw more on the observed drop in crime and the changing profileof homicide victims and offenders they are explaining, rather than on information about real
changes in drug markets.51
Changes in drug markets mayalso affect crime through theirimpact on individualconsumers. Drug abusecertainly remains at highlevels among those arrestedfor violent and propertycrimes. In 2000, 76 percent ofarrestees for non-drugoffenses in Chicago testedpositive for one or more offive major illicit drug groups.This was the highestpercentage among the 35cities studied. Research on52
temporary police crackdownson drug markets indicates oneof their effects is to increase

15
the frequency of robberies and burglaries nearby, presumably because a sharply constrictedsupply leads to upward spikes in drug prices. Long-term studies have also documented that53
expanding heroin use leads to higher robbery rates.54
One difficulty with assessing the waning crack market argument is that the character andextent of drug markets is difficult to measure. The police primarily work with the data presentedhere on drug arrests. This is an enforcement measure, reflecting where and how police conducttheir investigations, but there is some evidence that drug arrests broadly mirror the distribution ofdrug markets. Figure 7 charts trends in drug markets in Chicago, based on drug arrests. The55 56
findings do not neatly conform to the contention that violence dropped in response to waninginterest in crack cocaine. Rather, the ability of police to find crack dealers peaked in 1998, yearsafter crime began its precipitous decline. It also did not decline very much. In 2004 there werestill five times as many crack cocaine arrests as in 1991, and the situation probably still deservedthe label “epidemic.” Heroin arrests also rose rather than fell during much of the 1990s. Theypeaked in 1998 and 2000, but the trend in heroin arrests was essentially flat after 1996. Arrestsfor marijuana soared through the entire period. By 2005, marijuana accounted for 45 percent ofall drug arrests. Powder cocaine arrests dropped in parallel with crime through 1997, but thenleveled off at a low ebb for the remainder of the period. In short, during this 14-year decline inproperty and violent crime, crack cocaine seemingly increased rather than decreased inpopularity, and trends in the other components of the drug market mix in Chicago also did notneatly fit the “receding epidemic” theory of drug-related violence that has been advanced toexplain national crime trends.
When measuringtrends in drug crime, the majoralternative to police arrestreports is data on emergencyroom treatments and drug-related deaths. The figures areassembled by a federal officewhich orchestrates reports by anetwork of local healthagencies. Data for the57
Chicago area include all ofCook County. Similarly tourine tests of arrestees,emergency drug treatment datapoint to comparatively highlevels of drug use in andaround Chicago. In 2001, forexample, Cook County rankedsecond among 21 largemetropolitan areas in the rate
at which individuals were admitted for heroin-related health emergencies, and it ranked at the
16
very top for cocaine-related admissions. Cocaine admissions were almost 9 times as frequent inChicago as in San Diego; they were four times as frequent as in Washington, DC, and 1.7 timesas frequent as in New York City.58
Like police arrests, trends in emergency room treatment do not neatly fit the “recedingepidemic” theory of drug abuse. The data are presented in Figure 8. Unlike arrests, cocaine-related emergency room episodes declined substantially – by more than 65 percent – between1991 and 1997. Incidents involving combinations of drugs and alcohol followed a parallel track.However, after 1997 both measures of drug abuse turned sharply upward, and by 2004emergency room episodes involving cocaine and drug-alcohol combinations were as frequent asthey had been in 1991. Over the same period, marijuana and heroin-related health emergenciesskyrocketed, rising 520 percent and 157 percent, respectively. Treatment episodes formethamphetamine abuse also rose dramatically, by 260 percent. Because this trend began at alow base, the figures for 2004 were still relatively low, but they deserve careful attention in thefuture. Overall, trends in emergency room treatment do not paint a picture that corresponds totrends in personal and violent crime, which dropped continuously over the entire period.59
What is certain is that there was a tremendous over-all increase in the number of drug-related arrests over this period. Between 1991 and 1998 the number of drug arrests in the cityrose from 21,450 to 58,500, a 173 percent increase. After stabilizing, the drug arrest total rose abit more, exceeding 59,000 by 2004. This growing number of arrests is particularly startling inlight of the declining number of arrests in many other categories, reflecting the drop in crime. In1991, drugs accounted for 9 percent of all the non-traffic arrests made by Chicago police; by2004 drug offenses accounted for 30 percent of all non-traffic arrests in Chicago. An importantreason why Illinois’ inmate population shrunk as little as it did in the face of steadily decliningviolent and property crime was this new source of prisoners. Another feature of this shift in crimecontrol was that virtually all of these new arrests targeted African-Americans. In 2004, 79percent of all drug arrestees were African Americans. Between 1991 and 2004, the number ofLatino drug arrestees rose from 4,000 to 7,600, while the number of white arrestees rose from3,150 to 4,780. For African Americans the total rose from less than 28,000 to more than 46,000.60
When multiplied by the racially disproportionate prosecution, sentencing and incarceration thattakes place further downstream in the criminal justice system, this shifting enforcement patternhas helped give Illinois one of the most racially disproportionate prison systems in the nation.61
Guns. Gun availability and use also plays an independent role in increasing the severity –and perhaps the rate – of violent crime. Guns intensify the consequences of violent encounters,because they increase the likelihood of death. They may also increase the overall frequency of62
crime somewhat, because some crimes – high-payoff commercial, cargo and bank robberiescome first to mind – simply are not practical to carry out without a gun. However, the statisticalevidence is that it is the severity of injury and risk of death, not the general frequency of offenses,that is driven by the availability of firearms. Increasing semiautomatic handgun use was the63
most important component driving overall homicide rates in the late 1980s and early 1990s.Locally, “… the proportion of all firearm homicides in Chicago that were committed withsemiautomatic pistols rose from 23 percent in 1985 to 60 percent in 1993.”64

17
As noted earlier, between 1991 and 2004 there was a 64 percent decline in the number ofgun crimes Chicago. It is impossible to tell whether this reflects a decline in the availability ofguns to criminals, but I doubt that. Rather, it is more likely that the readiness of Chicagoans tocarry guns declined. This is signaled by two related trends of the 1990s and 2000s. First, thenumber of guns seized by Chicago police dropped by 54 percent. Guns are seized under a varietyof circumstances that empower police to make lawful searches. These range from traffic andpedestrian stops to arrests for committing other crimes, so seizures reflect what police werefinding among the substantial segment of the population that came under suspicion during thisperiod. A second trend was a 64 percent decline in arrests for weapons violations recorded inChicago between 1991 and 2005. Suspects are charged this way when they are found inpossession of a gun but other more significant criminal charges cannot be laid against them,including robbery, rape or assault. This is another measure of gun carrying, and it too evidenced aremarkable decline during the period considered here.
However, the declinein violent crime in Chicagowas not simply a story aboutdecreased carrying of guns.The decline in gun crime wasgenerally matched by trends inother forms of violence. Thisis illustrated in Figure 9,which charts trends in gun-related and non-gun crimes.As it indicates, gun and non-gun robbery dropped atroughly the same pace overthis period, by 68 percent and61 percent respectively.Assaults with a gun droppedmore rapidly than mayheminflicted with fists or otherweapons, but non-gun murder
(down 61 percent) declined much further than gun-related homicides (down 47 percent). Thelatter is due to the very heavy involvement of gangs in gun-related killings, and gang-relatedcrime has proven less tractable than other forms of violence. 65
Gangs. Gangs are certainly another important cause of crime. We used to call them“youth gangs,” but they have changed in character. During the 1980s, massive adult joblessnessamong African-Americans extended the age profile of active gang members, because burgeoningdrug markets provided them with a new way to make a living. Since then, members returningfrom prison have begun to rely on their old gangs for employment in the trade. Currently,66
perhaps one quarter of those released from Illinois’ prisons are gang members, and their risk ofrecidivism is higher than others. Compared to gangs in other cities, Chicago’s are very large67
and stable, highly structured with clear vertical lines of authority, and maintain tight internal

18
discipline. There are pipelines for moving their profits into the legitimate economy, to help fendoff the tax authorities. They have strong ties to the city’s political organizations as well.68
One of the functions of gangs is to recruit new members and steer them into theorganization’s criminal enterprises. Chicago powerful street gangs are deeply implicated indrugs, gambling, extortion, theft, gun smuggling, re-marketing valuable parts from stolen cars,financing gypsy cabs, selling “protection” from rival gangs, and other businesses requiring staff.Another role of gangs is to recruit replacements for members who have been arrested andincarcerated. This contributes to a sad spiral of increasing overall criminality as a consequence oflaw enforcement efforts, particularly in the drug business. Third, they cause crime to the extent towhich they foster inter-gang and intra-gang violence, for on occasion they also make war on oneanother. Estimates of the number of gangs and gang members vary. By one account, in 2003 thecity was home to 68 gangs split among 600 factions, with a total of perhaps 68,000 members. 69
A 1990 study set the number at 40 serious street gangs with 36,000 members.70
Like drug offenses,evidence of the rise and fall ofgang crime comes primarilythrough the investigativeefforts of the police. Whenthey are able to identify“whodunnit” in murders andassaults, Chicago police havea well developed andconservative scheme forclassifying crimes as gangrelated. Trends in gang andnon-gang homicides arepresented in Figure 10. In1991, gangs were linked to 16percent of homicides, andoverall only 2 percent of allcrimes involving a gun thatyear were classified as gang
related. Since, trends in gang crime have only sometimes matched those for non-gang crimes.Murders that did not involve a gang dropped steadily during the 1990s; by 1999, non-gangmurders were down by more than 62 percent and all non-gang gun crimes by 59 percent. Gang-related violence beat a different path. Gang killings rose 260 percent between 1991 and 1994,slid back to their 1991 level by 2000, and then spiked again in 2001 and 2002. By 2005, gang-related homicide had subsided to its 1991 level, which was progress given their roller coastercourse during that period. But because non-gang homicide had fallen more precipitously, thegang-related fraction became more visible. By 2005, gang killings made up 35 percent of allhomicides, more than double their proportion a decade-and-a-half earlier.71

19
As these findings suggest, gang homicide is different, and so probably are its solutions.While the many social and economic factors discussed here may have played a role in steadilydeclining levels of non-gang crime, a significant fraction of crimes are rooted specifically in theorganizational dynamics and business environment of the city’s violent street gangs. In the firstthree months of 2006, for example, more than 60 percent of all homicides were gang-related. Inthis world, disputes over honor and status have violent outcomes. One attack leads to another.Killings lead to retaliatory killings, and violence ripples through the community, ricochetingamong organizations. Within gangs, violence is exercised in order to impose discipline, collectstreet taxes, and maintain the standing of power-holders (as when former kingpins return fromprison demanding their share). Between gangs, violence is a tool for settling disputes over drugmarkets and control of other illicit enterprises, and those too can escalate into retaliatory spirals.72
It was because of the resulting spike in gang homicide in the early 2000s that Chicago named apolice chief who emphasizes targeting the seemingly intractable drugs-guns-gangs nexus at theheart of the city crime problem.
Community Factors
A significant fraction of all criminological research focuses on the role of communityfactors in controlling crime. They range from the strength of informal bonds of trust amongneighbors to organized crime prevention efforts by community groups. Communities struggle tocontrol crime on several different levels. At the most private, neighborhoods vary in the strengthof family values and the ability of parents to socialize and control youths. At another level liesshared norms and trust among neighbors, and a willingness in the community to intervene whenthings go wrong. Together, widespread trust and willingness to intervene make up what is knownas “collective efficacy,” which is a community factor strongly linked to levels of crime. Highcrime communities suffer from disrupted networks of friendship, kinship and acquaintanceship,which limits their capacity for mutual informal coordination and cooperation. Informal “pro-social” interventions and effective sanctioning behaviors are much weaker in these areas.Structural disadvantages, such as concentrated poverty and residential turnover, hurtcommunities in particular at the private and informal levels of cooperation. At another level ofsocial control lies the groups and organizations which make up civil society. There is someevidence a strong infrastructure of organizations can sustain a community’s capacity for self-healing social action. Controlling for other things, residents of these communities are seen asmore likely to take action and intervene, compensating somewhat for weakened informal tiesamong neighbors in areas where organizations are still strong.73
Decades of research have demonstrated how community factors are powerfuldeterminants of levels of crime. However, little is known about whether community factorswaxed or waned during the 1990s and 2000s, nor the extent to which changes in communityfactors are linked to changes in levels of officially recorded crime. In the main, collectiveefficacy is strongest in stable, white home-owning neighborhoods in Chicago, but the size of74
that population shrank rather than expanded during the 1990s. Research on community factors75
typically stresses their complex and multifaceted character, and much of this research relies onspecially-collected local data. None of the prominent studies of recent crime trends have taken

20
any notice at all of community factors. This void is certainly due in large measure to the absenceof any national, over-time data on them. For example, there is vigorous debate over whetherorganizational involvement by Americans has gone up or down. Community has not figured in76
studies of the decline in crime because this large body of research does not lend itself to one ortwo index numbers which can be included in statistical models testing their role relative to otherpotentially important determinants of crime trends.
On the other hand, Chicago has been home to a mammoth social experiment inregenerating the capacity of communities to act locally against crime. One of the goals of itscommunity policing program has been to foster civic involvement by residents. Through itscommunity meetings, rallies, and problem-solving projects, police have tried to serve as acatalyst for restoring the public’s ownership over public space and activating the very informalcontrol mechanisms that have been the focus of criminological research.
One intervention was the inauguration of monthly gatherings of small groups of residentsand police officers. These began on an experimental basis in 20 percent of the city in 1993. Byearly 1995 police were holding neighborhood meetings in church basements and park buildingsall over Chicago. In the city’s plan, beat meetings are the principal mechanism for building andsustaining closer coordination between police and the general public. The meetings provide aforum for exchanging information, and a venue for identifying, analyzing and prioritizingproblems in an area. They are a very convenient place to distribute announcements aboutupcoming community events, circulate petitions, and call for volunteers to participate in actionprojects. As they have evolved, beat meetings have also become a venue for regular reports bypolice to the community on what they had done since the last meeting about the problems theyhad discussed.
Figure 11 charts trendsin beat meeting participationbetween 1995 and 2003. Theleft axis reports monthlyattendance counts, while theright axis presents thecumulative total of attendeessince community policingbecame a citywide program.Chicagoans attended beatmeetings 59,200 times during1995 and on nearly 61,120occasions during 1996. In 1999,it was 67,100, and in 2000,66,260 turned out for beatmeetings. In 2003, 60,000people attended a total of 2,888beat meetings, and by the end of

21
that year city residents had cumulatively attended beat meetings on more than 582,000 occasions.Importantly, beat meeting attendance rates have proven to be highest in the poorest, highest-crime areas of town, in places where many other mechanisms for tackling neighborhoodproblems do not work very effectively.77
The city’s community policing plan is also meant to involve the public directly inneighborhood problem solving efforts. During the mid-1990s, thousands of civilians were trainedin problems solving, in parallel with the new training that was delivered to more than 9,000patrol division officers. A civilian agency was created to generate support for problem solvingprojects, start block clubs, and turn people out for monthly beat meetings. More than 40 percentof residents surveyed at beat meetings reported getting involved in fairly aggressive activities,including marches, prayer vigils, neighborhood patrols, and stand-ups and smoke-outs introubled areas. Even more popular is attending assemblies and forums, working to organizeneighborhood groups, and contacting public officials to get action on local problems; 64 percentof beat meeting participants got involved in these activities. Just as important, like beat meetingattendance, public involvement in problem solving has been most frequent where it is needed themost, in high-crime, drug-ridden neighborhoods. During the 1990s, Chicagoans of all races78
regularly reported more positive views of the police, which may have also increased policeeffectiveness.79
Have the neighborhood mobilization components of Chicago’s community policingprogram had an effect on crime? There is only very limited over-time data on the strength ofcommunity factors. When the findings of surveys conducted in 1995 and in 2003 are compared,the intervention capacity of Chicago’s neighborhoods rose very modestly. The perception thatresidents of their neighborhood would intervene pro-socially to break up a fight rose from 20 to28 percent; and that they would intervene to prevent vandalism rose from 33 to 45 percent.Survey reports of block club membership rose by about five percentage points, to 19 percent.80
These survey results varied from area to area within the city, so they could be compared withchanges in recorded crime over the same period. Depending on the type of crime, increases in theintervention capacity of beats were correlated -.2 to -.4 with declining crime; the same was trueof variations in the extent to which the organizational involvement of residents grew over time.Crime also declined more than most in areas with higher beat meeting turnout rates; thecorrelation between beat meeting turnout and changes in violence and burglary rates ranged -.3 to-.4. These findings are far from definitive, but they directly measure changes in communityfactors over time, and they are among the best evidence that changes in community mobilizationsparked by the city’s community policing program have contributed – modestly – to the declinein crime.81

22
Other Programs
Hope VI and Public Housing. In a social experiment of even greater magnitude,Chicago has also been knocking down much of its public housing. Between 1999 and 2005 thenumber of occupied units in family housing complexes dropped by 45 percent. This put theChicago Housing Authority (CHA) at the mid-point in a planned $1.6 billion program ofdemolition and rebuilding. Of course, the residents have not gone away; demolition hasredistributed them somewhat, but most former residents appear to have stayed in the city. Theextent to which their lives have taken a turn for the better is variable; however, there is room foroptimism. Chicago residents leaving family high-rise projects with housing vouchers havesucceeded in moving to safer and somewhat better off areas with better-performing schools.82
There is broad agreement the concentration of poverty created by massive public housingdevelopments in itself had bad consequences which were independent of the characteristics of thefamilies living there. Gangs, drugs and guns were an everyday feature of the lives of manyresidents, and there were few places to hide. Now many of those developments are gone. Crime83
in and around Chicago Housing Authority buildings is in rapid retreat. There has been significantnew construction and appreciating house prices in the neighborhoods of all of the major projectsthat were demolished.84
Figure 12 presentstrends in crimes taking placein CHA apartments,hallways, stairwells,elevators, parking lots, andon the grounds of thedevelopments. The top panelsreport the total number ofCHA-related violent andproperty crimes each year.The lower panels detailtrends in violent crime:murder, rape, assault, and allcrimes involving a gun. Asthey report, crime was downby a substantial margin, inpercentage terms bysubstantially more thancitywide totals. By 2005,
there were 82 percent fewer violent crimes and 84 percent fewer property crimes than in 1991.Rape declined the most, by 89 percent.
Obviously, crime was down in CHA complexes for at least two reasons: In addition to thegeneral forces pushing down crime in Chicago, the resident population plummeted. What can befound to account for the steady decline in the number of CHA residents is the number of

23
remaining occupied housing units, which is available for the 1999-2005 period during which theCHA’s Plan for Transformation began to become a reality. As noted above, between 1999 and2005 the number of occupied units dropped by 45 percent. However, even taking this decline intoaccount, CHA crime still dropped considerably. To illustrate this, Figure 12 also presents trendsin personal and property crime rates (per 1,000 occupied units) for the period in which unitcounts are available (trends for the detailed types of crime presented in the bottom panelsfollowed the same pattern.). During this brief period the CHA personal crime rate declined by 32percent, and the property crime rate by 42 percent. Citywide, the decline over this period wasactually less; personal crime was down 22 percent and property crime 24 percent. By 2005,offenses in and around CHA properties constituted only 0.5 percent of the property crimes in thecity, and 2.5 percent of violent crimes. However, in 1991 they only contributed 1.5 percent of85
the property crime and 5 percent of the property crime in the city, so CHA crime never accountedfor enough of the total to explain the 50-60 percent declines we have seen citywide.
School Safety
Schools should be natural partners in any community safety program. They certainly canbe loci for problems. Rambunctious youths are corseted there all day, and they surge through thesurrounding neighborhood during their journey to and from school. National surveys of studentsindicate fear and victimization can be high in schools. In addition, student surveys find it isreportedly easy to find drugs and even weapons in and around many schools. In Illinois, a 1990statewide survey of public high schools found that one in four students feared violence in schooland one in five feared the journey to and from school. One in three Illinois students reported theyknew someone who had dropped out of school due to gangs, and half of them indicated it waseasy to get marijuana in their school.
During the period considered here, Chicago’s schools put new disciplinary and safetyinitiatives in place. Between 1990 and 1995 the number of school security guards rose by86
1,275. High schools began to install walkthrough metal detectors and even hand-held scanningdevices. Beginning in 1990, the police contributed a special school patrol unit that by 2000 hadgrown to about 200 officers, and security cameras were installed in lunchrooms and hallways.The pace of change picked up following a shakeup in school financing and administration inmid-1995. Many new disciplinary and security programs were instituted; some involved theschool bureaucracy and others were partnerships with police and the city’s community policingimplementation office. Beginning in 1996, schools became more aggressive about expellingtroublemakers, after alternative schools run by private contractors were set up to receive them.The state’s 1995 Gun-Free Schools Act – which was later expanded to cover knives, alcohol anddrugs – provided an additional legal incentive to expel students found with weapons. A change inthe school system’s disciplinary code called for the mandatory expulsion of students carryingfirearms. School board policies allowed pat-downs and personal searches of students based uponsuspicion by teachers or administrators, as well as wholesale locker and desk searches usingdogs, looking for weapons and drugs. In 1998, Chicago launched a peer mediation program andconflict resolution initiative that trained youth to deal with their anger before it escalates intoviolence.

24
There is community involvement in school safety as well. Beginning in 1990, parentswere recruited to stand guard on school grounds; later, this program was greatly expanded. In1999 the city’s CAPS Implementation Office began organizing students and parents living alongvarious routes to a school into convoys which pick up and drops off members as they movethrough the neighborhood. By 2000 there were parent patrols around 450 schools, and about 100of these “walking school buses.”
Of course, efforts that are not on their face “security measures” can also have an impacton school climate and student performance. These, in turn, have consequences for school safety.In addition to the security projects described above, post-1995 there was a sea-change in schoolmanagement and performance assessment in Chicago. Drastic revisions were instituted in thecurriculum; selected schools began to remain open until 6:00 p.m. for optional math and readingprograms; many thousands of failing students were held in school during the summer months;and a massive construction program replaced or renovated a host of school buildings. In addition,dress codes drafted by parent groups were instituted in many schools beginning in 1996, as was arequirement for daily homework assignments for every class.
Figure 13 presentstrends in several measures ofthe extent of school crime.The left-hand panel chartschanges in robbery and allgun crimes within schools andon school grounds. The right-hand panel examines allproperty crimes, vandalism,and assaults. Chicago publicschool enrollment increased
by almost 7 percent between 1991 and 2005, so the Figure presents rates of crime that take thisenrollment growth into account. It is apparent that there was a substantial increase in the rate ofassaults reported in and around the city’s schools during the 2000s, but by every other measure ofcrime declined noticeably. Robbery was down 36 percent, while gun crime dropped by 82percent. Property crime declined by 36 percent and vandalism by 32 percent. However, even thepositive trends could not account for much of the citywide drop between 1991 and 2005, becauseschool crime makes up only a tiny fraction of the crime that takes place in the city each year. In1991, school-based gun crime was 1 percent of the city’s total, while in 2005 it was 0.7 percent.
The opposite is true in the assault category, on the other hand, for by 2005 assaults inschools rose from 2 percent to 11 percent of all of the assault in the city, a troublesome trendindeed. But even so, Chicago’s schools are still relatively safe places. Based on crimes reportedto police (a very important caveat) even after its rise, the school aggravated assault rate (per100,000 students) stood at 80 percent of the city wide figure (570 versus 718). When it comes togun crimes, schools are even safer; in 2005, the city gun-crime rate was 493 but the school-basedrate was only 17.

25
Interim Summary
The following is what we have seen thus far concerning the decline in crime in Chicago:
L The decline in crime was not due to demographic changes, nor to improving economicconditions for families or young people.
L Not much of the decline in crime could be attributed to prisons. Trends in incarceration cannotexplain the magnitude of crime decline during the 1990s; crime continued to drop after Illinois’prisons stopped growing after 2001; and after 1999 Chicago’s incarceration rate declined alongwith crime.
L The decline in crime was not due to the deterrent effects of going to jail. The Cook Countyjail also expanded during the 1990s – and for several years after prisons stopped growing – butnot enough in light of the probably limited deterrent impact of short spells behind bars.
L Not much of the decline in crime could be attributed to the sheer number of police officers.Police are expensive, and their numbers did not grow fast enough or long enough.
L Declining crime was not due to the decreased frequency with which Chicagoans carry guns;non-gun crime declined just as fast and far.
L The decline in crime was not linked to any reduction in the influence of the city’s large andviolent street gangs. Non-gang crime declined consistently, while gang crime traced an up anddown course in response to volatile intra-gang dynamics and a shifting business environment.
L The decline in crime was not due to a declining crack cocaine market. Cocaine-related arrestswent up rather than down, while emergency-room treatment for cocaine-related episodes were asfrequent in 2005 as they were in 1991. Except for powder cocaine, drug markets continued toflourish even as crime dropped. Homicide associated with the drug trade went up and down, butit was a very small proportion of all violence and it was non-drug violence that droppedconsistently.
L Crime did not drop city-wide because of the demolition of public housing. Crime rates in andaround CHA properties dropped faster than they did in the remainder of the city. Those ratesalways constituted a small percentage of all crime in the city, however, and could not account forits sweeping downturn.
L Improving security in the schools could not explain the city-wide decline in crime. School-based assault did not decline; rather, it skyrocketed in the 2000s. By 2005, aggravated assault inand around schools made up almost 11 percent of the city’s total. Other kinds of school crime –which are down – constitute just a small percentage of the city total, and could not account forthe dramatic decline in crime.

26
Other important claims are consistent with the findings of research and evaluationprojects around the county, but research and the available data are not strong enough to make anyconclusions about the extent of their impact in Chicago.
L While there is evidence that “smarter” policing impacts crime, there is no evidence that policein Chicago “got smarter” at a pace matching the decline in crime. Any effects of communitypolicing could not have been felt until the second half of the 1990s, and the police department’sinformation-driven crackdowns on drugs and guns did not begin until the 2000s.
L Strengthening community factors were linked to more rapid declines in beat-level crime, but ithas not been clearly demonstrated that, over all, enough communities in Chicago have grownstrong enough to account for generally declining crime.
Observations
This report does not systematically assess every significant claim about the decline incrime, because there were not always data for Chicago. What follows is a review of the mostimportant of these claims. The report also addresses the likelihood that the decline in crime wasdue to a combination of factors, or to changes in the impact of these factors over time.
Alcohol. One of the most intriguing alternative explanations for declining crime isalcohol consumption, which has been on a nationwide decline on a per capita basis at the sametime that violent crime has subsided. Research on alcohol use and its effects is very strong. Itfinds the availability and volume of alcohol consumed is related to levels and trends in crime atthe block, neighborhood, city, county, state and national level. When it becomes harder for youngpeople to acquire alcohol, youth violence (like traffic fatalities) subsides. Physical testing of87
both offenders and victims documents that alcohol is frequently associated with violence.However, the best local figures I could assemble (scattered reports of the volume of beer, wineand spirits distributed per capita for Cook County) do not point to a noticeable drop inconsumption over this period.
Culture Change. I also could not address in any fashion claims that violence declinedbecause of changes in culture. Some urban ethnographers report “the younger generation” (agroup growing more expansive with each passing year that crime declines) looked at the violenceof the late 1980s, then decided in large numbers to turn away from a culture of death. However,88
I have no way of assessing whether offending-related cultural values underlying crimes of manytypes actually changed in Chicago. The relatively short time frame considered in this report itselfargues against cultural shifts, because important values are unlikely to change so rapidly. Culturalcritics linked spiraling crime during the 1970s and 1980s to the hedonism, self-indulgence,heedless consumerism, reckless individualism, unbridled self-expression, and standardlessrelativism they claimed characterized our disintegrating liberal culture. However, I have noreason to believe that any such trends reversed their course dramatically following 1990. I alsodid not consider the impact on abortion on crime in Chicago. Analysis of that issue has been

27
based on state data, which are too coarse for me to apply to the local scene, and there iscontroversy over the statistical claims that have been made.89
Crime Reporting. Perhaps the crime drop of the 1990s and 2000 was due to a growingunwillingness of victims to call the police, or to growing reluctance on the part of police to makean official record of crime reports that came their way. The latter was a serious concern in the1980s, and it is one reason why this review did not extend further back in time. During the mid-1980s, Chicago police were “killing crime” by refusing to write up official reports of hugenumbers of offenses. The big run-up in crime at the end of the 1980s was certainly due insubstantial part to improvements in recording wrought by internal crime audits, which wereinstituted after the media became aware that detectives were cheating on their statistics. Thebreadth of this scandal makes it impossible to do meaningful statistical analyses of crime trendsin Chicago that include the 1980s. I have found that the city’s recent, Spanish-speaking90
immigrants are significantly under-reporting problems of all sorts to the police, as part of aneffort to remain out of sight. However, their numbers are not large enough to account for the91
decline in recorded crime, which anyway was heavily concentrated in predominately African-American neighborhoods. As Figure 2 illustrated, trends in heavily Latino areas generallyparalleled those elsewhere.92
Revitalization. I could not consider in detail the aggregate impact of housing andneighborhood revitalization programs underway in many city neighborhoods. While we usuallydo not think of them as “crime prevention’ programs, housing programs can have that impact.Development groups stress tenant screening and improved property management. They putpressure on owners of existing buildings to upgrade security. They sponsor tenant patrols andcoordinate those efforts with police. And they tackle the disorderly blight associated with vacantand abandoned buildings.
There is certainlyevidence of a quickening paceof neighborhood economicvitality during the 1990s and2000s. Figure 14 presentsthree measures of this forChicago: the per capitanumber of building permitsissued for residential andbusiness projects, and thenumber of conventionalresidential mortgagesregistered each year. All93
three indicators highlight thefact that the city is far frommoribund, and that newinvestments are being made inits future as a place to live.

28
Between 1993 and 2003, two dramatic changes occurred: the number of building permits issuedfor residential projects rose 125 percent, and the number of conventional mortgage loans issuedin the city rose by 189 percent. Housing and commercial investments are doubly importantbecause they are cumulative, adding up over time. What is unclear is whether this evident vitalityis a cause of declining crime, or if it is a consequence of the drop in crime. Perhaps one reasonfor this quickening economic activity during the 1990s and early 2000s was the new sense ofsafety and security evident in neighborhoods all over the city. During this period, crime wentdown in most neighborhoods, and – based on surveys – fear of crime declined in every majordemographic category. Some of the best research on the relationship between crime and real94
estate activity has been done in New York City. This research suggests the decline in crime inthat city sparked a real estate boom during the 1990s, and accounted for about one-third of risingreal estate prices after 1994. That declining crime can spark neighborhood revitalization is95
further evidence of the importance of the post-1990 decline in Chicago, but it does not help usunderstand why crime went down.
Community Programs. I also could not assess the role of community-based efforts toprevent crime and reintegrate offenders on trends over the 1991-2005 period. The city is home tohundreds of these projects, including such prominent programs as CeaseFire (violenceprevention), the Safer Foundation (job training and offender reentry), and TASC and Gateway(drug treatment). Evaluations have been conducted of many of them individually, but there is nostraightforward way of scaling up their preventive effects to the city as a whole over a 15-yearperiod. Project Safe Neighborhoods (PSN), a federal gun crime prevention program thatcombines enforcement with outreach to newly released felons and a civic education program hasclaimed strong results. Compared to comparison areas and the city as a whole, homicide droppedmore sharply in PSN areas. They were down the most in beats where large numbers of ex-offenders participated in programs, more guns were seized, and cases were prosecuted.96
However, the program began only in 2003.
Tipping Points. I also did not consider the view that reaching a “tipping point” broughtcrime back down. This is a “what goes up must come down” theory of crime that is no theory atall in the absence of explanatory variables that determine the turn-arounds. Otherwise, it is just adescription of what happened. More promising are concepts like “diffusion” and “contagion.” Iargued that crime is contagious in the context of gang violence. That is a world in which bands ofyoung men are ensnared in networks of power, status and business relationships which propelthem into episodes of tit-for-tat violence of the worst kind. Arms races followed by wars thatlater subside due to the exhaustion of the combatants could look like tipping points, except theytip upward again when everyone recovers. This happened twice during the brief periodconsidered in this report However, a key point was that gang-related contagion of violence wasunrelated to the general, unpunctuated decline in non-gang crime, which continued apace on amuch more massive scale throughout the period considered here. Outside of the insular world ofstreet gangs, the idea that marshaling the bravado to commit crimes can be affected by theperception that “everyone is doing it,” and that there may be some ‘safety in numbers” when a lotof people are doing it, points toward a “critical mass” theory of crime causation. However, there

29
has been no clear explication of the factors that dampen group-think and bring offending down,but that is what we have been observing in Chicago for 14 years.
Combinations. It is likely that the roots of the crime drop in Chicago and elsewhere lie ina mix of the factors described here. Some or all of the social and economic trends and localpolicies listed in this report may have been working in concert to reduce crime, each contributingsomething to the end result. As the length of the great post-1991 decline in crime extends – weare now talking about a half-generation – it is likely that combinations and reinforcing mixes offactors are at work, rather than One Big Thing. Much of the research on which this report isbased controls for multiple factors in order to isolate the effects of variables of particular interest.Unfortunately, the data that are available for one city, and for this statistically short span of time,do not lend themselves to teasing out overlapping components of change, dividing them amongvarious causes.
It is also quite possible that the effects of the components of an explanatory mix of factorsmay have waxed and waned in significance during this substantial period of time. Some factorsmay have contributed to the drop in crime early on, and others later. Analysts examining city-level trends and pronouncing that a program could not have caused the decline in crime becausecrime dropped before the intervention was underway are certainly too mono-causal in their view.Crime could have dropped early in this lengthening period for one set of reasons, and later foranother. A program may have contributed to the continuing decline in crime even if it came on-stream later. The effects of some factors may even subside over time.
A Plausible Scenario. In my view, the most plausible crime-drop scenario for Chicagoinvolves a mix of law enforcement and community factors. Earlier I argued that, overall, trendsin the rate at which Chicago sent people to prison did not track drops in crime, especially afterIllinois’ prisons stopped growing. However, the leap in incarceration rates during the early 1990scould have played a role in crime decline, if prison had larger-than-average effects during it’searly expansion phase. Recent research has indeed documented that there are diminishingdeterrent effects of prison as states push up their rates of incarceration. This is probably due to97
lower payoffs from digging deeper into a pool of less chronic, lower-rate offenders andindividuals caught up in simple drug-possession cases, in order to continue to push upincarceration rates in the face of a significant drop in serious violent and property crime.98
Averaging the over-all deterrent effect of prison over time, which is the way that most researchhas been conducted, appears disguise larger effects early on. As my “maxi forecast” in Figure 4suggested, larger effects of early-phase incarceration, plus the 50 percent growth in Chicago’sprisoner count between 1991 and 1999, could have played a significant role in declining crimeduring the early 1990s. In addition, the county’s jail population grew a bit more and for a fewyears longer than my prisoner estimates. Even though the effect of a spell in jail is doubtlessmuch weaker than that of a longer stay in prison, this may have also contributed to the mix.
The effects of community mobilization around community policing could have been feltby the latter half of the 1990s. Extrapolating from the correlations presented earlier, this mighthave accounted for 9-15 percent declines in crime. Community factors known to be linked to

30
crime appear (the evidence is painfully sparse) to have expanded somewhat in scope in Chicagobetween the mid-1990s and early 2000s. CAPS-related mobilization may have accounted for 4-12 percent of the decline in crime. A very important feature of both beat meeting turnout andparticipation in CAPS-related problem solving projects and neighborhood activism this is thatthese efforts were over-concentrated in the very areas of the city where crime declined the most,in higher-crime and predominately African-American police beats. Driven by crime, peopleturned out and cooperated with police there in relatively large numbers, over a long period oftime.
In my judgment, the police department became visibly “smarter” and well managed earlyin the 2000s. As I noted, beginning in about 2000 they police adopted a number of proven anti-violence strategies and a focused approach to crime reduction that is consistent with research oncrime control theory. Measures of the implementation of these initiatives over time and at thebeat and district level are correlated with substantial declines in the targeted crimes, post-2000.99
I noted above that the ratio of violent crime arrests to crimes of violence jumped sharply after2002, a pattern that is consistent with these initiatives. Along this 14-year timeline, the effects ofthese initiatives would have come into play just as Chicago’s prisoner count began to declineperhaps backfilling for declining incarceration rates and any diminishing marginal effects oflocking up lower-rate, less chronic offenders.
Further Research. Of the factors considered in this report, more research and sheerinformation gathering is most needed in the community domain. As I pointed out, many decadesof criminological research have established the importance of community factors in controllingcrime. Strong families, deep informal bonds among neighbors, and a willingness of residents tointervene to maintain order are linked to lower levels of crime. Even in the face of concentratedpoverty and residential turnover, there is some evidence that a strong infrastructure oforganizations can help sustain a community's capacity for self-healing as well. But little is knownabout whether these factors waxed or waned during the 1990s and 2000s, nor how they mighthave been affected by community policing programs that emerged across the country. I stressedthat there is an “absence of evidence” concerning their importance in explaining declining levelsof crime, due in large measure to the absence of systematic, over-time data on communityfactors. Community mobilization generally speaking is a strategic component of many private,non-profit, and volunteer efforts at neighborhood revitalization, so understanding the costs andbenefits of those interventions is of broad importance.
Cost. Importantly, this review has said nothing about what the various approaches tocrime control it has considered cost. Some of the factors claimed to have reduced crime are quiteexpensive. Adding police to the force costs Chicago taxpayers perhaps $100,000 per officer peryear, when all of the real expenses associated with doing so are factored in. The total cost ofoperating the police department is more than $1 billion each year. Prisons are also veryexpensive. In Illinois, it costs almost $56,000 per bed to build a new medium security prison, andthe direct cost of housing a prisoner for a year is about $22,600. Worse, the true annual cost of100
locking someone up that takes into account all of the expenses involved is much higher;nationally, the real cost is estimated to be about $48,000. One reason Illinois has new prisons101

31
sitting empty is that there is no money to operate them. If analysts’ estimates are right, the prisonpopulation would have to double to obtain another 15-20 percent decline in crime throughincarceration. This experiment would be a vastly expensive enterprise, and certainly would notbe worth the benefit. The rules of thumb regarding costs are clear: 1) many alternatives to102
incarceration are cheaper than jail; 2) intermediate sanctions are cheaper than prison; and 3)treatment is cheaper than locking someone up. Outside the domain of the criminal justice system,a long list of social interventions have proven to be practical, effective, and much cheaper percrime deterred than virtually anything the criminal justice system has to offer. A103
comprehensive policy review collecting new and better data probing the origins of the post-1990decline in crime would also have to factor in what we know about the cost of instituting newefforts to further speed the drop in crime.

32
1. For example, in 1991 (the starting year for this report) the nation’s ten largest cities (home to 9 percent of the
population) experienced almost 40 percent of all the robbery in the country, and between 1991 and 2004 the decline
in just those ten cities accounted for 58 percent of the total national drop in robbery. Source: FBI Uniform Crime
Report, various years. The “national” drop in crime has been highly dependent on trends in a relatively small number
of big cites.
2. Between 1990 and 2000 the over-all population of the city changed only slightly, rising by 0.6%. This discussion
and many of the charts and tables generally will report the number of crimes and arrests rather than rates, which will
help illuminate the magnitude of many of the over-time changes described here.
3. These data are drawn from reports issued by the Chicago Police Department. It and other Figures present trends in
UCR-compatible aggravated assaults. For internal purposes Chicago police use a different categorization of assaults,
distinguishing between aggravated battery and aggravated assault. Chicago’s accounting of criminal sexual assault
does not match the FBI’s definition of rape, and is flagged each year in the Uniform Crime Report for non-
compatibility. What I call “auto theft” here is strictly speaking motor vehicle theft (which includes trucks and
motorcycles), and the term “murder” and homicide” are used interchangeably.
4. But in 2004 homicide was still the leading cause of death among all Chicagoans age 15-34. Harper, D. M. and
Thomas, S. D. 2004. Leading Causes of Death in Chicago 2002. Chicago Department of Public Health
Epidemiology Program.
5. Analyses of gun crime, residential burglary, street crime, and other specialized categories of offenses extends from
1991 to 2005. These are incident data drawn from the Chicago Police Department’s CHRIS data base, and they are
not compatible with reports filed with the FBI for inclusion in the yearly Uniform Crime Report because they are not
based on UCR’s elaborate counting rules.
6. Franklin E. Zimring and Gordon Hawkins. 1999. Crime Is Not the Problem: Lethal Violence in America. Oxford
University Press.
7. After mid-2002 Chicago had 280 beats, and beat boundaries had been significantly redrawn all over the city in
1992. For statistical purposes this report reclassifies all crime incidents so that throughout the time series their
locations are consistent with 1993-2001 beat boundaries. Calculated from crime incident data 1991-2005 extracted
from the CPD’s CHRIS database, supplemented by homicides files from the detective division. The same data and
approach was used to document over-time changes in Chicago’s community areas.
8. The analysis of crime decline by race excludes nine essentially non-residential beats for which population-based
crime rates have little meaning. Based on the 1990 Census, there were 71 predominantly white beats, 121 heavily
African-American areas, 32 areas of concentrated Latino residence, and 46 racially diverse beats that were
impossible to classify in simple fashion.
9. The percentage of the US population age 18 bottomed out in 1995; high-risk 18-24 year olds as a group bottomed
out in 1997.
10. Fox, James Alan and Alex R. Piquero. 2003. “Deadly Demographics: Population Characteristics and Forecasting
Homicide Trends.” Crime & Delinquency, 49 (No. 3, July), 339-359.
11. Calculated from U. S. Bureau of the Census STF1, Table P12 (2000); STF 1, Table QT-P1A (1990).
Notes

33
12. Between 1992 and 2004, the percentage nationwide of violent crime arrestees who were women increased from
13 percent to 18 percent. Calculated from yearly editions of the Uniform Crime Report, arrest tables. Over the same
period, the percentage of women who were arrested for property crimes in Chicago rose much less, from 20 to 23
percent.
13. Eric D. Gould, Bruce A. Weinberg, and David B. Mustard. 2002. “Crime Rates and Local Labor Market
Opportunities in the United States: 1979–1997. The Review of Economics and Statistics, 84 (February, No. 1),
45–61. Note, however, that the national crime drop began before the labor market tightened (the nation was just
coming out of a stiff recession during the 1991-1992 period) and improving economic conditions at the bottom of the
labor market may not have played a role in crime reduction during the early 1990s.
14. Imrohoroglu, Ayse, Antonio Merlo and Peter Rupert. 2004. “What Accounts for the Decline in Crime.”
International Economic Review, 45 (No. 3, August), 707-729.
15.U. S. Census Bureau STF 3, Table P117 (1990); STF 3, Table P87 (2000).
16. U. S. Census Bureau, STF 3, Table P122 (1990); STF 3, Table P90 (2000).
17. U. S. Census Bureau, STF 3, Table P123 (1990); STF 3, Table P90 (2000).
18. U. S. Census Bureau, STF 3, Table P057 (1990); STF 3, Table P37 (2000). Educational attainment is reported
for persons age 25 and older.
19. U. S. Census Bureau, STF 3, Table H7 (2000); STF 1, Table H003 (1990).
20. U. S. Census Bureau, STF 3, Table P057 (1990); STF 3, Table P37 (2000)
21. Based on Levitt’s consensus figure, an elasticity of crime on the unemployment rate of 1.0, economic changes in
Chicago would predict a 1.2 percent decline in property crime, but little or no decline in violent crime. Levitt, Steven
D. 2004. “Understanding Why Crime Fell in the 1990s: Four Factors that Explain the Decline and Six that Do Not.”
Journal of Economic Perspectives, 18 (No. 1, Winter), 163-190.
22. Income data from the 1990 and 2000 censuses. Median incomes and dollar income categories for 1989 were
adjusted to 1999 values using the urban consumers price index for the Chicago area available at
"http://www.bls.gov/cpi/home.htm". On a base of 1982-84=100, this index stood at 125 in 1989 and 168.4 for 1999.
23. For example, Grogger reports a very large offending elasticity among young men in low-skill labor markets. He
finds that a 10 percent increase in real wages among this group leads to a 10 percent decrease in economically
motivated crime. Grogger, Jeff. 1998. “Market Wages and Youth Crime.” Journal of Labor Economics, 16 (No. 4),
756-791.
24. U. S. Census Bureau STF 3, Table 38, with the sample findings applied to the total population ages 16-19 count
in Table 3 (2000); STF 3, Table P061 (1990).
25. U. S. Census Bureau STF3, Tables P117 (1990); STF 4, Table P142 and the race (2000).
26. Levitt’s review yields a elasticity of 1.0 for unemployment, which is quite large, but he notes too that national
level changes in this factor are relatively small and cannot account for declining property crime. Levitt, Steven D.
2004. “Understanding Why Crime Fell in the 1990s: Four Factors that Explain the Decline and Six that Do Not.”
Journal of Economic Perspectives, 18 (No. 1, Winter), 163-190.

34
27. Levitt’s estimate is one third; Spelman uses different methods, and comes up with 27 percent. Levitt, Steven D.
2004. “Understanding Why Crime Fell in the 1990s: Four Factors that Explain the Decline and Six that Do Not.”
Journal of Economic Perspectives, 18 (No. 1, Winter), 163-190; Spelman, William. 2000. “The Limited Importance
of Prison Expansion.” In Alfred Blumstein and Joel Wallman (Eds.), The Crime Drop in America. New York:
Cambridge University Press, 97-129.
28. Data on Illinois’ prison population on June 30 of each year can be found in yearly statistical reports from theth
Illinois Department of Corrections (IDOC). Reports since 1999 are available on IDOC’s web site; for data for the
period 1991 to 1998 I am grateful to the Planning and Research Department of IDOC. The analyses here focus on
the state’s adult prisoners; a relatively small number of juveniles (in 2000, 1/22 the number of adults) are held in
Illinois’ prisons.
29. City Part I crime counts versus those for the remainder of Cook county can be found on the Illinois State Police
website.
30. This estimate of the elasticity of property crime with respect to prison is suggested by Levitt, Steven D. 2004.
“Understanding Why Crime Fell in the 1990s: Four Factors that Explain the Decline and Six that Do Not.” Journal
of Economic Perspectives, 18 (No. 1, Winter), 163-190. Many studies report property crimes to be somewhat more
elastic than violent crimes in response to changes in incarceration rates, and to shifts in levels of policing. The
“rational” elasticity of violence is probably undercut by offenses such as “crimes of passion,” “going postal,”
violence fueled by alcohol, and a significant fraction of domestic crimes. Spelman’s estimates of the elasticity of
crimes of various types range from .16 to .31: Spelman, William. 2000. “What Recent Studies Do (and Don’t) Tell
Us About Imprisonment and Crime,” in Michael Tonry (ed.), Crime and Justice: An Annual Review, 27, 419-494.
31. The estimate that the elasticity of violent crime with respect to prison is 20 percent is offered by Levitt, Steven D.
2004. “Understanding Why Crime Fell in the 1990s: Four Factors that Explain the Decline and Six that Do Not.”
Journal of Economic Perspectives, 18 (No. 1, Winter), 163-190; the 15 percent figure is a “consensus” estimate in a
summary of research by Donohue, John J. and Peter Siegelman. 1998. “Allocating Resources Among Prisons and
Social Programs in the Battle Against Crime.” Journal of Legal Studies, 27 (January), 1-43. A 2006 overview
illustrates how widely these estimates vary, however; see Weatherburn, Don, Jiuzaho Hua and Steve Moffatt. 2006.
“How Much Crime Does Prison Stop? The Incapacitation Effect of Prison on Burglary.” New South Wales Bureau
of Crime Statistics and Research. Crime and Justice Bulletin, 93 (January).
32. Calculations for this and other estimates presented here use 1991 crime totals as the start values, then discount
the estimated crime rate in each subsequent year based on the previous year’s percentage change in the estimated
number of prisoners from Chicago and the elasticity estimates discussed in text. After 1991, the estimated value for
violent crime in each year provides the base for the forecast for the next year.
33. A report for 2005 found that about 35 percent of Cook County Jail inmates remained there less than 31 days,
another 23 percent less than 90 days, and an additional 15 percent less than 180 days. This accumulates to 73 percent
of inmates serving less than six months, with most serving appreciably less than that. John Howard Association.
2005. Executive Summary: Court Monitoring Report for Duran v. Sheahan et al. Submitted to the U. S. District
Court for the Northern District of Illinois.
34. John Howard Association. Executive Summary: Court Monitoring Report for Duran v. Sheahan et al. Submitted
to the U. S. District Court for the Northern District of Illinois, Table 1.1.
35. This generous estimate involved (a) assigning all of the county’s jail population to the City of Chicago, plus (b)
assuming that the effect of a spell in jail is one half that of a prison stay on personal crime (for an elasticity of 8.8
percent) and property crime (an elasticity of 10 percent). Like the other forecasts, this takes the crime count for 1991
and discounts it for future years by the percentage change in the jail population multiplied by the elasticity estimate.

35
36. See Clear, Todd R., Dina R. Rose and Judith A. Ryder. 2001. “Incarceration and the Community: The Problem
of Removing and Returning Offenders.” Crime and Delinquency, 47, 335-351; Rose, Dina R. and Todd R. Clear.
1998. ‘Incarceration, Social Capital and Crime: Implications for Social Disorganization Theory.” Criminology, 36,
441-479. John Hagan and Ronit Dinovitzer. 1999. “Collateral Consequences of Imprisonment for Children,
Communities, and Prisoners.” In Michael Tonry (ed.), Crime and Justice: A Review of Research, vol. 26. Chicago:
University of Chicago Press.
37. Clear, Todd, Elin Waring and Kristen Scully. 2005. “Communities and Reentry.” In Jeremy Travis and Christy
Visher (eds.), Prisoner Reentry and Crime in America. New York: Cambridge University Press, 179-208.
38. Illinois Department of Corrections. 2005. Statistical Report.
39. Visher, Christy and Jill Farrell. 2005. Chicago Communities and Prisoner Reentry. Washington, DC: Urban
Institute.
40. Kubrin, Charis E. and Eric A. Steward. 2006. “Predicting Who Re-offends: The Neglected Role of
Neighborhood Context in Recidivism Studies.” Criminology, 44 (No. 1, November), 165-197. The impacted
neighborhoods include Austin, Humboldt Park, North Lawndale, Englewood, West Englewood and Garfield Park.
41. There is nothing new about this: a 1985 study found that half of former inmates were arrested within 18 months
of being released, and one-third were back in prison within 20 months. The longer their prior criminal history the
more likely releasees were to commit crimes again, and the more quickly. For recidivism statistics see: Illinois
Criminal Justice Information Authority,1985. The Compiler, 6 (no. 3, Fall); Nancy Lavigne. A Portrait of Prisoner
Reentry in Illinois. April 2003. Urban Institute publications 410662.html.
42. For example, Klick, Jonathan and Alexander Tabarrok. 2005. “Using Terror Alerts to Estimate the Effect of
Police on Crime.” Journal of Law and Economics, vol. XLVIII, April. They set the elasticity of burglary with respect
to levels of policing at -.30; for auto theft their figure is a high -.86, but they found for Washington DC the effect of
changes in levels of policing on violent crime was zero. Levitt’s revised estimates after correcting errors in earlier
publications are -.435 for violent crime and -.501 for all property crime: see Levitt, Steven D. 2002. “Using Electoral
Cycles in Police Hiring to Estimate the Effects of Police on Crime: Reply.” American Economic Review, 92, 1244-
1250. He concluded that between 1991 and 2001 the increasing number of police reduced crime of 5-6 percent
across the board; see Levitt, Steven D. 2004. “Understanding Why Crime Fell in the 1990s: Four Factors that
Explain the Decline and Six that Do Not.” Journal of Economic Perspectives, 18 (No. 1, Winter), 163-190. The
predicted decline in crime due to changes in levels of policing here is -4.4 percent for violent crime and -5.1 for
property crime.
43. These calculations use 1991 city crime rates as the start value, then compute the estimated crime in each
subsequent year based on the previous year’s percentage change in the number of Chicago police officers plus the
elasticity estimates discussed in the text.
44. Kelling, George L., and Coles, Catherine M. 1996. Fixing broken windows. N.Y.: Touchstone; Kelling,
George L. and William H. Sousa, Jr. 2001. Do Police Matter? An Analysis of the Impact of New York City’s Police
Reforms. New York: The Manhattan Institute.
45. Sampson, R. and Cohen, J. 1988. "Deterrent Effects of the Police on Crime: A Replication and Theoretical
Extension." Law & Society Review, 22 (1).
46. For a review of innovations in policing during the 1990s and 2000s, see Skogan, Wesley G. and Kathleen Frydl
(eds.) 2004. Fairness and Effectiveness in Policing. Washington, DC: National Academies Press.

36
47. For 2003 see: Chicago Tribune, May 1, 2004, “Police Expanding No-Loitering Zones to Curb Gangs”; for 2004
see: Annual Report of the Chicago Police Department, 2004, exhibit 14.
48. Rosenbaum, Dennis and Cody Stephens. 2005. Reducing Public Violence and Homicide in Chicago: Strategies
and Tactics of the Chicago Police Department. Chicago: Illinois Criminal Justice Information Authority. For earlier
initiatives see Skogan, Wesley G. and Steiner, Lynn. 2004. Community Policing in Chicago, Year Ten. Chicago:
Illinois Criminal Justice Information Authority. A description of “CompStat Chicago style can be found in chapter 3
of Skogan, Wesley G. 2006. Police and Community in Chicago: A Tale of Three Cities. New York: Oxford
University Press.
49. Instead, they focus on New York, and usually without actually doing any research on crime trends there they
pontificate about whether or not the welter of activities taking place in that huge city had an impact on crime.
Somehow, that is seen as disposing of the question of police effectiveness.
50. Skogan, Wesley G. and Kathleen Frydl (eds.). 2004. Fairness and Effectiveness in Policing: The Evidence.
Washington, DC: National Academies Press.
51. This story has been in many places; see Blumstein, Alfred. 2000. Disaggregating the Violence Trends. In Alfred
Blumstein and Joel Wallman (eds.), The Crime Drop in America. Cambridge: Cambridge University Press, pp. 13-
44; Fagan, Jeffrey and Deanna L. Wilkinson. 1998. “Guns, Youth Violence, and Social Identity in Inner Cities.”
Crime and Justice: An Annual Review. For a statistical descriptions of the story see Cork, Daniel. 1999. “Examining
Space-Time Interaction in City-Level Homicide Data: Crack Markets and the Diffusion of Guns Among Youth.”
Journal of Quantitative Criminology, 15 (4), 379-406; Grogger, J. and Michael Willis. “The Emergence of Crack
Cocaine and the Rise in Urban Crime Rates.” Review of Economics and Statistics, November 2000. The part of the
story explaining the diffusion of guns and increases in gun homicide in Chicago has empirical support, but the best
study does not speak to events subsequent to the supposed decline in crack markets; see Elisabeth Griffiths and Jorge
M. Chavez. 2004. “Communities, Street Guns and Homicide Trajectories in Chicago, 1980-1995: Merging Methods
for Examining Homicide Trends Across Space and Time. Criminology, 42 (No. 4), 941-978.
52. Appendix Table 1-1 of 2000 Arrestee Drug Abuse Monitoring: Annual Report. National Institute of Justice,
2003.
53. Sherman, Lawrence W. 1990. “Police Crackdowns: Initial and Residual Deterrence.” In Michael H. Tonry and
Norval Morris (eds.), Crime and Justice: A Review of Research. Chicago: University of Chicago Press. Vol. 12, 1-
48.
54. See studies cited in Weatherburn, Don, Jiuzaho Hua and Steve Moffatt. 2006. “How Much Crime Does Prison
Stop? The Incapacitation Effect of Prison on Burglary.” New South Wales Bureau of Crime Statistics and Research.
Crime and Justice Bulletin, 93 (January).
55. In Chicago, other measures of the extent of drug markets (including calls to 911 by the public and the findings of
survey interviews) point to neighborhoods where drug arrests are also concentrated. Skogan, Wesley G. 2003. Crime
Drop in Chicago. Paper presented at the annual meeting of the European Society of Criminology, Helsinki (available
on request from the author).
56. These data were extracted from the Chicago Police Department’s CHRIS database, using offense codes
associated with drug incidents of various types.
57. Emergency room data can be found on the Drug Abuse Warning Network (DAWN) web site, which is
maintained by the Substance Abuse and Mental Health Services Administration (SAMHSA), Office of the Surgeon
General. Thanks to Elizabeth H. Crane of SAMHSA’s DAWN unit for data filling in missing years in the time series.
2004 marked the last year of “Old DAWN,” and more recent data are fundamentally incompatible with years prior to

37
2005.
58. Drug Abuse Warning Network. October 2002. The DAWN Report: Major Drugs of Abuse in ED Visits, 2001
Update
59. DAWN also monitored drug-related deaths between 1994 and 2002. Deaths linked to cocaine were relatively
infrequent in 1994, and they declined scarcely at all 1994-1996. Between 1994 and 2002 the number of cocaine
related deaths rose by 30 percent. Between 1994 and 2000, heroin-linked deaths rose by 32 percent, before dropping
again 2001-2002.
60. Data from annual reports of the Chicago Police Department. Between 1993 and 1998 these reports combine
Hispanic and non-Hispanic white arrestees, with a separate column indicating the number of Hispanic arrestees. An
estimate of the number of non-Hispanic whites was made by subtracting out the Hispanic total. During the late 1990s
the reports differentiated between “black Hispanic” and “white Hispanic” arrestees, and there were very few of the
former; justifying subtracting all Hispanics out of the white column for that six-year period. Prior to 1993 there was
no separate designation for Hispanics, so for 1991 and 1992 I used the 1993 Hispanic-to-Non-Hispanic white ratio to
produce estimates of the number of Hispanic arrestees from arrest totals for whites. Data on the age of arrestees was
drawn from the same reports; the age-21 and age-25 cutting points referred to in this report were imposed by their
age categories. For a discussion of drug arrest trends by race see: Jane Addams Hull House Association. 2003.
Minding the Gap: An Assessment of Racial Disparity in Metropolitan Chicago.
61. Skogan, Wesley G. 1995. "Crime and the American States," in Virginia Gray, Herbert Jacob and Robert
Albritton (eds.) Politics in the American States. Boston: Scott, Foresman/Little, Brown, 2nd Ed; Arthur J. Lurigio.
2004. Disproportionate Incarceration of African Americans for Drug Offenses in the U.S. Illinois Criminal Justice
Information Authority. Research Bulletin, Vol. 2 (No. 10, January); Loury, Alden K. 2002. Black Offenders Face
Stiffest Drug Sentences. Chicago Reporter (January).
62.Cook, Philip J. and Jens Ludwig. 2000. “Gun Violence: The Real Costs.” New York: Oxford University Press.
63. Cook, Philip J. and Jens Ludwig. 2000. “Gun Violence: The Real Costs.” New York: Oxford University Press.
64. Wintemute, Garen. 2000. “Guns and Gun Violence.” In Alfred Blumstein and Joel Wallman (eds.), The Crime
Drop in America. Cambridge: Cambridge University Press, pp. 45-96 (quote is page 54).
65. For homicide details see the Chicago Police Department’s annual Murder Analysis. Over this period the
percentage of murders involving a gun rose, at the same time that the proportion of both murder offenders and
murder victims who had a criminal arrest record grew steadily. It also became more difficult to solve these murders,
due to their more purposive and (drug) business-related nature. Over the 1991-2004 period, homicide clearances
dropped from 72 percent to 52 percent (and were claimed to be as high as 96 percent in 1964, and 90 percent in
1970). The percentage of victims and offenders with previous criminal records, and the percentage of homicides
involving a firearm, rose by about ten percentage points. Between 1990 and 2001, the average homicide offender had
been arrested 8 times, and the average homicide victim 8.3 times (Carolyn Rebecca Block, cited in the Chicago
Tribune, November 27, 2002). Over time more victims have been found dead in public places and fewer in private
locations such as residences. All of this forms a pattern consistent a national trend of large declines in non-gang, non-
drug homicides, compared to gang and drug-business killings.
66. Coughlin, Brenda C. and Sudhir Alladi Venkatesh. 2003. “The Urban Street Gang After 1970.” Annual Review
of Sociology, 29, 41-64; Hagedorn, John. 1998. “Post-Industrial Gang Violence,” In Crime and Justice: Volume 24.
Youth Violence, edited by Michael Tonry and Mark H. Moore. Chicago: University of Chicago Press..
67. Olson, David E., Brendan Dooley and Candice M. Kane. 2004. “The relationship between gang membership and
inmate recidivism.” Research Bulletin, Illinois Criminal Justice Information Authority. Vol. 2, No. 12 May.

38
68. Decker, Scott H, Tim Bynum and Deborah Weisel. 1998. “A Tale of Two Cities: Gangs as Organized Crime
Groups.” Justice Quarterly, 15 (No. 3, September), 395-425; Venkatesh, Sudhir Alladi and Steven D. Levitt. 2000.
“‘Are We a Family or a Business?’ History and Disjuncture in the Urban American Street Gang. Theory and Society,
29 (No. 4, August), 427-462.
69. Chicago Tribune December 11, 2003.
70. Block, Carolyn R. and Richard Block. 1993. Street Gang Crime in Chicago. Washington, D. C.: National
Institute of Justice, U. S. Department of Justice; Block, Carolyn R., Antigone Christakos, Ayad Jacob and Roger
Przybylski. Research Bulletin: 1996 Street Gangs and Crime: Patterns and Trends in Chicago. Chicago: Illinois
Criminal Justice Information Authority.
71. These homicide data were supplied by the Research and Development Unit of the Chicago Police Department.
Data on gang roles in other crimes could be found in the department’s CHRIS database until 1999, when detectives
stopped loading them into the system. Gang data were missing for six months in 1993, so that year is not included in
this discussion.
72. The role of social networks in facilitating gang violence is spelled out in Papachristos, Andrew V. 2005. Murder
Markets: Network Contagion and the Social Order of Gang Homicide. Unpublished paper, Department of Sociology,
University of Chicago. He describes patterns of within-gang and between-gang activity.
73. Morenoff, Jeffrey, Robert J. Sampson, and Stephen Raudenbush. “Neighborhood Inequality, Collective Efficacy,
and the Spatial Dynamics of Urban Violence.” Criminology 2001, 40: 213-230; Sampson, Robert J. 2004.
“Neighbourhood and Community.” New Economy, 106-113.
74. Sampson, Robert J., Raudenbush, Stephen W. and Earls, Felton. 1997. “Neighborhoods and Violent Crime: A
Multilevel Study of Collective Efficacy.” Science, 277: 918-924; Morenoff, Jeffrey, Robert J. Sampson, and
Stephen Raudenbush. “Neighborhood Inequality, Collective Efficacy, and the Spatial Dynamics of Urban Violence.”
Criminology 2001, 40: 213-230. In their 1995 Chicago survey, the top quartile in terms of collective efficacy is 53
percent white, while the bottom quartile 56 percent African-American.
75. The size of Chicago’s non-Hispanic white population declined by 13 percent between 1990 and 2000.
76. Putnam, Robert D. 1993. “The Prosperous Community: Social Capital and Community Life.” The American
Prospect 35-42. Critics include Ladd, Everett C. 1996. "The Data Just Don't Show the Erosion of American's Social
Capital." The Public Perspective 1: 5-6; and Paxton, Pamela. 1999. “Is Social Capital Declining in the United
States? A Multiple Indicator Assessment.” American Journal of Sociology, 105 (No.1, July), 88-127. For a critical
and sensible review of this controversy see Durlauf, Steven N. 2002. “Bowling Alone: A Review Essay.” Journal of
Economic Behavior and Organization, 47 (No. 3, March), 259-273.
77. Skogan, Wesley G. 2006. Police and Community in Chicago: A Tale of Three Cities. New York: Oxford
University Press. Chapters 4-6 examine beat meetings and problem solving in detail.
78. Skogan, Wesley G. 2006. Police and Community in Chicago: A Tale of Three Cities. New York: Oxford
University Press.
79. Skogan, Wesley G. 2006. Police and Community in Chicago: A Tale of Three Cities. New York: Oxford
University Press. Chapters 9 details trends in confidence in the police.
80. This is a comparison of the 1995 PHDCN survey (questions 12E and 25, weighted for citywide estimation) and
the 2003 CAPS evaluation survey (also weighted, to adjust for household side and telephone access). See note #73.
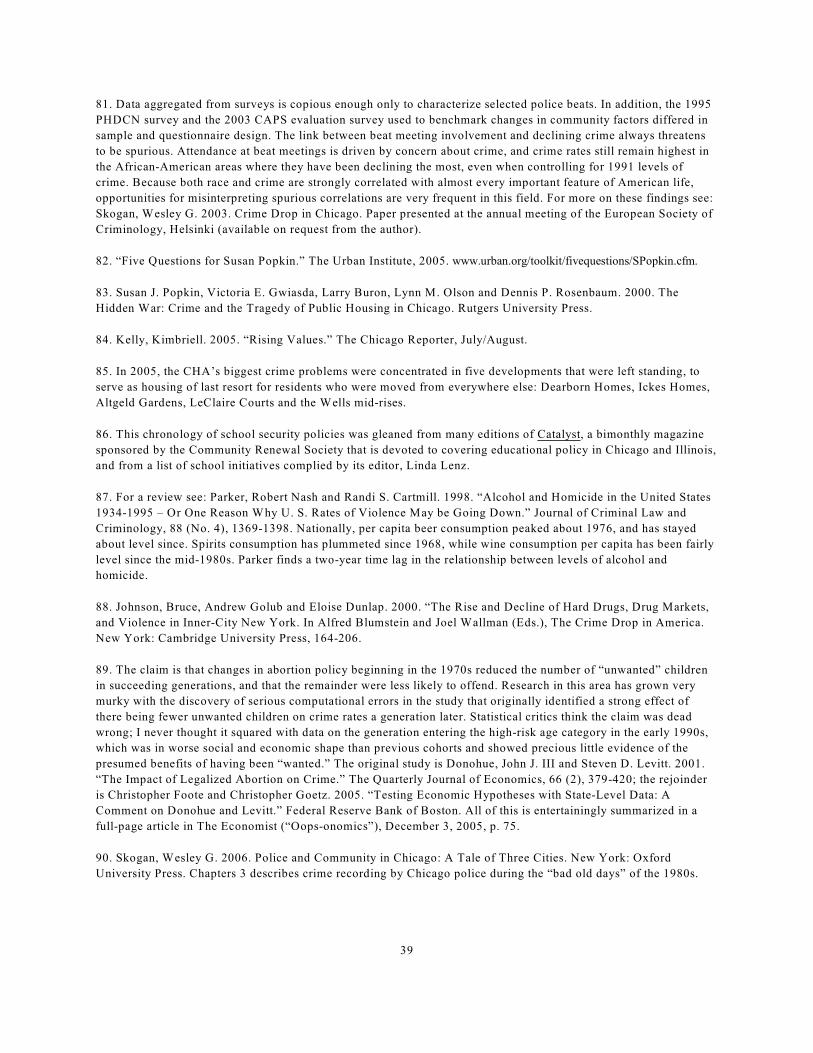
39
81. Data aggregated from surveys is copious enough only to characterize selected police beats. In addition, the 1995
PHDCN survey and the 2003 CAPS evaluation survey used to benchmark changes in community factors differed in
sample and questionnaire design. The link between beat meeting involvement and declining crime always threatens
to be spurious. Attendance at beat meetings is driven by concern about crime, and crime rates still remain highest in
the African-American areas where they have been declining the most, even when controlling for 1991 levels of
crime. Because both race and crime are strongly correlated with almost every important feature of American life,
opportunities for misinterpreting spurious correlations are very frequent in this field. For more on these findings see:
Skogan, Wesley G. 2003. Crime Drop in Chicago. Paper presented at the annual meeting of the European Society of
Criminology, Helsinki (available on request from the author).
82. “Five Questions for Susan Popkin.” The Urban Institute, 2005. www.urban.org/toolkit/fivequestions/SPopkin.cfm.
83. Susan J. Popkin, Victoria E. Gwiasda, Larry Buron, Lynn M. Olson and Dennis P. Rosenbaum. 2000. The
Hidden War: Crime and the Tragedy of Public Housing in Chicago. Rutgers University Press.
84. Kelly, Kimbriell. 2005. “Rising Values.” The Chicago Reporter, July/August.
85. In 2005, the CHA’s biggest crime problems were concentrated in five developments that were left standing, to
serve as housing of last resort for residents who were moved from everywhere else: Dearborn Homes, Ickes Homes,
Altgeld Gardens, LeClaire Courts and the Wells mid-rises.
86. This chronology of school security policies was gleaned from many editions of Catalyst, a bimonthly magazine
sponsored by the Community Renewal Society that is devoted to covering educational policy in Chicago and Illinois,
and from a list of school initiatives complied by its editor, Linda Lenz.
87. For a review see: Parker, Robert Nash and Randi S. Cartmill. 1998. “Alcohol and Homicide in the United States
1934-1995 – Or One Reason Why U. S. Rates of Violence May be Going Down.” Journal of Criminal Law and
Criminology, 88 (No. 4), 1369-1398. Nationally, per capita beer consumption peaked about 1976, and has stayed
about level since. Spirits consumption has plummeted since 1968, while wine consumption per capita has been fairly
level since the mid-1980s. Parker finds a two-year time lag in the relationship between levels of alcohol and
homicide.
88. Johnson, Bruce, Andrew Golub and Eloise Dunlap. 2000. “The Rise and Decline of Hard Drugs, Drug Markets,
and Violence in Inner-City New York. In Alfred Blumstein and Joel Wallman (Eds.), The Crime Drop in America.
New York: Cambridge University Press, 164-206.
89. The claim is that changes in abortion policy beginning in the 1970s reduced the number of “unwanted” children
in succeeding generations, and that the remainder were less likely to offend. Research in this area has grown very
murky with the discovery of serious computational errors in the study that originally identified a strong effect of
there being fewer unwanted children on crime rates a generation later. Statistical critics think the claim was dead
wrong; I never thought it squared with data on the generation entering the high-risk age category in the early 1990s,
which was in worse social and economic shape than previous cohorts and showed precious little evidence of the
presumed benefits of having been “wanted.” The original study is Donohue, John J. III and Steven D. Levitt. 2001.
“The Impact of Legalized Abortion on Crime.” The Quarterly Journal of Economics, 66 (2), 379-420; the rejoinder
is Christopher Foote and Christopher Goetz. 2005. “Testing Economic Hypotheses with State-Level Data: A
Comment on Donohue and Levitt.” Federal Reserve Bank of Boston. All of this is entertainingly summarized in a
full-page article in The Economist (“Oops-onomics”), December 3, 2005, p. 75.
90. Skogan, Wesley G. 2006. Police and Community in Chicago: A Tale of Three Cities. New York: Oxford
University Press. Chapters 3 describes crime recording by Chicago police during the “bad old days” of the 1980s.

40
91.Skogan, Wesley G. 2006. Police and Community in Chicago: A Tale of Three Cities. New York: Oxford
University Press.
92. Skogan, Wesley G. 2006. Police and Community in Chicago: A Tale of Three Cities. New York: Oxford
University Press. Chapters 7-9 examine relations between the city’s new immigrant population and the police.
93. The building permit data were secured from the City of Chicago by the Metro Chicago Information Center.
Federal Home Mortgage Disclosure Act (HMDA) data were also assembled by MCIC. Thanks to D. Garth Taylor
and Melissa Kraus Schwarz for their assistance. The data series do not all start and stop in exactly the same years.
94. Skogan, Wesley G. 2006. Police and Community in Chicago: A Tale of Three Cities. New York: Oxford
University Press. Chapter 8 describes trends in crime and fear of crime.
95. Schwartz, Amy, Scott Susin and Ioan Voicu. 2003. Has Falling Crime Driven New York City’s Real Estate
Broom? Journal of Housing Research, 14 (No. 1), 101-135.
96. Papachristos, Andrew V., Tracey L. Meares and Jeffrey Fagan. 2005. “Attention Felons: Evaluating Project Safe
neighborhoods in Chicago.” Paper presented at the Annual Meeting of the American Society of Criminology,
Toronto.
97. Liedka, Raymond V., Anne Morrison Piehl and Bert Useem. 2006. “The Crime-Control Effects of Incarceration:
Does Scale Matter?” Criminology & Public Policy, 5 (No. 2, May), 245-276. See also James P. Lynch and William
J. Sabol. 1997. Did Getting Tough on Crime Pay? Crime Policy Report No. 1. Washington, DC: The Urban Institute.
98. Donohue, John J. 2005. “Fighting Crime: An Economist’s View.” Milkin Institute Review, First Quarter, 47-58.
99. Rosenbaum, Dennis and Cody Stephens. 2005. Reducing Public Violence and Homicide in Chicago: Strategies
and Tactics of the Chicago Police Department. Chicago: Illinois Criminal Justice Information Authority.
100. This are the figures for 2003, the most recent year available. Illinois Department of Corrections. Financial
Impact Statement for 2003.
101. Here I adopted Donohue and Siegelman’s well considered annual cost figure and adjusted it to 2005 dollars
using the BLS urban consumers price index for the Chicago area. Donohue, John J. and Peter Siegelman. 1998.
“Allocating Resources Among Prisons and Social Programs in the Battle Against Crime.” Journal of Legal Studies,
27 (January), 1-43.
102. Donohue, John J. 2005. “Fighting Crime: An Economist’s View.” Milkin Institute Review, First Quarter, 47-58.
For a discussion by Donohue of the data behind this view see “Understanding the Time Path of Crime.” Journal of
Criminal Law & Criminology, 88 (No. 4), 1423-1452.
103. For a review of an impressive collection of cost-effective programs that work, see: Mihalic, Sharon, Abigail
Fagan, Katherine Irwin, Diane Ballard, and Delbert Elliott. 2004. Blueprints for Violence Prevention. Washington,
DC: Office of Juvenile Justice and Delinquency Prevention (NCJ 204274).


![eflections - Harmonia · PDF fileEncompassing the fluidity of Jeux d’eau without the rhythmic ... of the “Oiseaux tristes ... [“Aubade of the Jester”];](https://img.pdfslide.us/doc/110x75/5a717abf7f8b9a9d538cea48/eflections-harmonia-mundiwwwharmoniamundicommusiquedabordpdfpdf1957166epdfpdf.jpg)