Embed Size (px)
Citation preview

209|0|93
253|217|226
191|191|191
217|217|217
1
209|0|93
253|217|226
191|191|191
217|217|217

209|0|93
253|217|226
191|191|191
217|217|217
2
209|0|93
253|217|226
191|191|191
217|217|217
Disclaimer
The information in this presentation has been prepared under the scope of
the International Financial Reporting Standards (‘IFRS’) of Group BCP for the
purposes of the preparation of the consolidated financial statements under
Regulation (CE) 1606/2002, taking into consideration their successive
amendments.
The figures presented do not constitute any form of commitment by BCP in
regard to future earnings.
First 6 months figures for 2018 and 2017 were not audited.
The information in this document is provided solely for information purposes.
It must be understood as being in accordance with the remaining information
publicly disclosed by Group BCP.
209|0|93
253|217|226
191|191|191
217|217|217
3
209|0|93
253|217|226
191|191|191
217|217|217
Agenda
Earnings for the 1st half of 2018
Mobilizing Millennium:
Main guidelines of 2021 strategic plan

209|0|93
253|217|226
191|191|191
217|217|217
4
209|0|93
253|217|226
191|191|191
217|217|217
Agenda
Highlights
Group
• Profitability
• Business activity
• Capital
Portugal
International operations
Key figures
209|0|93
253|217|226
191|191|191
217|217|217
5
209|0|93
253|217|226
191|191|191
217|217|217
Highlights
• Net profit of €150.6 million (€89.9 million in the 1st half of 2017),
on the back of strong earnings growth on the Portuguese activity
and increased international business activity
NPEs significantly down: -€2.1 billion from June 30, 2017 (-€1.9
billion in Portugal), -€993 million in the 1st half of 2018 (-€841
million in Portugal). Coverage by loan-loss reserves of 50%, 106%
including collaterals
• Business volumes €2.9 billion up from June 30, 2017, with total
Customers funds significantly up (+€4.1 billion)
• +103,000 active Customers in Portugal from June 30, 2017
1
2
3
4
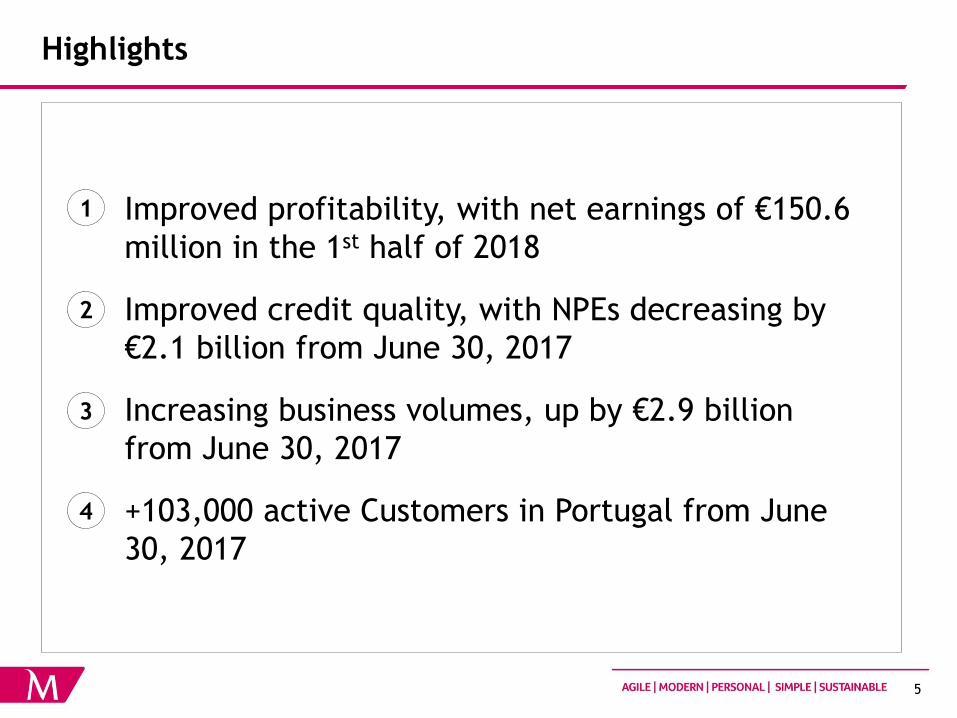
• Improved profitability, with net earnings of €150.6
million in the 1st half of 2018
Improved credit quality, with NPEs decreasing by
€2.1 billion from June 30, 2017
• Increasing business volumes, up by €2.9 billion
from June 30, 2017
• +103,000 active Customers in Portugal from June
30, 2017
1
2
3
4
209|0|93
253|217|226
191|191|191
217|217|217
6
209|0|93
253|217|226
191|191|191
217|217|217
Highlights
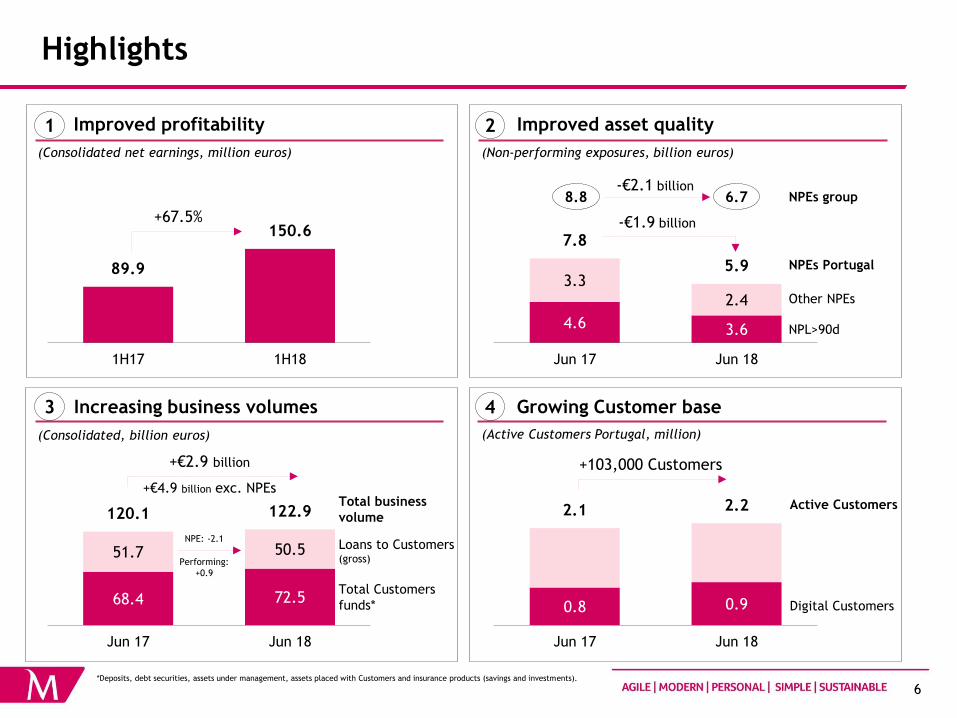
Improved profitability
Increasing business volumes
89.9
150.6
1H17 1H18
Improved asset quality
Growing Customer base
1 2
3 4
(Consolidated net earnings, million euros) (Non-performing exposures, billion euros)
(Consolidated, billion euros) (Active Customers Portugal, million)
+67.5%
4.6 3.6
3.3
2.4
7.8
5.9
Jun 17 Jun 18
-€1.9 billion
NPL>90d
Other NPEs
68.4 72.5
51.7 50.5
120.1 122.9
Jun 17 Jun 18
+€2.9 billion
Total Customers
funds*
Loans to Customers (gross)
0.8 0.9
2.1 2.2
Jun 17 Jun 18
+103,000 Customers
Digital Customers
NPEs Portugal
Total business
volume Active Customers
8.8 6.7 NPEs group -€2.1 billion
NPE: -2.1
Performing:
+0.9
+€4.9 billion exc. NPEs
Crescimento da base de Clientes 4
(Active Customers do Grupo, million)
2.3 2.7
5.2 5.6
Jun 17 Jun 18
+380 mil Clientes
Digital Customers
Active
Customers
*Deposits, debt securities, assets under management, assets placed with Customers and insurance products (savings and investments).
209|0|93
253|217|226
191|191|191
217|217|217
7
209|0|93
253|217|226
191|191|191
217|217|217
Agenda
Highlights
Group
• Profitability
• Business activity
• Capital
Portugal
International operations
Key figures

209|0|93
253|217|226
191|191|191
217|217|217
8
209|0|93
253|217|226
191|191|191
217|217|217
Improved profitability across geographies
*Resultado core = margem financeira + comissões – custos operacionais.
Resultado core*
534.9 117.0
260.4
396.4 437.1
558.6 526.3
1S13 1S14 1S15 1S16 1S17 1S18
Efeito positivo não
habitual de €23,7 million
(custos com pessoal)
(Million euros)
Consolidated net earnings*
Net earnings from international operations
Não incluindo ganhos de
€272 million em dívida
pública portuguesa
Net earnings from domestic activity
89.9
150.6
1H17 1H18
+67.5%
1.6
59.0
1H17 1H18
87.1 89.9
1H17 1H18
+3.1%
• Net earnings of €150.6 million in 1H18, a
67.5% increase from €89.9 million in the same
period of the previous year
• Earnings from domestic activity improved
significantly: €59.0 million in the first six months
of 2018, compared to €1.6 million in the same
period of 2017
• Earnings from international activity increased
3.1%, to € 89.9 million in the first half of 2018
from €87.1 million in the same period of 2017
*Includes earnings from domestic activity, from international operations and from discontinued operations (€1.3 million in the 1st half of
2017 and €1.8 million in the 1st half of 2018).
209|0|93
253|217|226
191|191|191
217|217|217
9
209|0|93
253|217|226
191|191|191
217|217|217
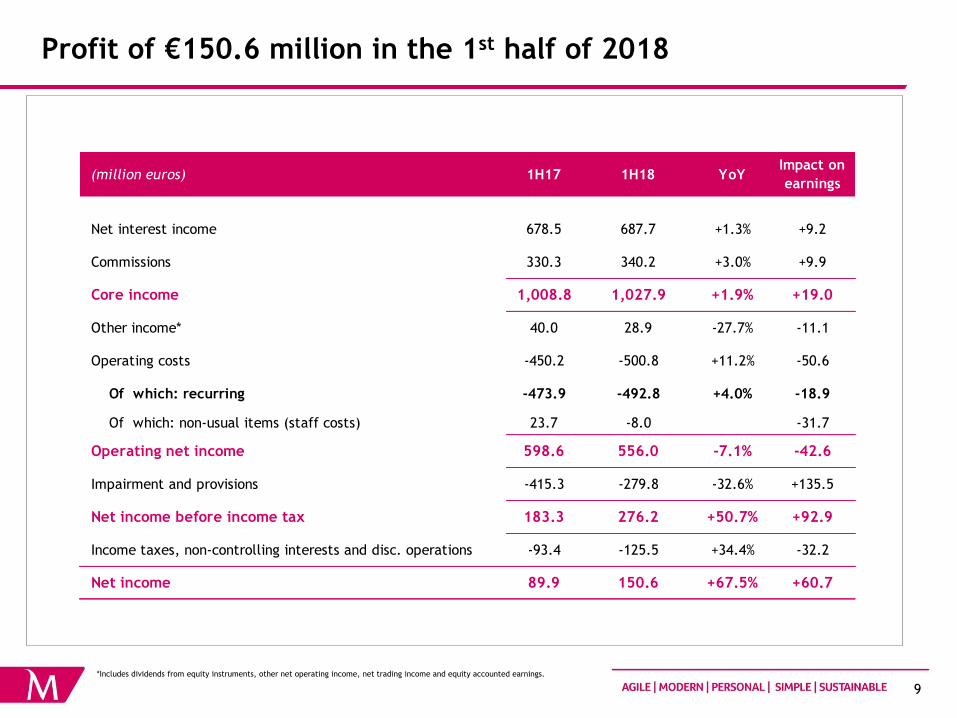
Profit of €150.6 million in the 1st half of 2018
*Includes dividends from equity instruments, other net operating income, net trading income and equity accounted earnings.
(million euros) 1H17 1H18 YoYImpact on
earnings
Net interest income 678.5 687.7 +1.3% +9.2
Commissions 330.3 340.2 +3.0% +9.9
Core income 1,008.8 1,027.9 +1.9% +19.0
Other income* 40.0 28.9 -27.7% -11.1
Operating costs -450.2 -500.8 +11.2% -50.6
Of which: recurring -473.9 -492.8 +4.0% -18.9
Of which: non-usual items (staff costs) 23.7 -8.0 -31.7
Operating net income 598.6 556.0 -7.1% -42.6
Impairment and provisions -415.3 -279.8 -32.6% +135.5
Net income before income tax 183.3 276.2 +50.7% +92.9
Income taxes, non-controlling interests and disc. operations -93.4 -125.5 +34.4% -32.2
Net income 89.9 150.6 +67.5% +60.7
209|0|93
253|217|226
191|191|191
217|217|217
10
209|0|93
253|217|226
191|191|191
217|217|217
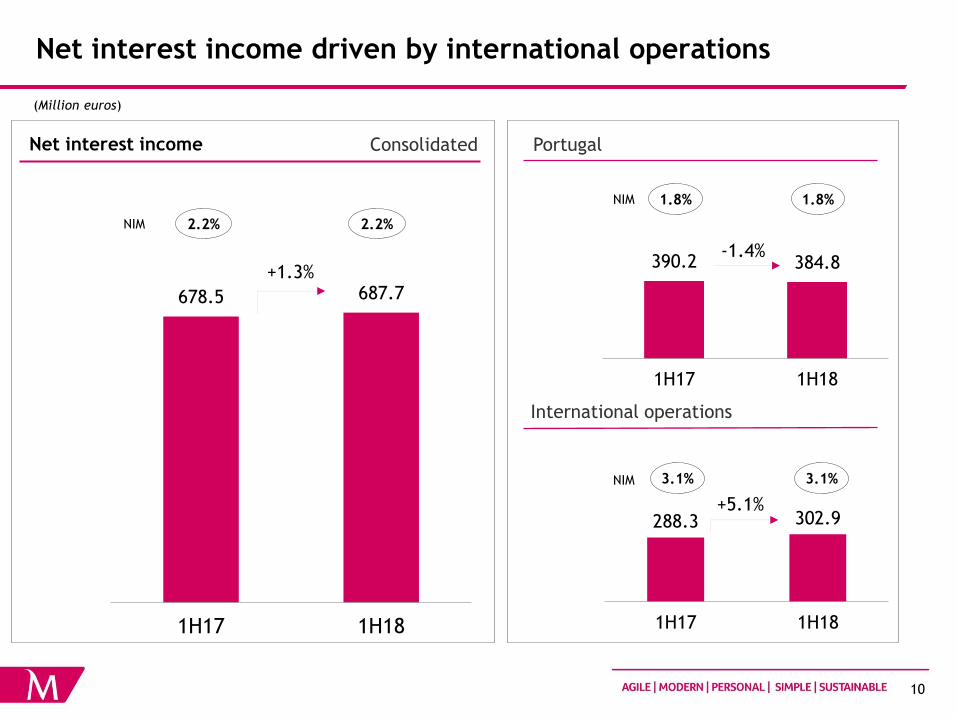
Net interest income driven by international operations
+19,2% sem
efeito cambial
(Million euros)
Net interest income Portugal
NIM 2.2% 2.2%
678.5 687.7
1H17 1H18
+1.3%
288.3 302.9
1H17 1H18
NIM 1.8% 1.8%
390.2 384.8
1H17 1H18
-1.4%
International operations
+5.1%
NIM 3.1% 3.1%
Consolidated

209|0|93
253|217|226
191|191|191
217|217|217
11
209|0|93
253|217|226
191|191|191
217|217|217
Increased commissions
Em %
depósitos
+crédito*
0,61% 0,61%
+13,3% sem
efeito cambial
(Million euros)
225.2 234.0
1H17 1H18
Fees and commisions
105.1 106.3
1H17 1H18
+1.1%
Portugal
International operations
+3.9%
Consolidated
1H17 1H18 YoY
Banking fees and commissions 271.6 278.3 +2.5%
Cards and transfers 75.2 79.8 +6.1%
Loans and guarantees 78.5 81.4 +3.7%
Bancassurance 47.5 48.1 +1.3%
Customer account related 52.1 52.4 +0.6%
Other fees and commissions 18.2 16.6 -9.1%
Market related fees and commissions 58.8 61.9 +5.3%
Securities operations 38.2 39.5 +3.6%
Asset management 20.6 22.4 +8.4%
Total fees and commissions 330.3 340.2 +3.0%

209|0|93
253|217|226
191|191|191
217|217|217
12
209|0|93
253|217|226
191|191|191
217|217|217 89.9 77.0
36.7 42.0
-86.6 -90.1
40.0 28.9
1H17 1H18
Other income* influenced by mandatory contributions and credit
sales
(Million euros)
Other income* Portugal
International operations
13.5 13.2
1H17 1H18
Mandatory
contributions 39.1 40.4
26.5 15.7
1H17 1H18
Consolidated
-27.7%
-40.7%
Includes -€22.4
million on credit sales
Inclui ganho na alienação de
imóvel e indemnização
seguradora (€3,1 million)
Mandatory
contributions 97.0 106.8
Mandatory
contributions 57.9 66.5
• Banking sector PT: 33.1
• European ResolFund: 21.2
• ResolFund/DGF PT: 12.2
-2.2%
*Includes dividends from equity instruments, other net operating income, net trading income and equity accounted earnings.
Net trading
income
Equity earnings
+ dividends
Other operating
income
209|0|93
253|217|226
191|191|191
217|217|217
13
209|0|93
253|217|226
191|191|191
217|217|217
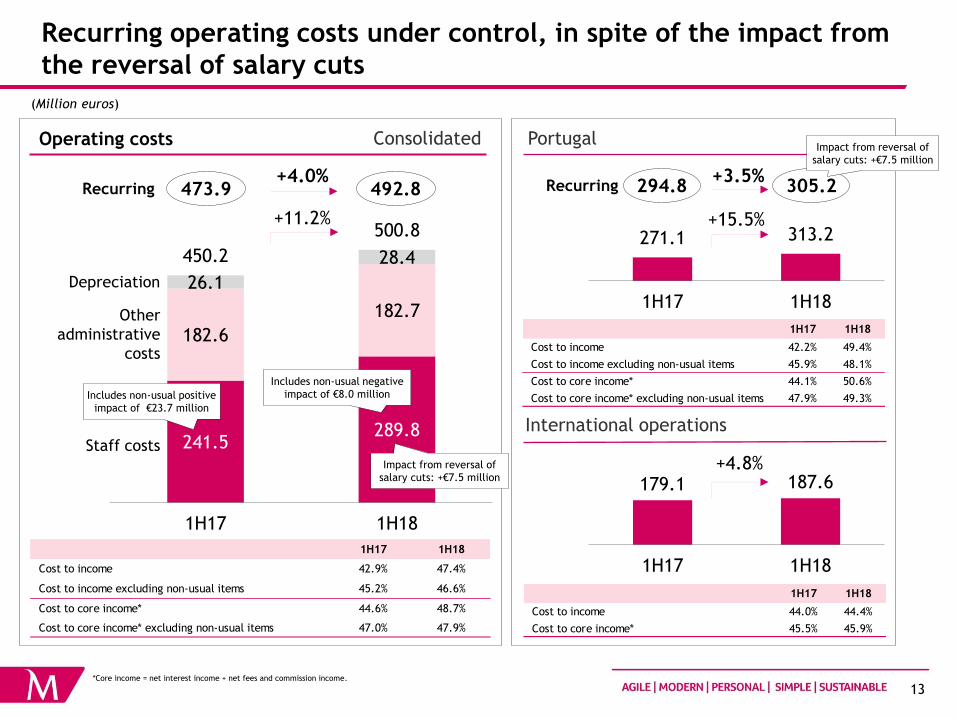
Recurring operating costs under control, in spite of the impact from
the reversal of salary cuts
+5,3% sem
efeito cambial
(Million euros)
Operating costs
241.5 289.8
182.6
182.7
26.1
28.4 450.2
500.8
1H17 1H18
+11.2% 271.1 313.2
1H17 1H18
179.1 187.6
1H17 1H18
Portugal
International operations
+4.8%
Consolidated
+15.5%
Includes non-usual positive
impact of €23.7 million
Includes non-usual negative
impact of €8.0 million
Impact from reversal of
salary cuts: +€7.5 million
Recurring 473.9 492.8 294.8 305.2 Recurring +4.0% +3.5%
Impact from reversal of
salary cuts: +€7.5 million
*Core income = net interest income + net fees and commission income.
Staff costs
Other
administrative
costs
Depreciation
1H17 1H18
Cost to income 42.9% 47.4%
Cost to income excluding non-usual items 45.2% 46.6%
Cost to core income* 44.6% 48.7%
Cost to core income* excluding non-usual items 47.0% 47.9%
1H17 1H18
Cost to income 42.2% 49.4%
Cost to income excluding non-usual items 45.9% 48.1%
Cost to core income* 44.1% 50.6%
Cost to core income* excluding non-usual items 47.9% 49.3%
1H17 1H18
Cost to income 44.0% 44.4%
Cost to core income* 45.5% 45.9%

209|0|93
253|217|226
191|191|191
217|217|217
14
209|0|93
253|217|226
191|191|191
217|217|217
Millennium bcp: one of the most efficient banks in the
Eurozone
47% sem itens
não habituais
Cost to core income*
Banco 1
Banco 2
Banco 3
Banco 4
Latest available information
vs. peers in
Portugal
vs. Euro-zone
banks
54%
74%
65%
49%
58%
49%
71%
78%
98%
77%
60%
49%
86%
49%
2013 1H18
-37pp
Cost to core income*
80% 71% -9pp
73%
47%
2013 1H18
-26pp
Cost to income
67% 68% +1pp
*Core income = net interest income + net fees and commission income.
CGD
Totta
BPI
NB

209|0|93
253|217|226
191|191|191
217|217|217
15
209|0|93
253|217|226
191|191|191
217|217|217
Cost of risk keeps normalisation trend
(Million euros)
305.0
220.8
110.3
59.0
415.3
279.8
1H17 1H18
Impairment and provision charges Portugal
International operations
257.7 191.8
112.3
49.6
370.0
241.3
1H17 1H18
-34.8%
-32.6%
118bp 88bp
Loans
Cost of risk
Other
47.3 29.1
-2.0
9.4
45.3 38.5
1H17 1H18
Loans
Cost of risk
Other
Loans
Cost of risk
Other
133bp 103bp
-15.0%
Consolidated
73bp 45bp
Loan-loss
reserves 3,618 3,327
Loan-loss
reserves 3,165 2,810
Loan-loss
reserves 453 517
Inclui €4,6 million de
efeito IAS29 Angola
Inclui €10,2 million
de imparidades para
imóveis

209|0|93
253|217|226
191|191|191
217|217|217
16
209|0|93
253|217|226
191|191|191
217|217|217
Relevant NPE reduction and strengthened coverage
5,040 4,032
3,721
2,633
8,761
6,665
Jun 17 Jun 18
7,816
5,913
Jun 17 Jun 18
944 752
Jun 17 Jun 18
(Million euros)
Portugal Credit quality
International operations
NPEs
NPEs
Consolidated
NPEs
NPL>90d
Other
NPE coverage by
LLRs 41% 50%
*EBA definition.
**By loan-loss reserves, expected loss gap and collaterals.
Jun 17 Jun 18
NPL>90 days ratio 9.8% 8.0%
NPE ratio* 17.0% 13.2%
NPE ratio inc. securities and off-BS* 13.0% 9.4%
NPE total coverage** 105% 106%
-24.3%
-23.9%
-2.1 billion
-1.9 billion
-20.4%
-0.2 billion

209|0|93
253|217|226
191|191|191
217|217|217
17
209|0|93
253|217|226
191|191|191
217|217|217
Agenda
Highlights
Group
• Profitability
• Business activity
• Capital
Portugal
International operations
Key figures
209|0|93
253|217|226
191|191|191
217|217|217
18
209|0|93
253|217|226
191|191|191
217|217|217
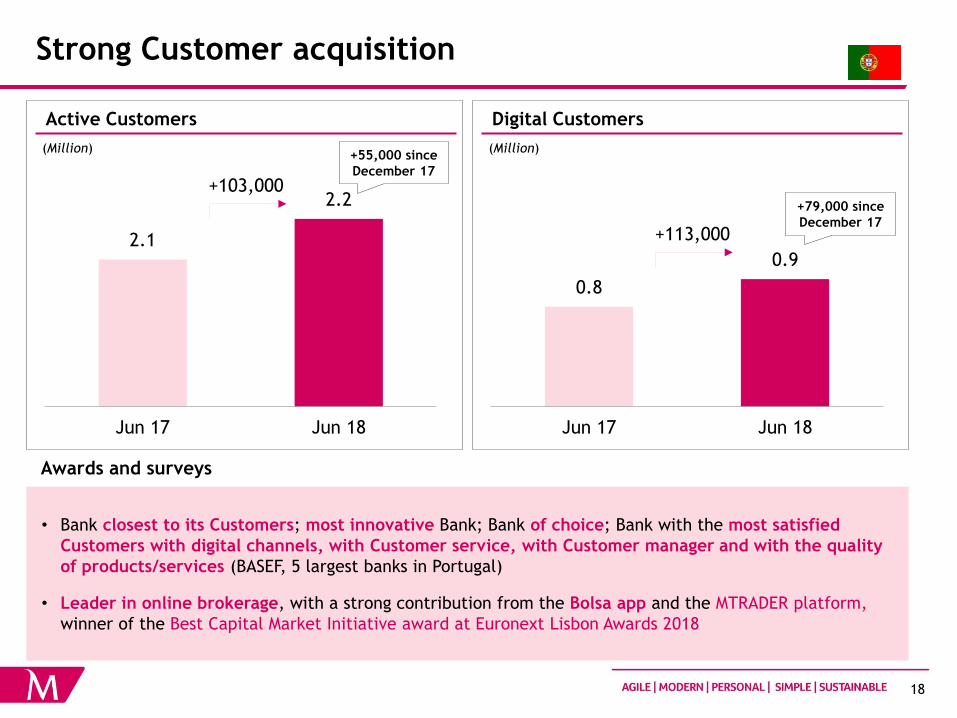
Strong Customer acquisition
2.1
2.2
Jun 17 Jun 18
+103,000
Active Customers
(Million)
0.8
0.9
Jun 17 Jun 18
+113,000
Digital Customers
(Million)
Awards and surveys
• Clientes particulares: Banco mais próximo dos seus Clientes; Banco mais inovador; Banco eleito; Banco com os Clientes mais
satisfeitos com os canais digitais, com a qualidade do atendimento, com o gestor e com a qualidade dos produtos/serviços
(BASEF, 5 maiores bancos)
• Companies: Banco com a maior quota de mercado nas Empresas, com os Clientes mais satisfeitos, e com maior quota de
utilização e satisfação com os canais digitais; melhor Banco para as Empresas, Banco mais próximo dos Clientes, mais
inovador, com produtos mais adequados e mais eficiente (BFin 2018 DataE – 5 maiores Bancos)
• Líder nas operações de bolsa online, com forte contributo da app Bolsa e da plataforma MTRADER (prémio Best Capital
Market Initiative nos Euronext Lisbon Awards 2018)
• O Millennium investment banking foi eleito Best Investment Bank em Portugal pela Euromoney, no âmbito dos Euromoney
Awards for Excellence 2018.
+79,000 since
December 17
+55,000 since
December 17
• Bank closest to its Customers; most innovative Bank; Bank of choice; Bank with the most satisfied
Customers with digital channels, with Customer service, with Customer manager and with the quality
of products/services (BASEF, 5 largest banks in Portugal)
• Leader in online brokerage, with a strong contribution from the Bolsa app and the MTRADER platform,
winner of the Best Capital Market Initiative award at Euronext Lisbon Awards 2018
Active Customers
5.2 5.6
Jun 17 Jun 18
+380 mil
2.4 2.5
Jun 17 Jun 18
+124 mil
Grupo
Portugal
(Milhões)
(Milhões)
Digital Customers
2.3 2.7
Jun 17 Jun 18
+352 mil
0.9 1.0
Jun 17 Jun 18
+123 mil
Grupo
Portugal
(Milhões)
(Milhões)
+195 mil desde
dezembro 17
+85 mil desde
dezembro 17
+195 mil desde
dezembro 17
+85 mil desde
dezembro 17

209|0|93
253|217|226
191|191|191
217|217|217
19
209|0|93
253|217|226
191|191|191
217|217|217
Strong business dynamics results in growing Customer funds
14,603 15,410
Set 16 Set 17
+5,5%
32,535 33,684
1,799 1,597 34,334 35,281
Set 16 Set 17
+2,8%
Particulares e
empresas
Outros (inc
setor público)
+3,6% sem
efeito cambial
+3,5%
(Billion euros)
Total Customers funds* in Portugal
24.2 27.9
26.4 25.6
1.6 1.2
16.2 17.8
68.4 72.5
Jun 17 Jun 18
Total Customers funds*
Demand
deposits
+5.9%
Consolidated
15.4 18.3
19.4 19.2
14.5 15.6
49.4 53.0
Jun 17 Jun 18
+7.5%
Crescimento de 4,7%
incluindo OTRVs
8.8 9.5
7.0 6.4
3.2 3.4
19.0 19.4
Jun 17 Jun 18
+2.0%
*Deposits, debt securities, assets under management, assets placed with Customers and insurance products (savings and investments).
Tot. Customer funds* international operations Term
deposits
Other BS
funds
Off-BS
funds Demand
deposits
Term
deposits
Other
Demand
deposits
Term
deposits
Other
209|0|93
253|217|226
191|191|191
217|217|217
20
209|0|93
253|217|226
191|191|191
217|217|217
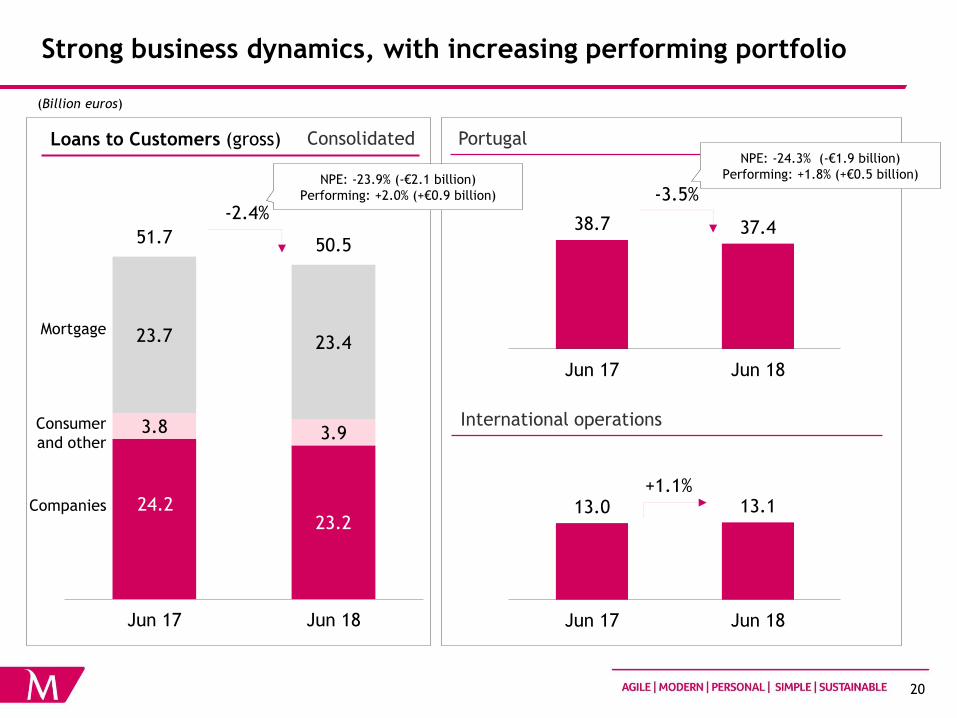
Strong business dynamics, with increasing performing portfolio
0 0
-1,784
39,361 39,361
37,996
Dez 16 NPE Não NPE Dez 16 NPE Não NPE Dez 17
+2,0% sem
efeito cambial
(Billion euros)
Loans to Customers (gross)
24.2 23.2
3.8 3.9
23.7 23.4
51.7 50.5
Jun 17 Jun 18
Companies
Consumer
and other
Mortgage
International operations
Portugal
-2.4%
13.0 13.1
Jun 17 Jun 18
Consolidated
NPE: -23.9% (-€2.1 billion)
Performing: +2.0% (+€0.9 billion)
38.7 37.4
Jun 17 Jun 18
-3.5%
NPE: -24.3% (-€1.9 billion)
Performing: +1.8% (+€0.5 billion)
+1.1%
209|0|93
253|217|226
191|191|191
217|217|217
21
209|0|93
253|217|226
191|191|191
217|217|217
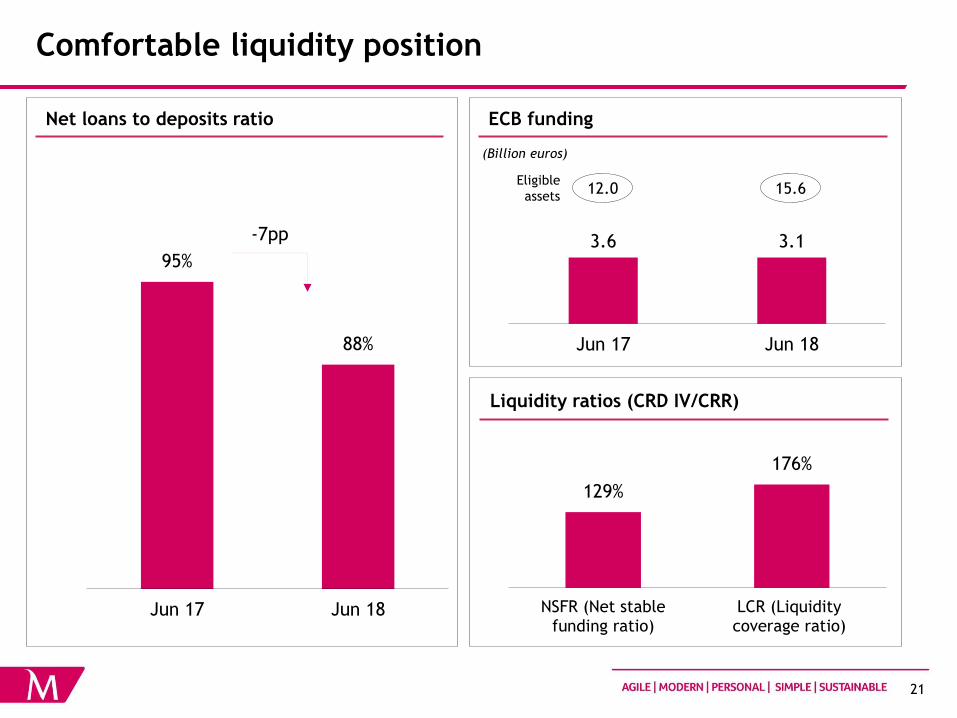
Comfortable liquidity position
Amortizações de dívida (médio e longo prazos)
3.3
0.9 1.6
0.2 1.3
Média2009-2015
2016 2017 2018 >2018
Já amortizado
(Billion euros, exclui CoCos)
A amortizar
95%
88%
Jun 17 Jun 18
-7pp
(Billion euros)
3.6 3.1
Jun 17 Jun 18
15.6 12.0
129%
176%
NSFR (Net stablefunding ratio)
LCR (Liquiditycoverage ratio)
Net loans to deposits ratio ECB funding
Eligible
assets
Liquidity ratios (CRD IV/CRR)

209|0|93
253|217|226
191|191|191
217|217|217
22
209|0|93
253|217|226
191|191|191
217|217|217
Agenda
Highlights
Group
• Profitability
• Business activity
• Capital
Portugal
International operations
Key figures

209|0|93
253|217|226
191|191|191
217|217|217
23
209|0|93
253|217|226
191|191|191
217|217|217
Comfortable capital position
Rácio Common Equity Tier 1
vs. bancos
zona euro
*
12.0%
13.4%
12.3%
13.0%
11.9%
Fully implemented
11.3% 11.7%
Jun 17 Jun 18
37.7 41.7
12.4% 13.2%
CET1 capital ratio of 11.6% (fully implemented
and phased-in)
Increase from a 11.3% fully implemented ratio
as of June 30, 2017 due to earnings and
improved fair value reserves, partially offset by
the impact of the IFRS9 adoption, by the
deduction of irrevocable commitments (DGF/SRF)
and by increased risk-weighted assets
The decrease from a 11.8% fully implemented
ratio as of March 31 reflects the deterioration of
public debt yields and increased risk-weighted
assets
Total capital ratios of 13.2% (fully implemented)
and 13.3% (phased-in), boosted by the €300
million subordinated debt (tier 2) issued in
December 2017
RWAs (€Bn)
Total ratio
Common Equity Tier 1 ratio*
ECB requirement
(SREP) for CET1 in
2018: 8.8%
CET1 capital ratio of 11.7% (fully implemented)
Increase from a 11.3% fully implemented ratio
as of June 30, 2017 due to organic capital
generation (+66bps on capital due to earnings
from 1st half of 2017) and improved fair value
reserves, partially offset by the impact of the
IFRS9 adoption, by the deduction of irrevocable
commitments (DGF/SRF) and by increased risk-
weighted assets
Decrease from a 11.8% fully implemented ratio
as of March 31, as organic capital generation
(+16bps on capital due to earnings for the
quarter) was offset by the deterioration of public
debt yields and by increased risk-weighted assets
Total capital ratios of 13.3% (fully
implemented), boosted by the €300 million
subordinated debt (tier 2) issued in December
2017

209|0|93
253|217|226
191|191|191
217|217|217
24
209|0|93
253|217|226
191|191|191
217|217|217
3.7% 4.5%
5.7% 6.3% 6.4%
FR DE ES IT
Capital at comfortable levels, strong leverage ratios
5.7% 6.4%
Jun 17 Jun 18
93.2%
74.4%
Jun 17 Jun 18
26% 25%
43% 42%
57%
FR DE ES IT
Fully implemented
*Texas ratio = NPE / (Tangible equity + loan-loss reserves).
Leverage ratio
Texas ratio*
Leverage ratio
Fully implemented, latest available data
RWA density RWAs as % of assets, latest available data

209|0|93
253|217|226
191|191|191
217|217|217
25
209|0|93
253|217|226
191|191|191
217|217|217
Pension fund
Assumptions of the fund unchanged from
December 31, 2017
Coverage of liabilities of 105%
Positive actuarial deviations in the 1st
half of 2018 (+€27 million), reflecting the
performance of the fund above
assumptions
Shares 13%
Bonds 35%
Real estate 8%
Cash and other 44%
Pension fund Key figures
Assumptions
(Million euros)
Dec 17 Jun 18
Pension liabilities 3,050 3,056
Pension fund 3,166 3,202
Liabilities' coverage 104% 105%
Fund's profitability +4.2% +3.1%
Actuarial differences +29 +27
Discount rate
Projected rate of return of fund assets
Mortality Tables
Men
Women
Salary growth rate
Pensions growth rate
2.10%
Dec 17
2.10%
0.25% until 2019
0.75% after 2019
0.00% until 2019
0.50% after 2019
Jun 18
2.10%
0.25% until 2019
Tv 88/90
Tv 88/90-3 years
2.10%
Tv 88/90
Tv 88/90-3 years
0.75% after 2019
0.00% until 2019
0.50% after 2019

209|0|93
253|217|226
191|191|191
217|217|217
26
209|0|93
253|217|226
191|191|191
217|217|217
Agenda
Highlights
Group
• Profitability
• Business activity
• Capital
Portugal
International operations
Key figures

209|0|93
253|217|226
191|191|191
217|217|217
27
209|0|93
253|217|226
191|191|191
217|217|217
271.1 313.2
1H17 1H18
1.6
59.0
1H17 1H18
641.9 634.4
1H17 1H18
Increased net income
(Million euros)
Net earnings of €59.0 million in 1H18, + €57.5
million compared to €1.6 million in the same
period of 2017
Net earnings were driven by a significant
reduction in credit-loss charges (-25.6%, with
cost of risk decreasing to 103bp from 133bp), as
well as by lower other impairment and provisions
(-55.9%)
+57.5
Includes non-usual positive
impact of €23.7 million
Includes non-usual negative
impact of €8.0 million
Impact from reversal of
salary cuts: +€7.5 million
Net income
Operating costs
Banking income

209|0|93
253|217|226
191|191|191
217|217|217
28
209|0|93
253|217|226
191|191|191
217|217|217
Net interest income
Net interest income decreased from €390.2 million in the first half of 2017 to €384.8 million in the same period
of 2018. The favourable impacts of the repayment of CoCos; of the continued decline in the remuneration of
time deposits; and of a lower wholesale funding cost were more than offset by the negative effects of the
lower volume of credit, largely reflecting the emphasis on the reduction of NPEs (unlikely to pay); of lower
interest recoveries (including IFRS9); and of the securities portfolio (increased balance yielding lower interest,
reflecting lower sovereign yields from the end of the first half of 2017)
Net interest income increased slightly from €192.0 million in the first quarter to €192.8 million in the second
quarter of 2018
-1.4%
+6.3 +8.5 +18.1
-16.1 -12.6
-9.8
+0.1 390.2 384.8
1H17 CoCorepayment
effect
Effect of costof timedeposits
Effect ofwholesale cost
Creditvolumeeffect
Effect of netrecovery of
interest
Effect ofsecuritiesportfolio
Other 1H18
1.8% 1.8% NIM
Net interest income (Million euros)
209|0|93
253|217|226
191|191|191
217|217|217
29
209|0|93
253|217|226
191|191|191
217|217|217
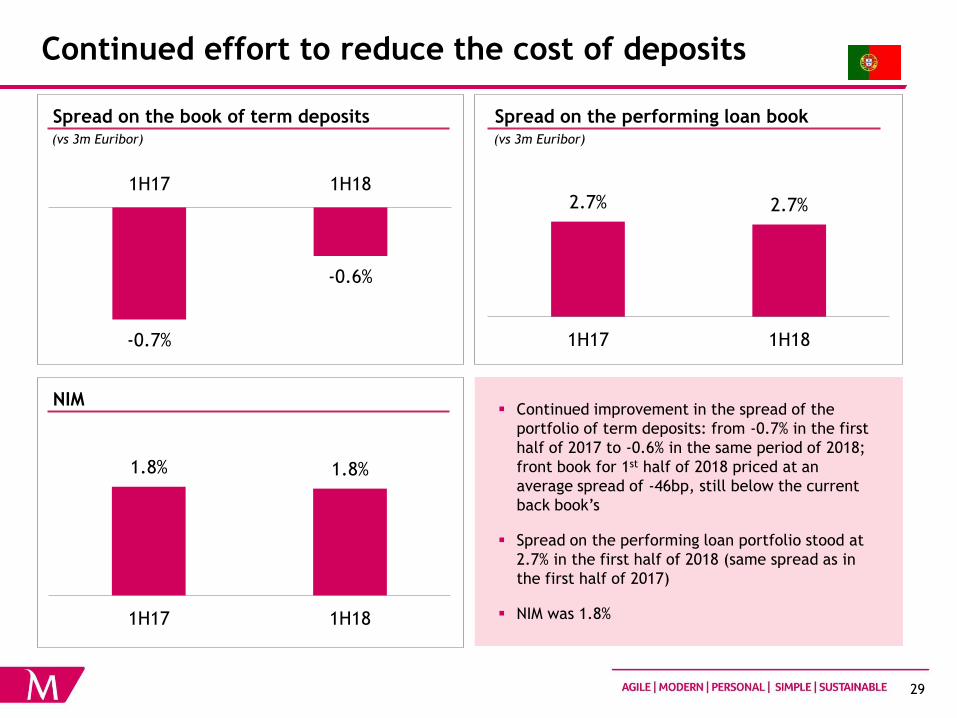
Continued effort to reduce the cost of deposits
Continued improvement in the spread of the
portfolio of term deposits: from -0.7% in the first
half of 2017 to -0.6% in the same period of 2018;
front book for 1st half of 2018 priced at an
average spread of -46bp, still below the current
back book’s
Spread on the performing loan portfolio stood at
2.7% in the first half of 2018 (same spread as in
the first half of 2017)
NIM was 1.8%
-0.7%
-0.6%
1H17 1H182.7% 2.7%
1H17 1H18
NIM
1.8% 1.8%
1H17 1H18
Continued improvement in the spread of the
portfolio of term deposits: from -0.7% in the first
half of 2017 to -0.6% in the same period of 2018;
front book for 1st half of 2018 priced at an
average spread of -46bp, still below the current
back book’s
Spread on the performing loan portfolio stood at
2.7% in the first half of 2018 (same spread as in
the first half of 2017)
NIM was 1.8%
Spread on the book of term deposits (vs 3m Euribor)
Spread on the performing loan book (vs 3m Euribor)

209|0|93
253|217|226
191|191|191
217|217|217
30
209|0|93
253|217|226
191|191|191
217|217|217
Commissions and other income*
(Million euros)
26.5
15.7
1H17 1H18
-40.7%
Growing commissions in Portugal, in all
lines, with income related to markets
(brokerage, in particular) and to
investment banking activity standing
out
Decreased other income due to lower
trading income (-€22.4 million in sales
of credit) and to higher mandatory
contributions (+€8.6 million)
Growing commissions in Portugal, in all lines,
with income related to markets (brokerage, in
particular) and to investment banking activity
standing out
Decreased other income due to lower trading
income (-€22.4 million in sales of credit) and to
higher mandatory contributions (+€8.6 million)
*Includes dividends from equity instruments, other net operating income, net trading income and equity accounted earnings.
Fees and commissions Other income*
1H17 1H18 YoY
Banking fees and commissions 194.0 201.0 +3.6%
Cards and transfers 51.4 53.1 +3.4%
Loans and guarantees 51.7 53.5 +3.4%
Bancassurance 39.3 40.7 +3.6%
Customer account related 46.4 46.9 +0.9%
Other fees and commissions 5.2 6.9 +32.8%
Market related fees and commissions 31.2 32.9 +5.6%
Securities operations 28.0 29.6 +5.6%
Asset management 3.2 3.3 +5.0%
Total fees and commissions 225.2 234.0 +3.9%
209|0|93
253|217|226
191|191|191
217|217|217
31
209|0|93
253|217|226
191|191|191
217|217|217
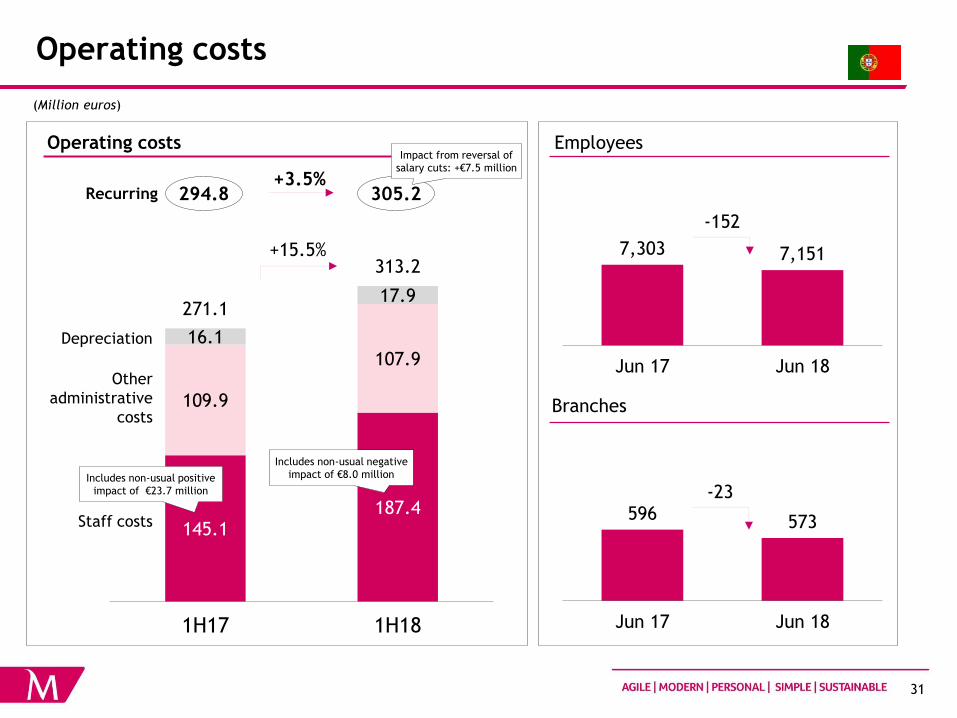
Operating costs
(Million euros)
145.1 187.4
109.9
107.9 16.1
17.9 271.1
313.2
1H17 1H18
Operating costs
596 573
Jun 17 Jun 18
-23
7,303 7,151
Jun 17 Jun 18
-152 Cost to core
income* 50,4% 50,3%
Cost to income 44,8% 46,0%
+15.5%
Includes non-usual positive
impact of €23.7 million
Includes non-usual negative
impact of €8.0 million
294.8 305.2 Recurring +3.5%
Impact from reversal of
salary cuts: +€7.5 million
Employees
Branches
Staff costs
Other
administrative
costs
Depreciation

209|0|93
253|217|226
191|191|191
217|217|217
32
209|0|93
253|217|226
191|191|191
217|217|217
Very strong pace of NPE reduction since 2013
(Million euros)
6,213 6,134 5,572 5,029 4,058 3,561
12,783 10,921
9,777 8,538
6,754 5,913
Dec 13 Dec 14 Dec 15 Dec 16 Dec 17 Jun 18
NPL>90d
Other
NPEs
23% 28% 31%
39% 42%
48%
Dec 13 Dec 14 Dec 15 Dec 16 Dec 17 Jun 18
101.4% 105.6% 90.3% 92.6% 106.3% 86.0%
• NPEs in Portugal down to €5.9 billion as of
June 30, 2018, a €841 million reduction
from year-end 2017
• This decrease is attributable to a €497
million NPLs> 90d reduction and to a
€344 million reduction of other NPEs
• NPE total coverage* of 106%, broken down
as follows:
– coverage by loan-loss reserves of 48%
– coverage by real estate collateral of 44%
– coverage by financial collateral of 12%
– coverage by expected loss gap of 2%
• NPEs net from loan-loss reserves were
down to €3.1 billion on June 30, 2018
from € 9.8 billion at year-end 2013
*By loan-loss reserves, expected loss gap and collaterals.
Non-performing exposures (NPEs)
NPE coverage
Coverage by
LLRs
Total
coverage*

209|0|93
253|217|226
191|191|191
217|217|217
33
209|0|93
253|217|226
191|191|191
217|217|217
Lower NPEs, with reinforced coverage
(Million euros)
4,558 3,561
3,258 2,352
7,816
5,913
Jun 17 Jun 18
-24.3%
NPL>90d
Other NPEs
257.7 191.8
1H17 1H18
133bp 103bp Cost of
risk
3,165 2,810
NPEs in Portugal down by €1.9 billion, from €7.8 billion as at June
30, 2017 to €5.9 billion as at the same date of 2018
This decrease results from net outflows of €813 million, sales of
€560 million and write-offs of €531 million
The decrease of NPEs from June 30, 2017 is attributable to a €1.0
billion reduction of NPLs>90d and to a €0.9 billion decrease of other
NPEs
Significant NPE reduction in the quarter, from €6.3 billion as at
March 31 to €5.9 billion as at June 30, 2018
Reduction of the cost of risk to 103bp in the first half of 2018 from
133bp in the same period of 2017, with a reinforcement of coverage
of the NPEs by loan-loss reserves to 48% from 40%, respectively
NPE build-up Non-performing exposures (NPEs)
Loan impairment (net of recoveries)
Loan-loss
reserves
Jun 18
vs.Jun 17
Jun 18
vs.Mar 18
Opening balance 7,816 6,282
+/- Net entries -813 -134
- Write-offs -531 -134
- Sales -560 -101
Ending balance 5,913 5,913
209|0|93
253|217|226
191|191|191
217|217|217
34
209|0|93
253|217|226
191|191|191
217|217|217
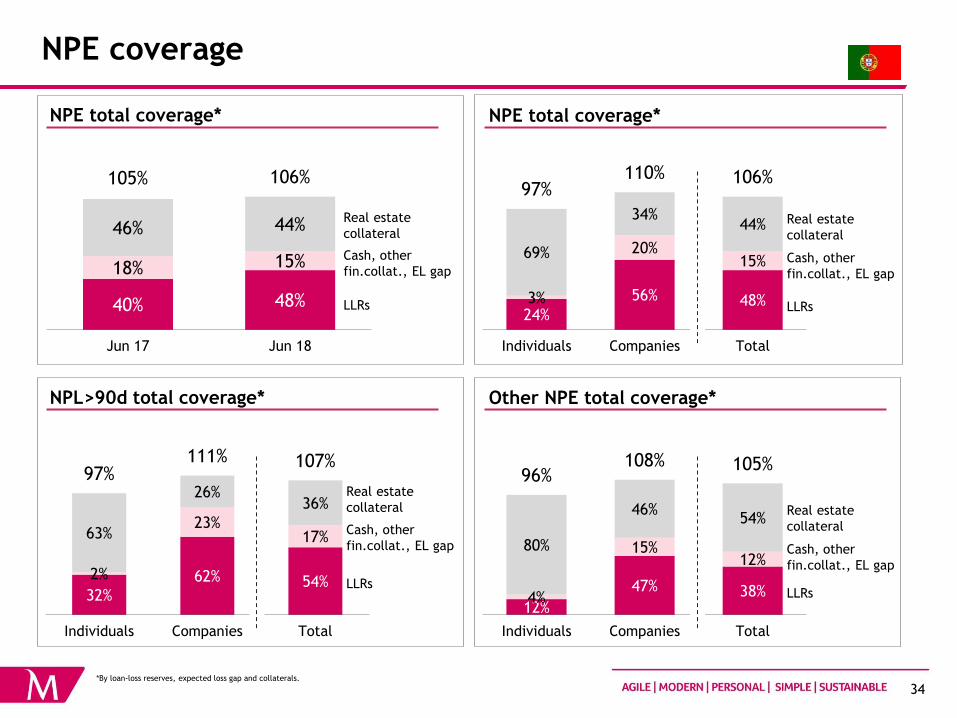
NPE coverage
24%
56% 48% 3%
20% 15%
69%
34% 44%
97% 110% 106%
Individuals Companies Total
12%
47% 38% 4%
15% 12%
80%
46% 54%
96% 108% 105%
Individuals Companies Total
32%
62% 54% 2%
23% 17% 63%
26% 36%
97% 111% 107%
Individuals Companies Total
40% 48%
18% 15%
46% 44%
105% 106%
Jun 17 Jun 18
*By loan-loss reserves, expected loss gap and collaterals.
NPE total coverage* NPE total coverage*
Other NPE total coverage* NPL>90d total coverage*
LLRs
Real estate
collateral
Cash, other
fin.collat., EL gap
LLRs
Real estate
collateral
Cash, other
fin.collat., EL gap
LLRs
Real estate
collateral
Cash, other
fin.collat., EL gap
LLRs
Real estate
collateral
Cash, other
fin.collat., EL gap

209|0|93
253|217|226
191|191|191
217|217|217
35
209|0|93
253|217|226
191|191|191
217|217|217
Foreclosed assets and corporate restructuring funds
(Million euros)
(Million euros)
148
224
1H17 1H18
1,629 1,448
196 216
1,825 1,664
Jun 17 Jun 18
(Million euros)
1,615 2,189
165 255
9 0
854 825
205 195
1,068 1,020
Jun 17 Jun 18
Original credit exposure: €2,006 million
Book value (30 Jun 2018): €1,020 million
Total impairment (credit+restr. funds): €986 million
(49% coverage)
-11.1% -6.6%
Valuation exceeds book value
by 26%
Foreclosed assets
Sales of foreclosed assets
Book value
Net value
Impairment
Corporate restructuring funds
# properties
sold
Sale value
Construction
RE/tourism
Industry

209|0|93
253|217|226
191|191|191
217|217|217
36
209|0|93
253|217|226
191|191|191
217|217|217
15.4 18.3
19.4 19.2
1.5 1.1
13.0 14.4
49.4
53.0
Jun 17 Jun 18
19.4 18.2
2.0 2.0
17.3 17.1
38.7 37.4
Jun 17 Jun 18
Strong business dynamics leads to increased Customer funds and
performing credit portfolio
(Billion euros)
Loans to Customers (gross) Total Customers funds*
+7.5%
-3.5%
Demand
deposits
Term
deposits
Other BS
funds
Off-BS
funds
Companies
Consumer
and other
Mortgage
NPE: -24.3% (-€1.9 billion)
Performing: +1.8% (+€0.5 billion) Decrease from €38.0 billion in March due
to strong NPE reduction (-€369 million)
and wholesale maturities (-€350 million)
*Deposits, debt securities, assets under management, assets placed with Customers and insurance products (savings and investments).

209|0|93
253|217|226
191|191|191
217|217|217
37
209|0|93
253|217|226
191|191|191
217|217|217
Credit now growing in Portugal
(Billion euros)
Performing credit portfolio
30.9
31.4
Jun 17 Jun 18
Total Customers funds*
-5.5 -0.8 -0.1
+0.1
25.2
18.9 18.9
Dez 13 Construção,imobiliário,
SGPS não fin.
Outrossetores
Dez 17 Construção,imobiliário,
SGPS não fin.
Outrossetores
Jun 18
50.8 53.1
Jun 17 Jun 18
+1.8%
+4,5%
• Growth of the performing credit
portfolio in Portugal of 1.8% from June
30, 2017
• Strong performance of credit activity
in the first six months of 2018:
– New consumer credit increased 19.1%
compared to the first half of 2017.
Strong focus on digital, with new
remote underwriting channels (mobile
web and app) and actions targeting
Customers with pre-scoring conditions
for online credit
– Significant increase in new mortgage
lending (+72.7% compared to the first
half of 2017), with strong growth in
credit simulations on digital channels
and a new innovating service allowing
contract execution until 10:00pm and
during weekends

209|0|93
253|217|226
191|191|191
217|217|217
38
209|0|93
253|217|226
191|191|191
217|217|217
Main bank of companies in Portugal
Results BFin 2018 DataE*, 5 largest Banks in Portugal
Used as primary
Bank
Satisfaction with
primary Bank**
Usage of net
banking
Satisfaction net
banking**
Usage and satisfaction indicators (%)
Overall best
Bank
Closest to
Customers
More
innovating
Most appropriate
products
Image indicators (%)
10
12
16
17
20
Bank 1
Bank 2
Bank 3
Bank 4 -3
11
11
16
24
15
21
25
27
27
20
35
37
46
52
Mobile:
25% (#1)
4
7
8
12
12
Bank 1
Bank 2
Bank 3
Bank 4 4
7
9
11
13
3
4
6
11
13
3
7
8
8
11
More efficient:
15% (#1)
• Millennium bcp is the main Bank of
Companies in Portugal, where it
leads with a market share of 20.2%
in all dimensions (Micro, SMEs,
MidCaps and Large Companies),
according to BFin 2018 DataE
• Millennium bcp leads in trade,
services and industry, as well as in
exporting companies, in Portugal
2020, factoring and leasing
• Most used bank for credit lines and
main choice of Companies that
intend to invest in the next 12
months
• Leadership also in digital, in the
usage of both Net Banking and
Mobile Banking, and in Customer
satisfaction regarding Net Banking
• Bank referred to as the “Overall
Best Bank for Companies”,
“Overall More Efficient”, with
“Products most appropriate to
Companies”, “More Innovating”
and “Closest to Customers”
*According to DataE, the "Business-Banking Financial Services Barometer (BFin Bancos)" is a study whose main objective is to characterize
the Portuguese banking sector from the point of view of companies, regarding banking products and services. The results of BFin 2018 are
based on a sample of more than 1,300 companies. The information was collected between April and June 2018.
**Satisfaction in Net Promoter Score (NPS) = % promoters - % detractors.

209|0|93
253|217|226
191|191|191
217|217|217
39
209|0|93
253|217|226
191|191|191
217|217|217
Agenda
Highlights
Group
• Profitability
• Business activity
• Capital
Portugal
International operations
Key figures
209|0|93
253|217|226
191|191|191
217|217|217
40
209|0|93
253|217|226
191|191|191
217|217|217
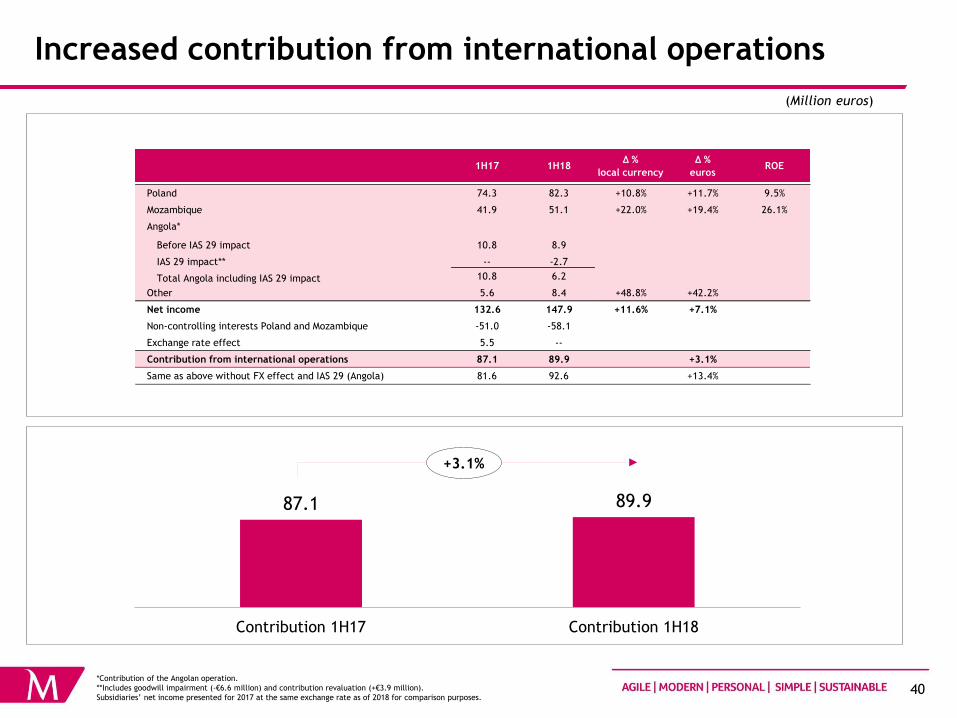
Increased contribution from international operations
(Million euros)
87.1 89.9
Contribution 1H17 Contribution 1H18
+3.1%
*Contribution of the Angolan operation.
**Includes goodwill impairment (-€6.6 million) and contribution revaluation (+€3.9 million).
Subsidiaries’ net income presented for 2017 at the same exchange rate as of 2018 for comparison purposes.
1H17 1H18Δ %
local currency
Δ %
eurosROE
Poland 74.3 82.3 +10.8% +11.7% 9.5%
Mozambique 41.9 51.1 +22.0% +19.4% 26.1%
Angola*
Before IAS 29 impact 10.8 8.9
IAS 29 impact** -- -2.7
Total Angola including IAS 29 impact 10.8 6.2
Other 5.6 8.4 +48.8% +42.2%
Net income 132.6 147.9 +11.6% +7.1%
Non-controlling interests Poland and Mozambique -51.0 -58.1
Exchange rate effect 5.5 --
Contribution from international operations 87.1 89.9 +3.1%
Same as above without FX effect and IAS 29 (Angola) 81.6 92.6 +13.4%

209|0|93
253|217|226
191|191|191
217|217|217
41
209|0|93
253|217|226
191|191|191
217|217|217
Increased net income
143.8 149.6
1H17 1H18
(Million euros)
ROE 9.5% 9.5%
+4.0%
74.3 82.3
1H17 1H18
+10.8%
Net earnings of € 82.3 million (+10.8%), with ROE of 9.5%
Increasing banking income, driven by net interest income
and commissions
Customer funds up by 5.8%, while loans to Customers
increased by 15.6%, excluding FX-denominated mortgage
loans
CET1 ratio of 21.3% as of June 30, 2018
1.6 million active Customers, a 11% increase over June 30,
2017
Bank Millennium was considered the digital leader in the
Deloitte EMEA Digital Banking maturity survey 2018
297.7 313.6
1H17 1H18
+5.4%
Net earnings of € 82.3 million (+10.8%), with ROE of 9.5%
Increasing banking income, driven by net interest income and
commissions
Customer funds up by 5.8%, while loans to Customers increased by
15.6%, excluding FX-denominated loans
CET1 ratio of 21.3% as of June 30, 2018
1.6 million active Customers, a 11% increase over June 30, 2017, with
1.2 million active Digital Customers (+12%).
Bank Millennium was considered the digital leader in the Deloitte EMEA
Digital Banking maturity survey 2018
FX effect excluded. €/Zloty constant at June 2018 levels: Income Statement 4.22565833; Balance Sheet 4.3723. | *Pro forma data. Margin
from derivative products, including those from hedging FX denominated loan portfolio, is included in net interest income, whereas in
accounting terms, part of this margin (€5.7 million in 2018 and €6.3 million in 2017) is presented in net trading income.
Net income
Operating costs
Banking income
209|0|93
253|217|226
191|191|191
217|217|217
42
209|0|93
253|217|226
191|191|191
217|217|217
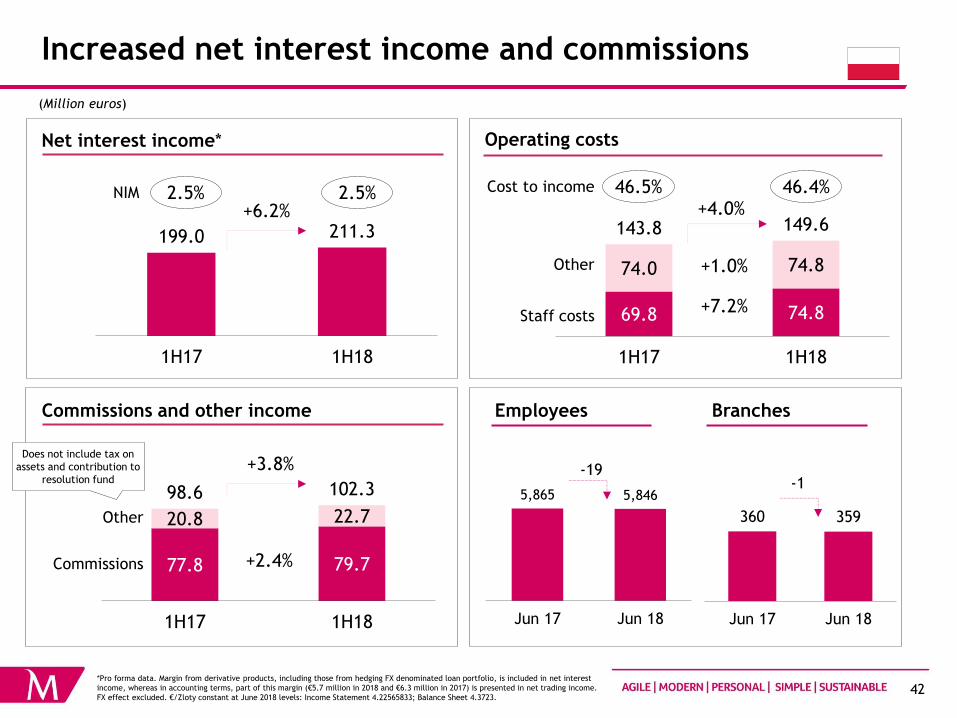
77.8 79.7
20.8 22.7
98.6 102.3
1H17 1H18
Increased net interest income and commissions
69.8 74.8
74.0 74.8
143.8 149.6
1H17 1H18
+4.0%
360 359
Jun 17 Jun 18
199.0 211.3
1H17 1H18
+6.2%
(Million euros)
+3.8%
NIM 2.5% 2.5% Cost to income 46.5% 46.4%
+2.4%
+7.2%
+1.0%
5,865 5,846
Jun 17 Jun 18
-19 -1
*Pro forma data. Margin from derivative products, including those from hedging FX denominated loan portfolio, is included in net interest
income, whereas in accounting terms, part of this margin (€5.7 million in 2018 and €6.3 million in 2017) is presented in net trading income.
FX effect excluded. €/Zloty constant at June 2018 levels: Income Statement 4.22565833; Balance Sheet 4.3723.
Net interest income*
Commissions and other income
Operating costs
Branches Employees
Staff costs
Other
Commissions
Other
Does not include tax on
assets and contribution to
resolution fund
209|0|93
253|217|226
191|191|191
217|217|217
43
209|0|93
253|217|226
191|191|191
217|217|217
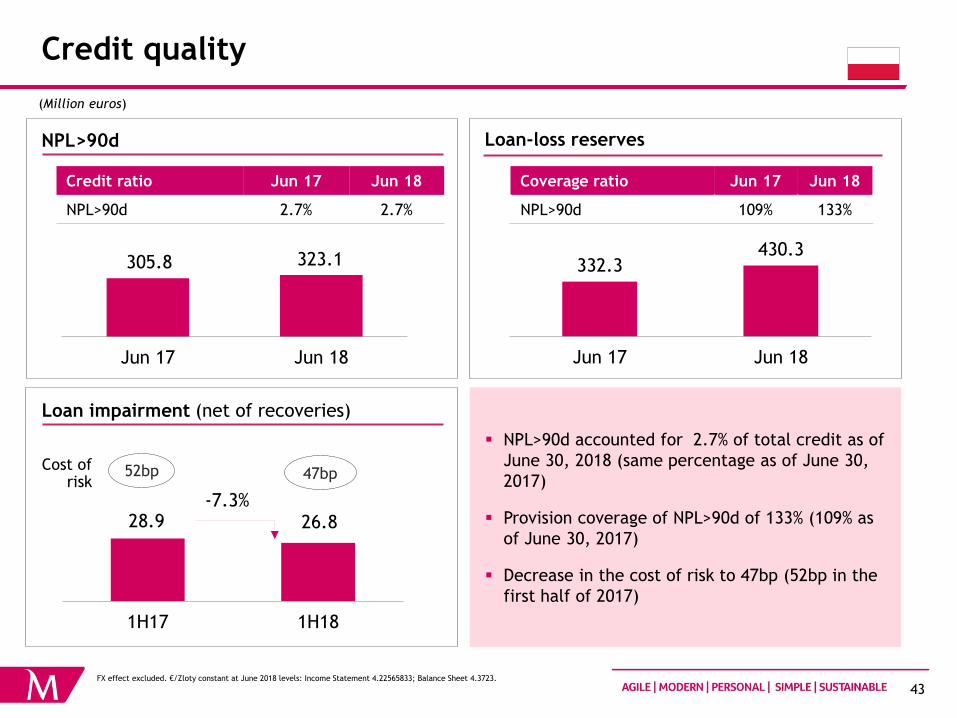
28.9 26.8
1H17 1H18
Credit quality
(Million euros)
NPL>90d accounted for 2.7% of total credit as of
June 30, 2018 (same percentage as of June 30,
2017)
Provision coverage of NPL>90d of 133% (109% as
of June 30, 2017)
Decrease in the cost of risk to 47bp (52bp in the
first half of 2017)
Credit ratio Jun 17 Jun 18
NPL>90d 2.7% 2.7%
Coverage ratio Jun 17 Jun 18
NPL>90d 109% 133%
332.3 430.3
Jun 17 Jun 18
Cost of risk
52bp 47bp
-7.3%
305.8 323.1
Jun 17 Jun 18
FX effect excluded. €/Zloty constant at June 2018 levels: Income Statement 4.22565833; Balance Sheet 4.3723.
NPL>90d
Loan impairment (net of recoveries)
Loan-loss reserves

209|0|93
253|217|226
191|191|191
217|217|217
44
209|0|93
253|217|226
191|191|191
217|217|217
7,222 8,277
5,812 5,407
98 93 1,834
2,058
14,966 15,835
Jun 17 Jun 18
Growing volumes
3,515 3,920
1,501 1,715
3,770 3,392
2,367 2,898
11,154 11,924
Jun 17 Jun 18
+6.9%
-10.0%
+14.2%
+11.5%
(Million euros)
Loans to Customers (gross) Customers funds
Companies
Consumer
and other
Mortgage Foreign exchange
Demand
deposits
Term
deposits
Other BS
funds
Off-BS
funds
+5.8%
+14.6%
-7.0%
-5.0%
+12.2%
+15.6% excluding FX
mortgage loans
Mortgage Local currency
+22.4%
FX effect excluded. €/Zloty constant at June 2018 levels: Income Statement 4.22565833; Balance Sheet 4.3723.
209|0|93
253|217|226
191|191|191
217|217|217
45
209|0|93
253|217|226
191|191|191
217|217|217
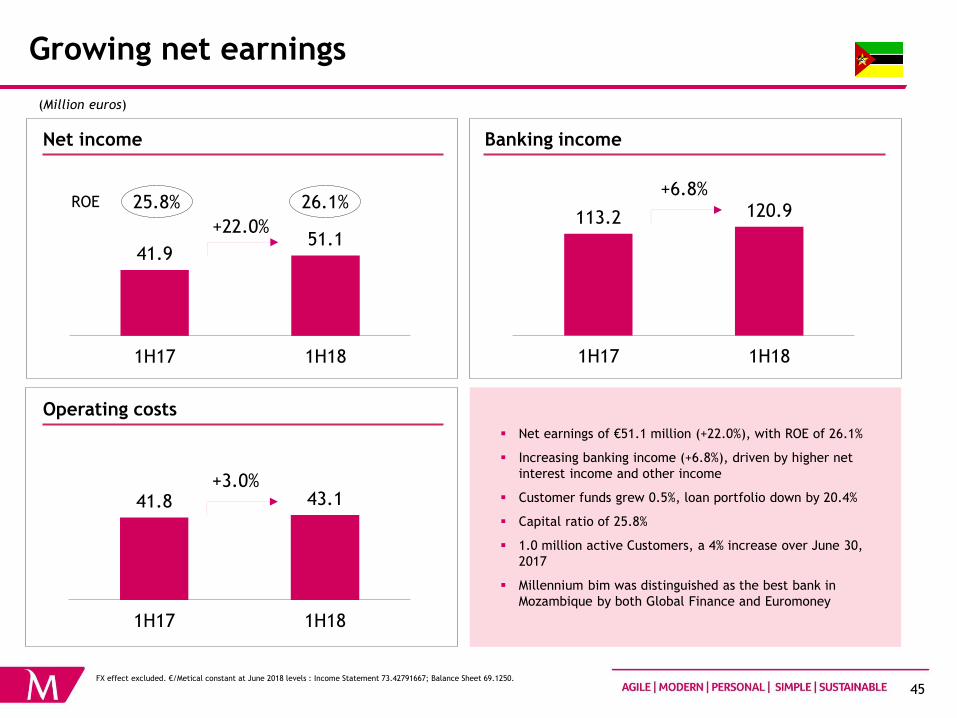
Growing net earnings
41.9 51.1
1H17 1H18
+22.0%
(Million euros)
113.2 120.9
1H17 1H18
+6.8% ROE 25.8% 26.1%
41.8 43.1
1H17 1H18
+3.0%
Net earnings of €51.1 million (+22.0%), with ROE of 26.1%
Increasing banking income (+6.8%), driven by higher net
interest income and other income
Customer funds grew 0.5%, loan portfolio down by 20.4%
Capital ratio of 25.8%
1.0 million active Customers, a 4% increase over June 30,
2017
Millennium bim was distinguished as the best bank in
Mozambique by both Global Finance and Euromoney
FX effect excluded. €/Metical constant at June 2018 levels : Income Statement 73.42791667; Balance Sheet 69.1250.
Net income
Operating costs
Banking income
209|0|93
253|217|226
191|191|191
217|217|217
46
209|0|93
253|217|226
191|191|191
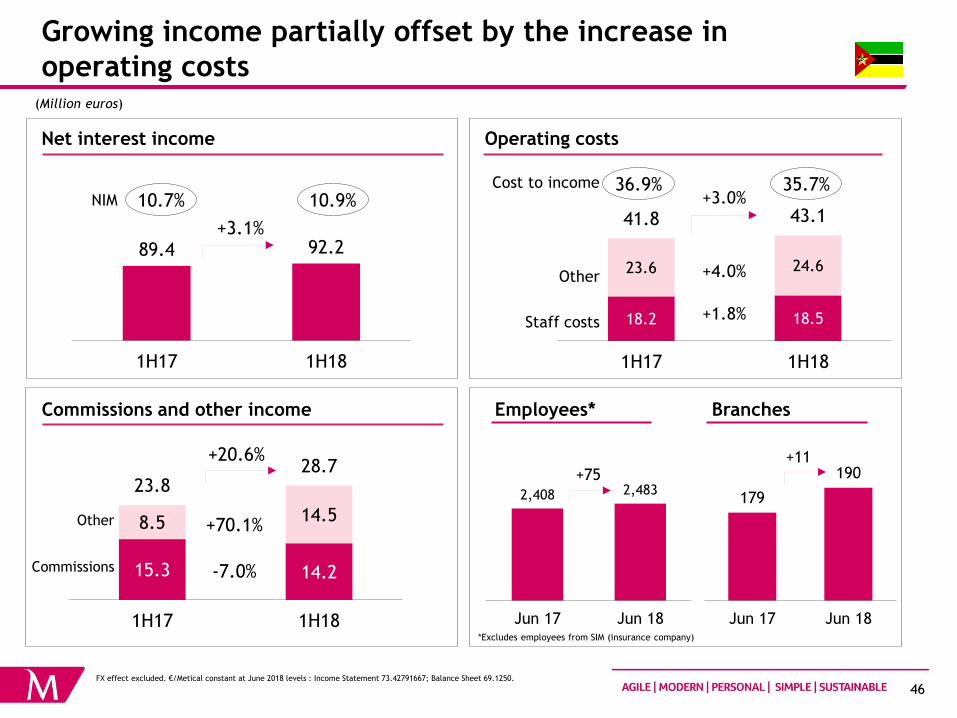
217|217|217 18.2 18.5
23.6 24.6
41.8 43.1
1H17 1H18
2,408 2,483
Jun 17 Jun 18
Growing income partially offset by the increase in
operating costs
+3.0%
(Million euros)
Staff costs
Other
89.4 92.2
1H17 1H18
+3.1%
179
190
Jun 17 Jun 18
+75 +11
Commissions
Other
+1.8%
+4.0%
NIM 10.7% 10.9% Cost to income 36.9% 35.7%
15.3 14.2
8.5 14.5
23.8 28.7
1H17 1H18
+20.6%
-7.0%
+70.1%
FX effect excluded. €/Metical constant at June 2018 levels : Income Statement 73.42791667; Balance Sheet 69.1250.
Net interest income
Commissions and other income
Operating costs
Branches Employees*
*Excludes employees from SIM (insurance company)

209|0|93
253|217|226
191|191|191
217|217|217
47
209|0|93
253|217|226
191|191|191
217|217|217
Credit performance influenced by challenging environment
(Million euros)
NPL>90d ratio of 15.9% as of June 30, 2018,
with coverage by loan-loss reserves of 55%
on the same date
Maintenance of a high provisioning effort,
reflected in a risk cost of 326bp (320bp in
the first half of 2017)
Credit ratio Jun 17 Jun 18
NPL>90d 14.0% 15.9%
104.1 79.9
Jun 17 Jun 18
160.8 145.4
Jun 17 Jun 18
Cost of risk 320bp 326bp
17.3 14.1
1H17 1H18
-18.7%
Coverage ratio Jun 17 Jun 18
NPL>90d 65% 55%
NPL>90d ratio of 15.9% as of June 30, 2018,
with coverage by loan-loss reserves of 55%
on the same date
Maintenance of a high provisioning effort,
reflected in a risk cost of 326bp (320bp in
the first half of 2017)
FX effect excluded. €/Metical constant at June 2018 levels : Income Statement 73.42791667; Balance Sheet 69.1250.
NPL>90d
Loan impairment (net of recoveries)
Loan-loss reserves
209|0|93
253|217|226
191|191|191
217|217|217
48
209|0|93
253|217|226
191|191|191
217|217|217
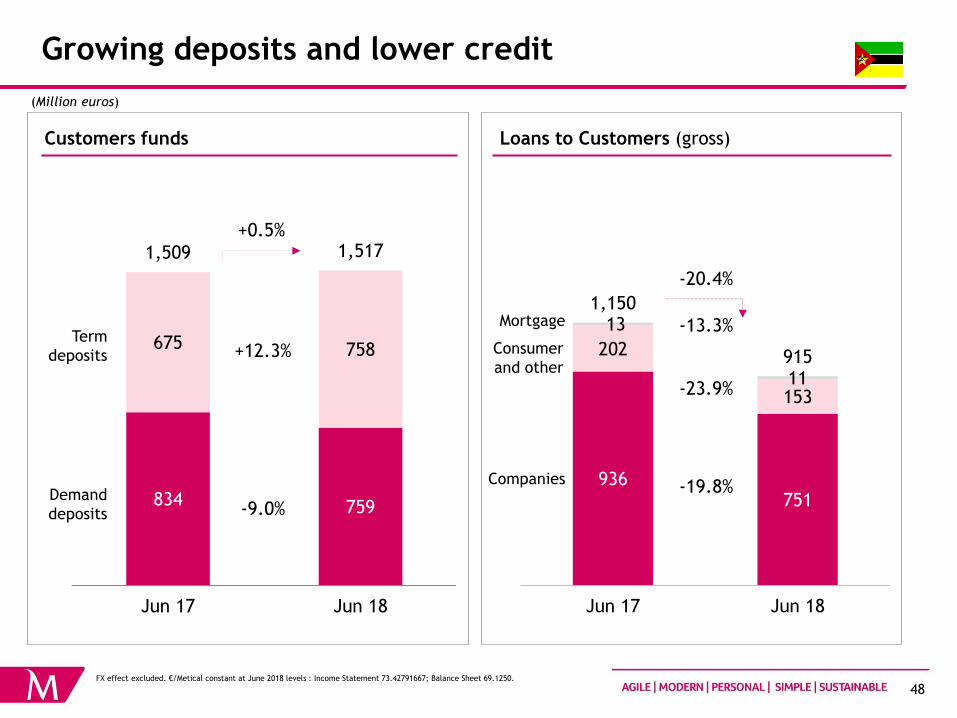
834 759
675 758
1,509 1,517
Jun 17 Jun 18
936 751
202
153
13
11
1,150
915
Jun 17 Jun 18
Growing deposits and lower credit
-20.4%
-23.9%
-19.8%
(Million euros)
Loans to Customers (gross) Customers funds
Companies
Consumer
and other
Mortgage
Demand
deposits
Term
deposits +12.3%
+0.5%
-13.3%
-9.0%
FX effect excluded. €/Metical constant at June 2018 levels : Income Statement 73.42791667; Balance Sheet 69.1250.

209|0|93
253|217|226
191|191|191
217|217|217
49
209|0|93
253|217|226
191|191|191
217|217|217
Agenda
Highlights
Group
• Profitability
• Business activity
• Capital
Portugal
International operations
Key figures

209|0|93
253|217|226
191|191|191
217|217|217
50
209|0|93
253|217|226
191|191|191
217|217|217
Key figures
Consolidated
2018
<75 bp
-€3,0 billion
≈11%
<100%
<50%
≈43%
≈10%
Cost of risk
Cumulative NPE reduction
from January 1, 2016 (Portugal)
CET1 fully implemented
Loans to Deposits
Cost-Core Income1, 2
Cost–Income1
1H17 1H18
118 bp
-€1.9 billion
11.3%
95%
47.0%
45.2%
88 bp
-€3.9 billion
11.7%
88%
47.9%
46.6%
4.3% 6.8% RoE3
1 Excludes non-usual items.
2 Core income = net interest income + net fees and commission income.
3 Based on a fully implemented CET1 of 11%.
209|0|93
253|217|226
191|191|191
217|217|217
51
209|0|93
253|217|226
191|191|191
217|217|217
Agenda
Earnings for the 1st half of 2018
Mobilizing Millennium:
Main guidelines of 2021 strategic plan
209|0|93
253|217|226
191|191|191
217|217|217
52
209|0|93
253|217|226
191|191|191
217|217|217
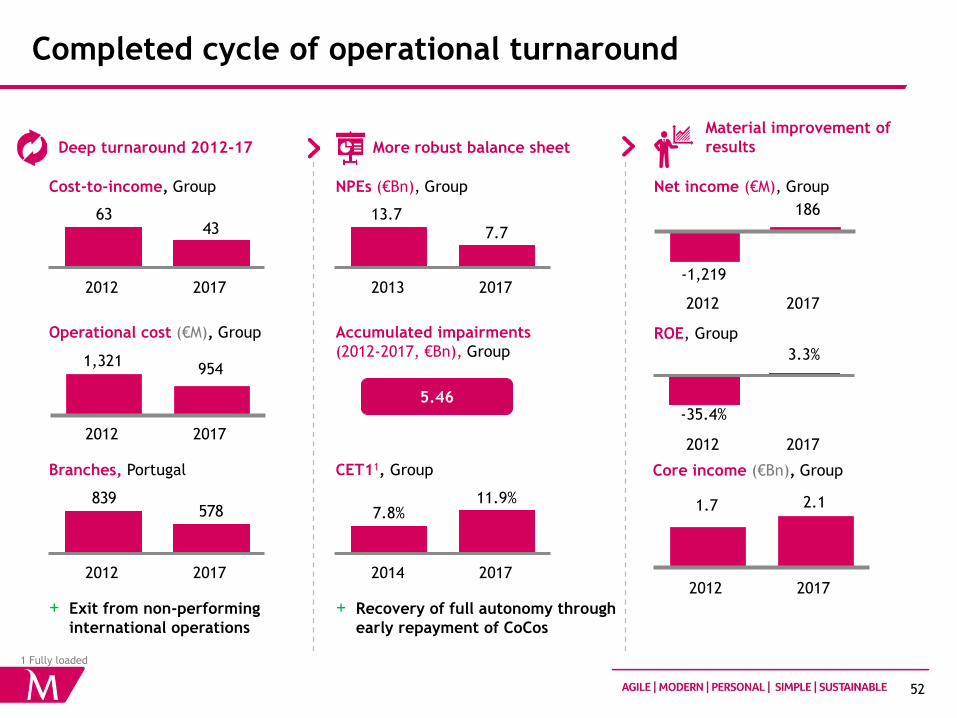
Completed cycle of operational turnaround
More robust balance sheet
4363
2012 2017
Material improvement of
results Deep turnaround 2012-17
Cost-to-income, Group
2017
1,321 954
2012
Operational cost (€M), Group
578839
2017 2012
Branches, Portugal
+ Exit from non-performing
international operations
2017
7.7 13.7
2013
NPEs (€Bn), Group
Accumulated impairments
(2012-2017, €Bn), Group
7.8%
2017 2014
11.9%
CET11, Group
+ Recovery of full autonomy through
early repayment of CoCos
186
-1,219
2017 2012
Net income (€M), Group
2017 2012
3.3%
-35.4%
ROE, Group
1 Fully loaded
5.46
2017
1.7 2.1
2012
Core income (€Bn), Group

209|0|93
253|217|226
191|191|191
217|217|217
53
209|0|93
253|217|226
191|191|191
217|217|217
Prepared to face a challenging future
Millennium’s 2012-17
turnaround based on core
competencies…
… require additional
capabilities…
Competitive
international portfolio
Customer oriented
relationship model
Market leading
efficiency
… new trends in a changing
environment…
Customers increasingly mobile,
impatient and demanding
personalization
Widespread adoption of new
technologies and ways of
working
Reinforced need for governance
mechanisms to reaffirm
compliance with growing
regulation and scrutiny
Reinforced relevance of security
and trust
Potential entry of new players
benefiting from PSD2 environment Robust balance sheet and
rigorous capital allocation
shaped by strong governance
Integration in value chain
and ecosystems
Leading Digital, Mobile and
Analytics capabilities
… complemented with
13%
9%
24% 17%
20%
12%2
2017 Capital ratios1 2017 ROE
1 Total capital ratio; 2 Capital Adequacy Ratio
#1 #3 #1
2017 Cost to income rank
#2 #1 2017 NPS rank

209|0|93
253|217|226
191|191|191
217|217|217
54
209|0|93
253|217|226
191|191|191
217|217|217
Five strategic priorities to launch a new growth cycle
Talent
Mobilization
Business model
sustainability
Mobile-centric
digitization Growth in
international
footprint
Growth and
leadership in Portugal

209|0|93
253|217|226
191|191|191
217|217|217
55
209|0|93
253|217|226
191|191|191
217|217|217
Talent Mobilization
Priorities going forward Strengths
Engagement and commitment
Engagement of the entire organization to proactively
pursue new vision and strategy
Rewards for success
Alignment of compensation with performance and
strategic objectives for all teams
Preparation for the future
Development of capabilities to assume new roles and
use of external hiring where necessary, with clear focus
on productivity and efficiency
Merit-based growth
Access to development opportunities and knowledge for
all employees
• Workforce talent as a
sustained advantage
in the market
• Overall increase in
satisfaction
• Employees proud to
work at Millennium
• Employees currently
satisfied with teams
and their direct
supervisors
New ways of working
Empowerment and simplification of decision making
with wider collaboration and teamwork across the bank
209|0|93
253|217|226
191|191|191
217|217|217
56
209|0|93
253|217|226
191|191|191
217|217|217
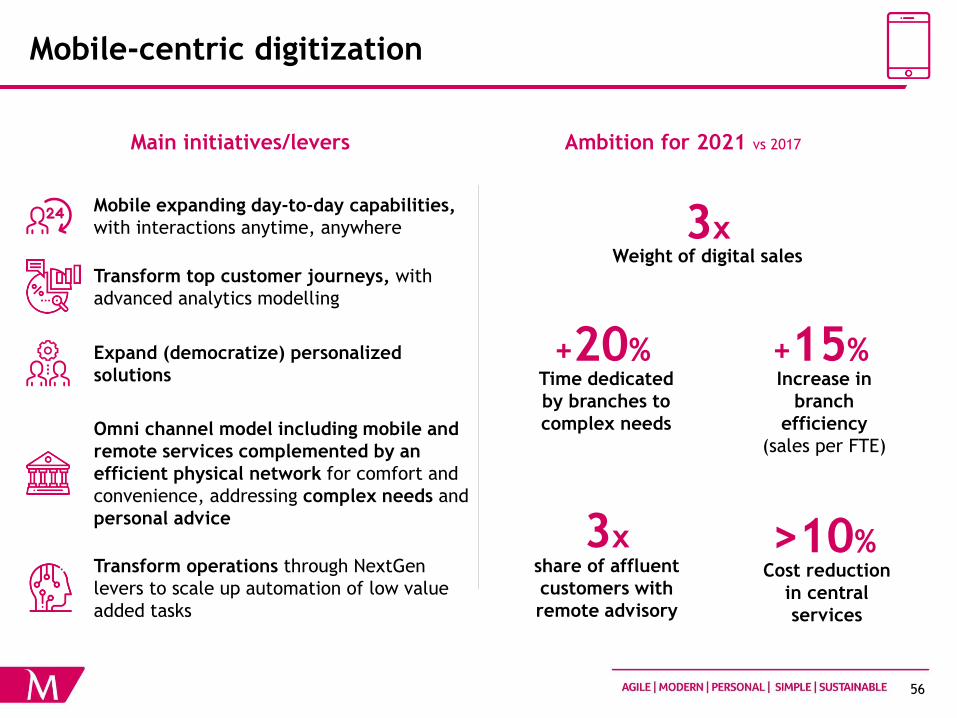
Mobile-centric digitization
Mobile expanding day-to-day capabilities,
with interactions anytime, anywhere
Transform top customer journeys, with
advanced analytics modelling
Omni channel model including mobile and
remote services complemented by an
efficient physical network for comfort and
convenience, addressing complex needs and
personal advice
Transform operations through NextGen
levers to scale up automation of low value
added tasks
Weight of digital sales
3x
Time dedicated
by branches to
complex needs
+20%
share of affluent
customers with
remote advisory
3x
Increase in
branch
efficiency
(sales per FTE)
+15% Expand (democratize) personalized
solutions
Ambition for 2021 vs 2017 Main initiatives/levers
Cost reduction
in central
services
>10%

209|0|93
253|217|226
191|191|191
217|217|217
57
209|0|93
253|217|226
191|191|191
217|217|217
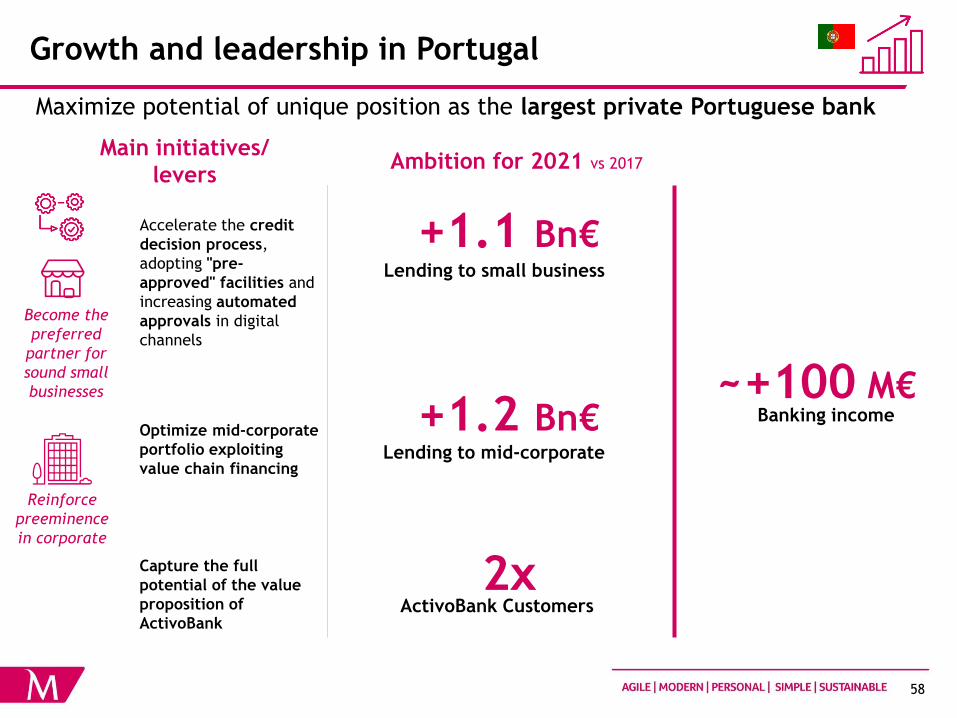
Growth and leadership in Portugal
Maximize potential of unique position as the largest private Portuguese bank
Main initiatives/
levers Ambition for 2021 vs 2017
Simplicity and
convenience
in customer
financing Strengthen market
share in high growth
segments (consumer
lending, affluent and
small business)
Strength mortgage
position redesigning
customer journey and
expanding
distribution reach
+470 M€ Consumer lending new business
+4pp Market share in non-auto
consumer lending
+3pp Market share in mortgage new
business
+1,2 Bn€ Mortgage new business
+51 k New affluent customers
+9pp Share off-balance assets
Innovate the way the
customers save and
invest
~+100 M€ Banking income
209|0|93
253|217|226
191|191|191
217|217|217
58
209|0|93
253|217|226
191|191|191
217|217|217
Growth and leadership in Portugal
Become the
preferred
partner for
sound small
businesses
Reinforce
preeminence
in corporate
Optimize mid-corporate
portfolio exploiting
value chain financing
Capture the full
potential of the value
proposition of
ActivoBank
+1.1 Bn€ Lending to small business
+1.2 Bn€ Lending to mid-corporate
2x ActivoBank Customers
Accelerate the credit
decision process,
adopting "pre-
approved" facilities and
increasing automated
approvals in digital
channels
Maximize potential of unique position as the largest private Portuguese bank
Ambition for 2021 vs 2017
~+100 M€ Banking income
Main initiatives/
levers

209|0|93
253|217|226
191|191|191
217|217|217
59
209|0|93
253|217|226
191|191|191
217|217|217
Growth in international footprint
Capitalize on opportunities in high growth markets where we have competitive
advantages
Expand Customer base in
Poland, capturing full
potential of relationships
Strengthen local
relationships and risk
control in Angola
Support business
sectors across
geographies in
commercial
relationships with
China
Reinforce growth of
Banque Privée in
Switzerland
Pursue sustainable growth
strategy in Mozambique
>3.2 M Active customers
~200 M€ Net income
2021 aspiration
for the
international
footprint

209|0|93
253|217|226
191|191|191
217|217|217
60
209|0|93
253|217|226
191|191|191
217|217|217
Business model sustainability
Pursue low risk retail and commercial banking, innovating in credit
management and monitoring
Strong governance and management framework in
place to ensure plan is delivered
Strictly deliver on NPE plan levers
Streamline credit and risk processes to align with new
lending growth aspirations
Reinforce mechanisms to monitor new loan approvals
and ensure acceptance of sound risk profiles
NPE stock, Bn€
7.7
~3
2017 2021
~60%
NPE reduction
<50bp
Cost of risk
Ambition for 2021
Vis-à-vis 2017
Main levers
Strengthen compliance practices in Portugal and
across geographies

209|0|93
253|217|226
191|191|191
217|217|217
61
209|0|93
253|217|226
191|191|191
217|217|217
Millennium Group’s ambitions for 2021
Consolidated
RoE
Loans to Deposits
Total active Customers
Digital customers
Cost-Income
Mobile customers
≈10%
<100%
>6 million
>60%
≈40%
>45%
≈12% CET1
Dividend payout ≈40%
NPEs stock ≈3 bn€
down by ≈60% from 2017 Asset quality
Franchise
growth
Value
creation
Cost of Risk <50 bps
5.3%
88%
4.8 million
45%
47%
26%
11.7%
--
6.7 bn€
88 bps
1H18 2021
209|0|93
253|217|226
191|191|191
217|217|217
62
209|0|93
253|217|226
191|191|191
217|217|217 Appendix

209|0|93
253|217|226
191|191|191
217|217|217
63
209|0|93
253|217|226
191|191|191
217|217|217
Sovereign debt portfolio
(Million euros)
≤1y 24%
>1y, ≤2y 12%
>2y, ≤5y 26%
>5y, ≤8y 34%
>8y, ≤10y 2%
>10y 2%
The sovereign debt portfolio totalled €11.6 billion, €2.8 billion of which maturing within one
year
The Portuguese sovereign debt portfolio totalled €5.9 billion, whereas the Polish and
Mozambican portfolios amounted to €3.9 billion and to €0.6 billion, respectively; “other”
includes US sovereign debt of €0.8 billion
Sovereign debt maturity Sovereign debt portfolio
Portugal 5,089 4,696 5,938 +17% +26%
T-bills and other 845 499 721 -15% +44%
Bonds 4,244 4,197 5,217 +23% +24%
Poland 3,847 3,981 3,936 +2% -1%
Mozambique 379 553 626 +65% +13%
Other 612 1,068 1,090 +78% +2%
Total 9,928 10,299 11,590 +17% +13%
QoQJun 17 Jun 18 YoYMar 18

209|0|93
253|217|226
191|191|191
217|217|217
64
209|0|93
253|217|226
191|191|191
217|217|217
Sovereign debt portfolio
(Million euros)
*Includes financial assets held for trading at fair value through net income (€33 million).
**Includes financial assets at fair value through other comprehensive income (€10,507 million) and financial assets at amortised cost (€735
million).
Portugal Poland Mozambique Other Total
Trading book* 37 284 0 27 348
≤ 1 year 0 44 0 0 44
> 1 year and ≤ 2 years 33 3 0 26 62
> 2 years and ≤ 5 years 2 196 0 0 199
> 5 years and ≤ 8 years 2 31 0 0 33
> 8 years and ≤ 10 years 0 11 0 0 11
> 10 years 0 0 0 1 1
Banking book** 5,900 3,652 626 1,063 11,242
≤ 1 year 674 765 455 862 2,756
> 1 year and ≤ 2 years 166 1,102 44 0 1,313
> 2 years and ≤ 5 years 1,023 1,669 18 103 2,814
> 5 years and ≤ 8 years 3,842 104 0 2 3,948
> 8 years and ≤ 10 years 7 12 38 96 153
> 10 years 187 0 71 0 259
Total 5,938 3,936 626 1,090 11,590
≤ 1 year 674 809 455 862 2,799
> 1 year and ≤ 2 years 199 1,105 44 26 1,374
> 2 years and ≤ 5 years 1,026 1,865 18 103 3,012
> 5 years and ≤ 8 years 3,844 135 0 2 3,981
> 8 years and ≤ 10 years 8 22 38 96 164
> 10 years 187 0 71 1 260

209|0|93
253|217|226
191|191|191
217|217|217
65
209|0|93
253|217|226
191|191|191
217|217|217
Diversified and collateralised portfolio
Mortgage 46%
Consumer / other 8%
Companies 46%
58% 26% 16%
Real guarantees Other guarantees Unsecured
15% 11% 13% 27% 11% 11% 11%
0-40 40-50 50-60 60-75 75-80 80-90 >90
Loans
Loans to companies accounted for 46% of the loan portfolio at June 30, 2018, including 8% to construction and
real-estate sectors
Mortgage accounted for 46% of the loan portfolio, with low delinquency levels and an average LTV of 66%
84% of the loan portfolio is collateralised
Collaterals
Real estate accounts for 93% of total collateral value
80% of the real estate collateral is residential
Loans per collateral
LTV of the mortgage portfolio in Portugal
Loan portfolio Consolidated
209|0|93
253|217|226
191|191|191
217|217|217
66
209|0|93
253|217|226
191|191|191
217|217|217
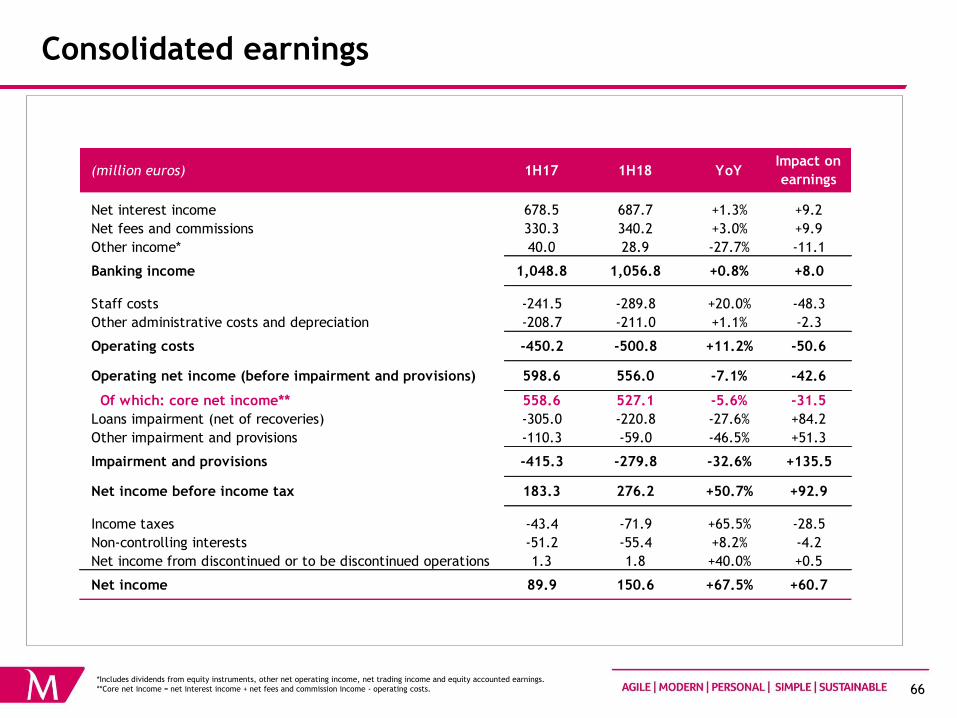
Consolidated earnings
*Includes dividends from equity instruments, other net operating income, net trading income and equity accounted earnings.
**Core net income = net interest income + net fees and commission income - operating costs.
(million euros) 1H17 1H18 YoYImpact on
earnings
Net interest income 678.5 687.7 +1.3% +9.2
Net fees and commissions 330.3 340.2 +3.0% +9.9
Other income* 40.0 28.9 -27.7% -11.1
Banking income 1,048.8 1,056.8 +0.8% +8.0
Staff costs -241.5 -289.8 +20.0% -48.3
Other administrative costs and depreciation -208.7 -211.0 +1.1% -2.3
Operating costs -450.2 -500.8 +11.2% -50.6
Operating net income (before impairment and provisions) 598.6 556.0 -7.1% -42.6
Of which: core net income** 558.6 527.1 -5.6% -31.5
Loans impairment (net of recoveries) -305.0 -220.8 -27.6% +84.2
Other impairment and provisions -110.3 -59.0 -46.5% +51.3
Impairment and provisions -415.3 -279.8 -32.6% +135.5
Net income before income tax 183.3 276.2 +50.7% +92.9
Income taxes -43.4 -71.9 +65.5% -28.5
Non-controlling interests -51.2 -55.4 +8.2% -4.2
Net income from discontinued or to be discontinued operations 1.3 1.8 +40.0% +0.5
Net income 89.9 150.6 +67.5% +60.7
209|0|93
253|217|226
191|191|191
217|217|217
67
209|0|93
253|217|226
191|191|191
217|217|217
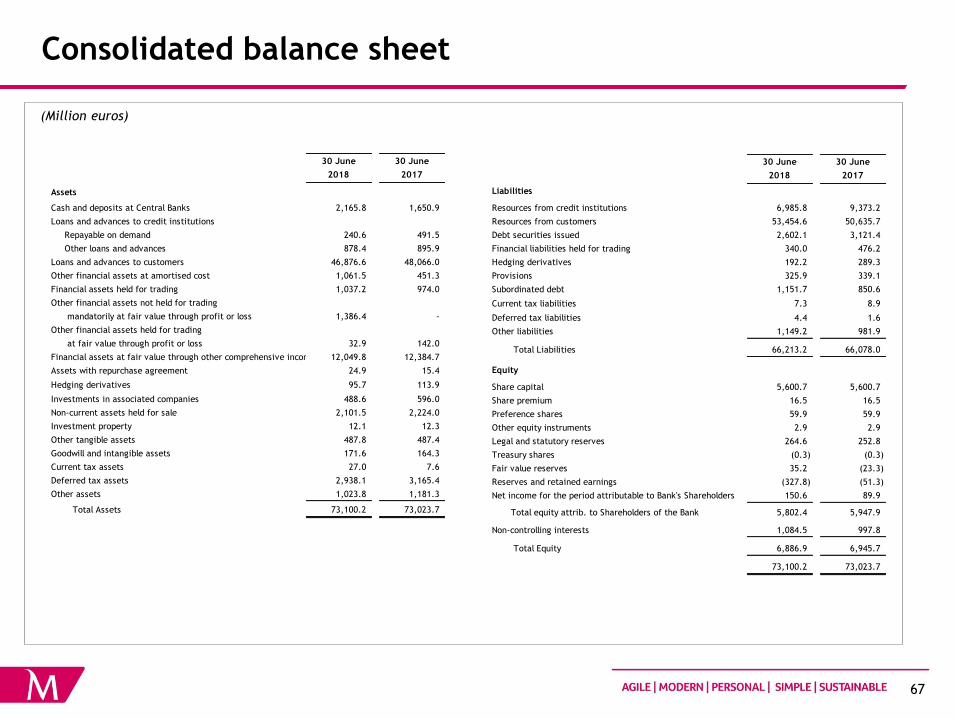
Consolidated balance sheet
(Million euros)
30 June
2018
30 June
2017
Assets
Cash and deposits at Central Banks 2,165.8 1,650.9
Loans and advances to credit institutions
Repayable on demand 240.6 491.5
Other loans and advances 878.4 895.9
Loans and advances to customers 46,876.6 48,066.0
Other financial assets at amortised cost 1,061.5 451.3
Financial assets held for trading 1,037.2 974.0
Other financial assets not held for trading
mandatorily at fair value through profit or loss 1,386.4 -
Other financial assets held for trading
at fair value through profit or loss 32.9 142.0
Financial assets at fair value through other comprehensive income 12,049.8 12,384.7
Assets with repurchase agreement 24.9 15.4
Hedging derivatives 95.7 113.9
Investments in associated companies 488.6 596.0
Non-current assets held for sale 2,101.5 2,224.0
Investment property 12.1 12.3
Other tangible assets 487.8 487.4
Goodwill and intangible assets 171.6 164.3
Current tax assets 27.0 7.6
Deferred tax assets 2,938.1 3,165.4
Other assets 1,023.8 1,181.3
Total Assets 73,100.2 73,023.7
30 June
2018
30 June
2017
Liabilities
Resources from credit institutions 6,985.8 9,373.2
Resources from customers 53,454.6 50,635.7
Debt securities issued 2,602.1 3,121.4
Financial liabilities held for trading 340.0 476.2
Hedging derivatives 192.2 289.3
Provisions 325.9 339.1
Subordinated debt 1,151.7 850.6
Current tax liabilities 7.3 8.9
Deferred tax liabilities 4.4 1.6
Other liabilities 1,149.2 981.9
Total Liabilities 66,213.2 66,078.0
Equity
Share capital 5,600.7 5,600.7
Share premium 16.5 16.5
Preference shares 59.9 59.9
Other equity instruments 2.9 2.9
Legal and statutory reserves 264.6 252.8
Treasury shares (0.3) (0.3)
Fair value reserves 35.2 (23.3)
Reserves and retained earnings (327.8) (51.3)
Net income for the period attributable to Bank's Shareholders 150.6 89.9
Total equity attrib. to Shareholders of the Bank 5,802.4 5,947.9
Non-controlling interests 1,084.5 997.8
Total Equity 6,886.9 6,945.7
73,100.2 73,023.7

209|0|93
253|217|226
191|191|191
217|217|217
68
209|0|93
253|217|226
191|191|191
217|217|217
(Million euros)
Consolidated income statement Per quarter
Net interest income 346.2 344.7 368.1 344.8 342.8
Dividends from equity instruments 1.5 0.1 0.1 0.1 0.6
Net fees and commission income 169.5 164.3 172.1 167.8 172.4
Other operating income -71.4 -10.4 -5.2 -29.1 -61.0
Net trading income 53.5 25.1 33.4 34.4 42.6
Equity accounted earnings 15.5 21.7 34.8 19.8 21.6
Banking income 514.8 545.5 603.2 537.8 519.0
Staff costs 104.6 138.6 146.5 142.3 147.5
Other administrative costs 94.0 92.2 99.3 89.5 93.1
Depreciation 13.4 13.6 13.9 14.2 14.2
Operating costs 211.9 244.4 259.6 246.0 254.8
Operating net income bef. imp. 302.9 301.1 343.6 291.8 264.2
Loans impairment (net of recoveries) 156.1 153.6 165.1 106.1 114.8
Other impairm. and provisions 56.0 59.6 131.2 23.9 35.1
Net income before income tax 90.8 87.9 47.3 161.8 114.3
Income tax 24.3 19.7 -33.0 49.3 22.6
Non-controlling interests 27.9 24.8 27.1 26.9 28.5
Net income (before disc. oper.) 38.6 43.4 53.1 85.6 63.3
Net income arising from discont. operations 1.3 0.0 0.0 0.0 1.8
Net income 39.8 43.4 53.1 85.6 65.1
2Q 17 2Q 181Q 184Q 173Q 17
209|0|93
253|217|226
191|191|191
217|217|217
69
209|0|93
253|217|226
191|191|191
217|217|217
(Million euros)
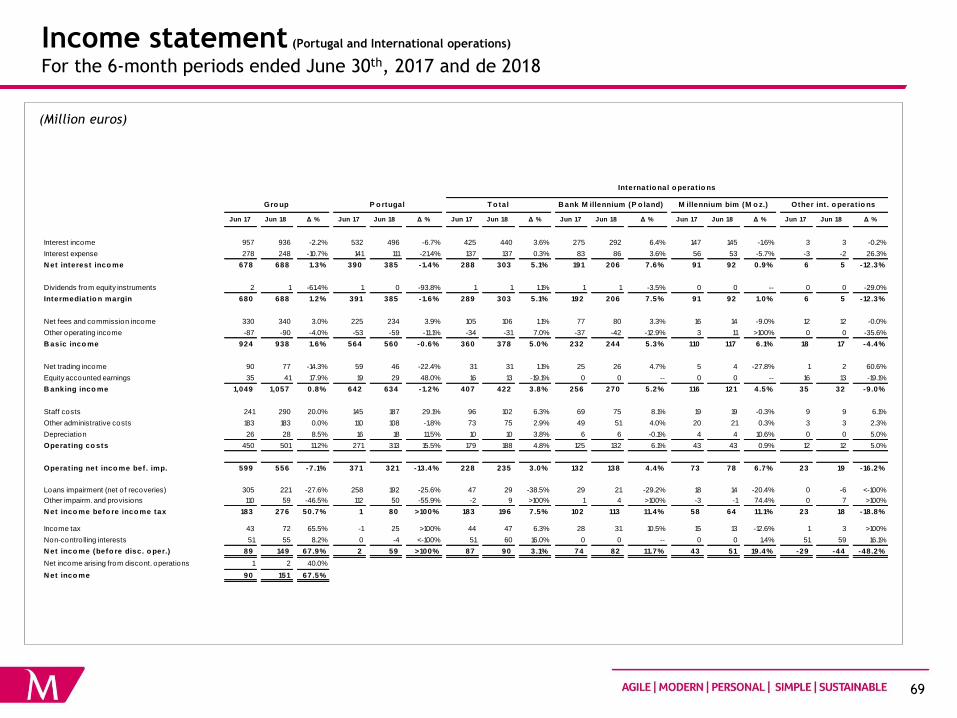
Jun 17 Jun 18 Δ % Jun 17 Jun 18 Δ % Jun 17 Jun 18 Δ % Jun 17 Jun 18 Δ % Jun 17 Jun 18 Δ % Jun 17 Jun 18 Δ %
Interest income 957 936 -2.2% 532 496 -6.7% 425 440 3.6% 275 292 6.4% 147 145 -1.6% 3 3 -0.2%
Interest expense 278 248 -10.7% 141 111 -21.4% 137 137 0.3% 83 86 3.6% 56 53 -5.7% -3 -2 26.3%
N et interest inco me 678 688 1.3% 390 385 -1.4% 288 303 5.1% 191 206 7.6% 91 92 0.9% 6 5 -12.3%
Dividends from equity instruments 2 1 -61.4% 1 0 -93.8% 1 1 1.1% 1 1 -3.5% 0 0 -- 0 0 -29.0%
Intermediat io n margin 680 688 1.2% 391 385 -1.6% 289 303 5.1% 192 206 7.5% 91 92 1.0% 6 5 -12.3%
Net fees and commission income 330 340 3.0% 225 234 3.9% 105 106 1.1% 77 80 3.3% 16 14 -9.0% 12 12 -0.0%
Other operating income -87 -90 -4.0% -53 -59 -11.1% -34 -31 7.0% -37 -42 -12.9% 3 11 >100% 0 0 -35.6%
B asic inco me 924 938 1.6% 564 560 -0.6% 360 378 5.0% 232 244 5.3% 110 117 6.1% 18 17 -4.4%
Net trading income 90 77 -14.3% 59 46 -22.4% 31 31 1.1% 25 26 4.7% 5 4 -27.8% 1 2 60.6%
Equity accounted earnings 35 41 17.9% 19 29 48.0% 16 13 -19.1% 0 0 -- 0 0 -- 16 13 -19.1%
B anking inco me 1,049 1,057 0.8% 642 634 -1.2% 407 422 3.8% 256 270 5.2% 116 121 4.5% 35 32 -9.0%
Staff costs 241 290 20.0% 145 187 29.1% 96 102 6.3% 69 75 8.1% 19 19 -0.3% 9 9 6.1%
Other administrative costs 183 183 0.0% 110 108 -1.8% 73 75 2.9% 49 51 4.0% 20 21 0.3% 3 3 2.3%
Depreciation 26 28 8.5% 16 18 11.5% 10 10 3.8% 6 6 -0.1% 4 4 10.6% 0 0 5.0%
Operat ing co sts 450 501 11.2% 271 313 15.5% 179 188 4.8% 125 132 6.1% 43 43 0.9% 12 12 5.0%
Operat ing net inco me bef . imp. 599 556 -7.1% 371 321 -13.4% 228 235 3.0% 132 138 4.4% 73 78 6.7% 23 19 -16.2%
Loans impairment (net of recoveries) 305 221 -27.6% 258 192 -25.6% 47 29 -38.5% 29 21 -29.2% 18 14 -20.4% 0 -6 <-100%
Other impairm. and provisions 110 59 -46.5% 112 50 -55.9% -2 9 >100% 1 4 >100% -3 -1 74.4% 0 7 >100%
N et inco me befo re inco me tax 183 276 50.7% 1 80 >100% 183 196 7.5% 102 113 11.4% 58 64 11.1% 23 18 -18.8%
Income tax 43 72 65.5% -1 25 >100% 44 47 6.3% 28 31 10.5% 15 13 -12.6% 1 3 >100%
Non-contro lling interests 51 55 8.2% 0 -4 <-100% 51 60 16.0% 0 0 -- 0 0 1.4% 51 59 16.1%
N et inco me (befo re disc. o per.) 89 149 67.9% 2 59 >100% 87 90 3.1% 74 82 11.7% 43 51 19.4% -29 -44 -48.2%
Net income arising from discont. operations 1 2 40.0%
N et inco me 90 151 67.5%
M illennium bim (M o z.)
Internat io nal o perat io ns
Gro up P o rtugal T o tal B ank M illennium (P o land) Other int . o perat io ns
Income statement (Portugal and International operations)
For the 6-month periods ended June 30th, 2017 and de 2018

209|0|93
253|217|226
191|191|191
217|217|217
70
209|0|93
253|217|226
191|191|191
217|217|217
Glossary (1/2)
Balance sheet impairment – Balance sheet impairment related to amortised cost and fair value adjustments related to loans to customers at fair value
through profit or loss.
Balance sheet customer funds - debt securities and customer deposits.
Commercial gap –loans to customers (gross) minus on-balance sheet customer funds.
Core income - net interest income plus net fees and commissions income.
Core net income - corresponding to net interest income plus net fees and commissions income deducted from operating costs.
Cost of risk, net (expressed in bp) - ratio of impairment charges (net of recoveries) accounted in the period to loans to customers at amortised cost before
impairment.
Cost to core income - operating costs divided by core income (net interest income and net fees and commissions income).
Cost to income – operating costs divided by net operating revenues.
Coverage of non-performing loans by balance sheet impairments – BS impairments divided by the stock of NPL.
Coverage of non-performing exposures by balance sheet impairments – BS impairments divided by the stock of NPE.
Debt securities - debt securities issued by the Bank and placed with customers.
Dividends from equity instruments - dividends received from investments classified as financial assets at fair value through other comprehensive income and
from financial assets held for trading.
Equity accounted earnings - results appropriated by the Group related to the consolidation of entities where, despite having a significant influence, the
Group does not control the financial and operational policies.
Insurance products – includes unit linked saving products and retirement saving plans (“PPR”, “PPE” and “PPR/E”).
Loans to customers (gross) – Loans to customers at amortised cost before impairment and loans to customers at fair value through profit or loss before fair
value adjustments.
Loans to customers (net) - Loans to customers at amortised cost net of impairment and balance sheet amount of loans to customers at fair value through
profit or loss.
Loan to Deposits ratio (LTD) – Loans to customers (net) divided by total customer deposits.
Loan to value ratio (LTV) – Mortgage amount divided by the appraised value of property.
Net commissions - net fees and commissions income.
Net interest margin (NIM) - net interest income for the period as a percentage of average interest earning assets.
Net operating revenues - net interest income, dividends from equity instruments, net commissions, net trading income, equity accounted earnings and other
net operating income.
Net trading income - net gains/losses arising from trading and hedging activities, net gains/losses arising from financial assets at fair value through other
comprehensive income and financial assets at amortised cost.
Non-performing exposures (NPE, according to EBA definition) – Non-performing loans and advances to customers more than 90 days past-due or unlikely to
be paid without collateral realisation, even if they recognised as defaulted or impaired.
Non-performing loans (NPL) – Overdue loans more than 90 days including the non-overdue remaining principal of loans, i.e. portion in arrears, plus non-
overdue remaining principal.
209|0|93
253|217|226
191|191|191
217|217|217
71
209|0|93
253|217|226
191|191|191
217|217|217
Glossary (2/2)
Operating costs - staff costs, other administrative costs and depreciation.
Other impairment and provisions - other financial assets impairment, other assets impairment, in particular provision charges related to assets received as
payment in kind not fully covered by collateral, goodwill impairment and other provisions.
Other net income – net commissions, net trading income, other net operating income, dividends from equity instruments and equity accounted earnings.
Other net operating income – net gains from insurance activity, other operating income/(loss) and gains/(losses) arising from sales of subsidiaries and other
assets.
Overdue loans - loans in arrears, including principal and interests.
Overdue loans by more than 90 days coverage ratio - BS impairments divided by total amount of overdue loans including installments of capital and interest
overdue more than 90 days.
Overdue loans coverage ratio – BS impairments divided by total amount of overdue loans including installments of capital and interest overdue.
Return on average assets (Instruction from the Bank of Portugal no. 16/2004) – Net income (before tax) divided by the average total assets.
Return on average assets (ROA) – Net income (before minority interests) divided by the average total assets.
Return on equity (Instruction from the Bank of Portugal no. 16/2004) – Net income (before tax) divided by the average attributable equity + non-
controlling interests.
Return on equity (ROE) – Net income (after minority interests) divided by the average attributable equity, deducted from preference shares and other
capital instruments.
Securities portfolio - financial assets held for trading, financial assets not held for trading mandatorily at fair value through profit or loss, financial assets at
fair value through other comprehensive income, assets with repurchase agreement, other financial assets at amortised cost and other financial assets
held for trading at fair value through profit or loss.
Spread - increase (in percentage points) to the index used by the Bank in loans granting or fund raising.
Total customer funds - balance sheet customer funds, assets under management, assets placed with customers and investment funds.
209|0|93
253|217|226
191|191|191
217|217|217
72
209|0|93
253|217|226
191|191|191
217|217|217