Embed Size (px)
Citation preview

BEING GLOBAL 1ST HALF 2013 RESULTS AUGUST 2013
1H2013 RESULTS AUGUST 2013
MANAGEMENT ANALYSIS APPENDICES
HIGHLIGHTS
1H2013 RESULTS AUGUST 2013
HIGHLIGHTS MANAGEMENT ANALYSIS APPENDICES
• Operating Revenues of 289 M€ increasing by 18.5 % YoY, reflecting the significant improvement
in volume of the core business area Solar
• EBITDA of 2.3 M€ (versus 21.2 M€ in 1H 2012), reflecting mostly a negative performance of the
metallic constructions business area
• Net consolidated Profit of -48.7 M€
• Total Order Book of 428 M€: Metallic Construction (248 M€) and Solar (180 M€)
• Total Net Consolidated Debt of 380 M€, approx. 3 M€ above the FY 2012, mostly due to the
CAPEX of 9 M€ and investment in Working Capital
• Extended Debt maturity, from ST to MLT (7yr.) of 97 M€ at the holding level.
• In July 2013, Martifer sold part of the share capital of its subsidiary PRIO ENERGY, SGPS, SA
to the company OxyCapital - Sociedade de Capital de Risco, S.A., reducing its participation from
49 % to 10 %. This operation will allow the Martifer Group a reduction in its debt in around 31.2
M€ in the 2H 2013
page 3
HIGHLIGHTS
1H2013 RESULTS AUGUST 2013
APPENDICES
MANAGEMENT
ANALYSIS
HIGHLIGHTS MANAGEMENT ANALYSIS APPENDICES
1H2013 RESULTS AUGUST 2013
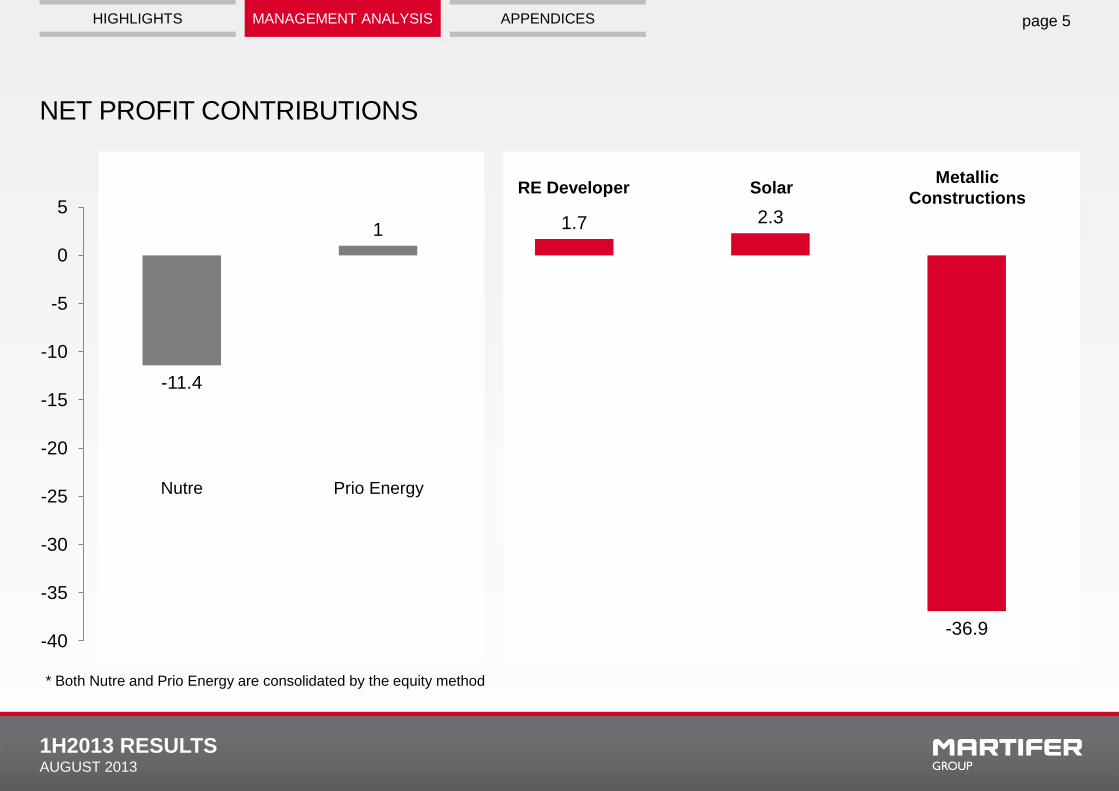
NET PROFIT CONTRIBUTIONS
* Both Nutre and Prio Energy are consolidated by the equity method
page 5
RE Developer Solar
Prio Energy Nutre
Metallic
Constructions
-11.4
1 1.7 2.3
-36.9 -40
-35
-30
-25
-20
-15
-10
-5
0
5
HIGHLIGHTS MANAGEMENT ANALYSIS APPENDICES
1H2013 RESULTS AUGUST 2013
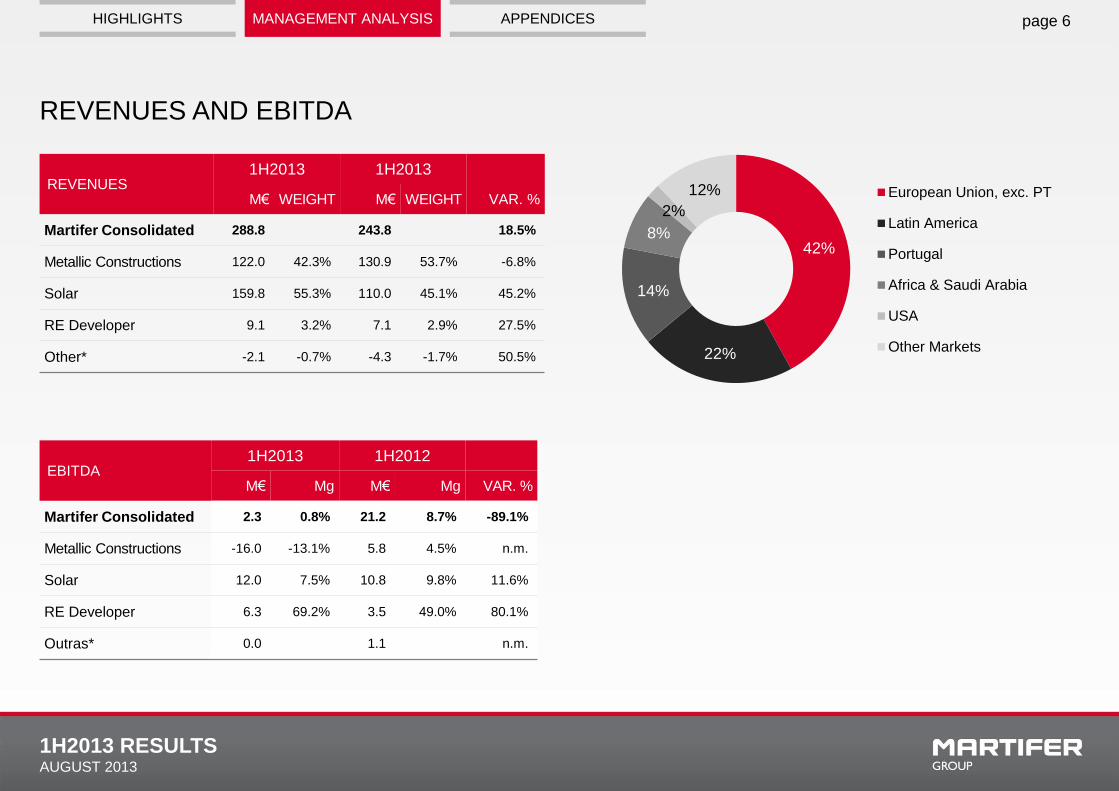
REVENUES AND EBITDA
page 6
REVENUES 1H2013 1H2013
M€ WEIGHT M€ WEIGHT VAR. %
Martifer Consolidated 288.8 243.8 18.5%
Metallic Constructions 122.0 42.3% 130.9 53.7% -6.8%
Solar 159.8 55.3% 110.0 45.1% 45.2%
RE Developer 9.1 3.2% 7.1 2.9% 27.5%
Other* -2.1 -0.7% -4.3 -1.7% 50.5%
EBITDA 1H2013 1H2012
M€ Mg M€ Mg VAR. %
Martifer Consolidated 2.3 0.8% 21.2 8.7% -89.1%
Metallic Constructions -16.0 -13.1% 5.8 4.5% n.m.
Solar 12.0 7.5% 10.8 9.8% 11.6%
RE Developer 6.3 69.2% 3.5 49.0% 80.1%
Outras* 0.0 1.1 n.m.
42%
22%
14%
8%
2%
12% European Union, exc. PT
Latin America
Portugal
Africa & Saudi Arabia
USA
Other Markets
HIGHLIGHTS MANAGEMENT ANALYSIS APPENDICES
1H2013 RESULTS AUGUST 2013
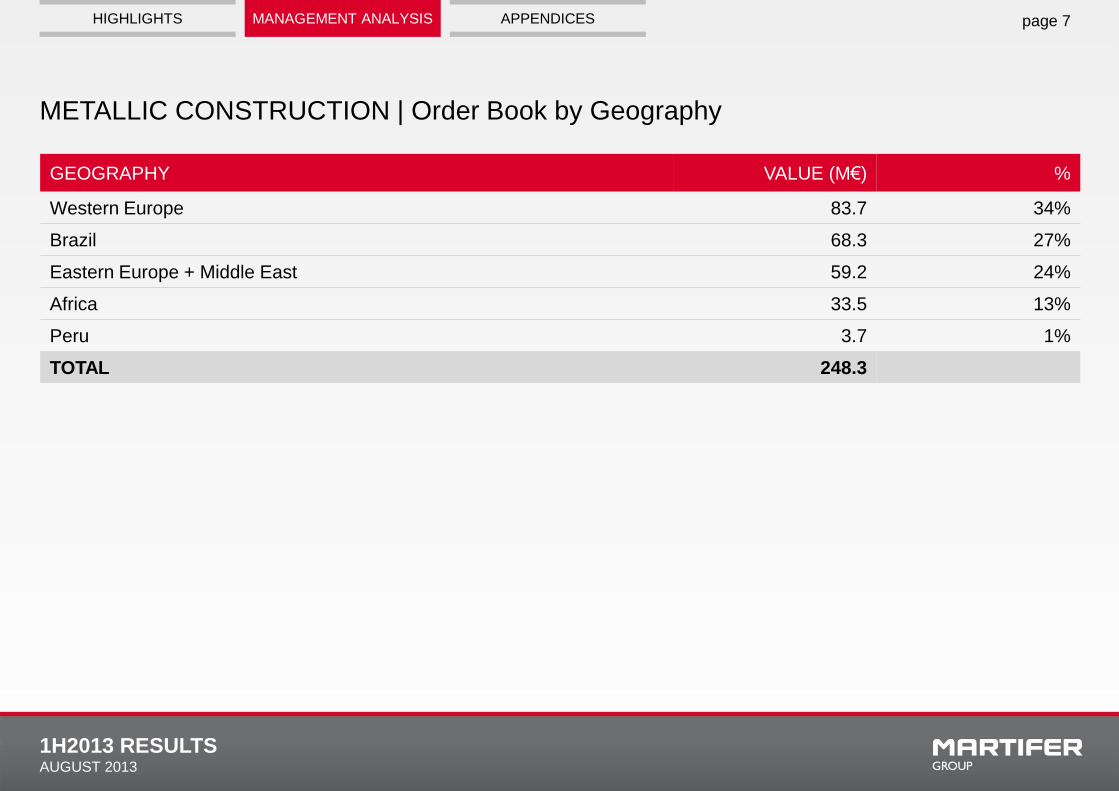
METALLIC CONSTRUCTION | Order Book by Geography
page 7
GEOGRAPHY VALUE (M€) %
Western Europe 83.7 34%
Brazil 68.3 27%
Eastern Europe + Middle East 59.2 24%
Africa 33.5 13%
Peru 3.7 1%
TOTAL 248.3
HIGHLIGHTS MANAGEMENT ANALYSIS APPENDICES
1H2013 RESULTS AUGUST 2013
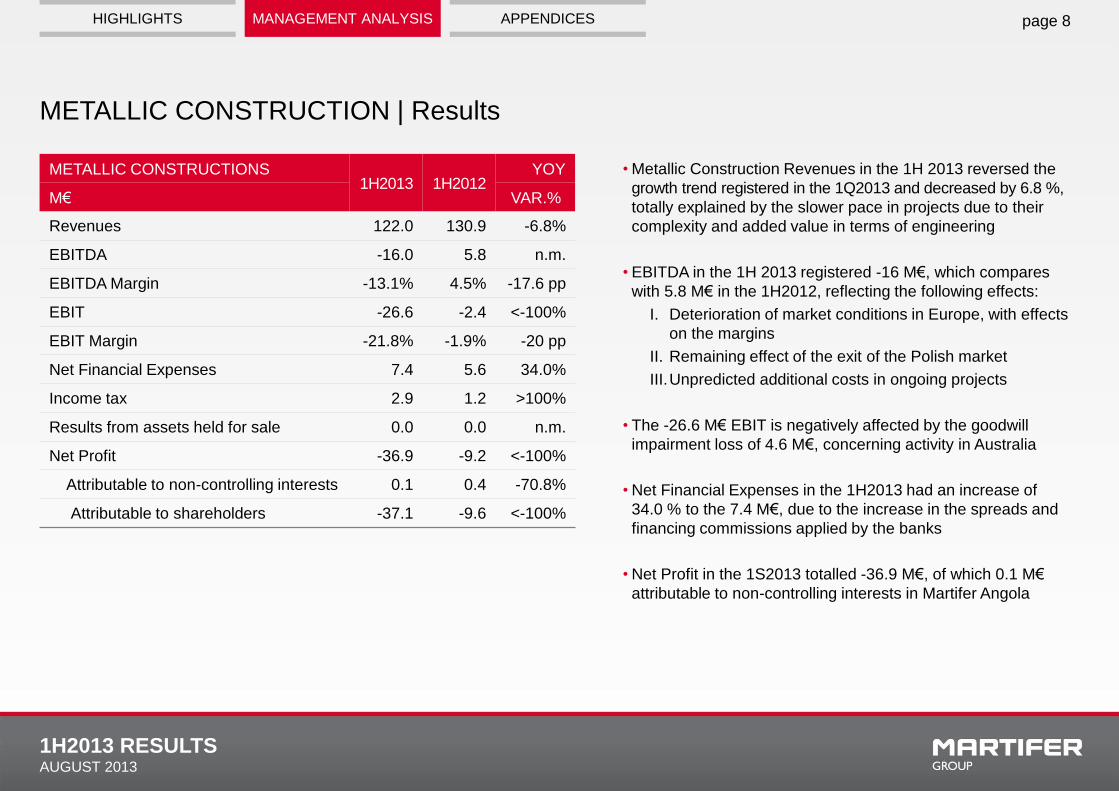
METALLIC CONSTRUCTION | Results
page 8
METALLIC CONSTRUCTIONS 1H2013 1H2012
YOY
M€ VAR.%
Revenues 122.0 130.9 -6.8%
EBITDA -16.0 5.8 n.m.
EBITDA Margin -13.1% 4.5% -17.6 pp
EBIT -26.6 -2.4 <-100%
EBIT Margin -21.8% -1.9% -20 pp
Net Financial Expenses 7.4 5.6 34.0%
Income tax 2.9 1.2 >100%
Results from assets held for sale 0.0 0.0 n.m.
Net Profit -36.9 -9.2 <-100%
Attributable to non-controlling interests 0.1 0.4 -70.8%
Attributable to shareholders -37.1 -9.6 <-100%
• Metallic Construction Revenues in the 1H 2013 reversed the
growth trend registered in the 1Q2013 and decreased by 6.8 %,
totally explained by the slower pace in projects due to their
complexity and added value in terms of engineering
• EBITDA in the 1H 2013 registered -16 M€, which compares
with 5.8 M€ in the 1H2012, reflecting the following effects:
I. Deterioration of market conditions in Europe, with effects
on the margins
II. Remaining effect of the exit of the Polish market
III.Unpredicted additional costs in ongoing projects
• The -26.6 M€ EBIT is negatively affected by the goodwill
impairment loss of 4.6 M€, concerning activity in Australia
• Net Financial Expenses in the 1H2013 had an increase of
34.0 % to the 7.4 M€, due to the increase in the spreads and
financing commissions applied by the banks
• Net Profit in the 1S2013 totalled -36.9 M€, of which 0.1 M€
attributable to non-controlling interests in Martifer Angola
HIGHLIGHTS MANAGEMENT ANALYSIS APPENDICES
1H2013 RESULTS AUGUST 2013
SOLAR | Results
page 9
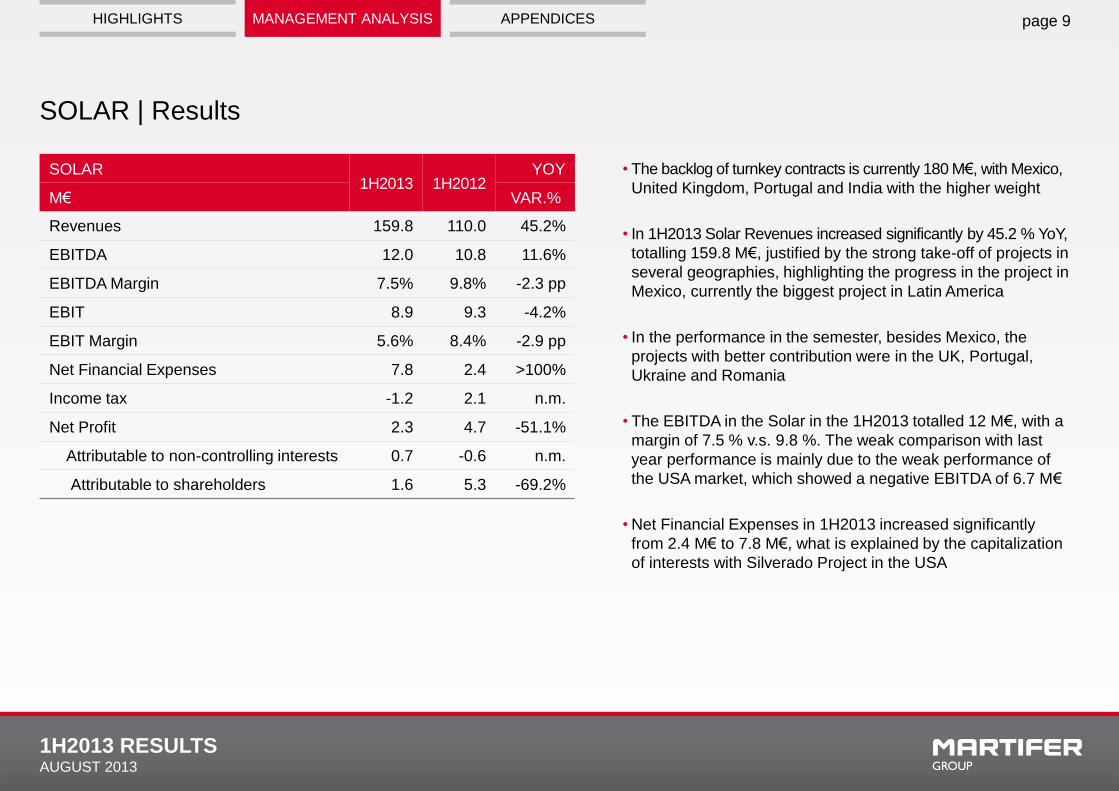
• The backlog of turnkey contracts is currently 180 M€, with Mexico,
United Kingdom, Portugal and India with the higher weight
• In 1H2013 Solar Revenues increased significantly by 45.2 % YoY,
totalling 159.8 M€, justified by the strong take-off of projects in
several geographies, highlighting the progress in the project in
Mexico, currently the biggest project in Latin America
• In the performance in the semester, besides Mexico, the
projects with better contribution were in the UK, Portugal,
Ukraine and Romania
• The EBITDA in the Solar in the 1H2013 totalled 12 M€, with a
margin of 7.5 % v.s. 9.8 %. The weak comparison with last
year performance is mainly due to the weak performance of
the USA market, which showed a negative EBITDA of 6.7 M€
• Net Financial Expenses in 1H2013 increased significantly
from 2.4 M€ to 7.8 M€, what is explained by the capitalization
of interests with Silverado Project in the USA
SOLAR 1H2013 1H2012
YOY
M€ VAR.%
Revenues 159.8 110.0 45.2%
EBITDA 12.0 10.8 11.6%
EBITDA Margin 7.5% 9.8% -2.3 pp
EBIT 8.9 9.3 -4.2%
EBIT Margin 5.6% 8.4% -2.9 pp
Net Financial Expenses 7.8 2.4 >100%
Income tax -1.2 2.1 n.m.
Net Profit 2.3 4.7 -51.1%
Attributable to non-controlling interests 0.7 -0.6 n.m.
Attributable to shareholders 1.6 5.3 -69.2%
HIGHLIGHTS MANAGEMENT ANALYSIS APPENDICES
1H2013 RESULTS AUGUST 2013
RE DEVELOPER | Results
page 10
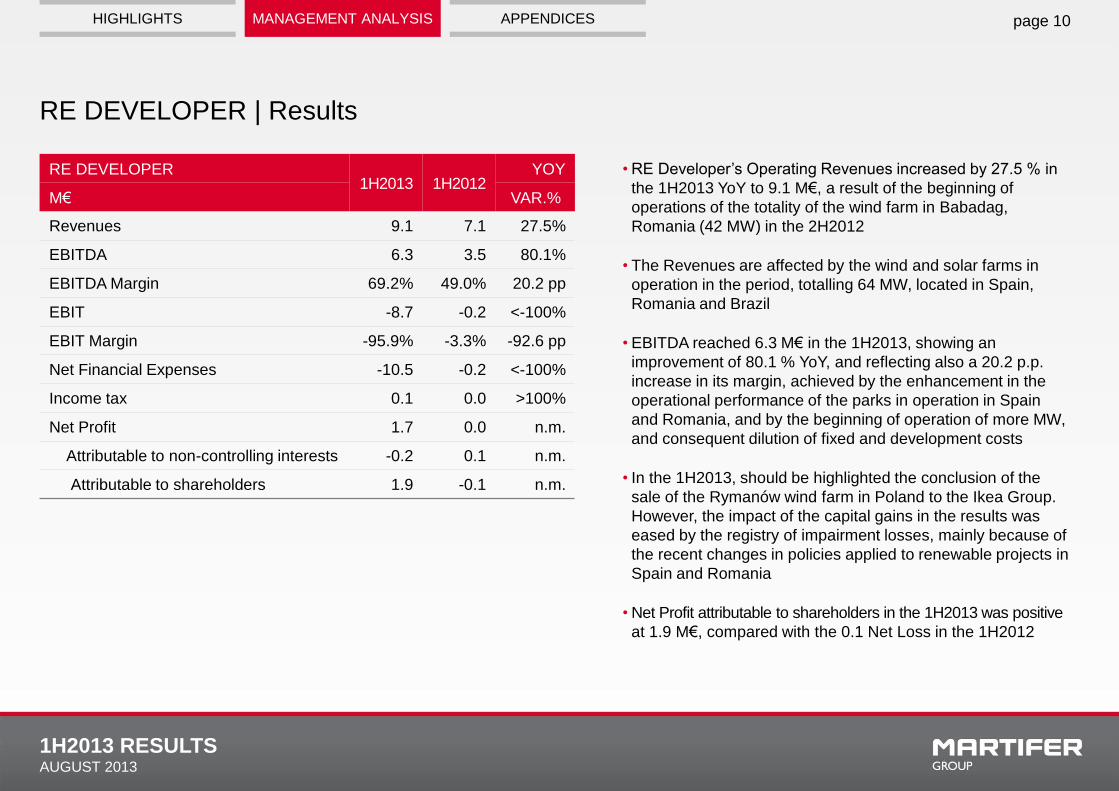
• RE Developer’s Operating Revenues increased by 27.5 % in
the 1H2013 YoY to 9.1 M€, a result of the beginning of
operations of the totality of the wind farm in Babadag,
Romania (42 MW) in the 2H2012
• The Revenues are affected by the wind and solar farms in
operation in the period, totalling 64 MW, located in Spain,
Romania and Brazil
• EBITDA reached 6.3 M€ in the 1H2013, showing an
improvement of 80.1 % YoY, and reflecting also a 20.2 p.p.
increase in its margin, achieved by the enhancement in the
operational performance of the parks in operation in Spain
and Romania, and by the beginning of operation of more MW,
and consequent dilution of fixed and development costs
• In the 1H2013, should be highlighted the conclusion of the
sale of the Rymanów wind farm in Poland to the Ikea Group.
However, the impact of the capital gains in the results was
eased by the registry of impairment losses, mainly because of
the recent changes in policies applied to renewable projects in
Spain and Romania
• Net Profit attributable to shareholders in the 1H2013 was positive
at 1.9 M€, compared with the 0.1 Net Loss in the 1H2012
RE DEVELOPER 1H2013 1H2012
YOY
M€ VAR.%
Revenues 9.1 7.1 27.5%
EBITDA 6.3 3.5 80.1%
EBITDA Margin 69.2% 49.0% 20.2 pp
EBIT -8.7 -0.2 <-100%
EBIT Margin -95.9% -3.3% -92.6 pp
Net Financial Expenses -10.5 -0.2 <-100%
Income tax 0.1 0.0 >100%
Net Profit 1.7 0.0 n.m.
Attributable to non-controlling interests -0.2 0.1 n.m.
Attributable to shareholders 1.9 -0.1 n.m.
HIGHLIGHTS MANAGEMENT ANALYSIS APPENDICES
1H2013 RESULTS AUGUST 2013
OTHER SUBSIDIARIES
page 11
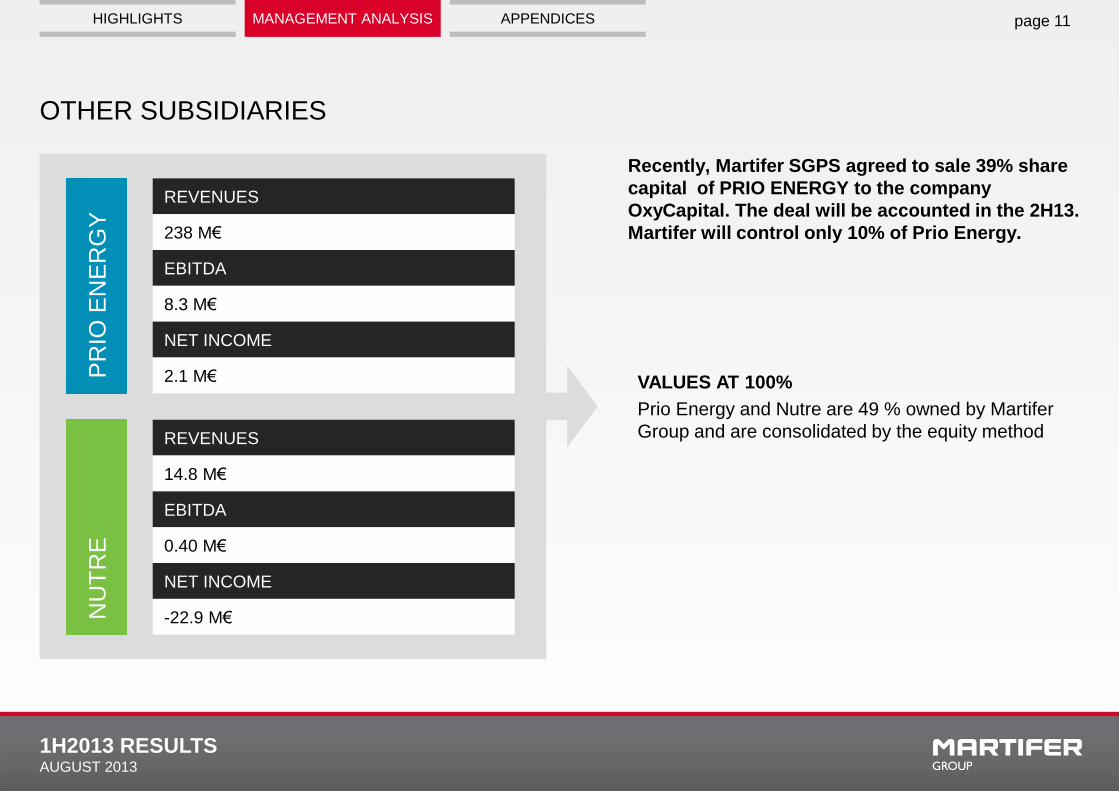
REVENUES
238 M€
EBITDA
8.3 M€
NET INCOME
2.1 M€ PR
IO E
NE
RG
Y
NU
TR
E
REVENUES
14.8 M€
EBITDA
0.40 M€
NET INCOME
-22.9 M€
VALUES AT 100%
Prio Energy and Nutre are 49 % owned by Martifer
Group and are consolidated by the equity method
Recently, Martifer SGPS agreed to sale 39% share
capital of PRIO ENERGY to the company
OxyCapital. The deal will be accounted in the 2H13.
Martifer will control only 10% of Prio Energy.
HIGHLIGHTS MANAGEMENT ANALYSIS APPENDICES
1H2013 RESULTS AUGUST 2013
DÍVIDA LÍQUIDA
page 12
€M METALLIC
CONSTRUCTION SOLAR
RE
DEVELOPER HOLDING
MARTIFER
CONSOLIDATED
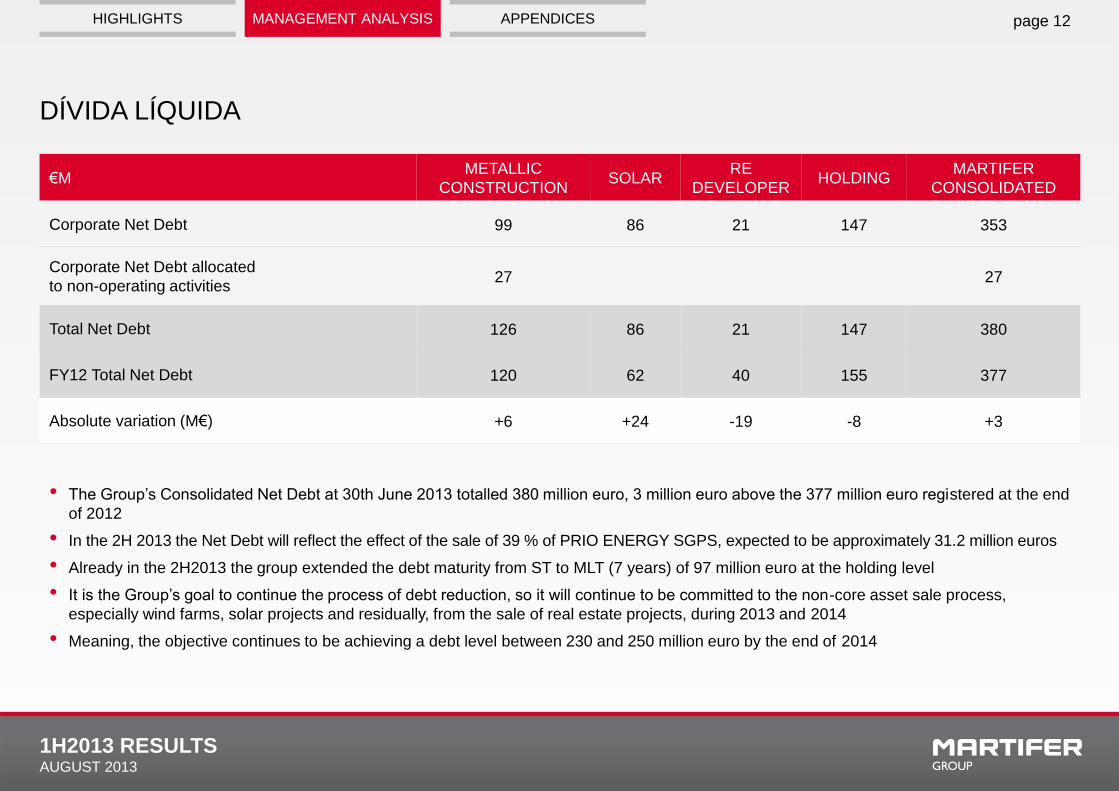
Corporate Net Debt 99 86 21 147 353
Corporate Net Debt allocated
to non-operating activities 27 27
Total Net Debt 126 86 21 147 380
FY12 Total Net Debt 120 62 40 155 377
Absolute variation (M€) +6 +24 -19 -8 +3
• The Group’s Consolidated Net Debt at 30th June 2013 totalled 380 million euro, 3 million euro above the 377 million euro registered at the end
of 2012
• In the 2H 2013 the Net Debt will reflect the effect of the sale of 39 % of PRIO ENERGY SGPS, expected to be approximately 31.2 million euros
• Already in the 2H2013 the group extended the debt maturity from ST to MLT (7 years) of 97 million euro at the holding level
• It is the Group’s goal to continue the process of debt reduction, so it will continue to be committed to the non-core asset sale process,
especially wind farms, solar projects and residually, from the sale of real estate projects, during 2013 and 2014
• Meaning, the objective continues to be achieving a debt level between 230 and 250 million euro by the end of 2014
HIGHLIGHTS MANAGEMENT ANALYSIS APPENDICES
1H2013 RESULTS AUGUST 2013
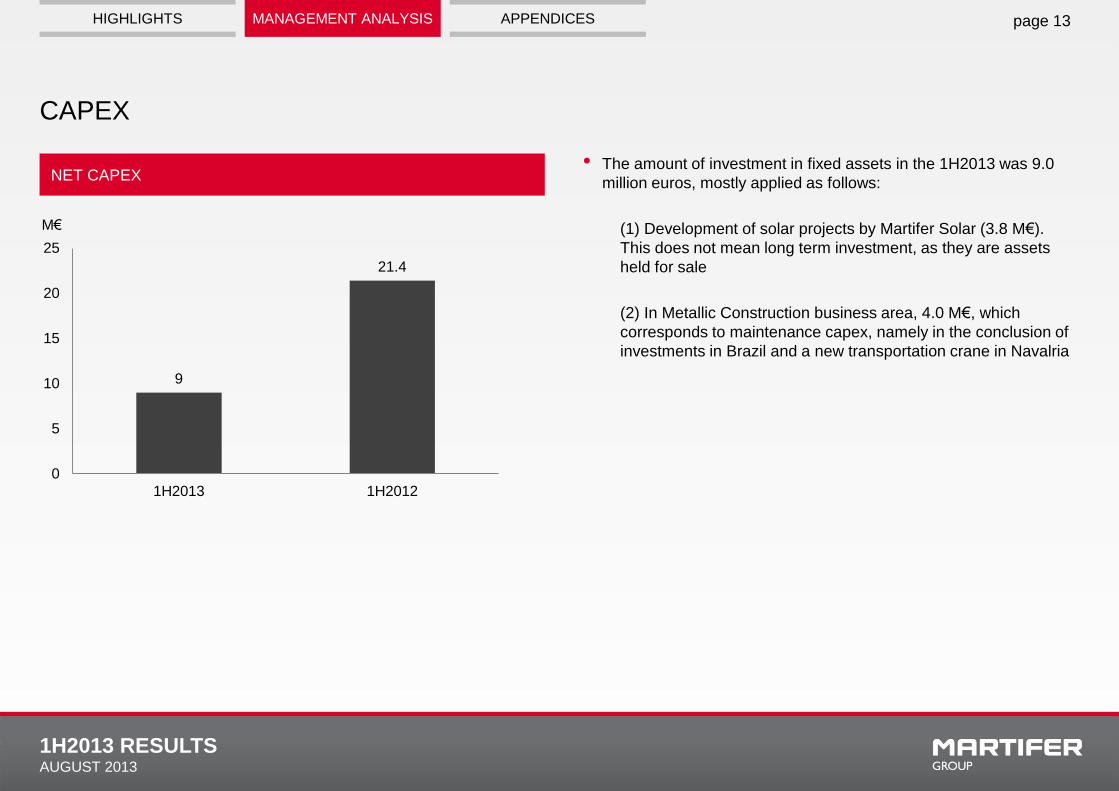
CAPEX
page 13
NET CAPEX • The amount of investment in fixed assets in the 1H2013 was 9.0
million euros, mostly applied as follows:
(1) Development of solar projects by Martifer Solar (3.8 M€).
This does not mean long term investment, as they are assets
held for sale
(2) In Metallic Construction business area, 4.0 M€, which
corresponds to maintenance capex, namely in the conclusion of
investments in Brazil and a new transportation crane in Navalria
M€
9
21.4
0
5
10
15
20
25
1H2013 1H2012
HIGHLIGHTS MANAGEMENT ANALYSIS
1H2013 RESULTS AUGUST 2013
APPENDICES
1H2013 RESULTS AUGUST 2013
HIGHLIGHTS MANAGEMENT ANALYSIS APPENDICES
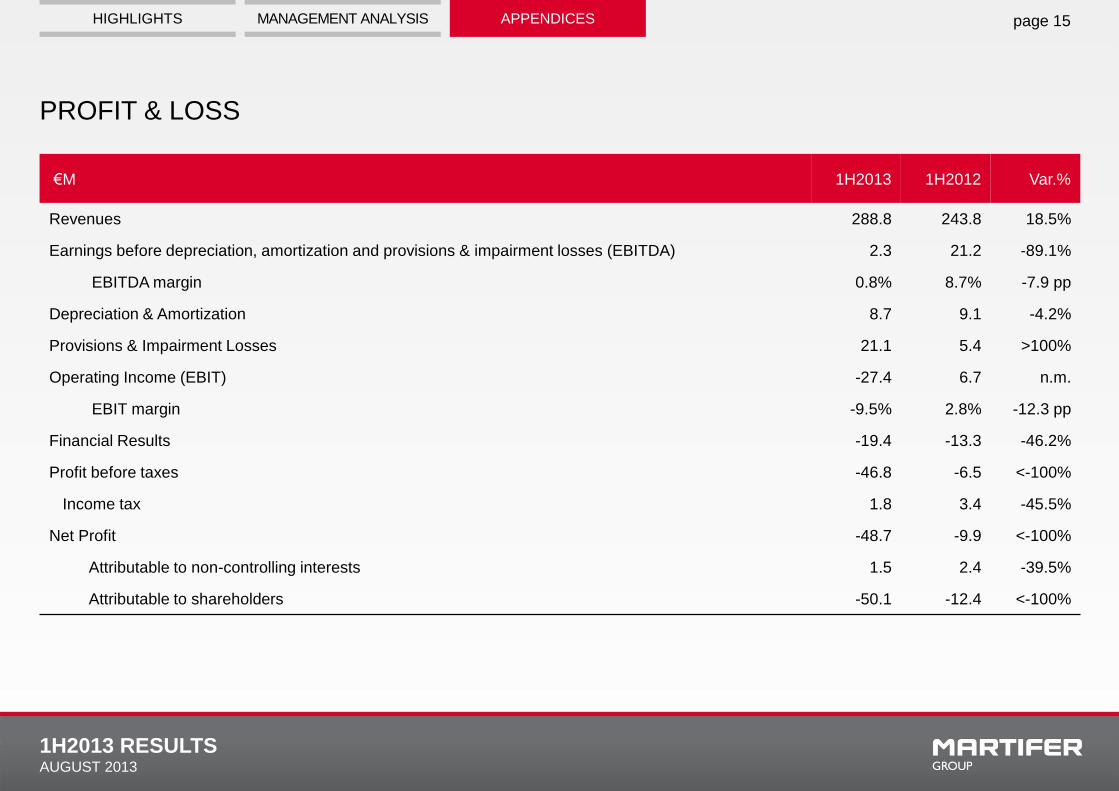
PROFIT & LOSS
page 15
€M 1H2013 1H2012 Var.%
Revenues 288.8 243.8 18.5%
Earnings before depreciation, amortization and provisions & impairment losses (EBITDA) 2.3 21.2 -89.1%
EBITDA margin 0.8% 8.7% -7.9 pp
Depreciation & Amortization 8.7 9.1 -4.2%
Provisions & Impairment Losses 21.1 5.4 >100%
Operating Income (EBIT) -27.4 6.7 n.m.
EBIT margin -9.5% 2.8% -12.3 pp
Financial Results -19.4 -13.3 -46.2%
Profit before taxes -46.8 -6.5 <-100%
Income tax 1.8 3.4 -45.5%
Net Profit -48.7 -9.9 <-100%
Attributable to non-controlling interests 1.5 2.4 -39.5%
Attributable to shareholders -50.1 -12.4 <-100%
1H2013 RESULTS AUGUST 2013
HIGHLIGHTS MANAGEMENT ANALYSIS APPENDICES
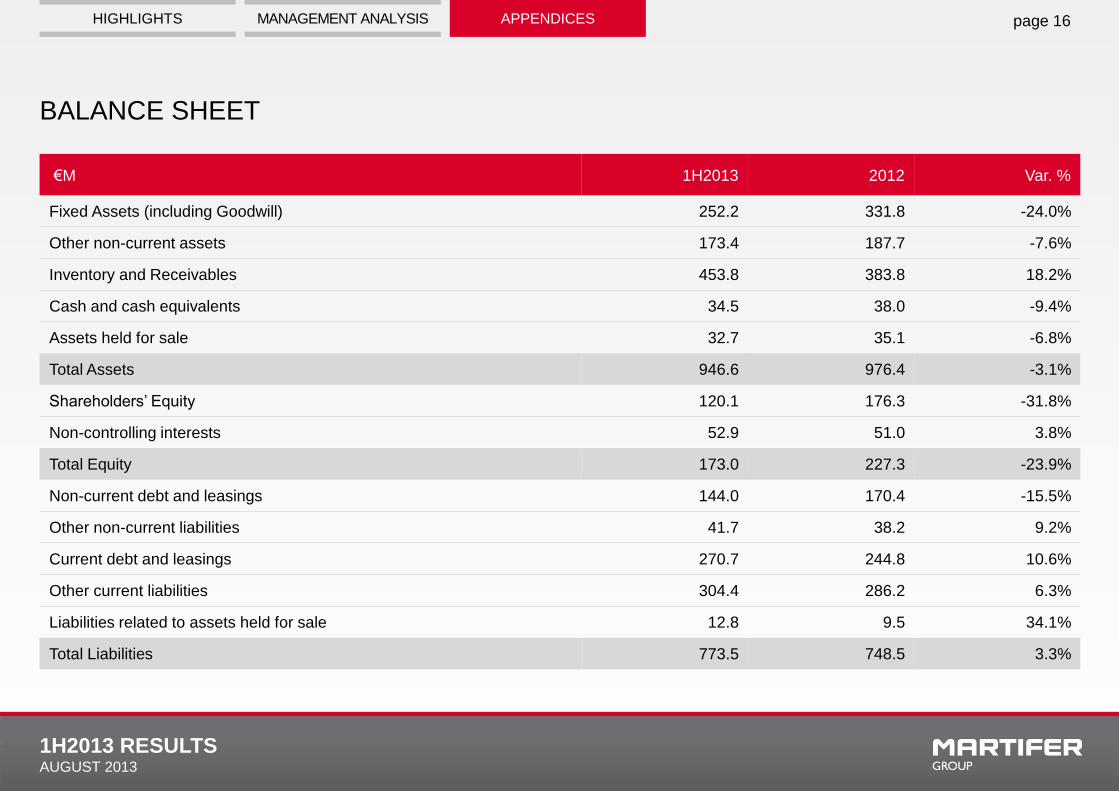
BALANCE SHEET
page 16
€M 1H2013 2012 Var. %
Fixed Assets (including Goodwill) 252.2 331.8 -24.0%
Other non-current assets 173.4 187.7 -7.6%
Inventory and Receivables 453.8 383.8 18.2%
Cash and cash equivalents 34.5 38.0 -9.4%
Assets held for sale 32.7 35.1 -6.8%
Total Assets 946.6 976.4 -3.1%
Shareholders’ Equity 120.1 176.3 -31.8%
Non-controlling interests 52.9 51.0 3.8%
Total Equity 173.0 227.3 -23.9%
Non-current debt and leasings 144.0 170.4 -15.5%
Other non-current liabilities 41.7 38.2 9.2%
Current debt and leasings 270.7 244.8 10.6%
Other current liabilities 304.4 286.2 6.3%
Liabilities related to assets held for sale 12.8 9.5 34.1%
Total Liabilities 773.5 748.5 3.3%
1H2013 RESULTS AUGUST 2013
HIGHLIGHTS MANAGEMENT ANALYSIS APPENDICES
HEAD OF INVESTOR RELATIONS
AND CORPORATE COMMUNICATION
Sónia Baldeira
T. +351 232 767 702
F. +351 232 767 750
www.martifer.com
page 17