Embed Size (px)
Citation preview

■)
"N
Oi CO
Q
.
D D C
APR ' 1972
& B
PHILCO PHILCO-FORD CORPORATION Aeronutronic Division
Newport Baach, California
1 I
M Roprodurod by
NATIONAL TECHNICAL INFORMATION SERVICE
Spnngfiold, Va 23151

Publication No. U-3203
SCIENTIFIC REPORT
THE SHAPES OF COLLISION-BROADENED COp LINES
Prepared for:
Under Contract:
Prepared by:
Approved:
31 August 1968
Advanced Research Projects Agency Washington, D.C.
NOnr 3560(00) ARPA Order No. 237 Amendment No. 26/9-1-67
Darrell E. Burch David A. Gryvnak Richard R. Patty Charlotte E. Bartky
Paul M. Sutton, Manager Physics and Chemistry Laboratories
D D C
APR ? 1972
EinrE B
&
Approved for public reteoae; Diatribation Unlimited
Distribution of this document is unlimited,
PHILCO PHILCO-FORD CORPORATION Aeronutronlc Division Newport Beach, Calif, . 32663

ABSTRACT
The shapes of the extreme wings of self-broadened C09 lines have been
investigated in three spectral regions near 7000, 3800, and 2400 cm"1.
Absorption measurements have been made on the high-wavenumber sides of
band heads where much of the absorption by samples at a few atm is due to
the extreme wings of strong lines whose centers occur below the band heads.
Considerable new information has been obtained about the shapes of self-
broadened C02 lines as well as CO lines broadened by N2, 0 , A, He, and
H2. Beyond a few cm from the line centers all the lines absorb consi-
derably less than Lorentz-shaped lines having the same half-widths. The
deviation from the Lorentz shape decreases with increasing wavenumber in
going from one of the three spectral regions to the next. The absorption
by the wings of H - and He-broadened lines is particularly low, and the
absorption decreases with increasing temperature at a faster rate than
predicted by existing theories.
ii
I
I
TABLE OF CONTENTS
Page
INTRODUCTION AND BACKGROUND 1
EXPERIMENTAL AND ANALYTICAL METHODS 4
SPECTRAL CURVES AND LINE PARAMETERS U
Table 1 - Identification, Positions, and Strengths of Bands . 16
Table 2 - Relative Half-Widths of CO- Lines Broadened by Various Gases 22
NORMALIZED ABSORPTION COEFFICIENTS 27
CURVES OF X VS (v-v ) 36
INFLUENCE OF X ON CALCULATED LINE STRENGTH 57
SUGGESTED FURTHER WORK 63
REFERENCES 66
iii
ILLUSTRATIONS
Page
Figure 1 Representative Spectral Curves in the 7000 cm Region . 12
Figure 2 Representative Spectral Curves in the 3800 cm Region . 14
Figure 3 Representative Spectral Curves in the 2400 cm Region . 19
Figure 4 Normalised Half-Width Q of Self-Broadened C0„ Lines s 2
at 1 atm Plotted Versus J 21
Figure 5 Spectral Curves Showing Comparison of Self-Broadened
and N -Broadened Lines 24
Figure 6 K Versus v for CO Self Broadening Between 6900 s z
and 7100 cm' 28
Figure 7 K for N-, He, and Self Broadening Between 6990
and 7010 cm" 30
Figure 8 K0 for Self and N Broadening Between 37 70 and 4100 cm" 32
o -1 Figure 9 K for Various Gases Between 3770 and 3860 cm 33
iv

«*
i
I
I I I
ILLUSTRATIONS (Continued)
Page
Figure 10 K0 for CO , N , and A in the 2400 cm' Region 35
Figure 11 X for Self-Broadened CO Lines in the 7000 cm' Region 37
Figure 12 X for Lines Broadened by CO , N , and He in the
7000 cm" Region 39
Figure 13 X for Lines Broadened by CO , N , A, 0 , He, and H
in the 3800 cm' Region 40
Figure 14 X(v-v ) for CO , N , and A in the 2400 cm' Region , . 41
Figure 15 Influence of Assumed Line Width on Calculated Curves
of X(v-V ) and K (v) in the 7000 cm Region 43 o s
Figure 16 Curves of X and K Showing Influence of Assumed 2
Line Shape on the Calculated Absorption Coefficient
in the 3800 cm Region 45
Figure 17 Ratio k/k Versus (v-v ) for Self-Broadened Lines max o
in Three Spectral Regions 53
Figure 18 Ratio k/k Versus (v-v ) for N - and A-Broadened max o 2
Lines in Three Spectral Regions 55
Figure 19 k Plotted Versus (v-v ) to Show Influence of X o
on /kdv for a Single Line 58

INTRODUCTION AND BACKGROUND
The shapes of spectral absorption lines has been the subject of
considerable study since Michelson wrote a paper dealing with the
broadening of spectral lines in 1895. The two major factors leading to
the broadening of spectral lines of gases are Doppler broadening and
collision broadening, which is also frequently referred to as pressure
broadening. Doppler broadening arises from the motion of the individual
molecules in a gas and is dominant for gases at high temperatures or at
very low pressures. Collision broadening is related to the pressure, or
to the number of collisions, and is dominant for infrared absorption
lines when the gas is at room temperature and at pressures greater than
a few hundredths of an atm. The mechanism involved in Doppler broadening
is relatively simple so that it is possible to calculate accurately the
true shape of a Doppler-broadened line. However, this is not the case
for collision-broadened lines since present theories do not adequately
explain many of the features which have been observed. I I I
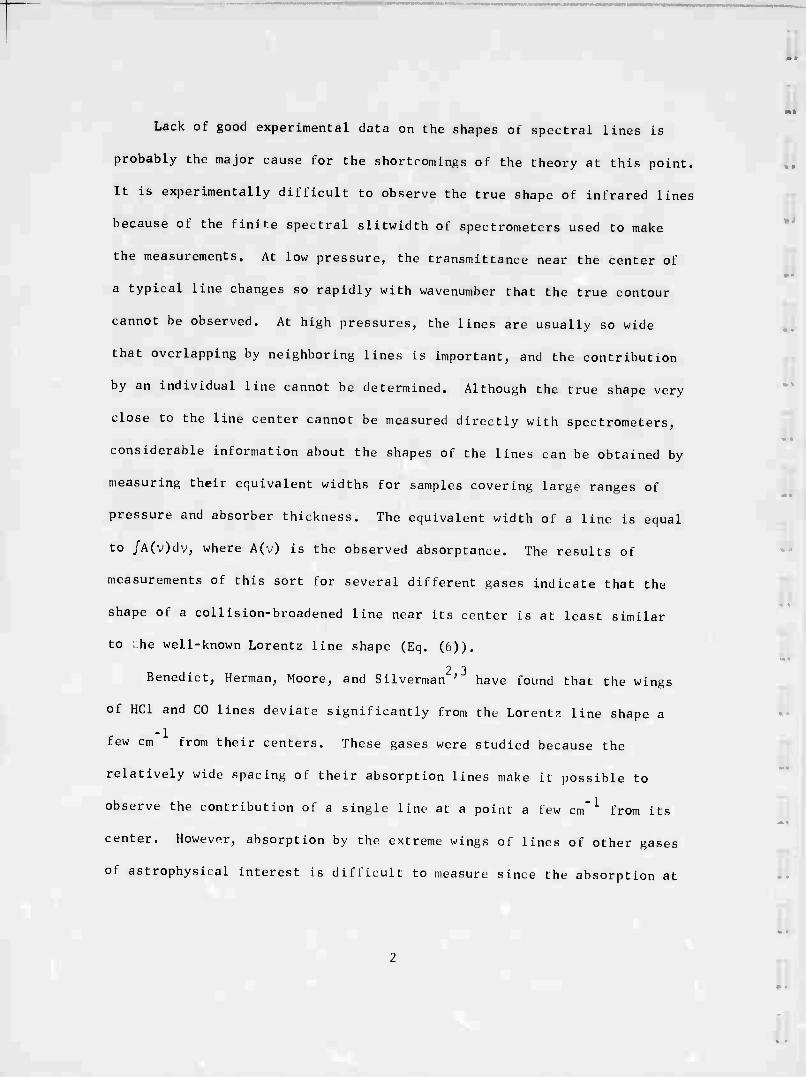
Lack of good experimental data on the shapes of spectral lines is
probably the major cause for the shortcomings of the theory at this point.
It is experimentally difficult to observe the true shape of infrared lines
because of the finite spectral slitwidth of spectrometers used to make
the measurements. At low pressure, the transmittance near the center of
a typical line changes so rapidly with wavenumber that the true contour
cannot be observed. At high pressures, the lines are usually so wide
that overlapping by neighboring lines is important, and the contribution
by an individual line cannot be determined. Although the true shape very
close to the line center cannot be measured directly with spectrometers,
considerable information about the shapes of the lines can be obtained by
measuring their equivalent widths for samples covering large ranges of
pressure and absorber thickness. The equivalent width of a line is equal
to /A(v)dv, where A(v) is the observed absorptance. The results of
measurements of this sort for several different gases indicate that the
shape of a collision-broadened line near its center is at least similar
to he well-known Lorentz line shape (Eq. (6)).
2 3 Benedict, Herman, Moore, and Silverman"' have found that the wings
of HCl and CO lines deviate significantly from the Lorent?. line shape a
few cm from their centers. These gases were studied because the
relatively wide spacing of their absorption linos make it possible to
observe the contribution of a single line at a point a lew cm'1 from its
center. However, absorption by the extreme wings of lines of other gases
of astrophysical interest is difficult to measure since the absorption at
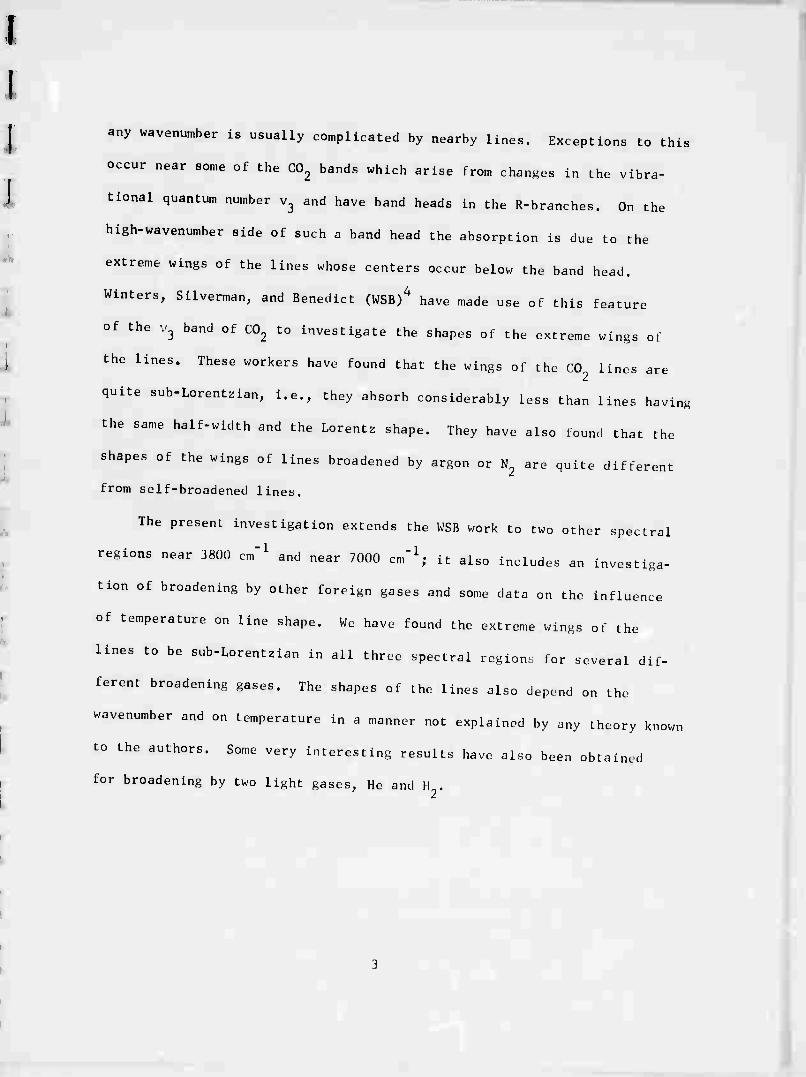
any wavenumber is usually complicated by nearby lines. Exceptions to this
occur near some of the CO,, bands which arise from changes in the vibra-
tional quantum number v3 and have band heads in the R-branches. On the
high-wavenumber side of such a band head the absorption is due to the
extreme wings of the lines whose centers occur below the band head.
Winters, Silverman, and Benedict (WSB)4 have made use of this feature
of the V3 band of CO,, to investigate the shapes of the extreme wings of
the lines. These workers have found that the wings of the CO lines are
quite sub-Lorentzian, i.e., they absorb considerably less than lines having
the same half-width and the Lorentz shape. They have also found that the
shapes of the wings of lines broadened by argon or N,, are quite different
from self-broadened lines.
The present investigation extends the WSB work to two other spectral
regions near 3800 cm'1 and near 7000 cm"1; it also includes an investiga-
tion of broadening by other foreign gases and some data on the influence
of temperature on line shape. We have found the extreme wings of the
lines to be sub-Lorentzian in all three spectral regions for several dif-
ferent broadening gases. The shapes of the lines also depend on the
wavenumber and on temperature in a manner not explained by any theory known
to the authors. Some very interesting results have also been obtained
for broadening by two light gases, He and H. .

EXPERIMENTAL AND ANALYTICAL METHODS
Spectral curves were obtained by using two different spectrometers
in the three spectral regions. A Perkin-Elmer spectrometer, Model 112,
with a LiF prism and thermocouple detector, was employed near 2400 cm"1.
The two spectral regions near 3800 cm'1 and 7000 cm"1 were investigated
with a small grating spectrometer employing a PbS detector cooled with
liquid nitrogen.
The samples used in the 2400 cm" region varied in pressure up to
1 atlti and were contained in a multiple-pass absorption cell with a base
length of approximately 29 meters. This cell as well as a shorter one
with a 1-meter base length contained samples investigated in the other
two spectral regions. The shorter one was used at pressures as high as
15 atm and at temperatures up to approximately 431 K. The 2400 cm"1
data were obtained before the shorter absorption cell was constructed;

therefore, the daUi in this spectral region do not contain any samples at
high pressures or elevated temperatures. The apparatus and experimental
techniques have been discussed in detail previously.
Samples consisted of either pure CO or mixtures of CO with one of
the following broadening gases: N2, 02, A, He, and H . The partial
pressure of C02 is denoted by p and the total pressure by P. Partial
pressures of the other gases are denoted by PN ^ Pn , • . ., etc. All 2 02
pressures are given in atm with standard pressure of 1 atm denoted by a
superscript, such as p .
The geometrical path length of the radiation through the sample is
given by L, and the absorber thickness u is given by
u(atm cmSTp) = p(atm) [l+0.005p] L(cm) 273/e(0K). (1)
The factor fl+0.005p] accounts for the non-linearity in the relati on
between the pressure and density of C02, and (273/8) reduces the absorber
thickness to standard temperature, 273,K.
T(v) represents observed transmittance of a sample at wavenumber v, and
T'Cv) is the true transmittance that would be observed with infinite resolv-
ing power. The absorption coefficient K(v) is related Lo '] ' (v) by
T'Cv) exp [-uK(v)|, or K(v) --JLT(->). u
In a region of overlapping lines, K(v) is the sum (; . k (v)) of ihv
absorption coefficients due to the individual lines.
(2)

The strength, S, of an individual line is related to k(v) and a
shape factor f(a, v-v ) by o
l<(v) = S f((>, v-v ), where (3)
00
/ f(ü, v-Vo) = 1, and (4)
-00
00
S = / k(v)dv. (5) -00
For a Lorentz line, which is generally agreed to be approximately correct
for collision-broadened lines when vv is small
V"' V_Vo) i 2' (Lorentz) (v-Vo) I Q
WhenCv-v^ "> ., Eq. (6) reduces to
f(o, v-v ) f ( ,, v-v )X(v-v ) X(v-vo)
(v-vo) •
(6)
V"' V"Vo) . ' .2' (for (v-v ) »a) O) IT (V-V ) O '
O
We have found that when (v-V0) » t, the Lorentz shape is not
appropriate; however, the shapes can be expressed by the following
equation:
(8)
■ ■
I I
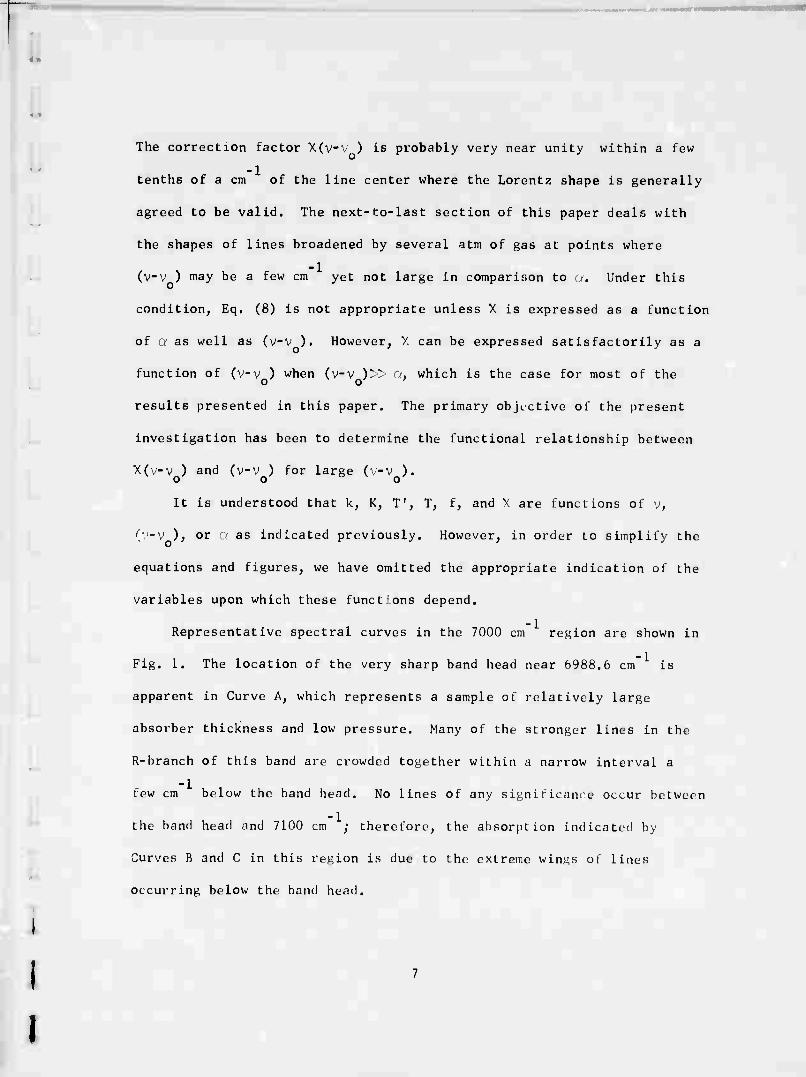
The correction factor X(v-V ) is probably very near unity within a few
tenths of a cm of the line center where the Lorentz shape is generally
agreed to be valid. The next-to-last section of this paper deals with
the shapes of lines broadened by several atm of gas at points where
(v-v ) may be a few cm yet not large in comparison to a. Under this
condition, Eq. (8) is not appropriate unless X is expressed as a function
of a as well as (v-v ). However, Y. can be expressed satisfactorily as a
function of (v-v ) when (v-v )» a. which is the case for most of the o o '
results presented in this paper. The primary objective of the present
investigation has been to determine the functional relationship between
X(v-v ) and (v-v ) for large (v-v ). o o o
It is understood that k, K, T1, T, f, and X are functions of v,
(V"V ), or Q as indicated previously. However, in order to simplify the
equations and figures, we have omitted the appropriate indication of the
variables upon which these functions depend.
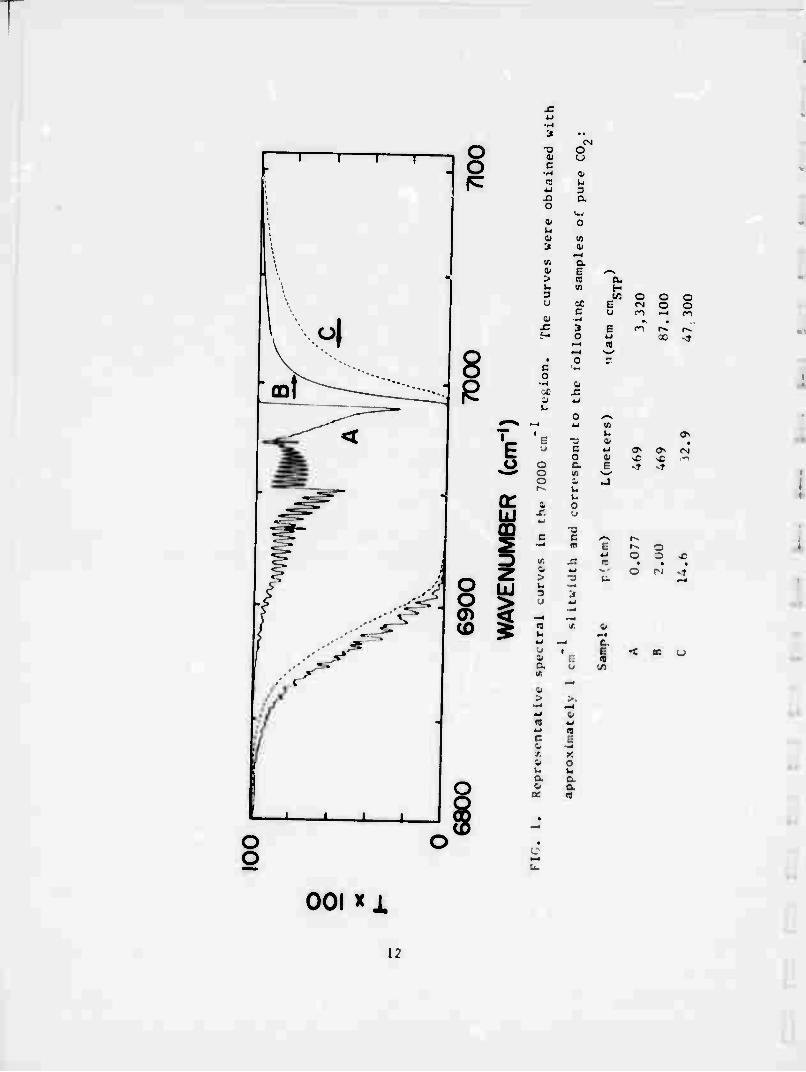
Representative spectral curves in the 7000 cm region are shown in
Fig. 1. The location of the very sharp band head near h988.6 cm is
apparent in Curve A, which represents a sample of relatively large
absorber thickness and low pressure. Many of the stronger lines in the
R-branch of this band are crowded together within a narrow interval a
few cm below the band head. No lines of any significance occur between
the band head nnd 7100 cm ; therefore, the absorption indicated by
Curves B and C in this region is due to the extreme winj^s ol lines
occurring below the band head.

At a distance a few times greater than a above the band head, the
contribution to the absorption coefficient by a single line for a sample
of pure C0„ is given by
Sri*.
IT(V-V )' o
Sa p(l+0.005p)X
Jtp (v-v ) (9)
where the subscript s denotes self broadening, and ,0 is the half-width s
at 1 atm. Since Q is proportional to the number density of the molecules,
rather ihan to pressure, the factor (i'Ü.OObp) is included to account lor
the non-linearity in the relationship between these two quantities. The
total abcorption coefficient is given by thu sum of the contributions of
all of the individual lines,
E k I S>'L
S > . p(lfü.005p)
o- np (v-v )'
(10)
For a mixture of p atm ot CO., and p. atm ol broadening K.is. tin total
absorption coefficient is given by
K --J~-ri-,) K p(l+0,005p) < %
i P (v-v ) L
o ± o ■.
b.^b] (11)

I I i
The subscript b denotes broadening by a non-absorbing broadening gas; a
specific broadening gas such 0 or N,. will be denoted by the appropriate
subscript. The normalized absorption coefficients K and K^ correspond
to 1 atm pressure. The half-width of a C0„ line broadened by 1 atir, of a
foreign gas b in a mixture with C0o when p '■ p, is denoted by ,°. The Z D h
ratio of the normalized half-widths ((x/o ) is assumed to bo the same for D S
all lines for a given broadening gas. The non-linearity in the relation-
ship between number density and pressure for the ton-ign broadening gases
was negligible.
Since Ihere are no absorption lines between the band head and
7100 cm , the absorption coefiicient K does not change rapidly, except
very near the band head. Therefore, the true transmitlance 1 ' (. ) in this
region closely approximates the transmittance T('. ) observed with our
spectrometer. Values ol K at several ditterenl wavenumbers w.re deter-
mined from spectral curves ot pure CO samples b ,• substituting T(-. ) for
T'Cv) in Eq. (II) with p. 0. These values ol K0 were then used In
Eq. (II) with values of T I rom spectral curves for mixtures of CO., and a
broadening gas in order to determine K. .
Values of the line strengths, S, were calculated by use ot thi
ft 7 appropriate theoretical expressions ' from exptr imtntal 1 v «I« termined
strengths, Sv, of the vibr.it ion-rotat Ion bands. Values ot lor all ot
the lines were determined trom inlormation discusRed below. The absorption
coetlicient K for a particular wavenumbtr was calculattd by substituting
into Fq. (II) the appropriate values of and St, along with assumed
>
I I I I I

values of X. For a particular broadening gas, we assumed that X was a
slowly-changing function of (v-v ) only, and that this function was the
same for every line in any one of the- three spectral regions. However,
we found that each broadening gas required a different X function in each
of the three spectral regions. Each X function was represented by a
table of X vs (v--.o) which served as input lor a computer that was used
to perform the calculations. Each table was modifu-d on a trial-and-error
basis until all thi' calculated values of K0 in a given spectral n-nion
agreed, within experimental error, with the observed values. We thin
assumed that the lunciion represented by the table which gi.ve sat is Iactory
agreement was appropriate. More detailed Iniormatiop about the methods
used to determine the line parameters is given in the lollowitiK sections,
along with a discussion 01 t lu imiuemc that errors in the line parameters
have on the derived values oi v.
10

SPECTRAL CURVES AND LINE PARAMETERS
I
Representative spectral curves of the three regions investigated are
shown in Figs. I, 2, and 3. The shapes ot the extreme wings ot thi- lines
occurring below the band head at 69H8ob cm were investigated by measur-
ing the absorption above the band head by sampl'-s such as those represented
in Fig. 1. No absorption lines of any significance occur in the region
between the band head and 7100 cm . Essentially all the absorption in
this region is due to the extreme wings of the lines oi the 00 J band and
the weaker 01 M)l 0 band whosi head can be seen near 6950 cm
Curve B in Fig. 1 represents a 2 aim sample with sufficiently lar^e
u to produce signllleant absorption above th» band head. Curve C, which
represents a sample at iV.h atm, is relatively smooth below bfOQ cm
since the individual lines have hern broadened suitiiuntly at tht hi«her
pressure to smooth-out the striutun. It is ol inUrest that S.impl» B
absorbs more than Sample (" below h90l) cm sime th. absortur thiikness
11
u
^ o T3 O 1 01
c u 0> s: re
4-1 JO o
M u 0) 3
i
1) D D.
IM O
V) a*
a E ä
'S > « ■i u 10 H 3 w: o o o u ac E «N o o c y m 1—1 CI i •rH ». •
x: 3 E W r^ r^
^^
f« 0 X »t
o • 0 ■ ^^^ c ^^^ o
^•--^ p 1 0
M :=~- u
0 ^■v ^^^ 1^ 1/1
T 1 D C o
E y i
& £
•
^j o a E »t »t ***' o
o ■ la
ÜJ CD
X.
E o
c c ■ E O 3 ■ X 1
O • B • •
-'J 8 Z >
u -i II M
U o fS 4
»4
dsr 0> -< (0 ^
p4
a« — c.
•J 1 < oc u J E « a. B V) 1 . ■ > >, M -- M & w c 1 i c a ■
E ■il X 0 E a a «A
i CD •
o o
001 xx
12
I I
of B is considerably larger. However, above th? band head, the absorption
coefficient is due to the extreme wings of the lines and is proportional
to pressure. Therefore, in this region Sample C absorbs more than the
lower pressure Sample B, although B has the larger absorber thickness.
On the basis of the equations in the previous section, we expect the
absorption above the band head to be a function of the product (up). In
contrast to this, in regions where most of the absorption is due to nearby
lines, it is nearly independent of p for constant u when p is sufficiently
high to broaden the lines and smooth-out the structure. Thtnlorc, as
seen in Fi^. 1, the increase in p and decrease in u shilt the center of
absorption, although the centers and strengths of all the lines remain
i i xeci.
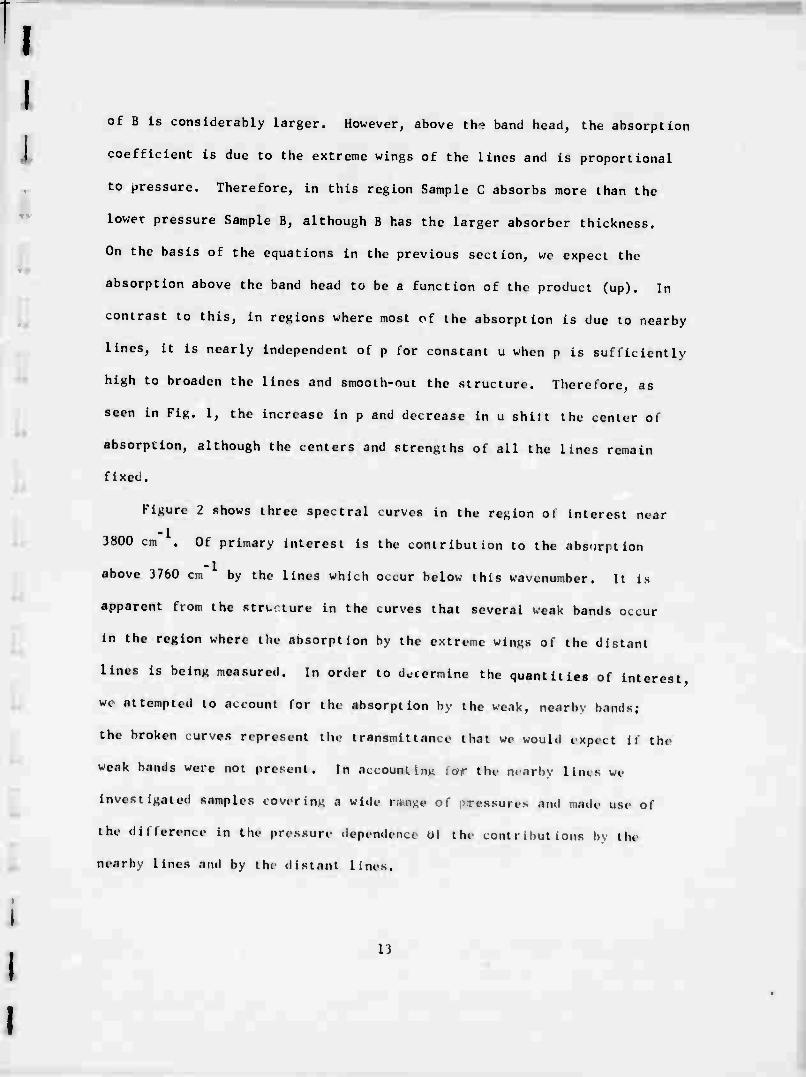
Figure 2 shows three spectral curves in tht- region of Interest near
3800 cm . Of primary interest is the contribution to the absorption
above 3760 cm by the lines which occur below this wavenumber. It is
apparent from the structure in the curves that several wi-ak bands occur
in the region where tht- absorption by the extreme win«« of tht- distant
lines is being measured. In ordt-r to determine the quantities of interest
we attempted to account lor thr absorption bv the weak, nearbv bands;
the broken curves represent the transmlttan^e that we would expect il the
weak bands were not present. In accounting lor the m .irhy lim s we
Investigated samples covering a wide MMSt of .>reKsures ,ind .mide use ol
the «inference in the pressure dependenct ut tht contributions by the
nearby lines and by the distant lines.
I)

4-1 • p-4
3 (0
i r^ i i i i —i— 4_l
• H •a 0) •o c o •)-l ■l
. .o (TJ
M c
1\
^ o
h
!
H
E
E m 4-' •
2.3
50
7,3
00
»f
the
str
<
b> The
cu
rv
ainple
s:
3 <•
| 0
•J 3 X m4 \c o tfl >*N k.
1 o o c c O «4
h
4-i ri
y c
vC o
11 ^- — i U • 4
i \ ^,,^ M o E X 00 CN -3
i • h —< *-• •»1 Oi
E o
J \ ' E | y
W (T u x: ■
\
ÜJ
2 Q o
50 c
ip4 fj 4/ 4
\ 3 | c •^3 n = -1 - ■ tl • M ! A
\ ^ 4 o M C o
L* fcj «^
. \ 8 ÜJ >
j. E sc
3 ^TJ
a x \ u
— 0> < L •3 u
c nj
N rh ^ ■ O
1- T3
0 c u
X = C "c X • «11
|W
\
\
it «
Ü 3
4-* 1
n t -. -4 <
■ X O 4- \>X « *-*
\ 1 \ \ / )
v. —«
■ E t 3 O 0 *
CD § - i
- B
u
m 0 <t
O X '4- "J
^ .* 0 C
-« ■ 4-. C C
•2 g r 8 O n
K U C t 4-.
<
1 r
^
c : |
- E
■ <
t/.
: . 1 O u
—• a.
0 n X (/
3 O O E i : U^ 1
001 «I
14

I I
I I
i I I I
Absorption by pressure-induced bands exhibit the same pressure
dependence as absorption by extreme wings of lines. Therefore, it is
more difficult to determine the contribution by pressure-induced bands
such as the 22 0 band for which there is evidence between 4040 and
4100 cm in Curve C of Fig. 2. The broken portion of this curve repre-
sents our best estimate of the transmittance without the influence of the
pressure-induced band. It seems unlikely that the contribution by the
pressure-induced band is significantly less than W« have estimated; it
may be an even larger part of the absorption observed in this region.
Therefore, the absorption attributed to the extreme wings of thf distant
lines probably represents a maximum; it seems unlikely that it is
significantly more than our estimatf.
Table 1 contains a listing ol the absorption bands ol interest in the
three spectral regions studied. Part A provides information about the
bands which occur below the band heads and contain the lines whose shapes
are studied. Pan B contains information about the relatively weak bands
which occur in the spectral regions where the absorption coetlicient is
measured. Contributions by these bands are accounted lor in order to
determine the i onlrilml Ion due to the bands listed in Part A.
Curves A and B in KIK. 2 repn s» nt two samples with tin MM CO,
pressure and the MM path length. Ileliun has been added to the (0, in
Sample A to produce a total pressure ol I ♦.<> atm while S.i: ph | contains
enouKh N9 to produce the same total pressure. Sin. t ( urvi I', Mils below
Curve A, it is apparent that i_ is more i Mective than lie as a iorei>;n-
IS

TABLE 1
IDENTIFICATION, POSITIONS, AND STRENGTHS OF BANDS
Part A - provides information about the bands containing the lines whose shapes are studied.
Part B contains information about the relatively weak bands which occur in the spectral regions where the absorption coefficient 1« measured. The contributions by these bands are subtracted from the observed absorption to determine the contribution due to the bands listed in Part A.
BAND
IDENTIFICATION
Gl1 3-«110
00" 3
Part A
BAND CENTER (cm-;)
STRENGTH
(atm"1cm" STP cm
- ' )
7000 (-■III-1 lU'^ion (1.^ ,,}
6935.05 C
6972.49 c
Jhoo
0.00 3 3
0.0083 at '4)1 K
0.041 0.059 at 431 K
cm' Kt'Kion (-'.7 . )
OJ1!-or-o ic/H0. 30 C 2.3
02 1 3612.Hi c 29.0
10 I »714.7h C 44.9
in-oi'o 3723.21 C 3.r)
REMARKS
Band In .ul at R40, h9K8.5b cm-1. Stronnost line, Rib. .it h9H2.94 cm'
Stronufst line, Hlh, ••l 1727.10 cm"1
oiU.oi'o
00° 1
2400 cm-1 Region (4. 3 . )
2336.7 210
2349. i 2700 Mad lund at R122, 2)97,1 cm"1. Strongest 1 itu , Hlh, nt 2 361,5 cm"
Ih
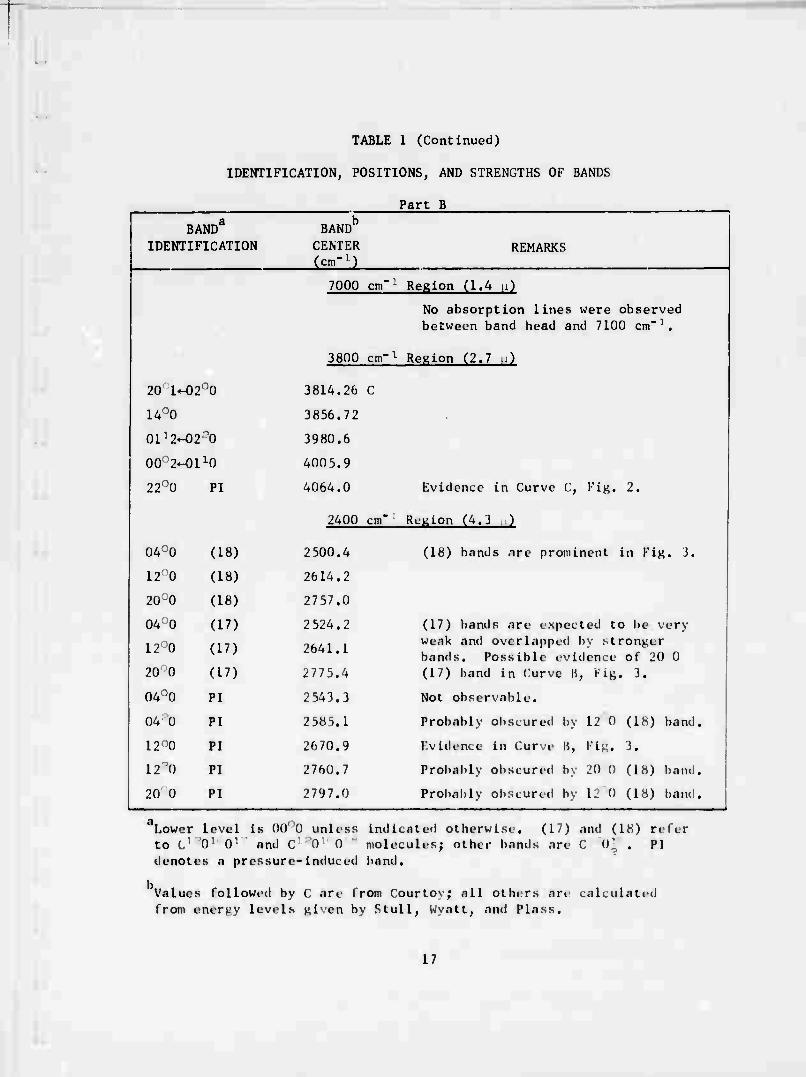
TABLE 1 (Continued)
IDENTIFICATION, POSITIONS, AND STRENGTHS OF BANDS
Part B
BAND IDENTIFICATION
BAND CENTER Ccm-1)
REMARKS
20 I-02n0
I4o0
0I,2-02o0
00o2«-0I10
22o0 PI
04o0 (18)
12 0 (IK)
20o0 (IK)
04o0 (17)
12o0 (17)
20 0 (17)
04n0 PI
04 "0 PI
nw PI
12 "0 PI
20 0 PI
7000 cm'' Region (1.4 u)
No absorption lines were observed between band head and 7100 cm-1.
3800 cm"1 Region (2.7 u)
3814.26 C
3856.72
3980.6
4005.9
4064.0
2400 cm'
Evidence in Curve C, Fig. 2.
Region (4. i . )
2500.4
2614.2
2757.0
2 524.2
2641.1
2775.4
2543.3
2585.1
2670.9
2 760.7
2797.0
(Ih) bands are prominent in Fig. K
(17) bands are expected to be very weak and overlapped by stronger bands. Possible evidence of 20 0 (17) band in Curve B, l-ig. J.
Not observable.
Probably obscured by 12 0 (IK) band.
Evidence in Curve B, Fig, J.
Probably obscured by 20 0 (1M) band.
Probablv obscund bv 12 0 (IK) band.
'Lower level Is OOnQ unless indicated otherwise. (17) and (IM) r« lei to C1 O1 0- and C" 0 0 molecules; othtr bands are C 0* . PI denotes a pressure-Induced band.
Values followed by C are from Courtoy; all others are calculated from energy levels given by Stull, Wyalt. and Plass,
17

broadening gas. Since the bands between 3600 and 3800 cm"1 are consider-
ably stronger than those studied in the 7000 cm"1 region, we have been
able to measure the absorptance much farther from the centers of the
absorbing lines than in the higher-wavenumber region.
The 2400 cm region is shown in Fig. 3. The continuum portion of
the absorption above the band head near 2400 cm"1 is mostly due to the
very strong 00 1 band whose center occurs at 2349.2 cm"1. Most of the
structure above 2400 cm"1 is due to three bands of C1 W8 which arise
from transitions that are forbidden in the symmetric C12016 molecule.
However, these transitions Ar« allowed in the isolopic molecule because
of the asymmetry introduced by the presence of the ()lH atom. The corres-
pond in^ bands of c: 0 0 7 are much weaker since' the. asymmetry of the
molecule is hss and the abundance of the ()17 atom is unlv approximately
one-1 itth thu ot Q h. The contribution by the isolopu bands as well as
I lew pressure-induced bands above 2400 cm"1 were accounted tcr in order
to determine the absorption bv the extreme, win^s oi the strong lines
whose centers occur below .''♦()() un" .
The strenuth ni the Ml band near 2400 em"1 uas taken trom WSH;*
their value is also in |Md agTMMnt with the results ol other workers.
StrePKths ol the bands listed in Part A ol Table 1 tor the ISM u;,"l and
7000 cm • r«gi«M were determined trom spectral curves ot samples at
approximately 13 atn. At this pressure t h. spe.tral lines are suliuientlv
broad, n.el that t h. Mriutur. within t h. band is smoot heel out, an.l t h.
iransmittance- measure.! with the spectron.ter elos.lv approximates the
IH

i 1 1 r
E o
HI c
ja O
v u OJ
3
01 j: H
8 S CM
UJ
m
ÜJ
i 8
8 J 1 I I I
o m J i
HI
8 OJ
3 a
ai i—« a E US
on c
3 O
g -l 0 o
•r-l U-i 00 01 0J I* -C
H o o rn O
00
•o c o a
c
.c
0> CT^ '^
^ a. i ■ CM >
u in
4-« -j ra 4-1 >. c —4 OJ D OJ ■-4 U) U a 0J t F h h « a tn OJ y. M 0
U a. a ^ 1
-t
3^1-1 E
r -
O
001 xi
19

true transmittance. Methods described previously8 were used to determine
the strengths of each of the separate bands in regions of overlapping.
Strengths of individual lines were calculated from the band strengths by
use of the appropriate theoretical expressions.6,7
The half-widths, -, of self-broadened C0„ lines at 1 atm were
assumed to vary with quantum number J according to Fig. 4, which is based
on empirical equations derived by WSB4 from 15 a CO data obtained by
9 Madden. In order to check the validity of Fig. 4, we have used the
curve-of-growth technique to measure the half-widths of several CO lines
in various regions of the spectrum lor values of J less than approximately
25. Our results are generally in good agreement with the curves shown
in Fig. 4. No significant difference in the hall-widths of the lines
having the same J value for different bandi has been observed. We will
show later that our results on shapes of the extreme wings of the lines
are not influenced strongly by modifications in the relationship between
o a and J, particularly for large .1.
The ratios, o^/a^ ot the half-widths of foreign-broadened lines to
those of self-broadened lines are given in Table 2. The ratios for H,
and N2 have been determined as part of the present investigation. The
results lor A, He, and 02 are based on the present N measurements and
ratios given by Hurch, Singleton, and Williams10 lor N,, broadening and
broadening by these gases. Results of quick checks of the relative
broadening abilities agree well with those of BSW. No significant dif-
ferences in the ratios lor a given gas have been observed in the three
different spectral regions«
20

10 01 > kl • 3 in u u
01 u <u 4-i 0 M B IM H
>> X H X) 8 w T3 •^ 3 01 (0 > i i o. & •H ^1 a 01 u •—i m > u i
-a B H ""0 H 'rj
u U) ~E X. W n E 4-t 3 'oa 0 o i*4 f-* X i 4-1 Gu u 3 E X tr 4J 3 o. 01 ra X ». 01 n
t—* B 0
■r-l X
4-1 •H 1 H i 4->
■ 3 IN , <u er <t X c 0) ^3 o u
• r^ • o E f—* —^ B 19 n 01 o b
IN u •a X O •H ■a 1 u U 1
T. 0.
■v & i <u >, E X B V X 4J |
T3 M ■a 10 E 19 B 01 4-4
0 •-< B . —i h 3 ■p4 o *~ 1
xi 0 rj 1 i E i r-* 4-1 ü
U-i i-H X ^-1 0 0 a m
<U U-i X E e w ID 01 u 4-1 T! O (*-( X ■ IN E 0 4-1 •a "< C
0 (/) c g O • 0 0
h 1 X u
x: -a IM E — 4-i i) o rj OJ XJ « -a in u E
X 3 1! B O 3 i
x i o SS w
't-d 0) - + 19 *-* u 4-1 01 '0 11) 'J X 0J X
n "0 4-1 3
1 0J 1 ^v E i X B ^-^ •H o N 'J 0) 1 in
■w c m E »—< m u »—i / IT! u -o E X E 0 H i "^ E n! 0 0 *": U
Sr. 1 > 0
i- o u. 4-,
(..UiO),,^
21

TABLE 2
RELATIVE HALF-WIDTHS OF C09 LINES BROADENED BY VARIOUS CASES
Broack-niriK Gaa
O ) o
s CO.,
co2 1.00
H2 0.81
A 0. b 5
IK' 0.49
Ü, O.hH
ll2 1.17
-
22

• >
I I I
Figure 5 contains portions of four speitrai curves which illustrate
the technique used to determine the ratio of foreign broadening to self
broadening. Curve A represents a sample ol pure CO with the pressure and
path length indicated. After obtaining Curve A, the path length ol the
multiple-pass absorption cell was changed to approximately four times its
original length, and the C02 pressure was adjusted to provide the same
absorber thickness as lor Sample A. Nitrogen was then adiled to the sample,
and spectral curves B, C, and I) were scanned with the sample at the total
pressures indicated. We note that Curves A and C are nearly coincident
near the centers of the lines, while D approximates A n.ar the transmittance
maxima between the lines. Since the spectral slltwidths and absorber
thicknesses are the same lor all the samples, we conclude that the shapes
ol the N2-broadrneH linos are ditierent from those ot the seii-broadened
lines as close as 0.9 cm" to the line centers. (Two lines are s.u-i to
have the same shape il l( , .-.^ (Eq. (j)) is the same at all (- ) when
the pressures are adjusted so that the hall-widths are equal.) Tin r.suits
discussed in I ol lowing sections make it char that N,-broadened lines
have quite different shapes from sei I-broadened lines when ( - ) is more o
than a lew cm ; however, the method used to obtain those results is not
applicable lor ( - o) l«M than approximately } cm'1. ih.nlore, the
method indicated by Ki*. S can provide additional imormation about I he
shapes ol lines nearer their centers. Because ot the unite spe.tral
slitwidtli ot the spectrometer, the true shapes ol the lim s c.innot be
determined near the enters where the t ransmi t lance ili.iiu.es rapi.llv with
wavenumber.
23

1 r. ■ •- I I
I
■o
o 001 Xi
I
■
~ - i-
3
-
I •
*
.
— - -t -
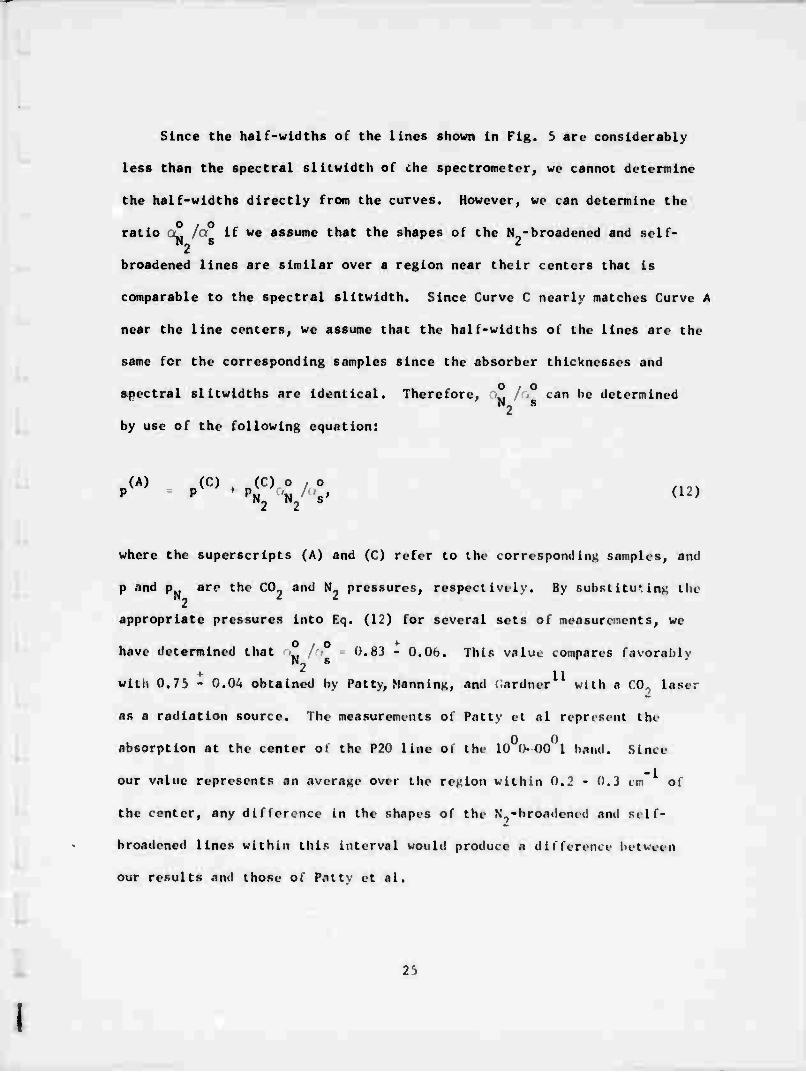
Since the half-widths of the lines shown In Flg. 3 are considerably
less than the spectral slitwldth of the spectrometer, we cannot determine
the half-widths directly from the curves. However, we can determine the
o / o ratio (^ Id If we assume that the shapes of the N -broadened and self-
broadened lines are similar over a region near their centers that is
comparable to the spectral slitwldth. Since Curve C nearly matches Curve A
near the line centers, we assume that the half-widths of the lines are the
same for the corresponding samples since the absorber thicknesses and
spectral slltwldths are identical. Therefore, -„ /- can be determined 'Ms
by use of the following equation:
„(A) n(C) (C) o / o P P PN2 'N/'S' WJ
where the superscripts (A) and (C) refer to the correspondinK samples, and
p and p are the CO and N- pressures, respectively. By substituting tlM
appropriate pressures into Kq. (12) for several sets of measurements, we
have determined that ■ l O.MJ - O.Oh. This value compares favorably
♦• 11 wit» 0.75 - 0.04 obtained by Patty, Manning, and Card—K with a CO., laser
as a radiation source. The measurements of Patty et al repr»sent the
absorption at the center ot the P20 line of the 10 IMN 1 band. Since
our value represents an average over the region within 0.J - ().J cm oi
the center, any difference in the shapes of the N^-broademil ami sell-
broadened lines within this interval would produce a dttference between
our results and those ol Patty et al.
25

From the portions of the curves between the lines, we can show that
N2 broadening is only approximately 0.77 times as effective as self broaden-
ing; i.e., the absorption coefficients are identical when the pressure of
a pure CO^ sample is 0.77 times the pressure of a very dilute mixture of
C02 in N2. This is approximately 77 less than the value 0.83 obtained
near the line centers. Although this difference is small, we believe it
is significant sinct- results consistent with Fig. 5 were observed in dif-
ferent spectral regions and ior a variety ot samples. Hurch, Singleton,
and Williams have measured the ratio of N broadening to self broadening
ol C02 lines with a spectrometer having low enough resolution that the
Individual lines were not resolved. Since most of their samples produced
considerable., absorption, thev were nearly opaque near the line centers
and most ol tin increase in absorptance due to increasing pressure occurred
near the absorptance minima between the lines. It is, therctore, not
surprising that their value, 0.7/ - 0,05, for the ratio ol the broadening
abilities agrees with the 0.77 obtained in the r.resent investigation lor
the regions near the absorptance minima.
2h

NORMALIZED ABSORPTION COEFFICIENTS
i i I I
Curves of the normalizetl absorption coef tic lent« have bten obtained
tor several broadeninn «ases by substituting; into Eq. (11) values oi
transmittance from curve« which represent samples coverinK verv wide
ranges of absorber thickness and pressure. Pigim I shows K , th«
normalized absorption coefficient lor CO self broadeniiiK in the 7000 cm
rcKlon. The solid curve represents the experimenlnl results, and the
various geometrical symbols represent data from samples at dillerent
pressures. We note that throuKhoul the rewion Irom 7010 to 70M) cm
there is very good agreement between results obtained Irom samples whose
pressures vary trom less than 2 atm to approximatilv IS atm. This result
confirms the assumption that the absorption (.oeliicitnt is proportional
to pressure when ( - ) " as indicated by Eqs. (10) and (11).
The upper curve in Pig« '> represents values ol K calculated by
assuminn that all o( tin lines have the Lorentz line shape. The lower
27

1>
■
3 O -
>
H
•I
c c
•a
« — x l
M M .* Q 4» <» 3 O H 3 V w .. C
"' —i ■ ■ i i... "•."•.—; 1 « «0 K a) L • I i 2 O o o
I _(dlSUU0 UUP) s>j
c
«I
3t c •«4
c 41
•o o
o tj
3 « i a« >
o /.
ig . w j, 0 O w u
1 § I a
— b
0 1 * x
I ■ x I " X
B •st C in
> c ig 4, X l/l
I » k. 1 a -^ «,
0 3 *•> u
■g N: § i & M 1 ac '■■> O
«i «i B -o i« 4, ^ w C
-4 "O 3 C B <«
-^ x I U >-4
o A O I 0 ■ x i w i a u 3« O b <M
l< t > X u u 3 B
X
— c -
•o c
• c V IB O- E IB u X I in >
-I (/) C
O u -j a< ■ ■ c X ■•• ■ i u
3 •J w > X
u 4< U 3 ■
\ <3
X T3 C
•n 3 * O c -
a w <B
X X
c c
•o
IB l>
X
1 c IB X
X
I -
§ - s ■ IB "
o
.-

1
I I
curve represents calculated values based on the modified line shape
derived by WSB from absorption measurements in 'Ke 2400 cm region
(4.3 n band). It is apparent trom these curves that the absorption lines
In the 7000 cm region are sub-Lorentzian, but their wiriKS are consider-
ably stronger than the lines in the 2400 cm region. The shapes ol the
absorption lines in the different spectral regions are compared in more
detail below.
Figure 7 shows similar results for broadening by Hk and N0 with a
portion of the C02 curve from the previous figure repeated tor comparison.
We note that at 7010 cm , K is only approximately one-tenth as great
for N2 as for self broadening. From this result it is apparent that the
absorption by the wings of ^-broadened lines is much K;,* than that by
self-broadened lines. We also see that the wings of the He-broadened
lines are even less absorbing than N -broadened ones. Since K° and
o K are so small, we were able to measure these quantities onlv over the
2 spectral regions indicated.
A few measurements on broadening by A, 0,,, ami M, were also made in
this region. I'pon redueiiiK tin data, we found that t h. results were not
as consistent as those for N and He; thereiore, tluv have not been
included in Fig. 7. However, values of K° agreed to within 10 or Ml 2
percent with corresponding values ol K" Similarlv, v.ilm s lor A .ind
02 apparently a«ree with those for N, to within approximately tin same
accuracy. Broadening bv A, 0,,, and H, in other speitr.il rcgiOM is
discussed below.
29

r
|H M I I I 1 |llll I I |—I |ll| | |
O o
c 10
o eh
c
■ u 5
• c o IK
•*4 u m a E o u u O
«
c
.^^UJD UJiD)0>|
^ £
C O
O a
■o
T3 ■ C a ■
r. x:
r - o
•t c — o
■ o Q.
■3 ■-' v <? C £ O ^i «J
X «5 /. 0 I
'— k- »j
li U (fi ••- wi
-• t; | c
o I
"3 I
M ■
£ H
JU

Figure 8 shows the results for self broadening and N. broadening in
the 3800 cm' region. We recall from Fig. 2 that several weak bands in
the region of Interest had to be accounted for before we could determine
the contribution by the lines below 3760 cm . Reliable measurements were
limited to wavenumbers where the contribution by the weak, nearby bands
was considerably smaller than that by the distant lines. We have assumed
that K0 can be represented by a smooth curve drawn through the data points.
As pointed out in the discussion of Fig. 2 the portion o». the absorplance
between approximately 4000 and UOO cm that we have attributed to the
extreme wings of the strong lines probably represents a maximum. There-
fore, the curve In Fig. 8 also is believed to represent maximum values
throughout the same region. Values of KN could not be determined above Mm
-1 ' 3900 cm since the additional absorplance due to liunasinn the N,,
pressure in CO- + N mixtures was too small to measure.
o -1 Plots of K versus . In the 3800 cm reKion are shown tor various
broadening gases In Fig. 9. The curves corresponding to N,, 0,, iiml A
are close to each other near khe band head, as they are near 7000 cm
Also, as In the 7000 cm region, values represenU-d by the He curvi- are
only approximately one-tenth those represented by the sei I-broadeniiiK
curve. Data on H,; broadeninK are limited to the region between J770 ;iinl
3780 cm where the ah orpl ion by the 00. lines is larg« «.ompared to the
absorption by an H,, pressure-induced band. At higher wavenumbers t he
absorption by the II, band is too larne to be tCCOWItwl lor .uiuialely.
il

H'll I I I 1111111 I I jlllll | ' | mm i - '—fTTTTT
b o t
o To
c o IA •w U 0* n 01 £ 3 £ w X « c i ■ hi OJ c V M V 0> T3 c J3 > «0 I ■0 E U (A
«0 3
(A | JC <■) s
J: fl! o m
1 (fl tt E u u c <J C u I •#•4 u ■ o 0 IN
o —< a o
0. vt n V ♦J OJ u ■o m £
c ■o 4N
»i <B V c c > Q 0 •tN
IN X 3 p^ •o tA u rn 0*
(A O V C w E £ V J3 h H
3 ■ 0/
4J E • • 01 nj — «4 X- X ^^* i U) ---<
B E «j 0* IA 1 B 01 > (A p e u o H o —* 3 a ^ o —4 o
M '*- o: vt 01 1 o
^U T3 4-1 H ■ ^n C (A «pj AS *4-< 3 ^5 o • flj
ID a c C
u 0) •
Z o •r4
1 •P4
CO -4 1
ÜJ *-» u E
^ C ■ 3
U3 '»4 IM
• u
1 V •■-I U4 —4 B s b 0» <0 3 il 4J o E T- 0 c u (A (»1 X o
u c (A 01 50 o ••-4 > e ■ -H C
•H JC u (A X. c w a ■ «J 1 L c
T3 • » O •^4 o rj - -< (A ^-i oc o i .a u E e « ^. i
J3 o u
(N o E B M ■ ao > «* .^ r» b
T) r^ Oi H C •X >^ > HJ U JO X IN
o o 3 IM i-4 C u ^N 1 1 0
01 X JC •••4 o (fl «4 || X (« a w l- 0) p u 0 c Q o e
IM •-4 H I •M •—* '»4 x
0 ^t ^ M ■ T; «-*
£ I o c 4-t w £ —1
• o 4J ^3 X o ra |i
M E O IN 1 w u '-<
c a» £• 1 U HN 3 '_ X 1 fe "U ■ ^ a
I (diSUJ0 US\Ü)\\
32

I
•
^(^IJUO ujp)0>j
33
c (0
o
c o
y o
E U
o
00
-a ■
b
c •H c
■o
0
c
_ e
a E 0
■a | — 3
C 111 « 3 u it
^2
C | -a
u c
■ OJ c
o u
a u o m
4 ^^ .K -o y j W c 01 B H X ■^i
L| E V 0
k II £ H] o 3 01
m 3 O
•--l N ifl >
0
u:
10
c o •H 00 01 h
o
-a
H
a b o in
to -C
I u
00
c 10
I I

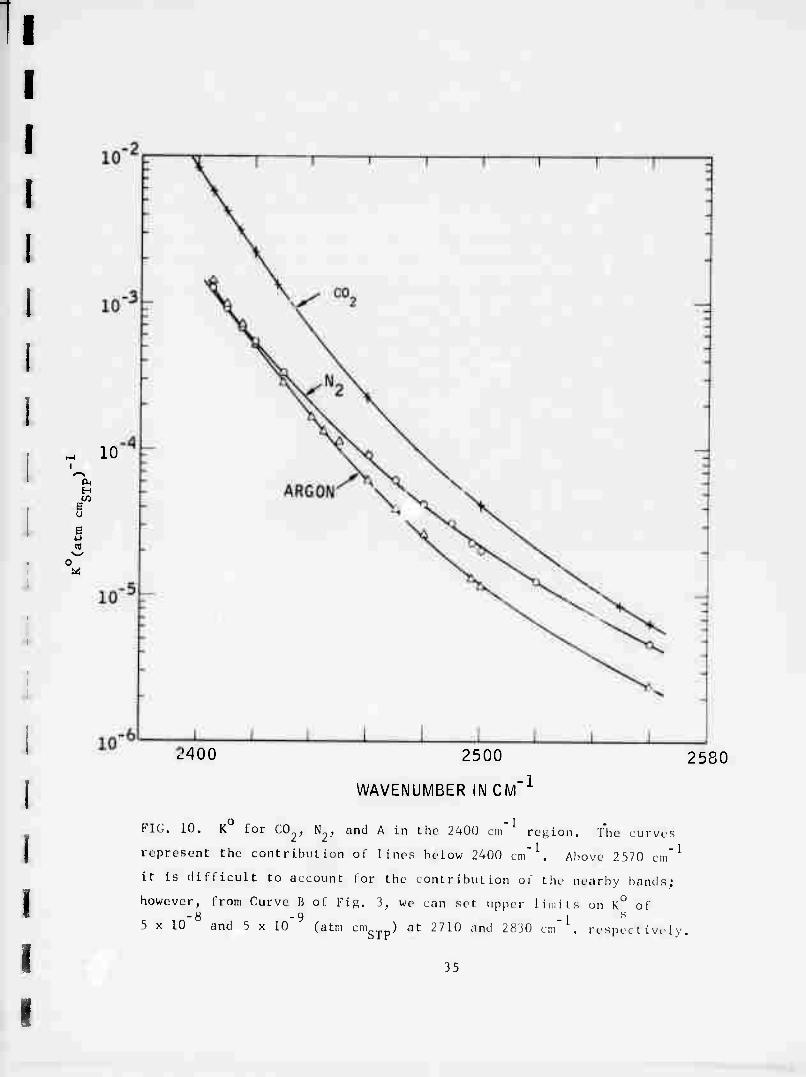
Figure 10 contains the curves of K in the 2400 cm region for C0?,
N„, and A. As in the 3800 cm region, the N9 and A curves are nearly
coincident near the band head. However, at higher wavenumbers, these two
curves diverge, with the N curve occurring above the one corresponding
to A. Also, as in the 3800 cm region, the N- curve approaches the CO
curve when the distance from the edge of the absorption b."nd is approxi-
mately 100-150 cm . The portion of the absorption due to the nearby bands
is ioo large to be accounted for accurately above 2570 cm . However,
from Curve B of Fig. 3, we can set upp«r limits on K of approximately
-8 -1 -1 -9 -1 5 x 10 (atm cm ) at 2710 cm and 5 x 10 ' (atm cm ) at
2830 cm'1.
I I I
..
34
I I I I
1
I
H 10
f E O
o
!400 2500 2580
WAVENUMBER IN CM x
FIG, 10. K for C02, $ , and A in the 2400 cm" region, The curves
represent the contribution of lines below 2400 cm* . Above 2570 tin''
it is difficult to account lor the contribution ol the nearby bands;
however, from Curve B of Fig, 3, we can set
Vrp
upper limits on K of -8-9 Is
5 x 10 and 5 x 10 ' (atra cmemw) at 2710 and 28J0 cm . respectively
35

CURVES OF X VS (VV ) o
Curves of* versus (v-.o) for several dlff«r«ttl l-roacUn i n« /ases are
shown in rtgl. il-14 lor the three dillerenl spectral regions investiKaled.
The curves have been derived 1rom experimental values oi K0 by tlM trial-
and-error method described previously. In most cases, values 01 k" calcu-
lated by substituting values I rom the \ curves into Bq. (11) av;ree with
the experimental values ol K0 to within two or three pei.enl. Plgur« 11
shows curves for sell broadening in the 7000 cm"1 rogiOO. Curve A
represents samples at room temperature, 296 K. while Curvis | and (
correspond to samples at 451 K. We had to assume values lor the hall-widlhs
of the lines at 431 K since this quantity was not measure.I. Curve | was
obtained Ironi the 431 K data by assuming that the hall-Udths ot t he
sell-broadened absorption lines vary inversely with temperature when the
pressure is kept constant. Curve C was derived iron, the same data as
Curve B, but the normal i/.ed half-widths were assumed to vary inversely as
the square-root ol the temperature.
36

I I I
s 3
o c H fl o
1- w ■ •o 01 •- •o 41 a 3 I 10 E o «0 a» >, c A *J — I 4i ■ IA 4* « u •H «J h< u 3 4» o ■ d > I O C
a» •-• i • ja > u t >, i r fa 3 f*4 X <o ■ w >
**4 u 3 (A 1 o X Q. *^ >. w ■ p4 "O 3 1 « 3 ■ 0 u 1 X a 4« w- H (A > ^ o •
4« fa
C fl
o •*< 0 Q - X
fl3 ^ M ■ o p
i- 1 ■ 3 i
^—N, ■4
i 1 c
••4 —
| I ec — X 1 o <« -
IT.
> -3 U 1 — c — o r^
U 3
1 c ■3 a
"^■^ U IB «9
o u ■
M • X —
^0 C
■ü 0 ■C
1 •- u it
1 ■ 1
^J 1 w c
^
C
—4
• II E
« 1 O w
o P^ 3 w
V. c X 0
ID 2 «0 fa V
•a ~3 a 3-1- ii E 1 C U C s ~ — 3 1 •-f —rf fQ W
"3 !3 w O 1« 1 X C U 0 'S 4< fa o i) <t CL
1 E X E p
'•-■ w IA W m^ <« *j «4 | | •" | - X v O
fa «5 3 wi 0 F fif
IM V,
0 ^. 0 «« # fa
y C
, E fa
5 - to p4 ir 1A X 3 P4 u
3 • ■ c U «B k • t
D - E
XXX M 9 M
o
t

Figure 12 shows the curves of \ versus (v-v ) for broadening by He,
C09, and N at room temperature and by N at 431JK. Calculated values
o cf K are only slightly dependent on the values ol X assumed for very
small and for large (v-. ). Tht-refore, the uncertainty of the end portions
of the curves of \ is greater than for the center portion. The regions
between the vertical dashed lines in Figs. 11-14 are probably accurate
to - 10 to 20 percent; outside the interval bounded by the lines, the
uncertainty may be considerably greater. Lines in all three spectral
. i
regions were assume«! to he Lorentzian (\ 1) when ( - ) • i cm lor o
sell broadening and when (.- ) < 0.5 cm lor loreign-gas broadening.
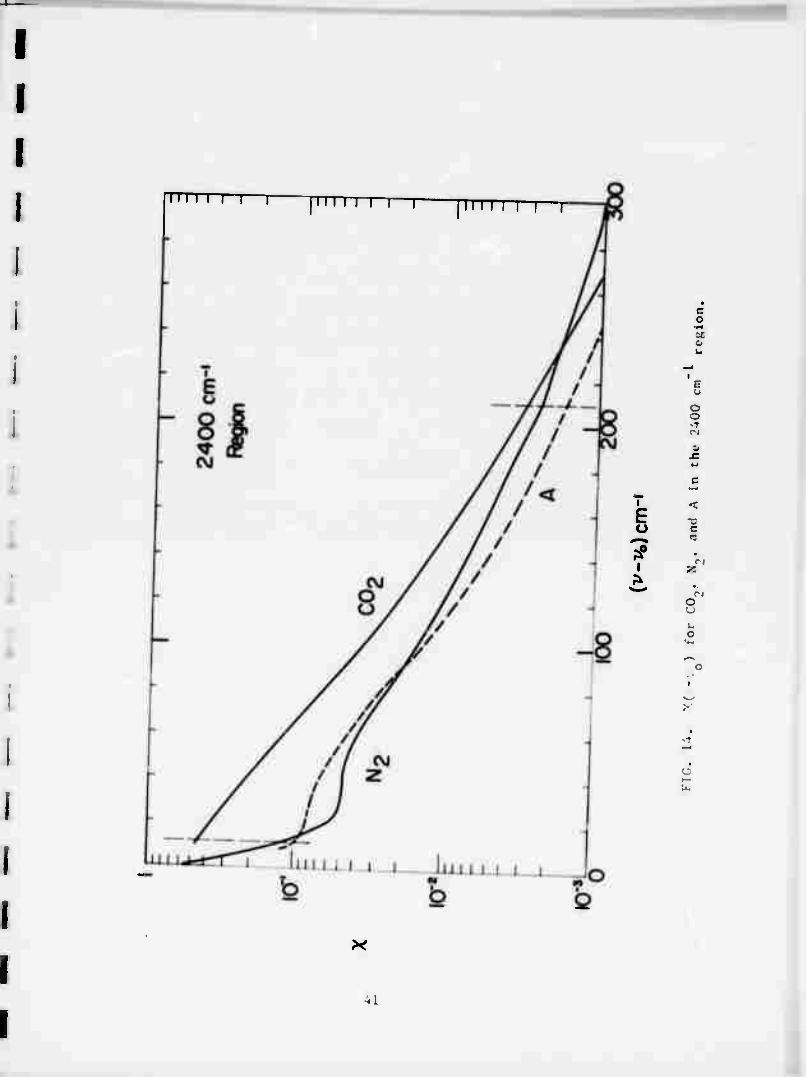
Figure li contains curves oi v versus (.-. ) lor sell broadening
and broadening by N and A in tin IMP m region. Since measurements
were made over a wider spectral r«giM tor pure 00. th.m lor mixtures,
the CO curve extends to larger ( - ) th.in do the otlur curves. W» / o
recall that tlu K cu ve in Fig. « is believed to represeiU maximum
values above jWO Lm . Siiut ■ lor ( - ) ureater th.m anproxim.Uelv o
200 ca is strongly dep.ndint upon K0 lor the I900»4t00 Oi" region,
the curve of "- lor (,- ) between 200 and 400 cm also prob.iblv repre-
sents maximum v.ihus ol this quantity, Figur« I ^ shows the turves oi •
for CO^, N , and A lor the 2400 cm region. The cinrv« lor sil I bro.iileninn
compan-s i.ivoribly with th< an.il vt ic.il cxpnssion |iv«n hv MSB lor the
same quant ity.
M I I

I I I ii 11 i i i—r ii i i i i i—r
u J 1 l_i_J L
o
LO
CVJ I
O
E
i
at c
c IT. o u
o E
> w 3 'J
«
C o
u
o o c
—< u ■ o b i -3 > I c -o — 3 >* u
C
C K I
III
-a i
u. c
it > u 3 o
-J O (J
c n -C — E «-
E | 0 '~ X c o
V II G C .JZ o «B «-' •-*
r< (5 0 sr x c
O 0 0 -
c
—
o u X !/. I c
u 0
a i-
If. «0
■
I ■/,
X
-
E
B B
u - 3 cr /
- J —'
c o •y.
u D.
O
I I I

r
i H 1 L
— i
e § OC M .
M | C £ O u -p
«1 c y
•«- c •** M O
X u T3 >, C -. fl —
»8 n «i <«-^ | w
M X C 1 1 E o O 1
—i —
•> o < u
^ 1 ■ i ri w.
& • N a o 3
D < >.
JO T3 c
T3 1 ■ C r 1 O
•P «i H 0 X u w £
■/. —
ft 1 C E
—• J —J
O V- '1 0 —
— o
.u
I I I
IN i i i i—r ["iii i i—| 111 ii i i ■]—r
E u
i
.1 G
CN
U 0
c u.
w

Before discussing further the results shown in Fins. 11-14, we will
consider some of the factors that influence the shapes of these curves.
Since all of the curves are based on half-widths given by Fig. 4, it is
of interest to determine how the X curves would be changed if we assumed
different values for the normalized hall-w.dths ol the absorption lines.
The solid curves in Fig. Ir) are the same as the corresponding curves lor
self broadening shown in Figs. 11 and b. The plus signs represent calcu-
lated values of K which are based on values of X given by the upper panel
and on line widths I rom Fi^;. 4. The squares plotted in the lower panel of
Fig. 15 correspond to calculated values ol K hased on the solid X curve
in the upper panel and on lines whose normalized half-widths, , are s
0.092 cm , the mean value based on the curves ol Fig. 4. Hi note that
the squares deviate signitleantly Irom the plus ligni only in the region
near the band head sinci a BigaiflcMl p.ul ot t hi .ihsorpt ion lu.ir tin
band head is due to nearby lines whose hal I-wiilt lis wt re assumed to be
approximately O.OM cm when calculating I be values representi I by plus
signs. A good portion ol the absorption in tins region is also due to the
much stronger lines. I " 10 to I " 20, whnh are « or > Oi* below the
band head. However, luvond approximately 1r) cm I rom the band head,
nearlv all ol the absorption is due to tbe Itroogcf lines whose ball-
widths art approximatelv the sain lor both .. a h ul.it ions.
Tbe broken portion ol tin curve in t lu upper panal Ol Fii;. I'j
represents the modiIii at ion in the ) eurve that is required to provide
agreement with the experimental values ol K il we assume that
.J

I I
X
10 -5
icr6i-
V icr7
10 -8 7000 7050 7100
\AAVENUMBER (cm'1)
FIC. 13. Intlucm« ol nssumcd lin«' wirlth on calculated CUfVCI
oi \(.-. ) nd K (v) in th«- /ooo sm region« Hi« curv< Ln th.
lowtr p;int I ri'prrs«nts I hi rxpor imi'nt nl n suits lor K < ). Thi
► •■ represent ihv v.ilues calculated on tlM basil ol lines whos.
X Is niven by the solid curve in the upper p.ini 1 iin<l whose li.iit-
widlhs arc |lVM hy Ki«. 4. ih« I- '• r» presi nt v.ilms calculated
on the basis of the s.ime "■ but with (».f)'».' lor .ill lines.
Values of K (.) based on lines with 0.042 ca and ■ Mldified s accpr«IinK to tke tlashetl curve agree with t h« < >;p« i ivient .il < urve
to within - 2 percent.
4J

o -1 a9 0.092 cm for all of the lines. The effect on the X curve for other
modifications in the values of r can be inferred from this curve. If all
values of ^ were increased by 107, for example, the carve of X would, of
course, be shifted down by the same factor.
We see from Table 2 that the band head in the 7000 cm"1 region occurs
at R40, which is only 5.6 cm" from Rib, the strongest line in the band.
By comparison the band head in the 2400 cm" rtgion occurs at R122 which
is more than 35 cm from llu strongest line Therefore, many weak lines
of high ,1 value contribute significantly to the absorption a lew cm'1
above the 2 597 cm band head since they are much closer than the strong
lines. Consequently, the shapes of the "■ curves lor the J4()() cm" region
are probably more dependent th.in the one lor the 700(1 cm'1 region upon the
hall-widths , ssumed 'or hiKh .) lines. Ihis is also true lor llu MOO on"1
region since the strongest lines are several cm" irom the region where
K has been ■•Mitred* s
The curves in !'ig. lb provide information about the ilependence ol
tin calculated values ol K on . (om-erselv, it also shows the variations
introduced in the curves ol > by errors or chMgM in the values ol K0
which are being matched. Curv.- A in the low. r panel oi lig. lh thtmt the
experimentally determined curv.' ol K" , whuh also app. a I n Kig. B lor
th. 1000 cm region. The circles in the lov.r panel whith lit the experi-
mental curve very Well lepr. •-. nt t lie valu.s ol K° caKulated on t h.
basis of the N curve «iven by A in t li. upper panel. Curve | in t h.
upper panel repr.sints | modiiication ol a portion ol Curve A In, ( - )
44

10"'EA
lO"2
IQ" 100 200
f-V.fenr) 300
i—i i i,
3800 3850
WAVENUMBTR (cm')
3900
FT«:. lh. Curvs of •> and K^ showing Indu.n, r ol .Tssum. ,1 lino
fihnpc on Ihr c .il, ul flted absofption cMfftctwM in tlM MQO . m''
r.'Kion. Curvr A in MM low.r p.tn.l t .pr.s.n. s . h.. .xprr i.mnt ..I
r.Milts lor KN . Thr ctrclM r.'pr.'s.-nl th». valu.s C«le«Ut«l on
Ihr I... is of a'line shapo whosr V !„ Klv<.n l)y rurV(1 A JM , h(
upp.r pantl. Varlallons in l hf I i n«. sh.ipr Riv.n l-v Curves H. C,
P. .ind K in Ihr upp.r pan.-l MMT« assum.-.l, «ml I hr . or rrspoml i n«
MlCMUt«^ curves of K° an shown in th,- low.r p.-.n.l. 1 h. six
vrtical lin.s f., ihr l^w. r panel In.licnt,. Ihr wav.numb.rs at which
••xprr imental mcasurcmrnt s MM made.
Ub
r
' 60 cm ; Curve B In the lower panel represents the resulting calculated
values of K . We see that the modification to lh>' line shape for (v-v ) Mm O
leBu then 5 and 60 cm produces only a relatively small change In the
calculated values of K° between 3770 and 3780 cm" . Krom this result we 2
conclude that much of the absorption in this region is due to lines more
than 60 cm away, although many lines -»ccur within this distance. Above
-I 3800 cm the modification represented by Curve B in tin upper panel
provides no ■Ignificant chanue in the K curve.
Similarly, the curves marked "C" in both panels of Fig. lh indicate
the influence ot I f|uitc different modi i icat ion to the Y curve lor ( - ) o
• 60 cm . Ot course, mod i I ic.it ions li and (' do not affect the calculated
. o - j values ol K^ more than 60 cm above the lughest-wavtnumber lines being
considered. The rather major ciuinge Indicated by Curve C provides a
sizable change in the calculated values ot K° between i77() and )7H() c«
since the relative contribution ol 1 hi ne.irbv, weak lines is increased.
The C curves are based on a Lorentl line shape lor ( - ) ■ l() cm with 0 —
I sudden decrease in the absorption coefficient as ( •■ ) increases. 1 he
quite lignificent difference between curves A ami c in tin lower panel ol
fig» lb is evidence thai ll.>broadened linei arc lub^Lorentsian within
l" CM ol tlu i r centers.
The modification represented by curve D for 60 cm* • ( - ) ■ ISO cm* o
is seen to Influence the calculated values ol K fron epproximately i790
-1 H2 to 1880 cm , K'e believe that the difference between Curvei A and D in
the lower panel is less than the uncertaint) oi tin evp.r iment.il K"
46

values obtained in this region. Curve E illustrates the effect of quite
a large change in X for large tv-V#>. We see that the calculated values
o -1 of K^ below 3800 cm are not influenced significantly by this modifica-
tion, indicating that most of the absorption in this region is due to
lines within 60 cm
We see from Fig. 16 that errors of 15 or 20 percent in the values of
KN might cause a significant change in the shape of the resulting curve
of X, although X at any value of (v-vo) might not be changed greatly. For
example, if the measured values of K^ fell on Curve B at 3770 and J780 cm'1
-I2
and on Curve D at 3815 and 3850 cm , the corresponding X curve would fall
on Curve I in the upper panel for (v-v ) • 60 cm"1 and on Curve D for
60 < (v-Vo) ■ 150 cm" . Beyond (v-vO 150 cm"1, the derived curve would
fall on the existing Curve A. Thus, relatively small errors in the
measurement of K° may cause quite a difference in the shape ol the X
curve. Therefore, we must be careful not to place too much significance
on the shape of the X curve, although the KVcrage value of the curve over
relatively wide ranges can he considered reasonably accurate.
We will now return to a discussion of the results shown in Flgt, 11-14.
In Curve A ot Fig, 11, which represents self broadening ol CO in the
7000 cm ' region, X appears to reach a minimum when (.- ) ^ 1.' cm"1 and o
to increase slightly before attaining I maxiniuin at epproxlmately 60 cm"1.
In view of the discussion of Fig. 16, we conclude, that the minimum near
12 cm and the maximum near 60 cm" may or may not be reel. However it
is signiticant that the average X throughout this region is between 0.5
and O.d.
o
4 7

According to the simple, classical theory, the half-width of a
collision-broadened line is proportional to collision frequency and,
therefore, inversely proportional to the square-root of temperature, 9,
-1/2 if the pressure is constant. This 0 ' dependence is usually regarded
as approximately correct for foreign broadening; however, various experi-
mental and theoretical results indicate that for self-broadening the
dependence on temperature may be as strong as 0
Curves B and C of Fig. 11 show the N functions we obtained by
— 1 -1 /? assuming a 0 and 0 " dependence of 1 . The Influence of temperature
s '
on line strengths was accounted for in the calculations. Values on
Curve B, which corresponds to a 0 dependence, an- only about 0,6 as
large as the room temperacurc values (Curve A) for the same (v-V ). If o
a weaker temperature dependence is assumed, the deviation Irani Curve A
is even greater. Thus, it is apparent that increasing temperature changes
the line shapes witli a marked decrease in the extreme wingB,
The curve corresponding to N at 43l0K in Fig. 12 also falls well
below the room temperature curve. The Vil'K curve is based on the 0 '2
. , . o -1 dependence ol . No curve corresponding to the 8 ' relationship is shown
for N2 broadening, since this relationship is expected to apply to sell"
broadening only. Because of turbulence in the samples at high pressure and
431°K, we were limited to somewhat smaller samples than at room temperature,
Consequently, we could not make reliable measurements &e far above the
band head at the elevated temperature, and the > curves are limited to
smaller (v-. ). o
48

I I 1
Ife
i I I
A few measurements at elevated temperatures were made in the 3800 cm
region. However, the absorption by the nearby weak bands increased so
rapidly with increasing temperature that the contribution by the extreme
wings of the distant lines could not be measured accurately. Most of the
lower energy levels involved in the weak bands above 3760 cm are excited,
so that their populations, and, in turn, the band strengths increase with
increasing temperature. However, in spite of the increased absorption by
the weak bands, the absorption near 3850 and 3900 cm' remained approxi-
mately constant. From this result we concluded that the absorption by the
extreme wings of the strong lines decreased with increasing temperature,
as in the 7000 cm region.
We note that the N2 curve in Fig. 12 drops very rapidly to approxi-
mately 0.06 at (V-V ) 25 cm . In accordance with the discussion of
Fig. 5, we have assumed that the Lorentz line shape was valid (X 1) for
N2 for (v-Vo) < 0.5. Our results do not enable us to determine reliably
the curves of X for 0.5 « CwJ < 3 cm" , and conversely, our calculated
values of K are relatively insensitive to the values of > assumed for
this region. However, it is apparent from our data that X is as low as
approximately 0.3 for (v-v ) 5 cm' . Although the curve lor sell
broadening is sub-Lorentzian, it does not decrease as quickly as the curve
corresponding to N,, broadening. The He curve decreases even faster than
the N curve, reaching approximately 0.08 for (■,-'. ) 5 cm" . Both the z o
He and N9 curves appear to have an approximatelylevel portion after the
first sudden decrease, although these level portions do not cover as large
49
a range of values of (v-v ) as does the level portion of the self-broadening o
curve. Evidence for the large difference between the wings of He- and
N -broadened lines was mentioned in the discussion of Fig. 2.
As in the 7000 cm region, the N? curve falls well below the self-
broadening curve for the 3800 cm region in Fig. 13. However, the two
curves tend to approach each other for very large (v-v ). This phenomenon
was not observable in the 7000 cm region, possibly because N9 measurements
could not be made for sufficiently large (v-v ). The curves for A, 0 , and
N„ are similar for (v-v ) • 100 cm , but for larger values the N„ curve I o I
falls above the other two. Also, as in the 7000 cm region, the He curve
falls well below the N„ curve and is similar to the K. curve, which is
based on limited data. Thus, H,,, which is a relatively efficient broadener
near the line centers (Table 2), is verv inefficient 'or (.-. ) more than o
a few cm
Figure 14 contains similar curves lor the 2400 cm region. As in the
7000 cm the N curve ialls considerably below the CO., curve then approaches
it as (v-v ) increases. The apparent crossing ol these two curves near
(v-v ) 230 cm may not be signiticant because of the large uncertainty
in the curves near and beyond the crossing point. However, the sudden
increase and the gradual decrease in the separation ot the CO and N9
curves is probably significant. The relative shapes of the N9 and A curves
are also similar in the JK0O and 2400 cm regions. Ihe A curve lies above
the N curve throughout most of ' !■ region for ( -, ) • 90 cm , but bevond
this point their jositions are reversed.
SO

I 5
I I
I
I
I i
i
i
It is of Interest that the curves corresponding to the two light
molecules, He and H_, are similar and both are quite different from those
representing the heavier molecules. The broadening by these two gases
appears to be similar in the extreme wings, although H2 is a diatomic
molecule and He is monatomic. It is apparent from the great divergence
of the X curves corresponding to the various gasts that the mechanism
involved in the broadening of lines several cm from their centers is
quite different from the mechanism producing the broadening near the centers.
The broadening of the extreme wings is more strongly dependent upon the
broadening gas.
The results for He and H suggest that broadening in the extreme
wings may result from collisions with relatively slow-tnovinv molecules
since the number of slow H- and He molecules is much less than lor heavier
molecules at the same temperature. Further support lor this sugnt'Stion is
provided by the decrease in absorption by the wings oi the lints as the
temperature increeses and the nui.iber of slow-moving molecules dein.ises.
Of course, there are insufficient data lure to prove conclusively thiil the
extreme wings are due to collisions with slow molecules; however, the
widely accepted belief that they result trom the very hard collisions does
not appear to be justified. II broadening in the extreme wings is, in
fact, due to slow molecules, the amount of broadening may depend strt ,>;ly
i on the amount ol tine the two colliding molecules remain within a certain
. distance, rather than on the distance 01 closest approach.
I I I
H

Argon was investigated s'nce it is monatomic and heavier than either
N2 0r 02* In vlew of it8 fl"1'6 different physical characteristics, it is
surprising that its hehavior as a broadening gas is so similar to that of
02. Since the molecular weight of A is approximately the same as that of
C02, it is apparent that the broadening mechanism in the extreme wings
cannot be explained by the molecular weights alone. It is well known12
that the half-widths of lines depend on the dipole and quadrupole moments
of the colliding molecules, so that a knowledge ol th. masses and shapes
of the molecules is not sufficient to predict the broadening characteristics.
However, most ol the present theories deal with half-widths ; nd shapes ne.-.r
line centers; very little work has dealt with thr shapes 01 the extreme
wings.
In order to compare the shapes of the lines in the ditierenl spectral
renlons and to show tlM line shapes lor sever.il diffcTMl broadening gases.
we have constructed the curves in Figs. 17 and lH. The quantllv k is ma x
the absorption coefficient at the center ol | Lorenl/ line with 0.1 cm"1.
which Is typical o! | sei I-broadened CO^, lim at slightly more than I atm.
Log-log plots have been used in order to represent the UNTMU shape by a
straight line when (vv#) X . Kach decade has been made twice as Ion«
on the abscissa as on the Ordinate so that the curves are not as steep as
they would be otherwise. Fach curve was obtained by multiplying the
Lorcntz curve by the appropriate value of • fron» Ptg«, 11, 1J. .md U.
Figure 17 shows the- ratio k/k^ plotted versus (.- J for sei I-broadened
lines in the three spectral regions indicated. Mt see that the curves
52

f max
10-3
IQ"4
10-5
10-6
10-7
10-8
IO-9
lO-K)
^ SELF
\\N BROADENING
^ N\^\r 7000 7000 N\V
_ (43i'K) \^V \ LORENTZ
10 100
p-U (cm-') FTC. 17. Ratio k/k vorsus (.-, ) for sol t-broatlcnnl
max o lint-s In thriT spinlral nylons. Th«- turves corrcsporul
to a Lort-ntz line ind to lines in the wavenumh» r regions
imliiat eil. The absorption coefliiient at the tenter of
a Lorent/. line with 1 0.1 cm is represented by k
The curve which represents a sample at -• U "K is based on
a line whose strength is the same at 4 U ^K as at ^SJb'K
with k equal to the absorption coeffitient at the max
center ot the line when the sample is at 29h*K.
51
I I 1
10-3
lO"»
10-5
N2 \\ \ BROADENING
7000
Ar '
Nv\v BROADENING
k max
t IS 10-6 (- 7000 \s (43I0K)
10-7
10-8
10-9
lO-'O 10
v-Po (cm-1) *'-H (cm-' )
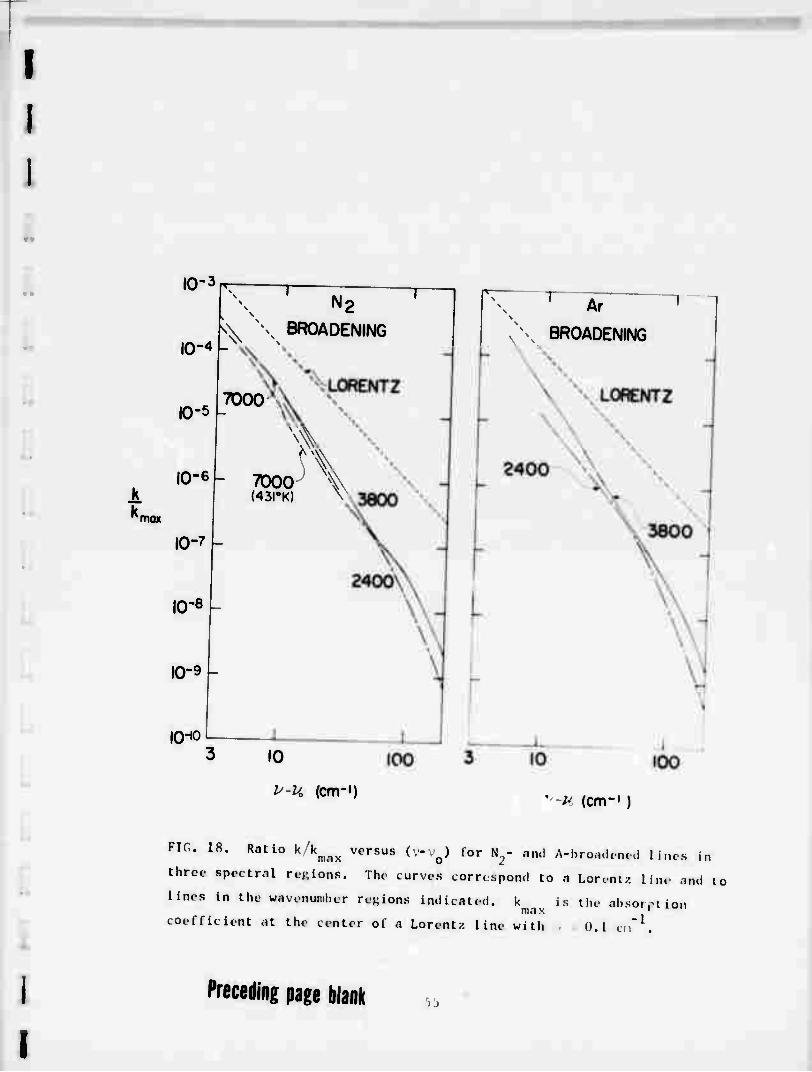
flQ, 18. Ratio k'k^^ versus (v-V0) tor N,- «ad A-hrondcn. .1 li.us in
three spettr.il rewions. The curves corr. sporn! to a Lor.nt/. lin, ..ml to
lines in the w.ivenumber regions indicated. k is the ■bMrvtioa max i i «ii
coefficient at the center ol a Lorentz line with 0.1 en
Preceding page blank
i
r
the order of increasing wavenumber. This phenomenon may be based on the
ratio of the period 01 the electromagnetic waves to the time the collidinK
molecules are within a certain distance.
,h

INFLUENCE OF * ON CALCrLATEI) LINE STRENCTH
It is apparent that if X is l(?ss than unitv lor all ( - ), Ea. (4) o
cannot he satisfied exactly, ami the line strenWth S «iven hy Eq. (r)) will
depeml on pressure and on the hroadenin« «as. Experience has shown us
that line strengths are not functions ot pressure or broadening gas;
therefore, we must consider the valiiiity 01 the method used to derive the
curves of \ versus (vv0) with respect to the condition 01 COMtMl line
strength. If pressures are low and is many times less than the minimum
value ot ( -,o) for which ■ • 1. the integral ol the right hand side ol
Eq. (8) is barely changed whin the non-unity values 01 X are included.
However, il is larger, the inlluenceol subst i l in i,^ v i11to |.:ij# (H) is
not negliKible.
This phenomenon is illustrated in Fig, 19, where ( urve A represents
a LOTMtl line with 1 em , which corresponds to a tvpual seit-
broadened line at a pressure ol anproximatelv 10 atm. Curve | r.presents
V
V
1.0
o E
-^ 0.5
—i 1 r T ! i 1 "T I
■ 1 -
" 1 " 1° " i ' M ■ A\
\
r ! i [ p - v - \\
c\\\ \ \ \ * *
0 (V-K)cm-'
10
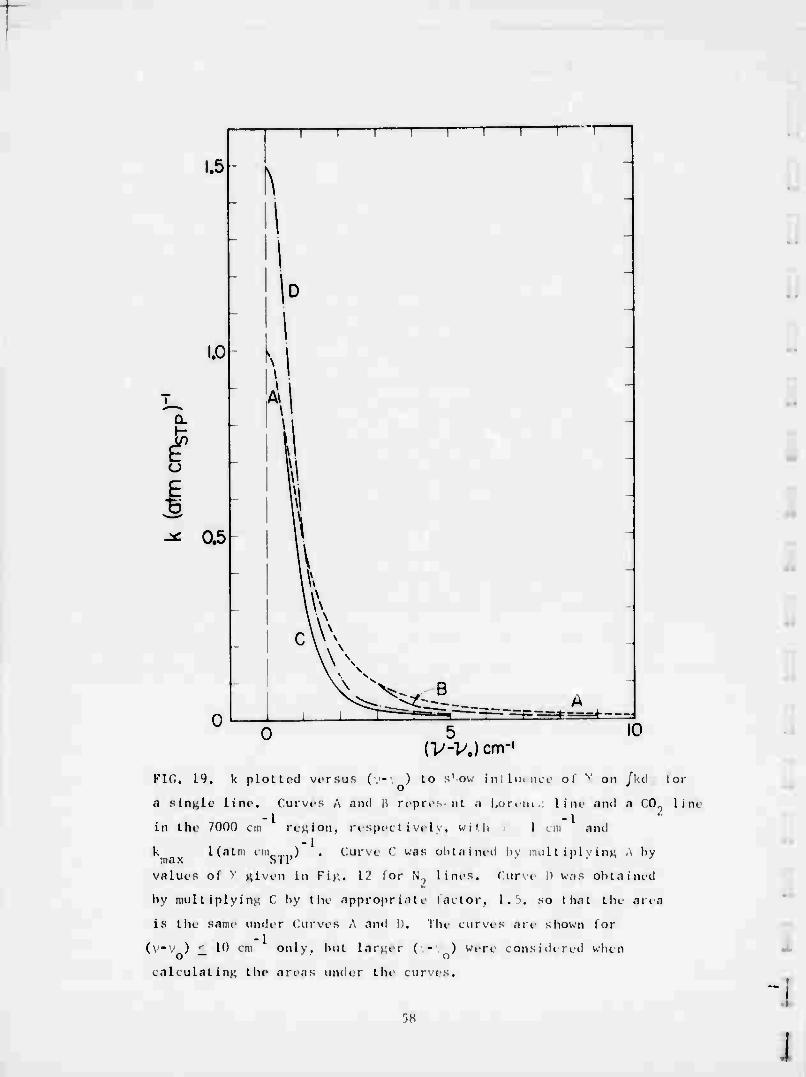
FIT,. 14. k plotted versus (.-. ) to s'ov, lnfluenc< oi > on /lui loi
a sin^lr line. Curvci A and B riprisnt ■ l,i>r.iii. Line ■nd I CO., lii
in thf 7000 cm itv;ion, n spte t i VTIV, With I i in and
k l(atni im,,.,,) . Curve C was obtained by multiplyina A bv max S11' '
valui's ot v ^iviti in Pig. 12 tor N. lints. Curv« I' was obtained
by multiplvinn (' by the appiopri.it. laitor. 1 . >. so that tin ai . a
is tin' satm- under Curvea A and !'. The curvci are shown I or
(\—v ) ■ 1" cm onlv. but Larger ( - ) were considered when o — o calculating the areas und« r the curves«
r)8 ■i
i

the absorption coefficient of such a line after it has been modified accord-
ing to the curve of X versus (w ) for a self-broadened CO line in the
7000 cm region. Curve B is coincident with Curve A for (v-v ) < 3 cm'1. o
We see that the area under Curve B, which represents the Jkd >, is not
greatly different from that under Curve A, so that the factor / in Eq. (8)
has only a moderate influence on the line strength. Approximately 0.065
of the total /kdv for a Lorentz line occurs for (v-v > 10 ., the distance
to which the curves in Fig. 19 have been drawn. Curve C represents an
N2-broadened line with , 1 cm'1 after it has been modified according to
the curve of X for N,, broadening in the 7000 cm"1 region. The area under
Curve C is only two-thirds the area under Curve A. Therefore, it is
apparent that the profile over all values of (vv#) cannot be «iven by
Eq. (8) with X a function of (vv#) only if the strength of the line is
independent of pressure.
Since Eq. (8) is not appropriate for all conditions, we will consider
the applicability of a slightly more complex relationship to a wider range
of - and (v-v ). We define o
TO, -) /kdv/jk. ■■(■.'-•• )d., L O
where ^ corresponds to ■ LorcU^ line. For | BivM ■unction and ■ Kivcn
t, the afsorption coefficient due to a sin^le 1 in. is «iven bv
kL(''' ^-V- (13)
59

r
The quantity •. O, ,) is adjusted so that /k(v) is independent of pressure
or broadening gas. Since v i 1, q» must be > I and increase with increasing
n. In the example of the N^-broadened line given in the preceding paragraph,
qp is 1 T 2/3 1.5, and k is represented by Curve I), which was obtained by
multiplying the values in Curve A by 1.5.
A test of the validity of F.v. (13) lor a region including strong lines
was made from measurements on several samples in the R-branch of the 10 1
band from approximately 3720 to 3740 cm" . The integral ol the observed
absorption coefficient, /kdv, over this region was found to be the same,
within 2 or 37 experimental error, whether the lines were self-broadened,
N2-broadcned, or He-broadened. Furthermore, this quantity was essentially
the same for samples at | atm as at 13 atm, induating that the sum ol the
strengths of all ol the lines is independent oi the brMdmlng |M or the
pressure, as assumed.
We assumed that Kq. (13) was valid and caKul,-)ied k and /kd-. over the
3720-3740 cr.i region lor sample parameters torri spondiiiK to the samples
of pure CG2, CO,, • N., and CO,, I He stuff i'd. V.üues ol • i rom Pig, 13 were
included in the calculati :. and the appropriate values ol (•, ) were
determined for substitution into Kq. (13) by the procedure followed in
obtaining Curve 1) of Pig, 19. The agreement between the MlcilUUd and
observed values was good, indicating that Kq. (li) could be jsed in •
region where the .ihsorpt ion is due to nearby, strong lines. The calculnted
values were also essentially the same as those cnKul.ited lor the s.ime
samples on the assumption that the LOTMItl shape was valid. This amvirent
bO

lack of dependence on line shape occurs because essentially all absorption
in this region (3720-3740 cm ) is due to nearby lines and, therefore,
independent of the shape of the extreme wings, provided /kdv within a few
cm of the center for each line remains constant.
If the relationship given by Eq. (13) is valid, the absorption coef-
ficient in the extreme wings of lines must increase more than linearly
with pressure. For example, - for a typical N -broadened line at 1 atm,
is approximately 0.08 cm , and the Lorentz line shape is valid for (v-v ) o
less than approximately 7 .. Therefore, the modification brought about by
multiplying by ' for (v-V#) v 0.5 cm" causes only a small change in /kdv,
and fa 1. But, as we have shown immediately above, at approximately
12 atm the half-width is 1 cm' and r 1.5. Therefore, if Eq. (13) is
valid, k in the extreme wings of the line is 1,5 x 12 = 18 times as great for
12 atm as for 1 atm. We have .ii^asured the absorption coefficient for both
self and N2 broadening for samples covering wide ranges of pressure and
have found no such super-linear relationship between absorption coefficient
and pressure. All of our results indicate that the absorption coefficient
increases linearly with pressure when the absorption is due to lines whose
centers occur at a distance of several half-widths. Thereiore, we conclude
that the absorption coeffii icnt in the wings cannot be represented properly
by Eo. (13).
Most of the discussion in this section has applied to situations in
which - is not a small fr.'ction ol the minimum value ot ( -• ) at which o
there is significant deviation from the Lorentz shapi. Inder these situa-
tions we find that Eq. (8) is not valid if we assume that "• is a I'mction
hi

of (v-Vo) only. We have found further that the shape of the extreme wings
cannot be represented by Eq. (13). More information than can be obtained
by the methods used in the present study are required before the shapes of
lines within approximately 5 cm of their centers can be understood.
However, it should be noted that Eq. (8) is applicable with X a function
of (v"v0) when this quantity is more than a few cm" and pressures are
less than 1 or 2 atm. As the pressure increases this relationship is still
appropriate if (v-v ) is several times as great as ,.
b2 i t
i
SUGGESTED FURTHER WORK
The need for several additional expcrimcnts is apparenl from the
results and the conclusions which can b« drawn ahout t lie shapes ol 00,
absorption lines. Similar experiments ihould In done for absorption
bands of gases such as CO or N^O which have tuffli ienils ihcrp band luails
that wing absorption can be measured without i Kctllive Interference by
nearby lines. Additional inlormalion could be obteined from simiiar
measurements near (^-brandies ol sever.;l Kases, Including 00, near 570 cm'
The stronger-tban-expected dependence ol wing absorption on tempera-
ture needs further investigation over wider temperature raiiKes, above ami
below room temperature. Additional knowledge about the influence ot
temperature is required in order to make reliable calculations ol heat
transfer in atmospheres which contain considerable ('07, such as Mars and
Venus. Measurements of the absorption near H7 5 cm by the extreme wingl
of lines at lower wavenumbers lor luKh-pressure samples night also provide
I I
63

additional information about the previously unexpected dependence of wing
absorption on wavenumber. On the basis of comparisons made in Figs. 17 and
18, we expect the wings of the distant lines contributing to the absorption
near 875 cm to deviate even further than the lines included in the present
study from the Lorentz shape. The very weak absorption by the wings of
lines broadened by H- and He is surprising and should be investigated
further in other spectral regions and with other absorbing gases.
The present investigation has provided little more than qualitative
information about the shapes of lines between 0.5 and 5 cm" from their
centers. The region near tht- band head at 6988.56 cm" could provide
additional information for this portion of the lines if measurements were
made with spectra] slitwidths less than approximately 0,03 cm"1, which is
considerably narrower than we could attain. Wavenumber accuracy of approxi-
mately 0.01 cm would also be required. With these experimental conditions
the half-widths of the lines very near the band head could be measured and
their contribution to the absorption just above the band head could be
determined much more accurately than has been done in the present study.
Spectral scans made with very good resolution over regions containing
lines could also provide valuable information about the relative shapes of
lines within a few tenths of a cm from their centers when broadened by
different gases. The method illustrated by Fig. 5 in which two samples
with different broadening «ases, but the same absorber thickness, are
employed can provide a direct comparison of the shapes of lines broadened
by different gaici without accounting lor the distortion of the spectr;il
curve because of finite spectral slitwidth.
64

All of the results obtained in the present study for the extreme
wings of lines relate to the high-wavenumber side of the line centers
(v > vo). Since band heads are formed on the high-wavenumber sidus of
C02 bands, regions where most of the absorption results from distant
lines occur above the line centers. There are no places in the spectrum
where most of the absorption is due to the extreme wings of lines at
higher wavenumbers. However, by making careful measuremcnls on the low
wavenumber sides of some ol the bands for samples at several ntm pressure,
one could probably account for thu nearby lines with sulficitnt accuracy
to estimate the contribution due to stronger, distant lines. The shapes
of the low-wavenumber sides of the lines (v • V ) could not be detcrmimd o
as accurately as the high-wavenumber sides have been; however, certain
limits on the possible asymmetry of the lines could be established.
Measurements of this type might be made more accurately with .jmples
containing a single isotoplc species In order to reduce the contribution
of weak isotoplc lines which occur where the absorption would he measured.
19 1 h Since the most common Isotope, C 02 , Is lighter than tin other isotopes
of significant abundance, the Isotoplc bands usually occur on the low-
wavenumber side of the stronger C 0« bands with the same transitions.
Cooling the samples to reduce the contribution hy dillerence hands mid
by high J value lines would probably make more accurate measurements
possible.
65
RF.FERKNCKS
1. A. A. Michelson, Astrophys. ,1. 1, 2 51 (1H95).
2. W. S. Benedict, R. Herman, C. E. Moore. woA S. Silverman. Can. ).
Phys. _}4, 830 and 850 (19%).
3. W. S. Benedict, R. Herman. Gt E. Moore, and S. Silverman. Astrophys.
,1. 13S. No. 1, 277 (IM2).
4. B. H. Winters, S. Silverman, ami W. S. Benedict, I. ouanl. Spectry
Radiative Transfer 4, 527 (19h4).
5. I). E. Burch, I). A. Cryvnak, and K. K. Patty. I. Opt. Soc. Am. _57,
885 (1967).
6. G. Herzberg, Molecular Spectra and Molecular St rue tun 11. Infrared
and Raman Spectra ol Polyatomic Molecules (I). Van Nostr.ind ( o. . Inc.,
Princeton, New Jersey, Ninth Printing 1960).
7. L. I). Cray and .1. E. SdvldgC, .1. Quant. Spcctrv Radiative 'IransUr
j>, 291 (1965).
8. I). E. Burch, 1). A. Cryvnak, and R. R. Patty, I. Opt. Soc. Am.
33 5 (1968).
66

I I I I
I I
REFERENCES (Continuetl)
9. R. P. Madden, J. Chem. Phys. 35, 2083 (1961).
10. D. E. Burch, E. B. Singleton, and I). Williams, Appl. Opt. 1. 359 (tM2)t
U. R. R. Patty, E. R. Manrln«, and J. A. Gardner, J, Opt. Soc. Am. (In press).
12. P. W. Anderson, Phys. Rev. 2^, 647 (1949).
67

UNCLASSIFIED I Security CUssification
DOCUMENT CONTROL DATA • RAD (Saeurlly elm»tlllcmiicn ol »ill» body ol mbtltmcl and ind««in< annolafion mua) 6» tmtrmd »*tmn iht ovmnll upon ■• cltinlitd)
I ONICINATINC ACTIWI'V ^Corporal« «ufhor;
Advanced Developirent Operation Aeronutronlc Division Philco-Ford Corporation
<• nCPOHT ((CUK'TV C l.*t«IFtC«TION
Unclassified 16 snouP
1 HiPOUT TITUB
The Shades of Collision-Broadened C0? Lines
« DCSCMIPTIve NOTES iTvp» ol npori mnd Inclutlv daimt)
Scientific Report
I AUJHOn(S) (Lm»i nam«. Urn nmm* Inlllml)
Burch, jarrell E. Gryvnak, David A.
Patty, Richard R. Bartky, Charlotte E.
• MC PORT DATE
31 August 1%H 7* TOTAL NO OF PASES
67 • • CONTRACT OH CHANT NO
NOnr 3 560(00) b. PHOJBCT NO
10 A VA IL ABILITY/LIMITATION NOTICES
76 NO or mcr%
12
fa oniaiNATon-i REPORT NuMacnrSj
U-320 3
t6 OTHin REPORT NOCJ; (Any oihttnumbmn Mat may 6a aaaftfiad ihli impo'O
11 SUPPLEMENTARY NOTES 12 SPONSORING MILITARY ACTIVITY
13 ABSTRACT
The shapes of the extreme wings of seif-hrcadened CO lines have been investigated in three spectral regions near 7000, 38o0, and 2400 cm"1. Absorption measurements have been made on the high wavenumber sides of band heads where much of the absorption by samples at a few atm is due to the extreme wings of strong lines whose centers occur below the band heads. Considerable new information has been obtained about the shapes of self-broadened CO- lines as well as C0„ lines broadened by ti , 0-, A, He, and U . Beyond a few cm"1 from the line centers all the lines absorb considerably less than Lorentz-shaped lines having the same half-widths. The deviation from the Lorentz shape decreases with increasing wavenumber in going from one of the three spectral regions to the next. The absorption by the wings of H-- and He-broadened lines is particularly low, and the absorption decreases with increasing temperature at a faster rate than predicted by existing theories.
DD FORM I JAN 64 1473
-68< UNCLASSIFIED
Security Classification

UNCLASSIFIED Secunty Classification
i« KEY WORDS
co2
Line Shape
Line Broadening
LINK A
>LE ' MT
LINK B
of .^o!1J'A1?NG A",V,rY: E"'" 'he n.me .nd address of the contraclor, tubcomractor, «rantee. Departmenl of De- fenae activity or other orgamiation (co^o.ale ,u,ho,) ,»sUi„K me rrport. ■
In « EP?RT, SEC,UMTY CLASSIFICATION: Enter the over- all security clasa.ficat.on of the report. Indicate whether
Re.tr.cted Data" is .ncluded. Mark.ng is to be .n accord- ance with appropriate security regulation».
JÜLÜfuS1 ,nAU,Tr,,C ^,*nK'»d'"8 '* specif.ed in DoD Di- rective 5200. 10 and Armed Forces Industrial Manual. Knter the group number. Also, when appluable, show that optional markings have been used for Group J and Group 4 as author-
3. REPORT TITLE; Enter the complete report title in all capital letters. Titles in all cases should be unclassified. If a meaningful title cannot be selected without classifica- tion, show title classification in all capitals n parenthesis immediately following the title.
4. DESCRIPTIVE NOTES: If appropriate, enter the type of report, e.g.. interim, progress, summary, annual, or final. Give the inclusive dates when a specific reporting period is covered.
5. AUTHORS): Enter the name(s) of authors) as shown on or in the report. Entei tast name, first name, middle initial. If xilitary. show rank nnd branch of service. The name of the principal u .thor is an absolute minimum requirement.
6. REPORT DATL. Enter the date of the report as day month, year, or month, year. If more than one date appears on the report, use dale of publication.
7a. TOTAL NUMBER OF PAGES: The total page count shou.d follow normal pagination procedures, i.e., enter the number of pages containing information.
76, NUMUER OF REFERENCES: Enter the total number of references cited in the report.
8a, CONTRACT OR GRANT NUMUKK: If appropr.ale. enter the applicable number of the contract or ^ranl under which the report was written.
8b 8c, & 8d. PROJECT NUMBER: Knler the appropriate military department identification, such as project number subproject number, systen numbers, task number, etc.
9a, ORIGINATORS REPCRT NUMBK.R(S): Enter the offi- cial report number by which the document vill be identified and controlled by the originating activil,, This number must be unique to thir, report.
96, OTHER REPORT NUMBERS): It the report has been assigned any other report numbers (VIIIUT hy ll„- originator or by the sponsor), also enter this numl)er(s).
AVAILABILITY/LIMITATION NOTICES: Enter any l.m-
INSTRUCTIONS
LINK C
LuCh'«: by SecUri,y ''"""'nation, using standard statements
(1)
(2)
(3)
(4)
(S)
"Qualified requesters may obtain copies of this report from DDC"
"Foreign announcement and dissemination of this report by DDC is not authorized,"
"U, S. Government agencies may obtain copies of t . report directly from DDC. Other qualified DDC users shal' request through
"U, S, miltary agencies mav obtain copies of this report dire, tly from DDC Other qualified users shall request through
"All distribution of this report is controlled. Qual- ified DDC users shall request through
10. ., _ , .,v,, lv mm r,n,(.r anv lm. nations on further dissemination of the report, other than those
If the report has hrvn furnished I, the Office of Technical Services, Department of Commerce, for sale to the public .,,di- cale this fact and enter the price, if known.
11. SUPPLEMENTARY NOTES: Use for addM.onal explana- lory notes.
12. SPONSORING MILITARY ACTIVITY: Enter the name of the departmental project office or laboratory sponsoring (pay* •ng lor) the research and development. Include address.
1' ABSTRACT; Enter an abstract giving a brief and factual summary of the document indicative of the report, even thouth
1 V9U%1^*^,. •'•••*•*• ,n *• body of the technical re Z[„l.f !, 0na, SP," e ,S '"W*- " <ont.nuation sheet shall
It in highiy des.rable that the abstract of classified reports be unclassif.ed Each paragraph of the abstract shall end wMh an indication of the military security classification of the in lormalion in the paragraph, represented as rTS). (S) fC,, „r (U)
Thete is no UnitaUon tH the length of the abstract Mow ever, the suggested length i from ISO f. 225 words
14 KKY WORDS Key words are technically meaningful terms "r shor, phrases tha, . hara, tenze a report and may be usedTs ■ nde, entries for c«t.IotJl,t the report Key words must be s-le, ,ed so that no ,e, untv , lassif,, „tion is required Ident. '
oro e. (S" 1^ ,■'iu",m*■n, m"',"l *Mtm»Um. tr.de name, military
proj.u I , ode name, »..en^raphu locatiOR, may be used as keV
words but mill be followed by an md,< at.on of technical con- t-xl. The ass.gnmem ,.f |ln|!s. -„,,,, ..„dweightc II optional
GPO B66.S5I
-69- UNCLASSIFIED
Security Classification

■
I I
PHILCO PHILCO-FOHD CORPORA riON
Aenonutnonic Division
Newport Beach, Calif. • 926B3