Embed Size (px)
Citation preview
Required Report - public distributionDate: 3/5/2009
GAIN Report Number: CH9014CH9014China, Peoples Republic ofPoultry and ProductsSemi-Annual2009
Approved by:Michael WoolseyAgBeijingPrepared by:Jianping Zhang
Report Highlights:Post forecasts China's broiler meat production will rise two percent in 2009 to 12.1 million metric tons. Production gains will be hampered by sluggish sales, as consumption of pork rises in response to sharply lower pork prices, reducing demand for broiler meat. Chinese broiler meat imports in 2009 will remain flat at 399,000 tons. Post expects continued robust shipments of chicken paws, as Chinese production continues to fall short of demand.
Includes PSD Changes: YesIncludes Trade Matrix: Yes
Semi-Annual ReportBeijing [CH1]
[CH]
USDA Foreign Agricultural Service
GAIN ReportGlobal Agriculture Information Network
Template Version 2.09
GAIN Report - CH9014 Page 2 of 12
Table of ContentsExecutive Summary............................................................................................3
Production Growth to Slow in 2009.......................................................................................3Chinese Broiler Meat Demand to Decline in 2009.................................................................4Overall Chinese Broiler Meat Imports Slump as U.S. Shipments Continue to Rise.................4Turkey Meat Imports Strong..................................................................................................5Possible Trade Conflicts........................................................................................................5Decreasing Broiler Meat Exports...........................................................................................5
Chinese Poultry Egg Production to Continue Higher in 2009.................................6Tables...............................................................................................................7
Broiler PS&D Table................................................................................................................7Trade Matrices......................................................................................................................8Poultry Price Tables...............................................................................................................8Live Chicken and Broiler Meat Prices..................................................................................11
Production.......................................................................................................12Production Subcategory.....................................................................................................13
Consumption....................................................................................................13Consumption Subcategory.................................................................................................13
Trade...............................................................................................................13Trade Subcategory.............................................................................................................13
Stocks.............................................................................................................13Stocks Subcategory............................................................................................................13
Policy..............................................................................................................13Policy Subcategory.............................................................................................................13
Marketing........................................................................................................13Marketing Subcategory.......................................................................................................13
UNCLASSIFIED USDA Foreign Agricultural Service
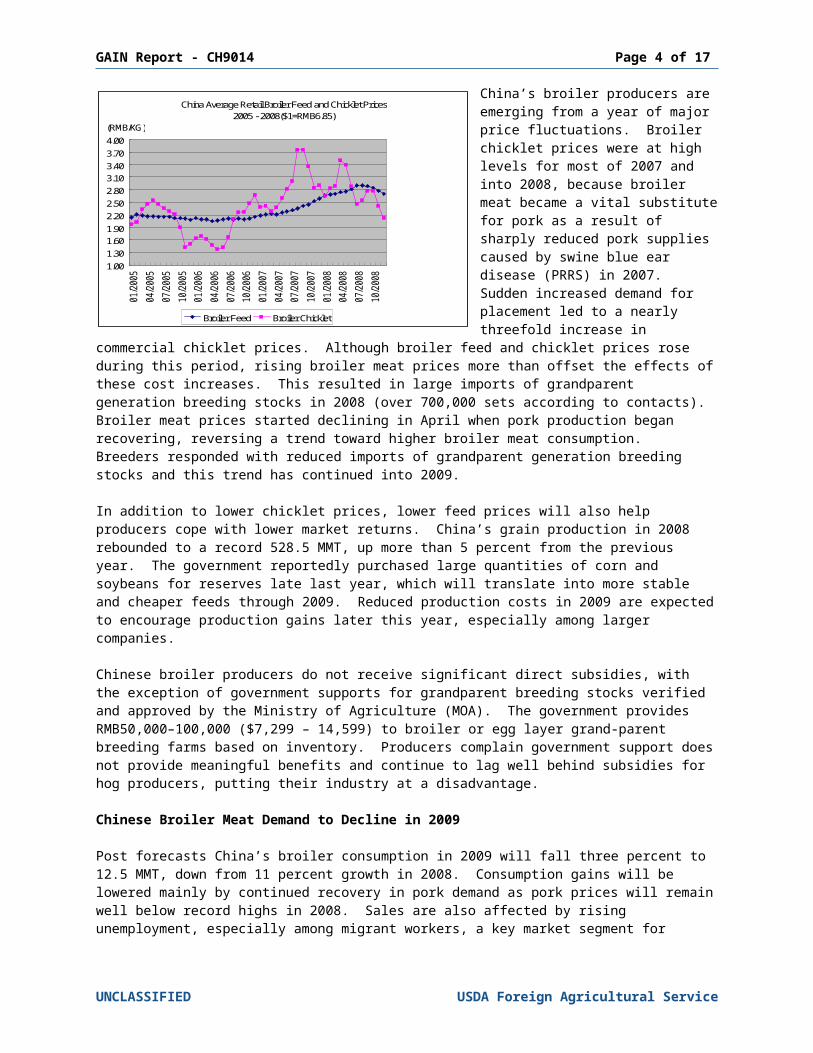
China Average Retail Broiler Feed and Chicklet Prices2005 - 2008($1=RMB6.85)
1.001.301.601.902.202.502.803.103.403.704.00
01/2
005
04/2
005
07/2
005
10/2
005
01/2
006
04/2
006
07/2
006
10/2
006
01/2
007
04/2
007
07/2
007
10/2
007
01/2
008
04/2
008
07/2
008
10/2
008
(RMB/KG)
Broiler Feed Broiler Chicklet
GAIN Report - CH9014 Page 3 of 12
Executive Summary
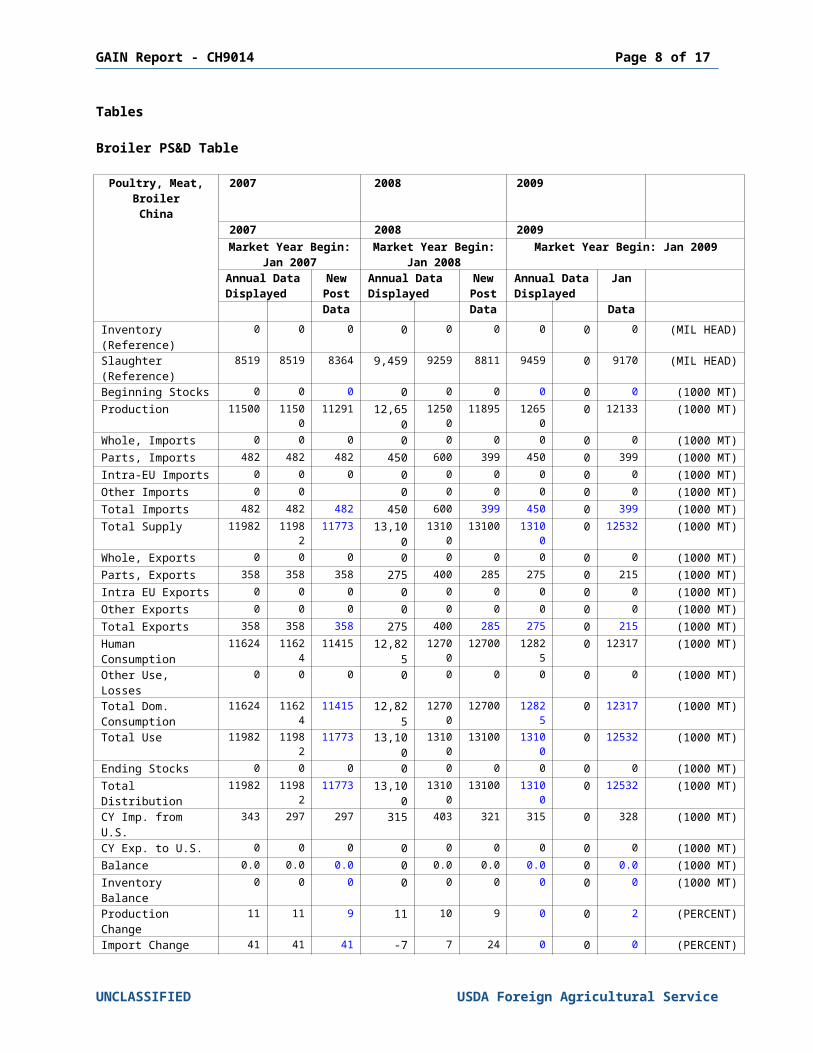
FAS Beijing (Post) projects China’s 2009 broiler meat production will rise two percent to 12.1 million metric tons (MMT). Production gains will be hampered by sluggish consumer demand. Pork prices will remain sharply lower than 2008 levels encouraging higher pork sales and reduced purchases of chicken and other alternative meats. Rising unemployment among migrant workers, a key market segment for low-priced chicken meat, is also limiting growth. Lower feed and chick prices in 2009 will help offset reduced broiler returns. Overall, Chinese broiler meat imports are projected to remain flat at 399,000 tons. However, imports from the United States should be up slightly to 328,000 tons, fueled by higher shipments of chicken leg quarters. In addition to these sales, Post expects continued strong shipments of U.S. chicken paws, boosted by comparatively strong Chinese demand, and continued shortfalls in domestic chicken paw production.
Post forecasts China’s broiler exports in 2009 will decrease by 25 percent to 215,000 MT due to weak demand in key Chinese export markets. Production Growth to Slow in 2009
Post expects 2009 Chinese broiler production will rise just two percent to 12.1 million tons. Weak production in the first half of 2009 should be offset by stronger output in the latter half of 2009 as economic growth begins to rise later this year.
Currently, production is hampered by sluggish demand caused mainly by sharply lower pork prices, as Chinese pork production recovers from the effects of blue ear disease in 2007 and 2008. Producers are also facing reduced export demand due to the effects of the global economic crisis in Japan and other key Chinese poultry export markets. Further adding to the woes of domestic industry, there have been seven human cases of high pathogenic avian influenza (HPAI) in early 2009, which have led to some Chinese consumers reducing broiler meat purchases due to misperceptions about the transmission of the HPAI virus. Overall, as a result of weak demand, nationwide broiler meat stocks currently are estimated at 600,000 – 700,000 metric tons. There are unofficial reports of small and medium-sized broiler processing plants shutting down, especially in Shandong Province, the largest poultry producing province. While smaller plants are being challenged by the weak market, many larger processors are seizing the opportunity to purchase cheaper broiler materials for processing and putting these products in stock, while waiting for better market opportunities later this year.
China’s broiler producers are emerging from a year of major price fluctuations. Broiler chicklet prices were at high levels for most of 2007 and into 2008, because broiler meat became a vital substitute for pork as a result of sharply reduced pork supplies caused by swine blue ear disease (PRRS) in 2007. Sudden increased demand for placement led to a nearly threefold increase in commercial chicklet prices. Although broiler feed and chicklet prices rose during this period, rising broiler meat prices more than
offset the effects of these cost increases. This resulted in large imports of grandparent
UNCLASSIFIED USDA Foreign Agricultural Service
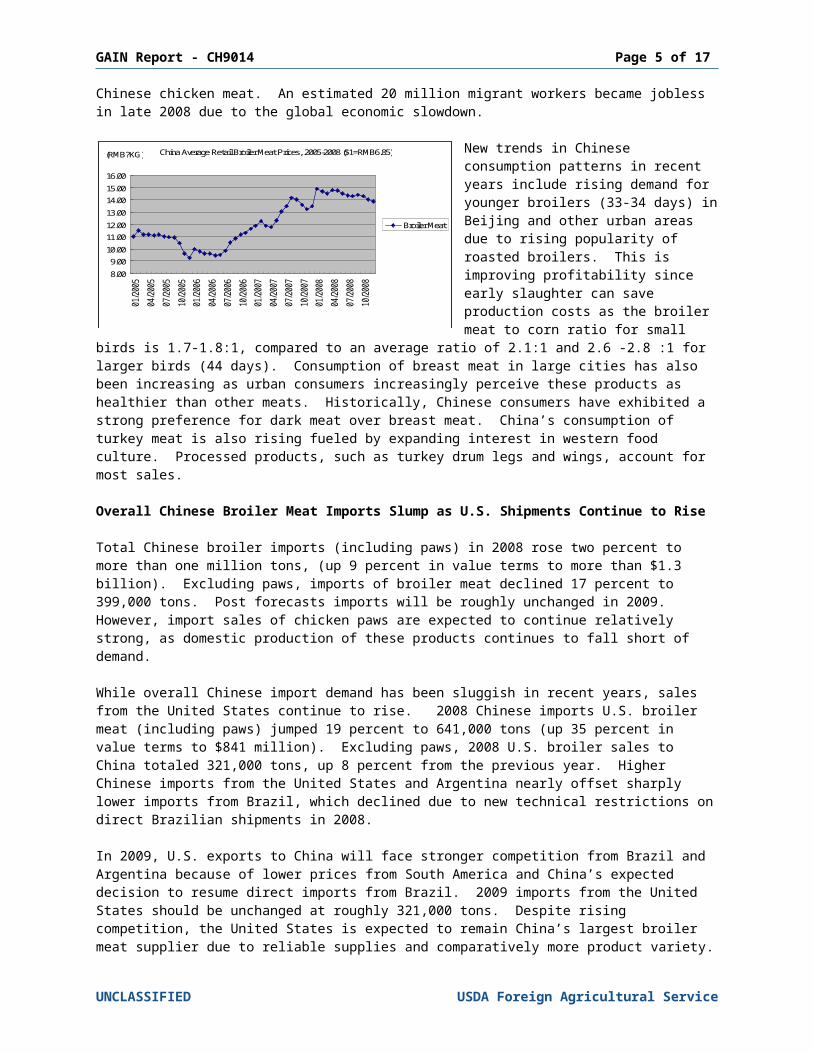
China Average Retail Broiler Meat Prices, 2005-2008 ($1=RMB6.85)
8.00
9.0010.00
11.0012.00
13.00
14.0015.00
16.00
01/2
005
04/2
005
07/2
005
10/2
005
01/2
006
04/2
006
07/2
006
10/2
006
01/2
007
04/2
007
07/2
007
10/2
007
01/2
008
04/2
008
07/2
008
10/2
008
(RMB?KG)
Broiler Meat
GAIN Report - CH9014 Page 4 of 12
generation breeding stocks in 2008 (over 700,000 sets according to contacts). Broiler meat prices started declining in April when pork production began recovering, reversing a trend toward higher broiler meat consumption. Breeders responded with reduced imports of grandparent generation breeding stocks and this trend has continued into 2009. In addition to lower chicklet prices, lower feed prices will also help producers cope with lower market returns. China’s grain production in 2008 rebounded to a record 528.5 MMT, up more than 5 percent from the previous year. The government reportedly purchased large quantities of corn and soybeans for reserves late last year, which will translate into more stable and cheaper feeds through 2009. Reduced production costs in 2009 are expected to encourage production gains later this year, especially among larger companies.
Chinese broiler producers do not receive significant direct subsidies, with the exception of government supports for grandparent breeding stocks verified and approved by the Ministry of Agriculture (MOA). The government provides RMB50,000–100,000 ($7,299 – 14,599) to broiler or egg layer grand-parent breeding farms based on inventory. Producers complain government support does not provide meaningful benefits and continue to lag well behind subsidies for hog producers, putting their industry at a disadvantage.
Chinese Broiler Meat Demand to Decline in 2009
Post forecasts China’s broiler consumption in 2009 will fall three percent to 12.5 MMT, down from 11 percent growth in 2008. Consumption gains will be lowered mainly by continued recovery in pork demand as pork prices will remain well below record highs in 2008. Sales are also affected by rising unemployment, especially among migrant workers, a key market segment for Chinese chicken meat. An estimated 20 million migrant workers became jobless in late 2008 due to the global economic slowdown.
New trends in Chinese consumption patterns in recent years include rising demand for younger broilers (33-34 days) in Beijing and other urban areas due to rising popularity of roasted broilers. This is improving profitability since early slaughter can save production costs as the broiler meat to corn ratio for small birds is 1.7-1.8:1, compared to an average ratio of 2.1:1 and 2.6 -2.8 :1 for larger birds (44 days). Consumption of breast meat in large cities has also been
increasing as urban consumers increasingly perceive these products as healthier than other meats. Historically, Chinese consumers have exhibited a strong preference for dark meat over breast meat. China’s consumption of turkey meat is also rising fueled by expanding interest in western food culture. Processed products, such as turkey drum legs and wings, account for most sales.
Overall Chinese Broiler Meat Imports Slump as U.S. Shipments Continue to Rise
Total Chinese broiler imports (including paws) in 2008 rose two percent to more than one million tons, (up 9 percent in value terms to more than $1.3 billion). Excluding paws, imports of broiler meat declined 17 percent to 399,000 tons. Post forecasts imports will be roughly unchanged in 2009. However, import sales of chicken paws are expected to continue relatively strong, as domestic production of these products continues to fall short of demand.
UNCLASSIFIED USDA Foreign Agricultural Service
GAIN Report - CH9014 Page 5 of 12
While overall Chinese import demand has been sluggish in recent years, sales from the United States continue to rise. 2008 Chinese imports U.S. broiler meat (including paws) jumped 19 percent to 641,000 tons (up 35 percent in value terms to $841 million). Excluding paws, 2008 U.S. broiler sales to China totaled 321,000 tons, up 8 percent from the previous year. Higher Chinese imports from the United States and Argentina nearly offset sharply lower imports from Brazil, which declined due to new technical restrictions on direct Brazilian shipments in 2008.
In 2009, U.S. exports to China will face stronger competition from Brazil and Argentina because of lower prices from South America and China’s expected decision to resume direct imports from Brazil. 2009 imports from the United States should be unchanged at roughly 321,000 tons. Despite rising competition, the United States is expected to remain China’s largest broiler meat supplier due to reliable supplies and comparatively more product variety. Brazilian chicken product strengths are lower moisture content, due to the common practice in Brazil of air-cooled processing, and labor-concentrated parts, such as hand-packed whole wings (soldier packing). U.S. exports of chicken quarters could increase as Chinese processor demand continues to rise. Traders expect higher available U.S. leg quarter supplies due to lower demand from Russia. Sales of U.S. chicken paws to China will remain strong due to robust demand and short domestic production.
Turkey Meat Imports Strong
Post forecasts China’s turkey meat imports are forecast to continue rising in 2009, up 10 percent to more than 50,000 tons. The United States accounts for nearly 90 percent of China’s turkey meat imports. Rising imports are fueled by continued interest in Western food culture, especially among urban consumers with higher incomes. With low domestic production (China turkey meat production totals 4,000 MT/year), and relatively low price sensitivity compared to broiler meat, demand for imports is expected to continue strong for the foreseeable future.
Possible Trade Conflicts
In 2007, the U.S. Congress prohibited USDA from moving forward on plans to issue a proposed rule allowing China’s cooked poultry exports into the United States, under Section 733 of the 2008 Omnibus Appropriations Act. The Government of China maintains this action is unwarranted. Chinese poultry interests have threatened to step up pressure to reduce imports of U.S. poultry products if the United States continues to block rulemaking.
Decreasing Broiler Meat Exports
Post forecasts China’s broiler exports in 2009 to decrease by 24 percent to 215,000 MT due mainly to lower sales to Japan caused by the global financial crisis. This forecast is a major revision from Post’s previous estimate in the 2008 poultry annual report (CH8073). Japan is China’s largest export market by far, accounting for roughly half of total sales. Sales to other markets will also be sluggish. Although the EU lifted its ban on Chinese poultry in late 2008, sales are just commencing. EU demand has been weak, due mainly to comparatively high prices for Chinese chicken in the EU market. China’s higher export prices have limited exports to other new export markets, such as South Africa, and its 2009 exports to these new markets are uncertain because of the world financial crisis.
China is a net live chicken exporter, with Hong Kong and Macau accounting for most Chinese exports. These sales are based on export quotas issued by the Ministry of Commerce (MOFCOM) at end of calendar year. China’s 2009 total export quota to Hong Kong and Macau is 13.4 million birds with Hong Kong 10 million birds, roughly unchanged from the previous year. Chinese live broiler exports vary widely and will mainly depend on China’s HPAI outbreaks and market prices.
UNCLASSIFIED USDA Foreign Agricultural Service
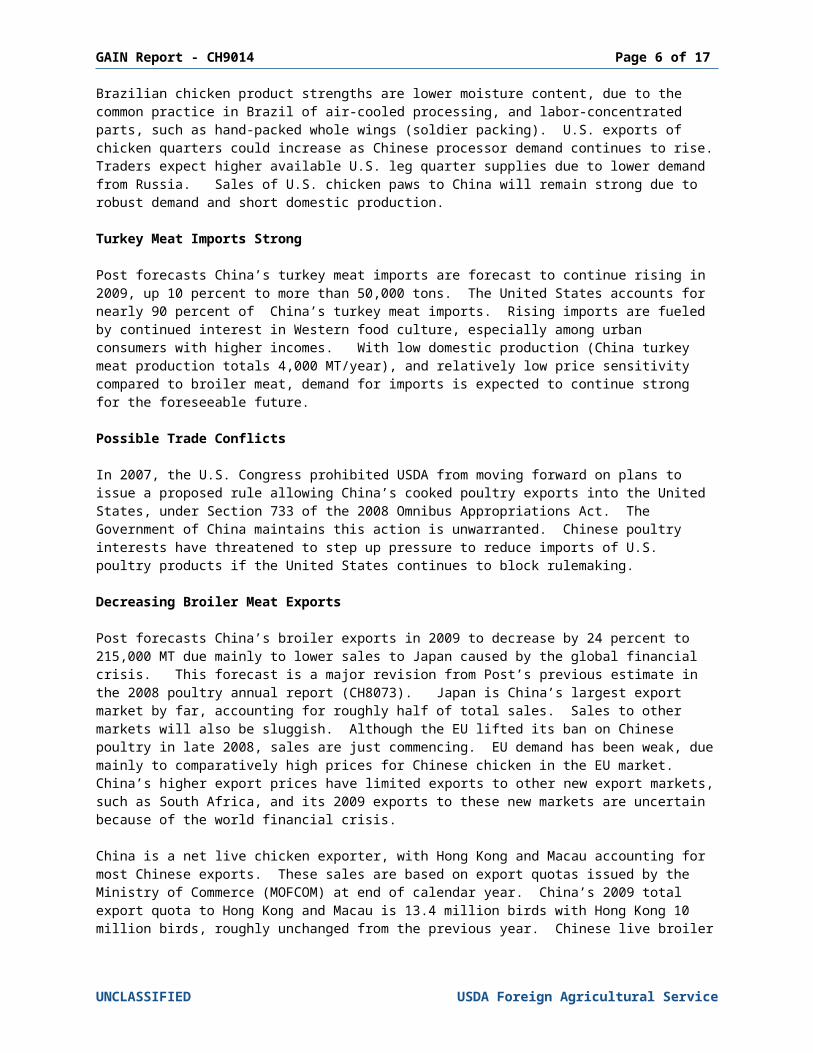
China Retail Egg Layer and Layer Feed Prices, 2005-2008 ($1=RMB6.85)
1.001.201.401.601.802.002.202.402.602.803.003.203.40
01/20
0503
/2005
05/20
0507
/2005
09/20
0511
/2005
01/20
0603
/2006
05/20
0607
/2006
09/20
0611
/2006
01/20
0703
/2007
05/20
0707
/2007
09/20
0711
/2007
01/20
0803
/2008
05/20
0807
/2008
09/20
0811
/2008
(RMB?KG)
Layer Feed Layer Chicklet
GAIN Report - CH9014 Page 6 of 12
Chinese Poultry Egg Production to Continue Higher in 2009
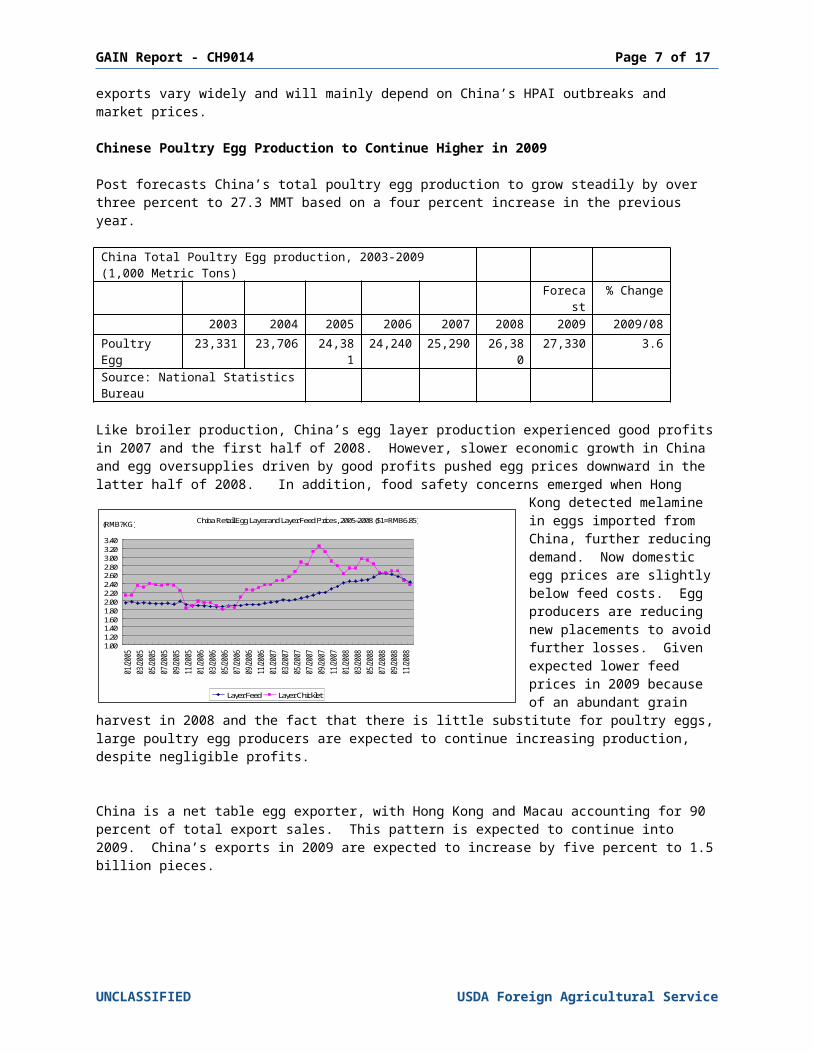
Post forecasts China’s total poultry egg production to grow steadily by over three percent to 27.3 MMT based on a four percent increase in the previous year.
China Total Poultry Egg production, 2003-2009 (1,000 Metric Tons)
Forecast % Change
2003 2004 2005 2006 2007 2008 2009 2009/08
Poultry Egg 23,331 23,706 24,381 24,240 25,290 26,380 27,330 3.6
Source: National Statistics Bureau
Like broiler production, China’s egg layer production experienced good profits in 2007 and the first half of 2008. However, slower economic growth in China and egg oversupplies driven by good profits pushed egg prices downward in the latter half of 2008. In addition, food safety concerns emerged when Hong Kong detected melamine in eggs imported from China, further reducing demand. Now domestic egg prices are slightly below feed costs. Egg
producers are reducing new placements to avoid further losses. Given expected lower feed prices in 2009 because of an abundant grain harvest in 2008 and the fact that there is little substitute for poultry eggs, large poultry egg producers are expected to continue increasing production, despite negligible profits.
China is a net table egg exporter, with Hong Kong and Macau accounting for 90 percent of total export sales. This pattern is expected to continue into 2009. China’s exports in 2009 are expected to increase by five percent to 1.5 billion pieces.
UNCLASSIFIED USDA Foreign Agricultural Service
GAIN Report - CH9014 Page 7 of 12
Tables
Broiler PS&D Table
Poultry, Meat, Broiler China
2007 2008 2009
2007 2008 2009
Market Year Begin: Jan 2007
Market Year Begin: Jan 2008
Market Year Begin: Jan 2009
Annual Data Displayed
New Post
Annual Data Displayed
New Post
Annual Data Displayed
Jan
Data Data DataInventory (Reference)
0 0 0 0 0 0 0 0 0 (MIL HEAD)
Slaughter (Reference)
8519 8519 8364 9,459 9259 8811 9459 0 9170 (MIL HEAD)
Beginning Stocks 0 0 0 0 0 0 0 0 0 (1000 MT) Production 11500 1150
011291 12,650 1250
01189
51265
00 1213
3(1000 MT)
Whole, Imports 0 0 0 0 0 0 0 0 0 (1000 MT) Parts, Imports 482 482 482 450 600 399 450 0 399 (1000 MT) Intra-EU Imports 0 0 0 0 0 0 0 0 0 (1000 MT) Other Imports 0 0 0 0 0 0 0 0 (1000 MT) Total Imports 482 482 482 450 600 399 450 0 399 (1000 MT) Total Supply 11982 1198
211773 13,100 1310
01310
01310
00 1253
2(1000 MT)
Whole, Exports 0 0 0 0 0 0 0 0 0 (1000 MT) Parts, Exports 358 358 358 275 400 285 275 0 215 (1000 MT) Intra EU Exports 0 0 0 0 0 0 0 0 0 (1000 MT) Other Exports 0 0 0 0 0 0 0 0 0 (1000 MT) Total Exports 358 358 358 275 400 285 275 0 215 (1000 MT) Human Consumption
11624 11624
11415 12,825 12700
12700
12825
0 12317
(1000 MT)
Other Use, Losses 0 0 0 0 0 0 0 0 0 (1000 MT) Total Dom. Consumption
11624 11624
11415 12,825 12700
12700
12825
0 12317
(1000 MT)
Total Use 11982 11982
11773 13,100 13100
13100
13100
0 12532
(1000 MT)
Ending Stocks 0 0 0 0 0 0 0 0 0 (1000 MT) Total Distribution 11982 1198
211773 13,100 1310
01310
01310
00 1253
2(1000 MT)
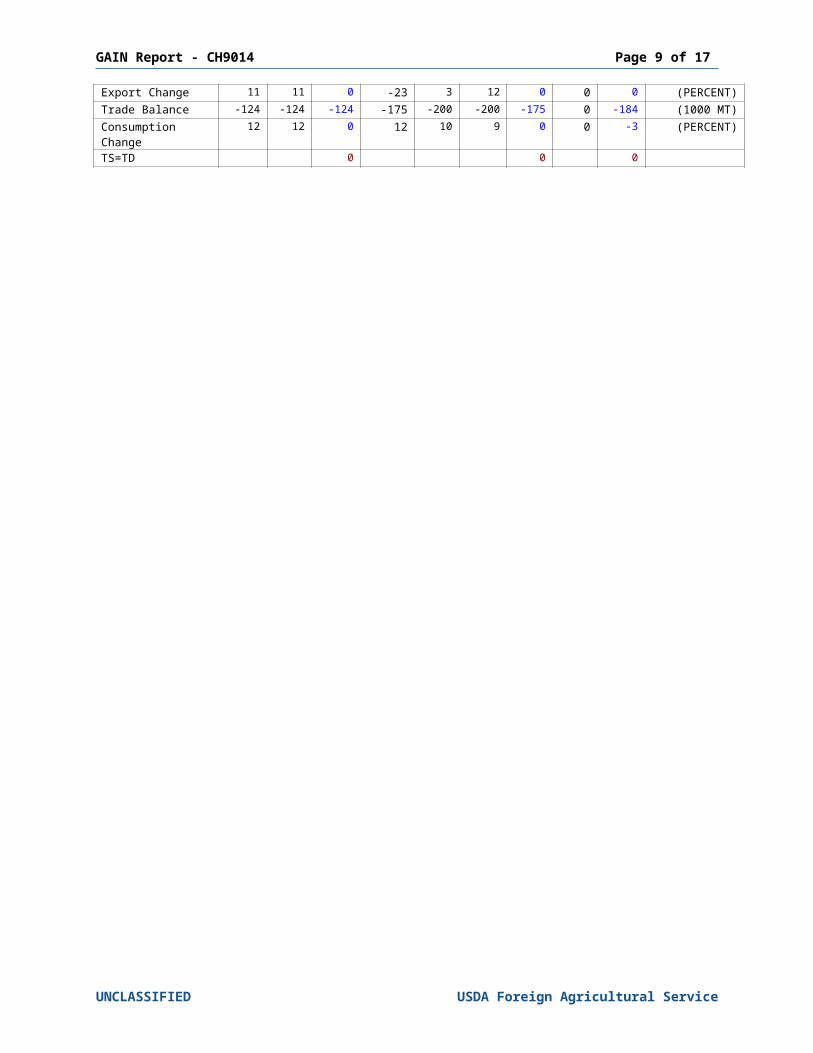
CY Imp. from U.S. 343 297 297 315 403 321 315 0 328 (1000 MT) CY Exp. to U.S. 0 0 0 0 0 0 0 0 0 (1000 MT) Balance 0.0 0.0 0.0 0 0.0 0.0 0.0 0 0.0 (1000 MT) Inventory Balance 0 0 0 0 0 0 0 0 0 (1000 MT) Production Change 11 11 9 11 10 9 0 0 2 (PERCENT) Import Change 41 41 41 -7 7 24 0 0 0 (PERCENT) Export Change 11 11 0 -23 3 12 0 0 0 (PERCENT) Trade Balance -124 -124 -124 -175 -200 -200 -175 0 -184 (1000 MT) Consumption Change
12 12 0 12 10 9 0 0 -3 (PERCENT)
TS=TD 0 0 0
UNCLASSIFIED USDA Foreign Agricultural Service
GAIN Report - CH9014 Page 8 of 12
Trade Matrices
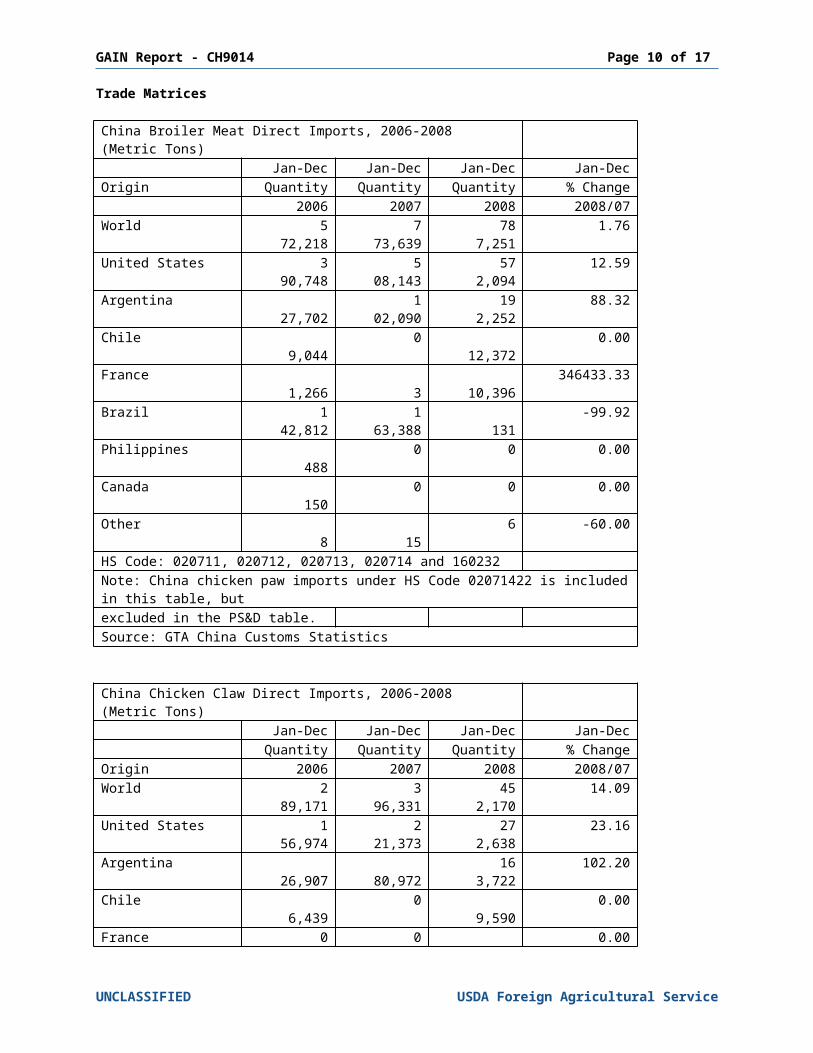
China Broiler Meat Direct Imports, 2006-2008 (Metric Tons)Jan-Dec Jan-Dec Jan-Dec Jan-Dec
Origin Quantity Quantity Quantity % Change2006 2007 2008 2008/07
World 572,218 773,639 787,251 1.76 United States 390,748 508,143 572,094 12.59 Argentina 27,702 102,090 192,252 88.32 Chile 9,044 0 12,372 0.00 France 1,266 3 10,396 346433.33 Brazil 142,812 163,388 131 -99.92 Philippines 488 0 0 0.00 Canada 150 0 0 0.00 Other 8 15 6 -60.00 HS Code: 020711, 020712, 020713, 020714 and 160232Note: China chicken paw imports under HS Code 02071422 is included in this table, butexcluded in the PS&D table. Source: GTA China Customs Statistics
China Chicken Claw Direct Imports, 2006-2008 (Metric Tons)Jan-Dec Jan-Dec Jan-Dec Jan-DecQuantity Quantity Quantity % Change
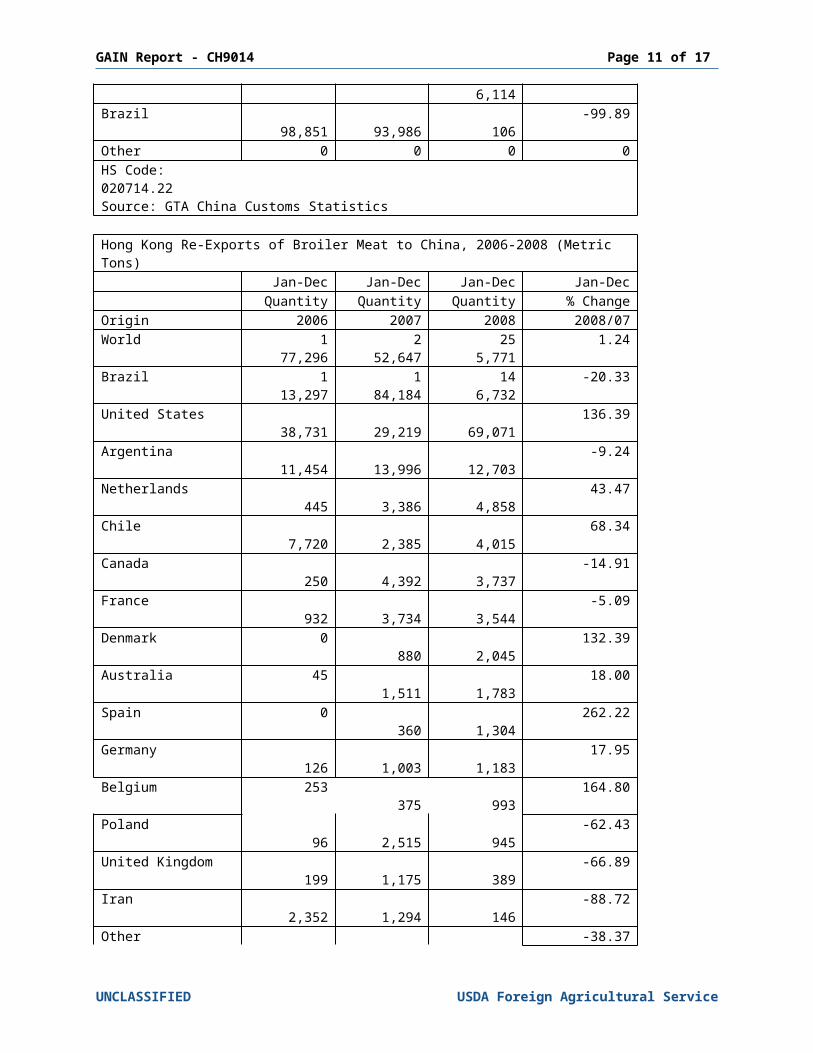
Origin 2006 2007 2008 2008/07World 289,171 396,331 452,170 14.09 United States 156,974 221,373 272,638 23.16 Argentina 26,907 80,972 163,722 102.20 Chile 6,439 0 9,590 0.00 France 0 0 6,114 0.00 Brazil 98,851 93,986 106 -99.89 Other 0 0 0 0HS Code: 020714.22Source: GTA China Customs Statistics
Hong Kong Re-Exports of Broiler Meat to China, 2006-2008 (Metric Tons)Jan-Dec Jan-Dec Jan-Dec Jan-DecQuantity Quantity Quantity % Change
Origin 2006 2007 2008 2008/07World 177,296 252,647 255,771 1.24 Brazil 113,297 184,184 146,732 -20.33 United States 38,731 29,219 69,071 136.39 Argentina 11,454 13,996 12,703 -9.24 Netherlands 445 3,386 4,858 43.47 Chile 7,720 2,385 4,015 68.34 Canada 250 4,392 3,737 -14.91 France 932 3,734 3,544 -5.09 Denmark 0 880 2,045 132.39 Australia 45 1,511 1,783 18.00 Spain 0 360 1,304 262.22 Germany 126 1,003 1,183 17.95 Belgium 253 375 993 164.80 Poland 96 2,515 945 -62.43
UNCLASSIFIED USDA Foreign Agricultural Service
GAIN Report - CH9014 Page 9 of 12
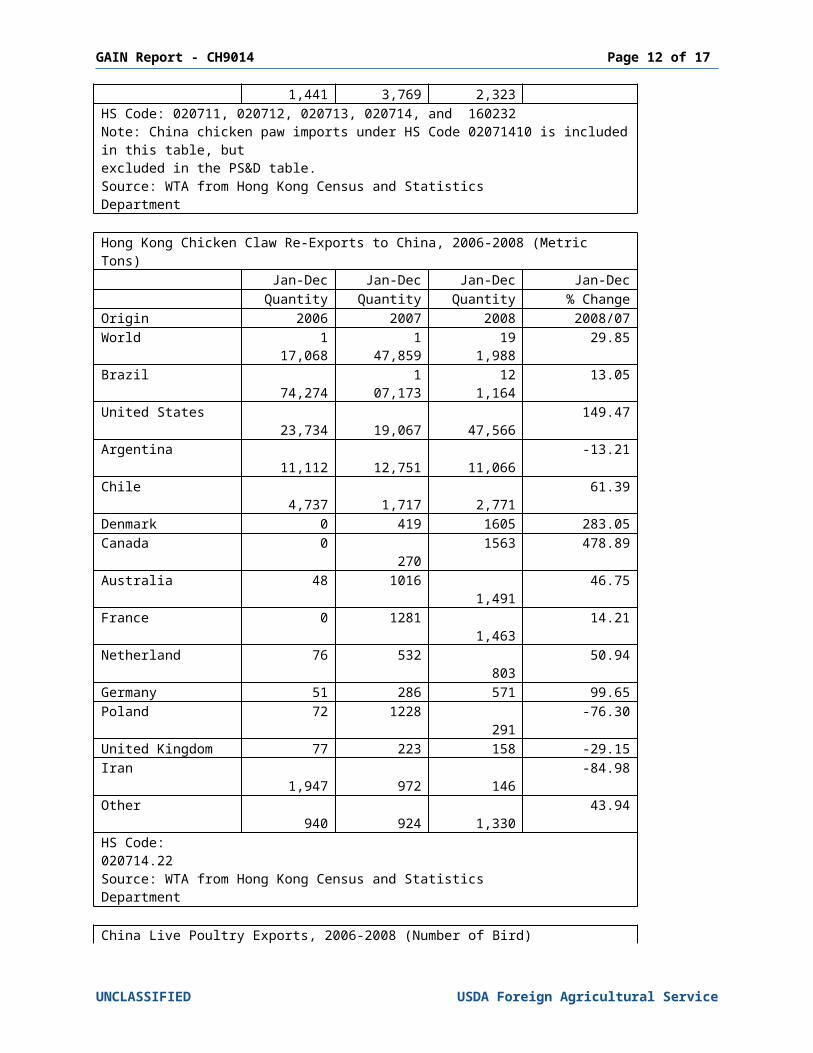
United Kingdom 199 1,175 389 -66.89 Iran 2,352 1,294 146 -88.72 Other 1,441 3,769 2,323 -38.37 HS Code: 020711, 020712, 020713, 020714, and 160232Note: China chicken paw imports under HS Code 02071410 is included in this table, but excluded in the PS&D table. Source: WTA from Hong Kong Census and Statistics Department
Hong Kong Chicken Claw Re-Exports to China, 2006-2008 (Metric Tons)Jan-Dec Jan-Dec Jan-Dec Jan-DecQuantity Quantity Quantity % Change
Origin 2006 2007 2008 2008/07World 117,068 147,859 191,988 29.85 Brazil 74,274 107,173 121,164 13.05 United States 23,734 19,067 47,566 149.47 Argentina 11,112 12,751 11,066 -13.21 Chile 4,737 1,717 2,771 61.39 Denmark 0 419 1605 283.05 Canada 0 270 1563 478.89 Australia 48 1016 1,491 46.75 France 0 1281 1,463 14.21 Netherland 76 532 803 50.94 Germany 51 286 571 99.65 Poland 72 1228 291 -76.30 United Kingdom 77 223 158 -29.15 Iran 1,947 972 146 -84.98 Other 940 924 1,330 43.94 HS Code: 020714.22Source: WTA from Hong Kong Census and Statistics Department
China Live Poultry Exports, 2006-2008 (Number of Bird)Jan-Dec Jan-Dec Jan-Dec Jan-DecQuantity Quantity Quantity % Change
Origin 2006 2007 2008 2008/07World 8,047,799 16,350,559 7,817,033 -52.19 Hong Kong 8,047,799 13,162,920 6,275,020 -52.33 Macau 0 3,187,639 1,542,013 -51.63 Other 0 0 0 0HS Code: 01051190, 01051210, 01051290, 01051910, 01051990, 01059410 & 01059490Source: GTA from China Customs Statistics
UNCLASSIFIED USDA Foreign Agricultural Service
GAIN Report - CH9014 Page 10 of 12
China Broiler Meat Exports, 2006-2008 (Metric Tons)Jan-Dec Jan-Dec Jan-Dec Jan-Dec
Destination Quantity Quantity Quantity % Change2006 2007 2008 2008/07
World 321,761 358,053 285,316 -20.31 Japan 196,282 204,384 135,896 -33.51 Hong Kong 91,892 106,871 108,651 1.67 Malaysia 201 9,870 15,362 55.64 Korea South 12,320 11,767 6,627 -43.68 Bahrain 4,821 4,078 4,194 2.84 Kyrgyzstan 0 1,650 3,904 136.61 Macau 2,001 2,848 2,959 3.90 Iraq 1,593 3,716 1,751 -52.88 South Africa 235 1,643 851 -48.20 Azerbaijan 0 2,371 817 -65.54 Netherlands Antilles 144 794 521 -34.38 Aruba 933 986 211 -78.60 Philippines 601 898 205 -77.17 Georgia 406 362 205 -43.37 Armenia 1,409 329 205 -37.69 Maldives 1,021 0 52 0United States 3,027 476 12 -97.48 Somalia 1,323 778 0 -100.00 Kenya 1,171 579 0 -100.00 Other 1,437 3,103 2,893 -6.77 HS Code: 020711, 020712, 020713, 020714 & 160232Source: GTA from China Customs Statistics
China Turkey Meat Imports 2006-2008 (Number of Eggs)Jan-Dec Jan-Dec Jan-Dec Jan-DecQuantity Quantity Quantity % Change
Origin 2006 2007 2008 2008/07World 16,795 29,808 45,305 51.99 United States 16,722 25,635 39,101 0.00 Chile 72 4,080 6,156 50.88 Other 0 0 47 0HS Code: 020725, 020726, 020727. and 160231Source: GTA from China Customs Statistics
UNCLASSIFIED USDA Foreign Agricultural Service
GAIN Report - CH9014 Page 11 of 12
Live Chicken and Broiler Meat Prices
China Retail Live Chicken Prices On Average 2005-2008 (RMB/KG) ($1=RMB6.85)
% Change
MONTH 2005 2006 2007 2008 2008/07
January 10.96 9.76 11.95 13.97 16.90
February 11.83 9.86 12.65 14.53 14.86
March 11.29 9.62 12.12 14.31 18.07
April 11.22 9.31 12.03 14.59 21.28
May 11.17 9.49 12.51 14.42 15.27
June 11.24 9.57 13.30 14.13 6.24
July 10.97 9.83 13.59 13.89 2.21
August 11.05 10.42 14.51 13.91 -4.14
September 11.06 10.85 14.35 14.15 -1.39
October 10.64 11.24 13.73 14.08 2.55
November 9.49 11.36 13.46 13.84 2.82
December 9.09 11.68 13.57 13.72 1.11
Source: The Ministry of Agriculture
China Retail Broiler Meat Prices On Average 2005-2008 (RMB/KG) ($1=RMB6.85)
% Change
MONTH 2005 2006 2007 2008 2008/07
January 11.01 9.99 11.89 14.90 25.32
February 11.51 9.78 12.26 14.69 19.82
March 11.17 9.62 11.87 14.51 22.24
April 11.14 9.58 11.77 14.80 25.74
May 11.12 9.45 12.32 14.72 19.48
June 11.15 9.52 13.05 14.51 11.19
July 11.02 9.82 13.47 14.33 6.38
August 10.95 10.50 14.14 14.29 1.06
September 10.92 10.87 14.01 14.40 2.78
October 10.49 11.14 13.60 14.29 5.07
November 9.58 11.28 13.23 14.00 5.82
December 9.25 11.64 13.46 13.87 3.05
Source: The Ministry of Agriculture
UNCLASSIFIED USDA Foreign Agricultural Service
GAIN Report - CH9014 Page 12 of 12
China Industry Feed Prices for Broilers On Average 2005-2008 (RMB/KG)
($1 = RMB 6.88)
% Change
2005 2006 2007 2008 2008/07
January 2.14 2.12 2.18 2.66 22.02
February 2.21 2.09 2.21 2.69 21.72
March 2.18 2.09 2.22 2.70 21.62
April 2.17 2.06 2.21 2.75 24.43
May 2.17 2.07 2.25 2.76 22.67
June 2.16 2.09 2.28 2.82 23.68
July 2.15 2.11 2.31 2.91 25.97
August 2.15 2.09 2.36 2.91 23.31
September 2.13 2.11 2.42 2.89 19.42
October 2.13 2.10 2.44 2.84 16.39
November 2.11 2.11 2.53 2.77 9.49
December 2.08 2.16 2.58 2.70 4.65
China Industry Feed Prices for Egg Layers On Average 2005-2008 (RMB/KG)
($1 = RMB 6.88)
% Change
MONTH 2005 2006 2007 2008 2008/07
January 1.96 1.89 1.97 2.41 22.34
February 1.98 1.88 1.98 2.44 23.23
March 1.95 1.87 2.02 2.44 20.79
April 1.96 1.86 2.01 2.47 22.89
May 1.94 1.87 2.03 2.48 22.17
June 1.93 1.88 2.06 2.54 23.30
July 1.93 1.89 2.09 2.62 25.36
August 1.95 1.89 2.13 2.62 23.00
September 1.92 1.91 2.18 2.60 19.27
October 1.99 1.91 2.19 2.55 16.44
November 1.91 1.91 2.27 2.48 9.25
December 1.88 1.95 2.33 2.42 3.86
Source: The Ministry of Agriculture
UNCLASSIFIED USDA Foreign Agricultural Service