Embed Size (px)
Citation preview
Required Report - Public distributionDate: 11/8/2007
GAIN Report Number: AS7067AS7067AustraliaRetail Food SectorAnnual2007
Approved by:Kathleen Wainio, Agricultural CounselorU.S. EmbassyPrepared by:Hassall & Associates Pty Ltd
Report Highlights:The market for food grocery sales in Australia is concentrated along the east coast where population and disposable income is greatest. The total value of food retailing grew more than 6% in 2006, to US$66.4 billion. More than 70% of food expenditure occurs within the supermarket and grocery sector. Of the total value of food imported into Australia in fiscal year 2005/06, the US accounted for US$454 million or 9% of total imports and 1% of the total market. Consumers are increasingly demanding foods that are healthy but also convenient, with organic, gluten-free and functional foods (such as energy drinks) growing in popularity. This report contains a road map for creating an entry strategy for the major retail sectors, as well as best product prospects in the Australian Market.
Includes PSD Changes: NoIncludes Trade Matrix: No
Annual ReportCanberra [AS1]
[AS]
USDA Foreign Agricultural Service
GAIN ReportGlobal Agriculture Information Network
Template Version 2.09

GAIN Report - AS7067 Page 2 of 37
This report was drafted by consultants:
Hassall & Associates Pty LtdGPO Box 4625Sydney, NSW 2000Australia
Tel: +61-2-9241-5655Fax: +61-2-9241-5684Email: [email protected] Web: www.hassall.com.au
UNCLASSIFIED USDA Foreign Agricultural Service
Disclaimer: As a number of different sources were used to collate market information for this report there are areas in which figures are slightly different. The magnitude of the difference is in most cases small and the provision of the data even though slightly different is to provide the U.S. exporter with the best possible picture of the Australian retail food sector where omission may provide less than that.
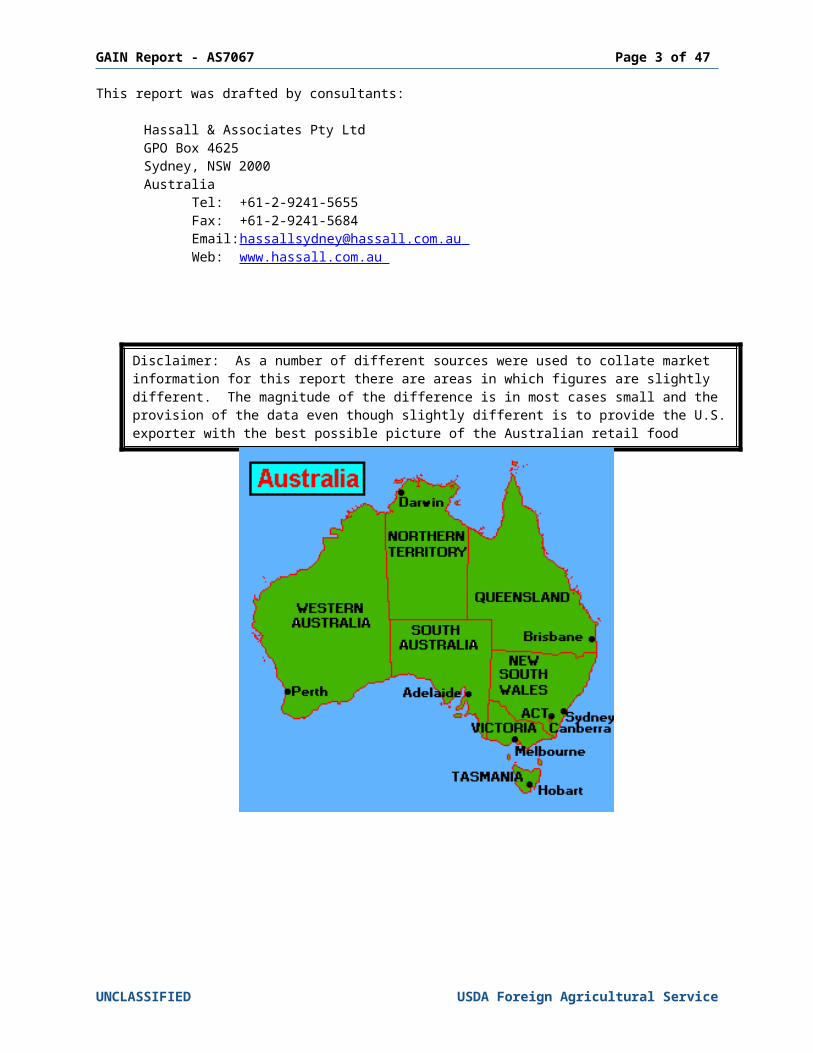
GAIN Report - AS7067 Page 3 of 37
Table of ContentsSECTION I. MARKET SUMMARY.......................................................................5
Key Players...........................................................................................................................5Value of Overall Retail Food Sales Over the Past Six Years....................................................5Value of Imported Food vs Domestic Products, Over the Past Five Years...............................6Expected Growth Overall for Retail Food and Sub-sectors....................................................8Trends in Distribution Channels............................................................................................9Number and Type of Retail Outlets.....................................................................................10Trends in Services Offered by Retailers...............................................................................11Advantages and Challenges for U.S. Retail Food Exporters.................................................16
SECTION II: ROAD MAP FOR MARKET ENTRY......................................................17Entry Strategy....................................................................................................................17Market Structure................................................................................................................18
A. SUPER STORES, SUPERMARKETS, HYPER MARKETS OR SUPER CENTERS, CLUB AND WAREHOUSE OUTLETS....................................................................................................20B. CONVENIENCE STORES AND GAS MARTS...............................................................22C. TRADITIONAL MARKETS – MOM/POP INDEPENDENT GROCERY, WET MARKETS.......24
SECTION III: COMPETITION...............................................................................26SECTION IV: BEST PRODUCT PROSPECTS...........................................................30
Category A: Products Present in the Market Which Have Good Sales Potential...................30Category B: Products Not Present in Significant Quantities but Which Have Good Sales Potential.............................................................................................................................31Category C: Products Not Present in the Market Because They Face Significant Barriers.. .33
SECTION V. POST CONTACT AND FURTHER INFORMATION................................34Import Regulations.............................................................................................................34Australia’s Food Labeling Regulations.................................................................................34Industry Information...........................................................................................................34Trade Shows.......................................................................................................................35Major Wholesalers..............................................................................................................35Major Retailers...................................................................................................................36Bibliography.......................................................................................................................36
UNCLASSIFIED USDA Foreign Agricultural Service
GAIN Report - AS7067 Page 4 of 37
The following exchange rates were used to convert Australian dollars to U.S. dollars for 2001 to 2007 (daily averages, calendar year basis).
2001 2002 2003 2004 2005 2006 2007*AUD/USD 0.5128 0.5438 0.6524 0.700 0.7622 0.7535 0.8189
Source: www.rba.gov.au *Exchange rate for 2007 is the average of January – August only.
In circumstances where only fiscal year data is available, the following exchange rates have been used (daily averages, Australian fiscal year July-June):
2001/02 2002/03 2003/04 2004/05 2005/06 2006/07AUD/USD 0.5238 0.5842 0.7128 0.7524 0.7477 0.7857
Source: www.rba.gov.au
Rising food prices (due to factors such as the present Australian drought and high world commodity prices) should also be considered when reading this report, particularly when considering the value of retail sales.
UNCLASSIFIED USDA Foreign Agricultural Service

GAIN Report - AS7067 Page 5 of 37
SECTION I. MARKET SUMMARY
The market for food grocery sales in Australia is concentrated along the east coast where population and disposable income are greatest. New South Wales (NSW) and the Australian Capital Territory dominate with a 33% share of the supermarket and grocery sector, followed by 25% for Victoria, 20% for Queensland, 11% for Western Australia, 8% for South Australia, 2% for Tasmania and 1% for the Northern Territory.
Key Players
Woolworths is an Australian-owned company that has been trading since the 1920s. Trading under the logo of the "Fresh Food People", the company operates over 750 supermarkets and serves more than 13 million customers each week.
Coles is part of Coles Group Limited, which is Australia's largest retailing group. The company opened its first supermarket in 1960 and now operates around 740 stores throughout Australia. Following several decades of consolidation, the Coles Group may be subject to restructuring and deconsolidation if an impending take-over bid by Wesfarmers is successful. The implications of this are unclear at present (with Wesfarmers’ plans for Coles still largely unknown) however may involve increased competition for Woolworths.
Franklins is a discount supermarket chain selling dry groceries and perishables in metropolitan and rural areas throughout NSW. The current Franklins brand was established in 2001 after the company was bought by South African retailer, Pick ‘n Pay. Prior to this, Franklins No Frills had been operating in Australia since 1978. Franklins has 80 stores in NSW.
Aldi Supermarkets, the German based international discount food retailer which began trading in Australia in 2001, has established itself within the Australian market with grocery stores in NSW, ACT, Victoria and Queensland. Aldi opened its 150th store during 2007. The success of Aldi highlights an emerging trend towards discount retailing, focused on a narrow product range and targeted at a specific demographic.
Metcash Trading Limited Australasia is a leading marketing and distribution company operating in the food, and other fast moving consumer goods, categories. It has three business units – IGA Distribution, Campbell’s Cash & Carry, and Australian Liquor Marketers (ALM).
Value of Overall Retail Food Sales Over the Past Six Years
Table 1 summarizes total food retail sales and growth for the past six years. The total value of food retailing in 2006 was US$66.4 billion, which was an increase of over US$3.5 billion (6%) from 2005.
In 2007, total food retailing is forecast to jump 18%, to US$78 billion. Several factors are driving retail food prices (and therefore the value of sales) including higher fuel prices (leading to increased production and transport costs), weather events such as drought and cyclones (which have resulted in lower production and increased prices for a range of commodities, in particular grains, dairy and bananas), tight irrigation water supplies, and strong export demand for food products (although this may be constrained by the strong Australian dollar, which is making Australia’s exports more expensive).
More than 70% of food expenditure (US$47 billion in 2006) occurs within the supermarket and grocery sector.
‘Other food retailers’, consisting of specialized food retailers such as fishmongers and bakers, are forecast to experience retail sales growth of 21% in 2007. Customers purchase from these stores due to the greater variety of fresh product offered (relative to the large supermarket chains) and ‘old-fashioned service’ provided. Many of these stores are also value-adding by marinating their own meat, and making their own salads, soup, dips and fruit preserves.
UNCLASSIFIED USDA Foreign Agricultural Service
GAIN Report - AS7067 Page 6 of 37
Building on this idea is Harris Farm- an Australian family-owned company that currently has 18 stores, predominantly in NSW. Harris Farm credits itself as the “first Australian fruit and vegetable company to open in a supermarket-style operation” and offers an extensive range of fresh fruit, vegetables, meat, dairy products, seafood, bakery items and imported specialty foods.
Table 1: Total Food Retailing Over the Past Six Years (US$m)
Description 2002 2003 2004 2005 2006 2007*
Total Food Retailing (US$m) 38,186 48,429 55,688 62,849 66,415 78,202
Nominal Growth Rate (US$ value) 14% 27% 15% 13% 6% 18%Nominal Growth Rate (A$ value) 8% 6% 7% 4% 7% 8% Supermarkets and Grocery Stores Food Retailing1
27,255 34,711 39,816 44,642 47,022 55,027
Real Growth Rate 13% 27% 15% 12% 5% 17%% of Total Food Retailing 71% 72% 71% 71% 71% 70%
Takeaway Food Retailing 4,074 5,321 6,169 6,938 7,085 8,310Real Growth Rate 13% 31% 16% 12% 2% 17%% of Total Food Retailing 11% 11% 11% 11% 11% 11% Other Food Retailing2 12,609 12,872 13,861 14,785 16,334 18,152Real Growth Rate 22% 22% 16% 16% 9% 21%% of Total Food Retailing 18% 17% 17% 18% 19% 19%
* Forecasts for calendar year 2007 1. This category consists of units mainly engaged in retailing groceries or non-specialized food lines, whether or not the selling is organized on a self-service basis.2. This category consists of units mainly engaged in specialized food retailing e.g. butchers, fresh fish retailing, fresh fruit and vegetable retailing, bread and cake retailing, milk vending and confectionery.Source: ABS Cat. No. 8501.0
Value of Imported Food vs Domestic Products, Over the Past Five Years
The total value of imports for the food and beverage sector from July 2006 to June 2007 (the Australian fiscal year) (Figure 1) was almost US$6.3 billion (or 8% of the total market). This includes products at three levels of transformation, including minimally transformed (indicates basic refining or manufacturing processes), moderately transformed (implies that manufacturing processes have processed or refined raw material into a recognizable product) and elaborately transformed (indicates commodities have undergone processes to create an end use product).
Of the total value of food imported into Australia in 2005/06 ($5.1 billion), the US accounted for US$454 million or 9% of total imports and 1% of the total market. The majority of Australia’s imports are sourced from New Zealand (Error: Reference source not
UNCLASSIFIED USDA Foreign Agricultural Service

GAIN Report - AS7067 Page 7 of 37
found). However, this may change as the impact of recent free trade agreements with the US and Thailand may not yet be fully felt.
Food and beverage imports have risen over the last five years and have a five-year average annual growth rate of 10% (in Australian dollar terms). When converted to U.S. dollars a significant trough appears in the 2005/06 growth rate, however, the five-year average annual import growth rate is 21%.
Figure 1: Total Australian Food Imports from 2002/03 to 2006/07
0
1,000
2,000
3,000
4,000
5,000
6,000
7,000
2002
-03
2003
-04
2004
-05
2005
-06
2006
-07
Food
Impo
rts (U
S$m
)
0%
5%
10%
15%
20%
25%
30%
35%
Gro
wth
Rat
e
Total FoodandBeverageimports(US$m)
Growthrate (US$)
Source: ABS Cat. No. 5368.0
UNCLASSIFIED USDA Foreign Agricultural Service

GAIN Report - AS7067 Page 8 of 37
Figure 2: Value Shares of Australian Food Imports, by country of origin (A$ terms)
Source: ABARE Australian Food Statistics 2006
The value of domestic farm and fishery food production reached US$26.0 million in 2005/06, representing a 9% increase from 2004/05. However this is forecast to fall in 2006/07 to US$22.8 million, reflecting the impact of the drought on crop yields.
Domestic processed food industry sales and service income totalled US$52.5 billion in 2004/05 (the most recent data available), with industry value added of US$13.1 billion (compared to US$11.8 billion the year prior).
Expected Growth Overall for Retail Food and Sub-sectors
Supermarkets and grocery stores continue to maintain the vast majority of the retail food market share, at around 60% over the period 2004-2006. The market share of takeaway food outlets has been stable, at just less than 10%. Cafés and restaurants have also maintained market share (at around 14%), reflecting consumers’ continued desire for convenience. Other food retailers, such as butchers and bakeries, have experienced a gradual growth in market share, to 16%.
UNCLASSIFIED USDA Foreign Agricultural Service

GAIN Report - AS7067 Page 9 of 37
Figure 3: Market Share by Food Channel, 2004-2006
6161
60
10 10 1015
1616
1413
14
0
10
20
30
40
50
60
70M
arke
t Sha
re (%
)
Supermarkets andGrocery Stores
Takeaway FoodRetailing
Other FoodRetailing
Cafes andRestaurants
2004
2005
2006
Source: ABS Cat. No. 8501.0
Woolworths has continued to increase store numbers, opening 22 new stores in the 2005/06 financial year.
Coles opened 20 new stores in 2006/07 and converted 129 of its Bi-Lo stores to Coles stores. This strategy proved unsuccessful however, and resulted in 71 of these stores being ‘unconverted’ back to the Bi-Lo name.
Metcash opened 42 new IGA stores in 2006/07, and plan to build a further 60 stores in 2007/08.
Supermarket and grocery store openings should allow the market share of this food channel to be maintained in 2007.
Uncertain irrigation water supply and drought are expected to continue to place upward pressure on retail prices.
Industrial relations reforms in Australia may place downward pressure on employment costs in shop front, delivery and shelf stacking, however the employment market is highly competitive and may partially offset this effect. Any net reduction in employment costs may reduce the effect of ongoing high commodity and packaging prices.
Trends in Distribution Channels
Distribution points in Australia are centralized. All major supermarket chains and warehouse/wholesale clubs operate their own network of national and regional distribution centers.
Woolworths is continuing to reduce its supermarket distribution centers (DCs) from 31 national DCs to 9 regional and two national. Seven regional DCs and both national DCs have been completed, with construction on the remaining 2 DCs underway. Two liquor DCs are also under construction and expected to be completed during 2008.
UNCLASSIFIED USDA Foreign Agricultural Service

GAIN Report - AS7067 Page 10 of 37
Coles opened two purpose-built national distribution centers in 2006/07 (one each in Victoria and NSW) and four regional DCs. The company closed five DCs during the year, with another 13 to be closed in 2007/08. This is part of a broader plan to boost efficiency, with the aim of reducing the number of DCs from more than 40 to just 26.
Banner groups are used by a large number of independent retailers to improve the buying, advertising and competitive power of smaller grocery and convenience stores. Under banner groups, retailers are able to negotiate better prices, coordinate marketing campaigns and collaborate to establish new programs that benefit consumers.
IGA Distribution has twelve distribution centers carrying around 21,000 items, which serve the dry, chilled and frozen grocery requirements of over 2,700 independent retail grocery stores on the Eastern seaboard of Australia and South Australia.
Campbell’s Cash & Carry operates 55 wholesale warehouses across New South Wales, Victoria, Queensland, South Australia and the Northern Territory carrying 12,000 liquor, food service, grocery, dairy, frozen, confectionery and tobacco products. Campbell’s also specializes in distribution to the gasoline and organized convenience store sector.
Australian Liquor Marketers is the leading broad range liquor wholesaler in Australia. It operates 18 distribution centers across Australia and New Zealand, carrying more than 8,000 products to meet the wine, spirits and beer requirements of more than 14,500 licensed premises.
Aldi currently operates from two distribution centers, one in Sydney (40,000m2) and the other in Melbourne (50,000m2). A A$60 million distribution center is currently being built in Stapylton, which is between the Gold Coast and Brisbane in Queensland.
There is a general trend of consolidation within and between alcoholic and non-alcoholic beverage manufacturers, bottlers and distributors.
Number and Type of Retail Outlets
Table 2 outlines the number of food retail outlets and percent change for the period 2003-2006.
Table 2: Grocery Market Breakdown by Outlets in Australia and Growth over the Period, 2003-2006
2003 2004 2005 2006 % Growth (total)
Chain Store Outlets 1 1,521 1,592 1,665 1,693 11Convenience Chain Store Outlets 2 NA NA NA 1,807 NABanner Traders & Other Independents 3
684 1,224 1,707 1,871 174
1. Grocery chains including Woolworths, Coles Myer Ltd, Franklins and Aldi2. Including Woolworths/Caltex, Coles/Shell, 7-eleven and other groups3. Including Foodworks and IGASource: Retail World Annual Report 05; Foodmap, 2007.
The number of chain store outlets increased 11% between 2003 and 2006, with the expansion of the Aldi chain (120 stores in 2006 compared to 54 stores in 2003) a key driver.
The number of banner traders and other independents rose substantially over the period, with both Foodworks and IGA boosting store numbers.
Aside from Foodworks and IGA stores, there were 850 ‘other’ independent retailers as at June 2006 (Foodmap 2007) including Night Owl and independent corner stores. There are currently 43 Night Owl stores in Australia. These are predominantly located in Queensland, but there are also stores in Sydney, Canberra, Adelaide, Melbourne and Hobart.
UNCLASSIFIED USDA Foreign Agricultural Service

GAIN Report - AS7067 Page 11 of 37
Trends in Services Offered by Retailers
Retailers are offering an increasingly diverse range of products and services, and extending both their offerings and store formats.
The leading chain supermarkets (Coles and Woolworths) are continuing in their attempt to provide a ‘one stop shop’ that fulfills customers’ shopping needs under the one roof.
Woolworths supermarket departments include: bakery, seafood, delicatessen, meat, produce, and dry groceries. Coles supermarkets have the following departments: produce, delicatessen, meat, patisserie and cappuccino café; and dry groceries.
In-store services offered at Woolworths include: Clover Hill flowers, flexible payment options, fresh food platters, WISH gift cards, home delivery, in-store butchers, mobile phone / recharge cards, parcel pick-up, and carpet cleaning equipment hire.
Coles in-store services include: choice of payment methods, customer accounts, FlyBuys, Coles 7 a day (a healthy eating program in collaboration with the Dietitians Association of Australia), Coles Baby Club (including free information, magazines, special offers and discounts to expectant and new parents), discontinued lines, fresh flowers, Coles Meal Ideas (recipe ideas that are healthy and quick to prepare), newspapers, fresh food platters, parcel pick-up, carry-to-car service, cash-on-delivery for elderly or disabled customers, carpet cleaning equipment hire, dry cleaning, gift cards, phone cards, photo processing, and photocopying.
Retailer catalogues are widely used throughout Australia and each of the major retailers distributes a full color 12-16-page catalogue to more than six million homes every week.
Opening hours for retailers, across most segments, have been deregulated with the exception of retailers in Western Australia. A referendum was held in WA as part of the state election in 2005, proposing to extend trading hours to 9pm Monday-Friday and allow Sunday trading for up to six hours. However, 58% of voters rejected the proposal and thus only those retailers who already operated extended hours were able to continue doing so. Extended trading hours in all other states has enabled the large supermarket chains to compete for the ‘convenience shopper’.
Woolworths, Coles and IGA offer discounted fuel. Woolworths customers that spend $37 or more in one transaction at any Woolworths/Safeway supermarket or Big W can save 15¢ per gallon at any CALTEX WOOLWORTHS or CALTEX SAFEWAY outlet on presentation of their shopping docket. Customers can save an additional 15¢ per gallon, if they spend $5 or more on in store items at a CALTEX WOOLWORTHS or CALTEX SAFEWAY outlet when purchasing discounted fuel.
Coles offers a 15¢ per gallon saving at any Coles Shell outlet when customers spend $37 or more at participating Coles, BI-LO, Liquorland, Coles Central, Pick 'n Pay Hypermarket and Liquorland Express stores, or online with Coles Online and ShopFast.
IGA customers can purchase fuel from any gas mart, spend a minimum of $37 at a participating IGA store, and present their fuel receipt, to receive a 15¢ per gallon reimbursement.
Liquor – Woolworths sells liquor through its BWS and Dan Murphy’s outlets. Coles owns a variety of liquor outlets including Liquorland, Vintage Cellars, and 1st Choice Liquor Superstore. Liquor is also available through Woolworths HomeShop and Coles Online.
Pharmaceuticals – The restrictions in place to prevent pharmacies operating within supermarkets will remain until 30 June 2010. Supermarkets are competing with pharmacies in non-prescription drugs and other over the counter products.
Organic – The demand for organic food in Australia is estimated to be growing at 25-30% per annum, with the Australian organic industry valued at US$339 million in 2006. The ‘Woolworths Organics’ range currently includes fresh fruit and vegetables, poultry, tinned products, milk and cheese. Woolworths also offers a ‘Naytura’ range which currently includes nuts, dried fruits, cereals, spreads and biscuits that have been selected to “provide the highest quality taste while being low in salt, sugar, fat and additives”.
There are more than 500 products in Coles’ organic range (including home brands and leading organic brands). ‘You’ll Love Coles Organic’ includes selected products in the
UNCLASSIFIED USDA Foreign Agricultural Service

GAIN Report - AS7067 Page 12 of 37
following areas: baby, bakehouse, dairy, fruit and vegetables, general merchandise, grocery and meat.
Generic labels - ‘Woolworths Select’ offers customers “a range of grocery lines with the highest quality products that are second to none”. The product range is still under development however currently includes: canned and frozen vegetables, fruit tubs, canned tuna and salmon, cheese, nuts, baby care items, hair accessories, marinades, condiments, sauces and dressings, side dishes, coffee, pasta, pet food, and cleaning and laundry products.
Woolworths ‘Home Brand’ products are available across most grocery departments and aim to provide “everyday household products at great value for money”.
‘You’ll Love Coles’ aims to provide Coles customers with “great tasting quality products without spending a fortune”. The product range is being expanded but currently includes: milk, cereal, honey, chocolate spread, ready-to-eat and layered salads, vine-ripened tomatoes, mince meat, canned salmon and tuna, ice cream, choc-chip cookies, baby clothing, body wash, and toilet tissue.
Other generic labels include Franklins’ ‘No Frills’ and IGA’s ‘Black and Gold’. Trend away from plastic bags towards reuseable bags - Coles offers the following
alternatives to conventional plastic bags: plastic bags using recycled content, polypropylene ‘Go-Green’ bags, calico bags, paper bags, and Smart Box (a heavy duty plastic box made from recycled material). Other initiatives being developed include Go Green Box (a wax-lined green cardboard box made from fully recycled material) and R Bag (a multi-use plastic bag made from HPDE plastic).
Woolworths has introduced a policy of only offering plastic bags to customers purchasing more than three items. As an alternative to plastic bags, Woolworths customers can purchase a ‘Green Bag’. This has been an extremely successful initiative with over 5 million Green Bags sold in Australia by the end of 2004. In addition, more than 30,000 Woolworths employees have undertaken ‘Fill the Bag not the Environment’ training.
Plastic bag recycling bins are located in-store at both Coles and Woolworths outlets. Home shopping via the Internet – Coles Online is available throughout metropolitan
Melbourne and in selected Sydney suburbs. Woolworths HomeShop is available throughout Sydney, Canberra and Melbourne.
Convenience stores offer a range of services (Error: Reference source not found). In 2001 the most common service offered was an ATM, with 92% of stores having this facility.
UNCLASSIFIED USDA Foreign Agricultural Service

GAIN Report - AS7067 Page 13 of 37
Figure 4: Proportion of Convenience Stores offering specialty services, 2001
92
4526
198
3
3
2
1
0 10 20 30 40 50 60 70 80 90 100
Proportion of stores (%)
ATM
Photo Copying
Internet Shopping Pick-up Point
Internet Access
Dry Cleaning
Vending machines
Lottery Agent
Video Rentals
Film Processing
Source: Australian Association of Convenience Stores, 2002
An increasing consumer demand for convenience and a trend towards more frequent shopping (ABARE 2005-06) has caused a shift in the break-down of product sales in convenience stores. Basic items such as cereal and milk have seen an increase in value within the total product sales for convenience stores (AC Nielsen). This reflects a trend towards the convenience of smaller stores for single or small purchases and just-in-time shopping patterns.
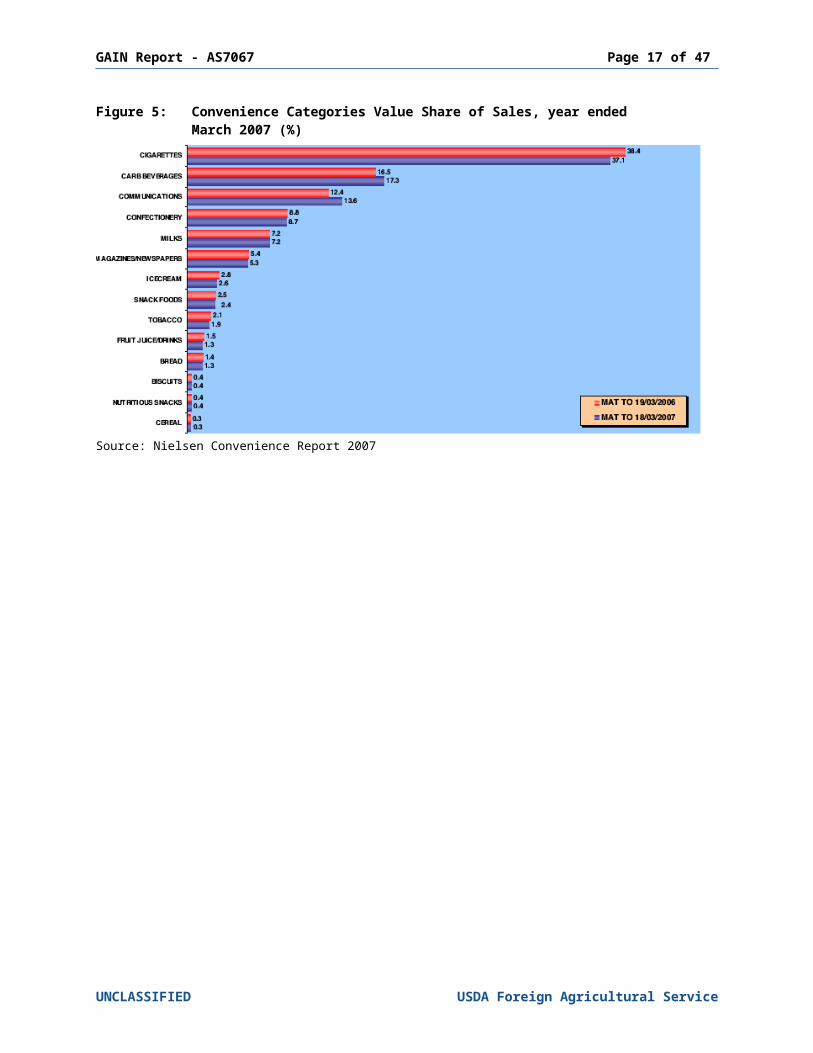
The largest selling product category in convenience stores is cigarettes, which account for 37% of product sales (Figure 5). Despite significant limitations imposed on, and regulation of, advertising, brand extension and presentation, this category has experienced a growth in value of 2% from 2006. This growth largely reflects taxation increases being passed on to consumers rather than sales volume growth. The next largest category (carbonated beverages) accounts for a share in value which is less than half that held by cigarettes. A few large producers dominate the cigarettes and carbonated soft drinks categories.
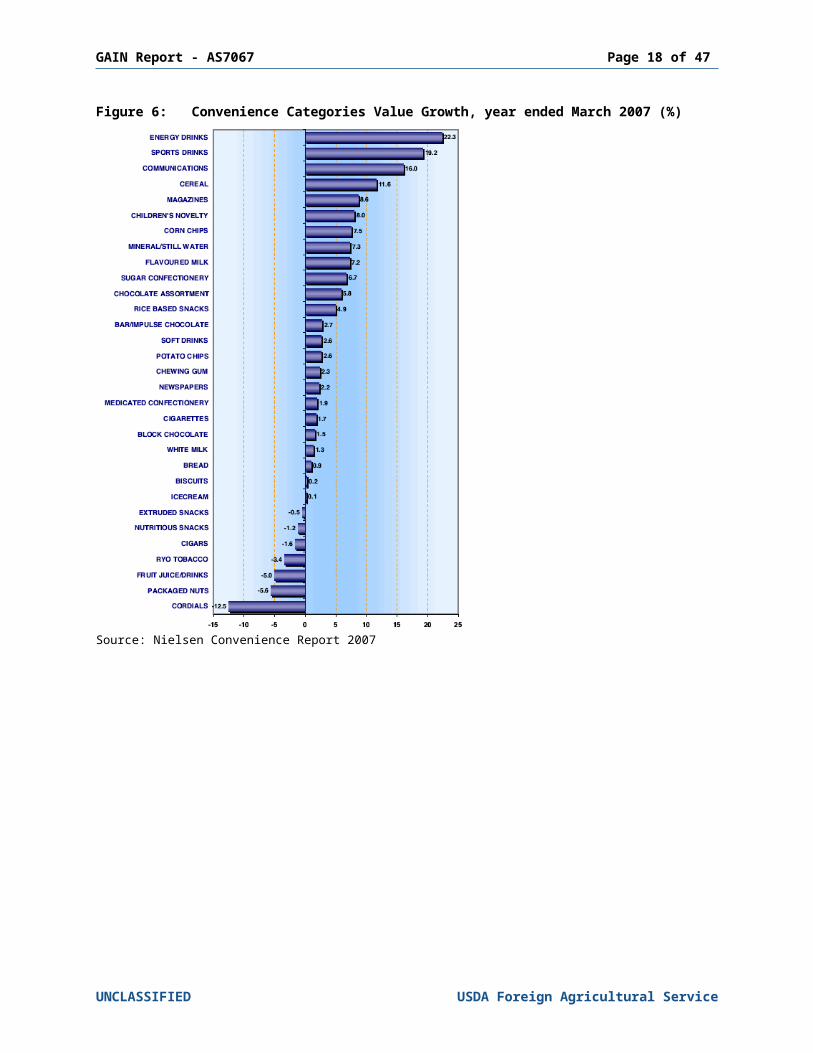
The product categories which have experienced the largest increase in percentage of value are energy and sports drinks. These product groups saw an increase in value of 22% and 19% respectively from 2006 (Figure 6)
Communications is the next biggest retail growth category in convenience stores, having seen an increase in value of 16% from 2006 (Figure 6). This category is driven by sales of pre-paid mobile phone credit, which account for half of the top ten new products based on sales value.
UNCLASSIFIED USDA Foreign Agricultural Service

GAIN Report - AS7067 Page 14 of 37
Figure 5: Convenience Categories Value Share of Sales, year ended March 2007 (%)
Source: Nielsen Convenience Report 2007
UNCLASSIFIED USDA Foreign Agricultural Service

GAIN Report - AS7067 Page 15 of 37
Figure 6: Convenience Categories Value Growth, year ended March 2007 (%)
Source: Nielsen Convenience Report 2007
UNCLASSIFIED USDA Foreign Agricultural Service

GAIN Report - AS7067 Page 16 of 37
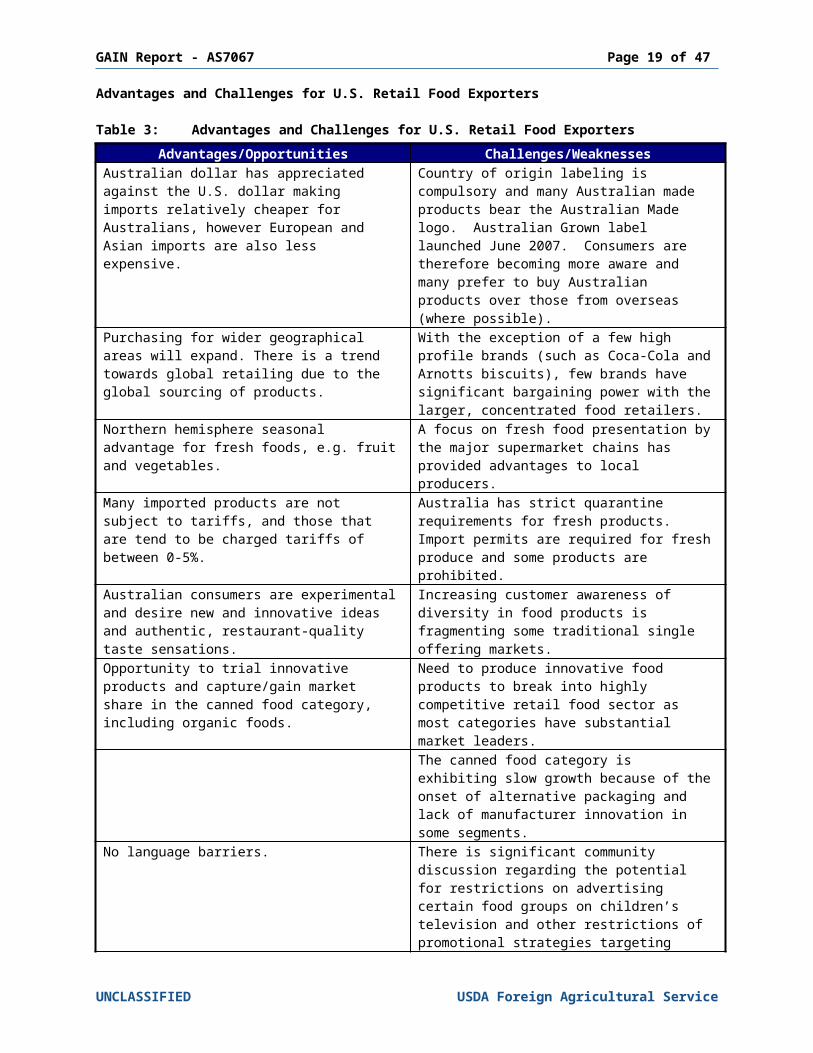
Advantages and Challenges for U.S. Retail Food Exporters
Table 3: Advantages and Challenges for U.S. Retail Food ExportersAdvantages/Opportunities Challenges/Weaknesses
Australian dollar has appreciated against the U.S. dollar making imports relatively cheaper for Australians, however European and Asian imports are also less expensive.
Country of origin labeling is compulsory and many Australian made products bear the Australian Made logo. Australian Grown label launched June 2007. Consumers are therefore becoming more aware and many prefer to buy Australian products over those from overseas (where possible).
Purchasing for wider geographical areas will expand. There is a trend towards global retailing due to the global sourcing of products.
With the exception of a few high profile brands (such as Coca-Cola and Arnotts biscuits), few brands have significant bargaining power with the larger, concentrated food retailers.
Northern hemisphere seasonal advantage for fresh foods, e.g. fruit and vegetables.
A focus on fresh food presentation by the major supermarket chains has provided advantages to local producers.
Many imported products are not subject to tariffs, and those that are tend to be charged tariffs of between 0-5%.
Australia has strict quarantine requirements for fresh products. Import permits are required for fresh produce and some products are prohibited.
Australian consumers are experimental and desire new and innovative ideas and authentic, restaurant-quality taste sensations.
Increasing customer awareness of diversity in food products is fragmenting some traditional single offering markets.
Opportunity to trial innovative products and capture/gain market share in the canned food category, including organic foods.
Need to produce innovative food products to break into highly competitive retail food sector as most categories have substantial market leaders.The canned food category is exhibiting slow growth because of the onset of alternative packaging and lack of manufacturer innovation in some segments.
No language barriers. There is significant community discussion regarding the potential for restrictions on advertising certain food groups on children’s television and other restrictions of promotional strategies targeting children.
Organic products are one way that US exporters could differentiate their products in the Australian market.
Australia is a net exporter of high quality commodity foods- in some segments, Australia is increasingly recognized as producing internationally competitive ‘clean and green’ products, and there is a trend towards regionally branded labels.
Affluent consumers concentrated in only a few geographical regions.Around 7% of Australians shop online for food/groceries. This offers an alternative avenue for marketing and advertising.
Source: various industry publications, websites, local knowledge
UNCLASSIFIED USDA Foreign Agricultural Service
GAIN Report - AS7067 Page 17 of 37
SECTION II: ROAD MAP FOR MARKET ENTRY
Entry Strategy
Market Access for Imported Products
Import or license the manufacturing and distribution of the product to a local food manufacturer.
Enter the market through a distributor, importer, agent or broker who then targets specific food category/merchandise managers at major wholesalers and major supermarket chains. Major chains and wholesalers have their own distribution centers and national coverage. Targeting major chains through an agent/distributor will reduce the risk of entering an inappropriate state market in Australia. Specialist distributors or wholesalers may also be approached.
Product promotion - product launches for supermarkets are popular and effective. Provide agent/distributor with promotional material and product suitable for in-store demonstrations. Promotional formats may vary. For example: EDLP: Every Day Low Price, including Rollback. Incremental lift is achieved by using
display and catalogue only - the price remains constant from week to week. Multi-buy: 3 for the price of 2 and buy one get one free offers have become a popular
way of giving consumers a discount without reducing sales value. Bonus offer: buy product A, get product B for free.
Couple promotion with advertising such as in-store display and store catalogues, major industry magazines (e.g. Retail World), newspapers, television, radio and public transport.
A 10% temporary price cut typically yields a 40% increase in sales, according to studies conducted by ACNielsen. However, in-store displays can add 65%, and catalogues another 20-25%, to baseline sales.
Exhibit at Australian food shows. Fine Food Australia, the premier international food, drink and equipment exhibition, was held in Sydney in 2007. It featured over 750 exhibitors including over 220 international exhibitors from 20 countries and attracted an estimated 30,000 trade visitors. The 2008 show will be held in Melbourne from September 22-25.
Product may also be sold via the Internet; however recent surveys suggest that the proportion of shoppers that purchase groceries online has been overestimated in the past. It is now thought that about 7% of the population shops online for groceries.
For unique and innovative products it may be appropriate to join forces with an Australian company to manufacture under license. U.S. products may then obtain brand recognition and a committed sales force.
Competitive Analysis
Imported products will have to compete with ‘Australian Made’ products. There is a general awareness and affiliation amongst consumers for buying Australian made goods. This may strengthen further with the launch of the ‘Australian Grown’ label for fresh produce.
Imported products need to be competitively priced to compete with the growing number of discount chain stores, e.g. Aldi.
Convenient, healthy, fresh and diverse meal solutions that are easy to buy, easy to store and easy to eat, are a consumer preference that provides future potential for imported products.
The use of food brokers in Australia is increasing. Food brokers can assist with market entry by bridging the gap between retailer’s reports and what is actually happening in the supermarkets. Brokers can also assist in getting a new product into distribution quickly. Some companies also offer warehousing and distribution options.
UNCLASSIFIED USDA Foreign Agricultural Service
GAIN Report - AS7067 Page 18 of 37
Comparative Advantage of U.S. Products
Due to the large U.S. market, U.S. manufacturers are able to develop a range of products far beyond that which can be achieved in Australia. This enables U.S. exporters to deliver innovative product lines that are otherwise not available from Australian manufacturers.
Ready to eat meals are still underdeveloped in Australia compared to the U.S. This is another area where there is opportunity for U.S. products to enter, although there are quarantine issues with regard to items containing meat and egg products. This provides an opportunity for US exporters to license production to manufacturers located in Australia.
Branding can be an advantage as many U.S. brands have significant market recognition and are presented or referenced across various sport and entertainment media.
Ability or Willingness of U.S. Exporters to Meet Market Requirements
The Australian market is very ‘Americanized’ and most food categories are compatible with Australian tastes. Many categories are dominated by American brands, such as Mars, Campbells, Kelloggs, and Coca-Cola, who have been very successful in the Australian market. However, some American product launches have not been as successful, especially within the chocolate confectionary segment. This may be due to the wide variety of chocolate confectionary that is already available in the Australian retail market.
Many U.S.-owned food manufacturers have an existing presence in the Australian market thereby making market entry easier.
Food labeling in Australia is stringent, and manufacturers need to consider the costs involved with changes in labeling for a relatively small market (Australia’s population is approximately 20 million). Sometimes the quantity required for the Australian market is not compatible with large volume U.S. production runs.
Another option that is currently used for some American branded products (for example Pringles, a potato chip snack food) is labeling that satisfies many different export markets. This assists in making the Australian market more accessible.
It is often helpful to engage a broker who understands the market, knows what presentation documents the retailers require, and has high-level trade relationships.
Market Structure
U.S. Product Flow
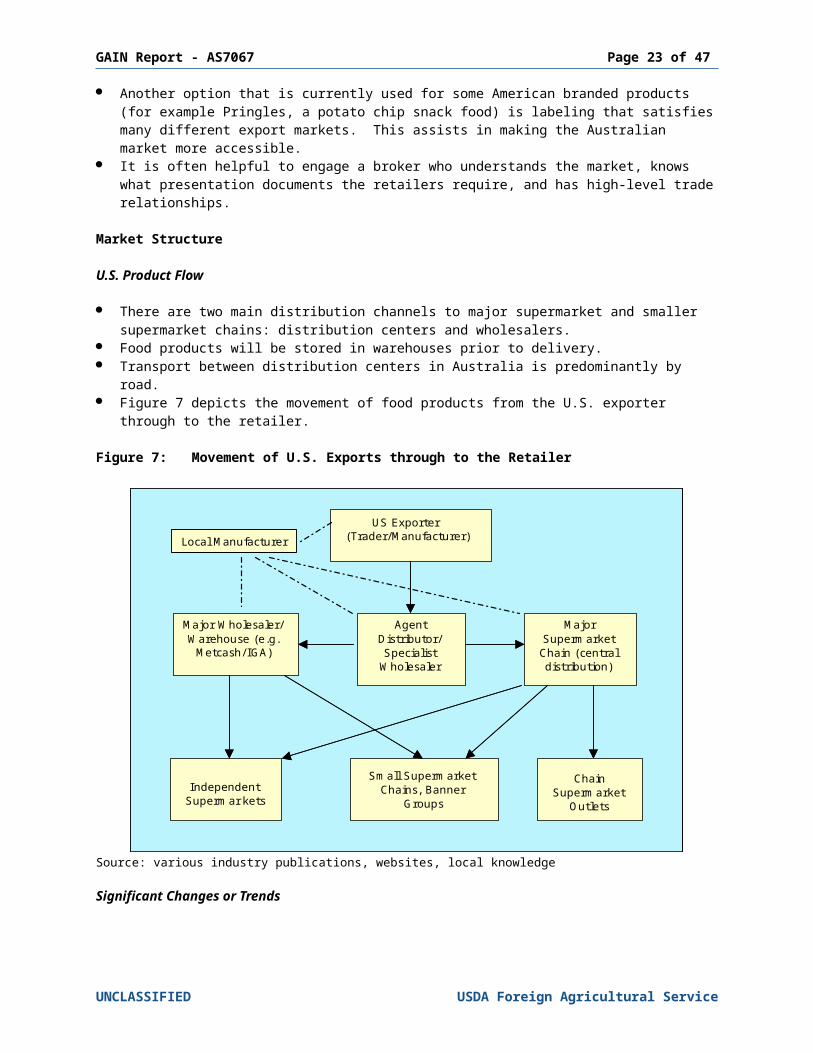
There are two main distribution channels to major supermarket and smaller supermarket chains: distribution centers and wholesalers.
Food products will be stored in warehouses prior to delivery. Transport between distribution centers in Australia is predominantly by road. Figure 7 depicts the movement of food products from the U.S. exporter through to the
retailer.
Figure 7: Movement of U.S. Exports through to the Retailer
UNCLASSIFIED USDA Foreign Agricultural Service
GAIN Report - AS7067 Page 19 of 37
US Exporter (Trader/Manufacturer)
Major Wholesaler/ Warehouse (e.g.
Metcash/ IGA)
Agent Distributor/ Specialist
Wholesaler
Major Supermarket Chain (central distribution)
Chain Supermarket
Outlets
Small Supermarket Chains, Banner
GroupsIndependent
Supermar kets
Local ManufacturerUS Exporter
(Trader/Manufacturer)
Major Wholesaler/ Warehouse (e.g.
Metcash/ IGA)
Agent Distributor/ Specialist
Wholesaler
Major Supermarket Chain (central distribution)
Chain Supermarket
Outlets
Small Supermarket Chains, Banner
GroupsIndependent
Supermar kets
Local ManufacturerUS Exporter
(Trader/Manufacturer)
Major Wholesaler/ Warehouse (e.g.
Metcash/ IGA)
Agent Distributor/ Specialist
Wholesaler
Major Supermarket Chain (central distribution)
Chain Supermarket
Outlets
Small Supermarket Chains, Banner
GroupsIndependent
Supermar kets
US Exporter (Trader/Manufacturer)
Major Wholesaler/ Warehouse (e.g.
Metcash/ IGA)
Agent Distributor/ Specialist
Wholesaler
Major Supermarket Chain (central distribution)
Chain Supermarket
Outlets
Small Supermarket Chains, Banner
GroupsIndependent
Supermar kets
Local Manufacturer
Source: various industry publications, websites, local knowledge
Significant Changes or Trends
Competition between major supermarket chains has encouraged segment and product discounting strategies. Smaller supermarket chains and ‘Mom and Pop’ independent supermarkets are facing increasing price competition. However, they remain in the market due to their convenience factor, the scale of the market in remote areas, and customer loyalty.
Fundamental changes are occurring in Australia, similar to the United Kingdom and the United States, with a variety of formats such as ‘express’ stores. These stores offer a smaller product range, large fresh and pre-packed food sections, and a large number of check-outs.
Flow Pattern between Different Retailers
Product flows in a similar manner for each of the major supermarkets chains, with each operating central distribution centers.
Independent supermarkets and smaller supermarket chains purchase their food products through the major wholesalers or direct from manufacturers.
Margins Gross margin data is very scarce, with the major retailers, wholesalers and manufacturers
reluctant to make this information public. As an alternative, the Earnings Before Interest & Tax (EBIT) margins for Woolworths (Retail and Wholesale), Coles (Retail), and Metcash (Wholesale) are presented in Figure 8. These margins show EBIT as a proportion of gross sales.
In 2005/06, Woolworths’ retail segment achieved an EBIT margin of almost 4.5%, compared to Coles’ margin of just over 2%*.
Metcash’s wholesale food segment recorded an EBIT margin of over 4% in 2006/07.
UNCLASSIFIED USDA Foreign Agricultural Service

GAIN Report - AS7067 Page 20 of 37
Figure 8: Earnings Before Interest & Tax Margins, 2001/02-2006/07
0%
1%
2%
3%
4%
5%
6%
2001/02 2002/03 2003/04 2004/05 2005/06 2006/07
Financial Year
Seg
men
t EB
IT M
argi
n
Coles (Food, Liquor & Fuel - Retail)
Woolworths (Supermarkets - Retail)
Woolworths (Australian IndependentWholesalers and StatewideIndependent Wholesalers)
Metcash (Food - Wholesale)
Metcash (Liquor - Wholesale)
Source: www.aspecthuntley.com.au* Coles data for 2006/07 not available at time of writing
A. SUPER STORES, SUPERMARKETS, HYPER MARKETS OR SUPER CENTERS, CLUB AND WAREHOUSE OUTLETS
Company Profiles
Table 4 and Table 5 provide a list of chain supermarkets and warehouses/wholesale clubs respectively. The lists are not exhaustive, however include the major chains, banner groups and warehouses/wholesalers. Woolworths and Coles Myer dominate the Australian retail food scene. The large foreign retailers are South African and German owned.
Table 4: Chain Supermarkets/SuperstoresRetailer Name & Outlet Type
Owner-ship
Sales($Mil)
No. of Outlets (June 2006)
No. Of Outlets (2005)
LocationsPurchasing Agent Type
Woolworths Local 37,734 756 744 National Warehouse, wholesaler, suppliers,
Woolworths 533 NationalSafeway 182 Vic, NSWFood for Less 25 NSW, Qld
UNCLASSIFIED USDA Foreign Agricultural Service

GAIN Report - AS7067 Page 21 of 37
brokers & growers.
Flemings 4 NSW
Coles Myer Ltd Local 17,768 737 733 National Warehouse, wholesaler, manufacturer & brokers
Coles 517 National, except NT
Bi Lo 214 NSW/ACT, Vic, Qld, SA
Pick`n’Pay 2 Qld Franklins South
African 807 80 80 NSW Warehouse,
wholesaler and suppliers
Aldi German N/A 120 109 NSW, ACT, Vic, Qld
N/A
Source: company websites and Retail World Annual Report 05, December 2005
Table 5: Warehouses/Wholesale ClubsRetailer Name &
Outlet TypeOwner-
shipSales($Mil)
No. Of Outlets Locations Purchasing
Agent TypeNo Frills Wholesale Cash N Carry1
Local N/A 3 Tasmania N/A
Metcash Limited and Campbells Cash & Carry
78% South African and Local
9,695 42 NSW, VIC, QLD and SA
N/A
1. Cash N Carry outlets service businesses throughout Tasmania who do not qualify to receive deliveries from the distribution centers or require additional products that are not available from the DC's. Its customer base includes supermarkets, milk bars, takeaways, hotels / motels, restaurants, service stations, caterers, school canteens, sporting / service clubs and others.Source: company websites
Trends in the Number and Type of Outlets
The number of chain supermarkets is growing substantially and has been driven by Aldi (store numbers have tripled since 2002), Coles (store numbers up 10%) and Woolworths (store numbers up 9%).
Aldi’s push into the retail food market has seen its share of NSW trade increase to more than 6%.
Major Internal and External Market Drivers
Customers are looking for clean, safe products that are healthy. According to Roy Morgan (a leading market research company), consumers are becoming more informed, and thus more demanding and discriminating. Nutritional and environmental concerns are having an increasing influence on purchasing decisions and, in some cases, this is coming at the expense of brand loyalty. However, some well-established manufacturers are responding to this trend and making adjustments to their product recipes. For example, Unilever has recently announced plans to remove artificial colors and flavors from the majority of its ice cream products.
There is substantial interest in new food lines. Examples of this include international cuisines, functional foods and beverages, organic, gluten-free and soy products.
Convenience is high on customers’ agendas, with limited time to produce home cooked meals (both partners working, but seeking nutritional quality and the convenience of takeaway). Roy Morgan reports that the trend towards shopping more than once a week has grown from around 30% in 1999 to almost 45% in March 2007.
UNCLASSIFIED USDA Foreign Agricultural Service
GAIN Report - AS7067 Page 22 of 37
B. CONVENIENCE STORES AND GAS MARTS
Entry Strategy
Appoint an agent/distributor in Australia to ensure distribution, availability of product and product promotion.
Product flows from U.S. exporter through agents/distributors, to wholesalers and then through to convenience stores/gas marts.
Major supermarket chains are entering the convenience store/gas mart market. Agents/distributors should market product to category managers for major chains.
Entry strategy for convenience stores is similar to that for supermarkets except that the agent/distributor should target the major wholesaler category managers as well as managers of Woolworths and Coles, who have adopted the gas/convenience store concept.
Convenience stores generally sell limited lines, gasoline and fast food, however larger convenience stores are starting to carry a greater product range. They are open long hours (in some cases, 24 hours a day) and are easily accessible to customers.
Market Structure
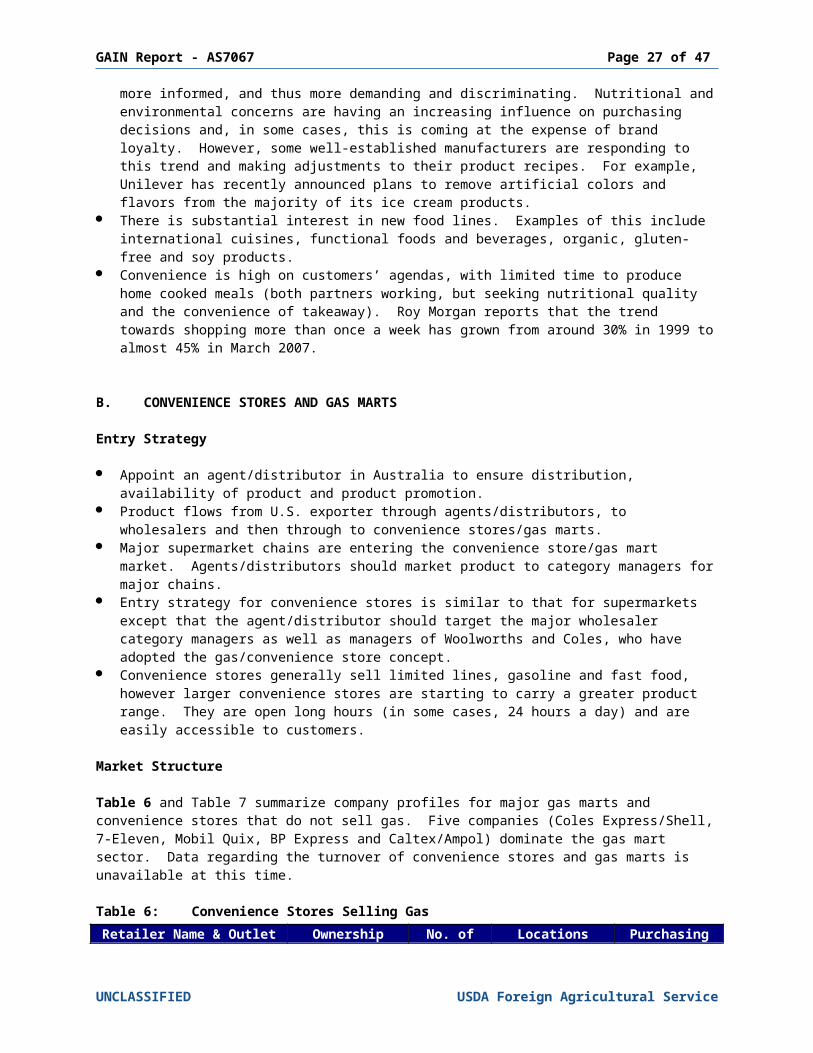
Table 6 and Table 7 summarize company profiles for major gas marts and convenience stores that do not sell gas. Five companies (Coles Express/Shell, 7-Eleven, Mobil Quix, BP Express and Caltex/Ampol) dominate the gas mart sector. Data regarding the turnover of convenience stores and gas marts is unavailable at this time.
Table 6: Convenience Stores Selling GasRetailer Name & Outlet
Type Ownership No. of Outlets1 Locations Purchasing
Agent TypeColes Express/Shell British Dutch 594 National Wholesaler
DistributorManufacturer
7-Eleven Local ownership franchise from U.S.
365 All states WholesalerManufacturerDistributor
Mobil Quix U.S. 311 NSW, Vic, SA, Qld
WholesalerManufacturerDistributor
BP Express (BP Australia Ltd, subsidiary of BP Amoco)
UK 225 National except Tasmania
WholesalerManufacturerDistributor
Caltex/Ampol ShopStop, Road Pantry, Star Mart
50% offshore ownership
172 National except NT
WholesalerDistributorManufacturer
BP Food Local 36 Western Australia
WholesalerManufacturerDistributor
Horizon Food Stores, Horizon Petroleum Pty Ltd
NA 15 Vic WholesalerManufacturerDistributor
1. Not all of these outlets sell gas, however data limitations prevent the number of gas outlets to be broken down any further.Source: company websites
Table 7: Convenience Stores Not Selling Gas
UNCLASSIFIED USDA Foreign Agricultural Service
GAIN Report - AS7067 Page 23 of 37
Retailer Name & Outlet Type Ownership No. of
Outlets Locations Purchasing Agent Type
City Convenience Stores
Foreign 68 52 in NSW Wholesaler & direct from vendors.
Foodwise Local 37 VIC Wholesaler & direct from vendors.
NightOwl Local Independent Franchise Systems
43 East Coast (38 Qld) – urban centers
WholesalerManufacturerDistributor
Gull Local 26Captain Cook Local 8 Sydney Wholesaler
ManufacturerDistributor
Source: company websites
Trends in the Number and Type of Outlets
The number of convenience stores selling gas is growing rapidly and is being driven by the in-store fuel offers of Coles and Woolworths, and their desire to gain a greater share of the convenience shopper’s dollar.
Convenience stores are beginning to stock a larger product range. Major Internal and External Market Drivers
Corner store convenience stores may be disadvantaged by consumer interest in ‘fresh’ and healthy foods.
Convenience stores may come under increasing pressure from the growing number of supermarket outlets in the CBD, which have long trading hours and offer fresh, pre-packaged meals and everyday items.
Customers include: city apartment dwellers, people that work in the CBD, ‘night owls’, car owners requiring gasoline, customers in the middle-to-high income range and in lower age brackets, and impulse buyers.
C. TRADITIONAL MARKETS – MOM/POP INDEPENDENT GROCERY, WET MARKETS
Entry Strategy
Independent Grocery
Similar strategy to that for small supermarkets and convenience stores, with appointment of agent/distributor for sale through major wholesalers.
Wet Markets
Australia does not have a system of wet markets; however, there is a system of markets for fresh produce with substantial presence in major cities. The majority of fresh produce moving through these markets is local, although overseas produce is available. Fresh produce from overseas should move directly through a specialist wholesaler or be sold directly to major chain supermarkets to avoid delays in the distribution channel.
Market Structure
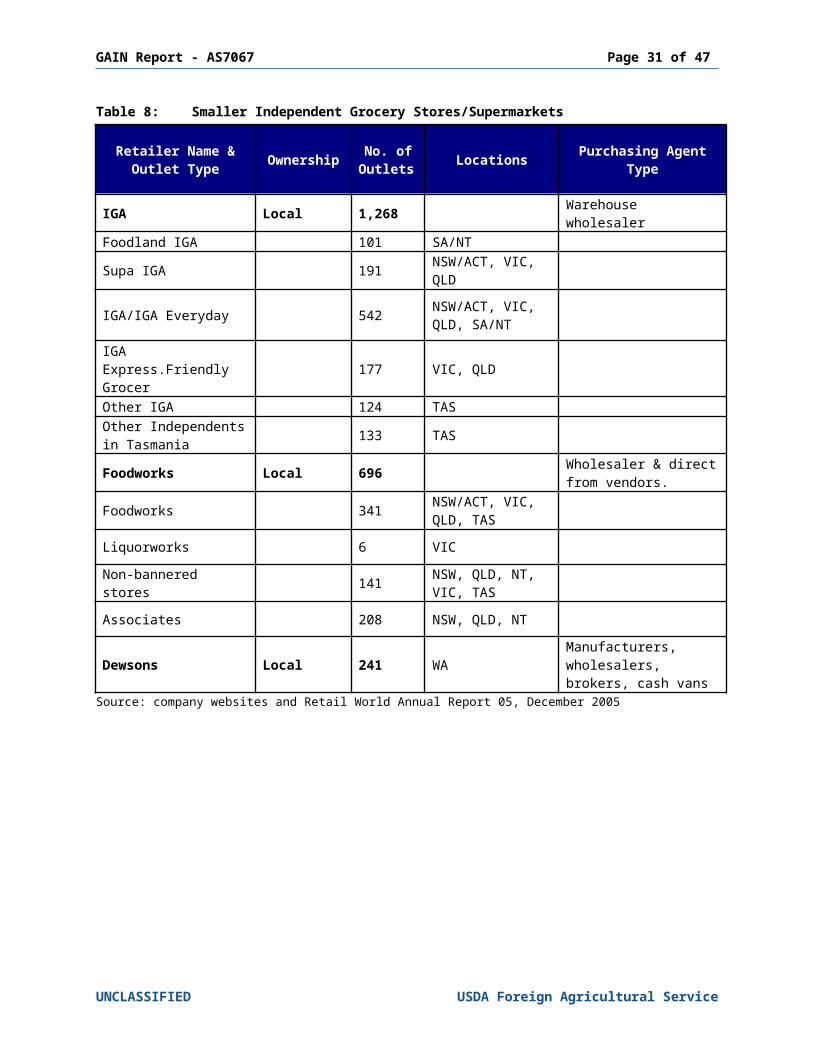
Table 8 provides information on the major smaller independent supermarkets in Australia.
UNCLASSIFIED USDA Foreign Agricultural Service
GAIN Report - AS7067 Page 24 of 37
Major Internal and External Market Drivers
Customers working longer hours, greater population mobility, and introduction of meal solutions places pressures on this sector.
This sector is also under pressure on price and opening hours from the major chain supermarkets.
However, customers enjoy the ‘old fashioned service’ that is offered by independent grocery stores and many retailers are increasing their product range (Supa IGA stores offer a full product range).
There has been an increase in value-added products such as deli/antipasto items, and ready made cakes and pastries.
Selected IGA stores also offer reimbursements on fuel, which match the fuel discounts offered by Woolworths and Coles.
Customers include commuters seeking ingredients for dinner, weekly shoppers, and the elderly and less mobile.
UNCLASSIFIED USDA Foreign Agricultural Service

GAIN Report - AS7067 Page 25 of 37
Table 8: Smaller Independent Grocery Stores/Supermarkets
Retailer Name & Outlet Type Ownership No. of
Outlets Locations Purchasing Agent Type
IGA Local 1,268 Warehouse wholesalerFoodland IGA 101 SA/NT Supa IGA 191 NSW/ACT, VIC,
QLD
IGA/IGA Everyday 542 NSW/ACT, VIC, QLD, SA/NT
IGA Express.Friendly Grocer 177 VIC, QLD Other IGA 124 TAS Other Independents in Tasmania 133 TAS
Foodworks Local 696 Wholesaler & direct from vendors.
Foodworks 341 NSW/ACT, VIC, QLD, TAS
Liquorworks 6 VIC
Non-bannered stores 141 NSW, QLD, NT, VIC, TAS
Associates 208 NSW, QLD, NT
Dewsons Local 241 WAManufacturers, wholesalers, brokers, cash vans
Source: company websites and Retail World Annual Report 05, December 2005
UNCLASSIFIED USDA Foreign Agricultural Service

GAIN Report - AS7067 Page 26 of 37
SECTION III: COMPETITION
For half of the categories in Table 9, New Zealand (NZ) is the major supply source of imports and for two of the remaining categories is in the top three. In large part this is due to its geographic closeness and the Australian-New Zealand Closer Economic Relationship Trade Agreement (ANZCERTA), a bilateral trade agreement that exists between the two countries.
Table 9 details the net imports for 10 major retail product categories. Major supply sources are limited to major import sources as data is not available on the total local production for each category.
Table 9: Summary of the Overall Competitive Situation Facing U.S. Imports in the Retail Food Sector
Product Category
Major Supply Source of imports
Strengths of Key Supply Countries
Advantages & Disadvantages of Local
SuppliersSnack Foods1
Net Imports:67,547 tonsUS$265.7m
NZ 23%China 11%Germany 7%Singapore 6%
Trade Agreements with NZ and Singapore
Close proximity and therefore reduced transaction costs
Brand recognition
Australian processing plants have access to a large range of raw materials
Lower transport costs
Breakfast cereals2
Net Imports:13,968 tonsUS$30.9m
NZ 30%Philippines 26%UK 10%US 8%
Trade Agreements with NZ and US
Close proximity and therefore reduced transaction costs
Brand recognition
Many Kellogg’s products sold in Australia are ‘Made in Australia’
Red meat3
Net Imports:4,098 tonsUS$16.5m
NZ 78%Australia 16%Vanuatu 4%Egypt 1%
Trade Agreement with NZ
Close proximity and therefore reduced transaction costs
NZ product seen as ‘clean and green’
Australia is the world's largest beef exporter and one of the largest lamb and mutton exporters
Rigorous import requirements are in place
Poultry4
Net Imports:19 tonsUS$0.01m
Australia 100% (i.e. this product has been re-imported into Australia)
N/A Uncooked Poultry imports banned
Import conditions for cooked poultry products are strict
Dairy5
Net Imports:95,975 tonsUS$298.9m
NZ 78%Denmark 3%Italy 3%South Korea 2%
Trade Agreement with NZ
Close proximity and therefore reduced transaction costs
NZ brand recognition and patronage with NZ owned brands
Australian products are widely regarded as synonymous with quality and variety
Comparative price advantages and the safety issues further assist the case for local and New Zealand product
UNCLASSIFIED USDA Foreign Agricultural Service
GAIN Report - AS7067 Page 27 of 37
Product Category
Major Supply Source of imports
Strengths of Key Supply Countries
Advantages & Disadvantages of Local
SuppliersEgg Products6
Net Imports:1,599 tonsUS$4.3m
UK 32%NZ 12%Denmark 11%Belgium 11%
Strong and growing egg export market
Close proximity of NZ benefits transport of perishable goods
Trade Agreement with NZ
Many of the suppliers are co-operative based farmer groups
Limited shelf life Import restrictions
apply to many egg products
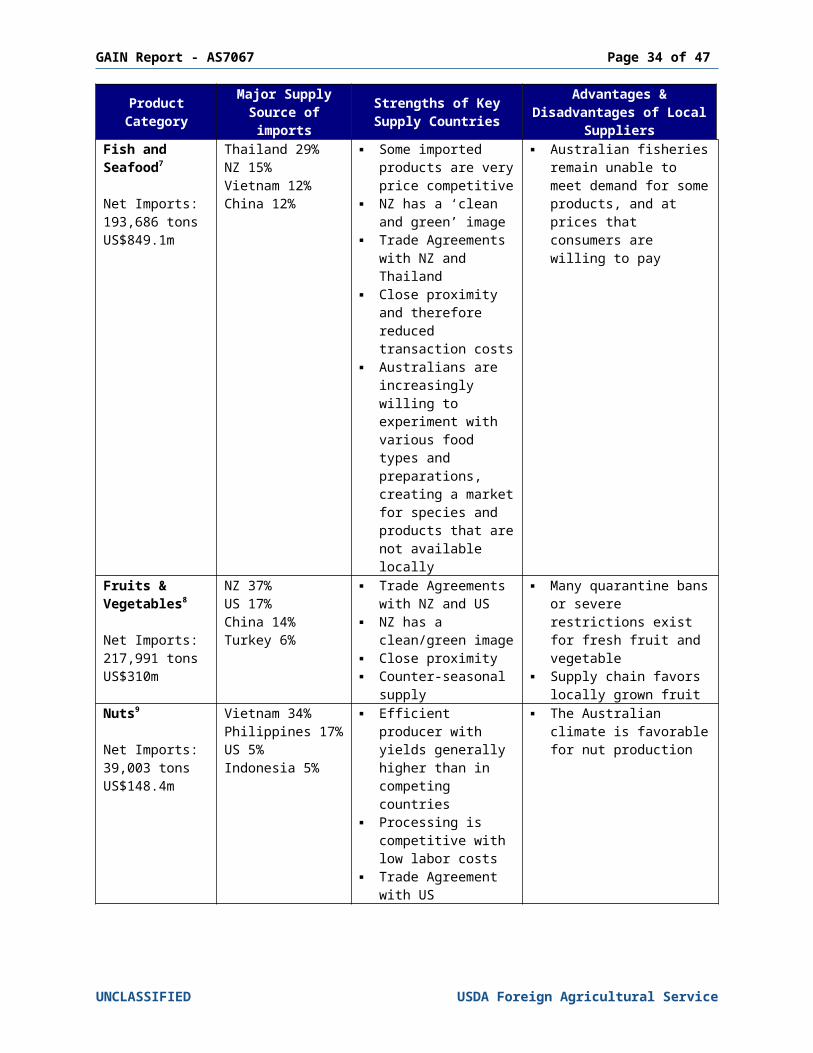
Fish and Seafood7
Net Imports:193,686 tonsUS$849.1m
Thailand 29%NZ 15%Vietnam 12%China 12%
Some imported products are very price competitive
NZ has a ‘clean and green’ image
Trade Agreements with NZ and Thailand
Close proximity and therefore reduced transaction costs
Australians are increasingly willing to experiment with various food types and preparations, creating a market for species and products that are not available locally
Australian fisheries remain unable to meet demand for some products, and at prices that consumers are willing to pay
Fruits & Vegetables8
Net Imports:217,991 tonsUS$310m
NZ 37%US 17%China 14%Turkey 6%
Trade Agreements with NZ and US
NZ has a clean/green image
Close proximity Counter-seasonal
supply
Many quarantine bans or severe restrictions exist for fresh fruit and vegetable
Supply chain favors locally grown fruit
Nuts9
Net Imports:39,003 tonsUS$148.4m
Vietnam 34%Philippines 17%US 5%Indonesia 5%
Efficient producer with yields generally higher than in competing countries
Processing is competitive with low labor costs
Trade Agreement with US
The Australian climate is favorable for nut production
UNCLASSIFIED USDA Foreign Agricultural Service

GAIN Report - AS7067 Page 28 of 37
Product Category
Major Supply Source of imports
Strengths of Key Supply Countries
Advantages & Disadvantages of Local
SuppliersInfant/Baby Products10
Net Imports:7,989 tonsUS$62.2m
Ireland 54%Singapore 19%Germany 13%France 7%
Trade agreement with Singapore
Well-established and respected US brand HJ Heinz holds the majority market share, however the baby food is manufactured in Australia
Nutricia (a Dutch nutritional foods company) recently purchased Australian grower-owned Golden Circle’s baby foods division
The level of information available from the Australian Customs Tariff codes restricts the analysis in this table. The primary constraint is that imports are recorded by food type and not end use. For example, all nuts will appear as nuts (by type and how they are prepared). However, nuts are potentially a ‘snack food’ but have not been included as such. Details of which tariff codes have been included in each category are documented as follows to assist with the interpretation of this information:1. Snack Food category includes tariff codes 1704 – sugar confectionary not containing cocoa and 1806
– chocolate and other food preparation containing cocoa.2. Breakfast cereal category includes import tariff code 1904 – prepared foods obtained by the swelling
or roasting of cereals or cereal products.3. Red meat includes tariff codes 0201- Meat Of Bovine Animals, Fresh Or Chilled, 0202 - Meat Of
Bovine Animals, Frozen, and 0204 - Meat Of Sheep Or Goats, Fresh Or Chilled Or Frozen.4. Poultry category includes tariff code 0207- Meat And Edible Offal, Of The Poultry Of Heading 01.05
Fresh, Chilled Or Frz5. Dairy Category includes tariff codes 0401- Milk And Cream, Not Concentrated Nor Sweetened, 0402-
Milk And Cream, Concentrated Or Sweetened, 0403- Buttermilk, Cream, Yogurt Etc, W/N Conc, Sweet Or Flav Or Cntg Add Fruit Or Cocoa, 0404- Whey, W/N Concentrated Or Sweet; Natural Milk Products W/N Sweet, Nes, 0405- Butter And Other Fats And Oils Derived From Milk ; Dairy Spreads, 0406- Cheese And Curd
6. Egg products includes tariff codes 0407- Birds' Eggs, In Shell, Fresh, Preserved Or Cooked and 0408- Birds'Eggs Unshelled,Egg Yolks,Fr Dried, Ckd By Wat,Mld,Frz O/W Presv, W/N Sweet
7. Fish and seafood includes tariff codes 0302- Fish, Fresh Or Chd, Excl Fish Fillets & Other Fish Meat Of Heading 03.04, 0303- Fish, Frozen, Excl Fish Fillets And Other Fish Meat Of Heading 03.04, 0304- Fish Fillets And Other Fish Meat, W/N Minced, Fresh, Chilled Or Frozen, 0305- Fish, Cured; Smoked Fish W/N Cooked; Fish Meal Fit For Human Consumption, 0306- Crust W/N In Shell, Live, Fr Etc; Crust In Shell Ckd In Water, W/N Chilled Etc, 0307- Mol W/N In Shell, Live, Aqua Invert O/T Crust & Mol, Live, Fr, Chd, Frz, Cured, 1604- Prepared Or Preserved Fish; Caviar & Caviar Subst Prepared From Fish Eggs, 1605- Crustaceans, Molluscs And Other Aquatic Invertebrates, Prepared Or Preserved
8. Fruits & vegetables includes tariff codes 0701- Potatoes, Fresh Or Chilled, 0702- Tomatoes, Fresh Or Chilled, 0703- Onions, Shallots, Garlic, Leeks & Other Alliaceous Veg, Fresh Or Chilled, 0706- Carrots, Turnips, Salad Beetroot & Sim Edible Roots, Fresh Or Chilled, 0707- Cucumbers And Gherkins, Fresh Or Chilled, 0708- Leguminous Vegetables, Shelled Or Unshelled, Fresh Or Chilled, 0709- Vegetables Nes, Fresh Or Chilled, 0710- Vegetables (Uncooked Or Cooked By Steaming Or Boiling In Water), Frozen, 0711- Vegetables Provisionally Preserved But Not Suitable For Immediate Consumption, 0712- Vegetables Dried, Whole, Cut, Sliced, Broken Or In Pdr, But Not Further Prepr, 0713- Vegetables, Leguminous Dried, Shelled W/N Skinned Or Split, 0714- Manioc, Arrowroot, Salep, Etc & Sim Roots & Tubers ; Sago Pitch, 0803- Bananas, Including Plantains, Fresh Or Dried, 0804- Dates, Figs,Pineapples,Avocadoes,Guavas, Mangoes & Mangosteens, Fr Or Dried, 0805- Citrus Fruit, Fresh Or Dried, 0806- Grapes, Fresh Or Dried, 0807- Melons (Including Watermelons) & Papaws (Papayas), Fresh, 0808- Apples, Pears And Quinces, Fresh, 0809- Apricots, Cherries, Peaches, (Incl Nectarines), Plums & Sloes, Fresh, 0810- Fruits Nes, Fresh
UNCLASSIFIED USDA Foreign Agricultural Service

GAIN Report - AS7067 Page 29 of 37
9. Nuts includes tariff codes 0801- Coconuts, Brazil Nuts And Cashew Nuts, Fresh Or Dried W/N Shelled Or Peeled, and 0802- Nuts Nes, Fresh Or Dried, Whether Or Not Shelled Or Peeled
10. This category includes tariff code 1901.10, Prep Of Cereals, Flour, Starch Or Milk For Infant Use, Put Up For Retail Sale
UNCLASSIFIED USDA Foreign Agricultural Service

GAIN Report - AS7067 Page 30 of 37
SECTION IV: BEST PRODUCT PROSPECTS
Category A: Products Present in the Market Which Have Good Sales Potential
Products presented in Table 10 are examples of products that have experienced strong sales growth during 2006 and are expected to continue this trend in 2007. Grocery sales growth (value and volume) for the 12-month period ended October 2006 has been reported, due to data limitations on category-specific 5-year annual import growth.
Table 10: Products Present in the Market Which Have Good Sales PotentialProduct
Category2006 Retail
Market Value (US$m)
2006 Imports(US$m)
Grocery Sales
Growth
Key Constraints Over Market Development
Market Attractiveness
for the USAEnergy Drinks & Sports Drinks
Energy drinks: US$51m
Sports drinks: US$56m
US$98m1 Energy drinks:Value: 29%Volume: 28%
Sports drinks:Value: 32%Volume: 33%
Red Bull and V hold 76% market share (volume terms)
Thought to be a ‘buzz-activated’ product, whereby consumers’ attention is attracted by new products, advertising and packaging
Trend towards impulse buying
Consumers are recognizing the functional benefits of energy / sports drinks
Still Water US$121m US$18m2 Value: 18%Volume: 12%
Bottled water is considered an ‘auto-pilot’ product, with habit and brand a significant influence on purchases
Consumers demanding healthy products
Portables: Breakfast Drinks and Bars
US$37m N/A Value: 17%Volume: 24%
Category dominated by Australian-owned Sanitarium (95% market share, volume terms)
These products are ‘variety-activated’, with consumers seeking new innovations and attractive packaging playing a key role
UNCLASSIFIED USDA Foreign Agricultural Service
GAIN Report - AS7067 Page 31 of 37
Product Category
2006 Retail Market Value
(US$m)
2006 Imports(US$m)
Grocery Sales
Growth
Key Constraints Over Market Development
Market Attractiveness
for the USAConfectio-nary
Chocolate Singles: US$225m
Mints: US$59m
US$265m3 Chocolate Singles: Value: 13.4% Volume: 9.7%
Mints: Value: 25%Volume: 16%
Chocolate singles category dominated by Cadbury and Nestlé with a corporate share value of 47.5% and 25.9% respectively.
Mint products are ‘variety-activated’, with consumers seeking new innovations and attractive packaging playing a key role
Source: Retail World’s Australasian Grocery Guide 2007, Australian Customs Tariff Codes1. Includes Customs Tariff Code 2202, Waters,Min Or Aerated,Sweet Or Flav,Non- Alc Bev Exc Fruit &
Veg Juices Of 20.092. Includes Customs Tariff Code 2201, Waters, Incl Nat Or Arti Min Or Aerated Waters Not Sweet Or
Flav; Ice & Snow3. Includes Customs Tariff Code 1704, Sugar Confectionery (Incl White Choc), Not Containing Cocoa
and Customs Tariff Code 1806, Chocolate and other food preparations containing cocoa
Category B: Products Not Present in Significant Quantities but Which Have Good Sales Potential
Products identified in this category are examples of innovative products that have recently been developed and are currently advertised in retail industry magazines, and other foods that, by comparison to similar products on the market, represent a small proportion of the market but experienced strong sales growth in 2006.
Table 11: Products Not Present in Significant Quantities but Which Have Good Sales Potential
Product Category
2006 Retail Market Value
(US$m)
2006 Imports(US$m)
Grocery Sales
Growth
Key Constraints Over Market Development
Market Attractiveness
for the USAFruit/Tea Drinks
US$12m N/A Value: 23%Volume: 24%
Lipton holds 93% market share (volume terms)
Appeals to a broad age group including people who are health conscious
Thought to be a ‘buzz-activated’ product, whereby consumers’ attention is attracted by new products, advertising and packaging
UNCLASSIFIED USDA Foreign Agricultural Service

GAIN Report - AS7067 Page 32 of 37
Product Category
2006 Retail Market Value
(US$m)
2006 Imports(US$m)
Grocery Sales
Growth
Key Constraints Over Market Development
Market Attractiveness
for the USACoffee Bags US$8m US$136m1 Value: 41%
Volume: 36% Coffee is
considered an ‘auto-pilot’ product, with habit and brand a significant influence on purchases
Appeals to consumers looking for convenience
Condiments Mustards and Horseradishes: US$18.5m
Gravy and Sauce: US$64m
US$146m2 Mustards and Horseradish: Value: 8.3%Volume: 2%Including Squeezy CondimentsMarket value of US$4.5m:Value: 21%Volume: 14%
Gravy and Sauce: Value: 10.8%Volume: 5.3%Including Liquid GravyMarket value of US$11m: Value: 87%Volume: 85%
Masterfoods holds a 92% market share (volume terms) in squeezy condiments
Quarantine restrictions on gravy that contains meat products
Consumers are increasingly time-poor, therefore are seeking convenience and health benefits (e.g. reduced salt, low fat)
1. Includes Tariff Code, 0901, Coffee W/N Roast Or Decaff; Coffee Husks & Skins; Coffee Subst Cntg Any Coffee
2. Includes Tariff Code, 2103, Sauces and Preparations thereof; mixed condiments and mixed seasonings; mustard flour and meal and prepared mustard
Source: Retail World’s Australasian Grocery Guide 2007, Australian Customs Tariff Codes
UNCLASSIFIED USDA Foreign Agricultural Service

GAIN Report - AS7067 Page 33 of 37
Category C: Products Not Present in the Market Because They Face Significant Barriers.
Products presented in Table 12 are examples of products that face significant import restrictions and are therefore only present in the market in limited quantities.
Table 12: Products Not Present in the Market Because They Face Significant Barriers
Product Category
2006 Retail Market Value
(US$m)
2006 Imports(US$m)
Grocery Sales
Growth
Key Constraints Over Market Development
Market Attractiveness
for the USAChicken – uncooked
N/A N/A Not available Not permitted in Australia because an import risk analysis has not been conducted
N/A
Chicken Frozen1
Not available US$2m Not available Strict import restrictions
Import risk analysis currently underway (for all countries except NZ)
Un-canned, cooked chicken imports permitted
Australian consumption of chicken is increasing
Fresh Fruit2 Not available US$149m Not available Many fresh fruit imports are prohibited and very strict quarantine regulations are enforced for those that are not prohibited
Seasonal advantage
Source: Retail World’s Australasian Grocery Guide 2007, Australian Customs Tariff Codes1. This category includes Customs Tariff Code 0207, Meat And Edible Offal, Of The Poultry Of Heading
01.05 Fresh, Chilled Or Frozen; and 1602.3, Other prepared or preserved meat, meat offal or blood of poultry of 01.05.
2. Customs Tariff Codes include 0803, 0804, 0805, 0806, 0807, 0808, 0809 and 0810 and include both fresh and dried fruit. This analysis was unable to be further refined.
UNCLASSIFIED USDA Foreign Agricultural Service
GAIN Report - AS7067 Page 34 of 37
SECTION V. POST CONTACT AND FURTHER INFORMATION
Import Regulations
Information on Food Law and Policy in Australia can be obtained from the www.ausfoodnews.com.au website.
See the Australian Quarantine & Inspection Service import conditions (ICON) database to identify whether your product is prohibited entry to Australia - http://www.aqis.gov.au/icon32/asp/ex_querycontent.asp
Australia’s Food Labeling Regulations
In Australia, Food Standards Australia New Zealand (FSANZ) regulates the delivery of safe food. FSANZ is a bi-national independent statutory authority. It develops food standards for composition, labeling and contaminants (including microbiological limits) that apply to all foods produced or imported for sale in Australia and New Zealand. FSANZ operates under the Food Standards Australia New Zealand Act 1991.
The Foreign Agricultural Import Regulations and Standards (FAIRS) report from this office contains detailed information on the Food Standards Code and other food regulations. A copy of this report can be obtained by conducting a “AGR Number” (Option 3) search on the following page web page: http://www.fas.usda.gov/scriptsw/attacherep/default.asp for report number AS7040.
An Internet version of the code can be located on the FSANZ web site at: http://www.foodstandards.gov.au/thecode/foodstandardscode.cfm
Industry Information
The Association of Sales & Marketing Companies Australiasia (ASMCA)www.asmca.com
The association is a representative voice for brokers, agencies, importers, demonstration and marketing companies. The ASMCA keeps its members abreast of matters affecting customer relations, technology, standards, market growth and sales trends.
Australian Food & Grocery CouncilLevel 2, Salvation Army Building2-4 Brisbane AvenueBarton ACT 2600Australia
Tel: +61-2-6273 1466Fax: +61-2-6273 1477Email: [email protected]: http://www.afgc.org.au
UNCLASSIFIED USDA Foreign Agricultural Service

GAIN Report - AS7067 Page 35 of 37
Food and Beverage Importers Association181 Drummond StCarlton Victoria 3053Australia
Tel: +61-3-9639 3644Fax: +61-3-9639 0638Email: [email protected] Web: http://www.fbia.org.au/index.html
Trade Shows
Fine Food is the largest food industry show in Australia. The show gives buyers the chance to sample new products and talk directly to the suppliers. The new natural product section is expected to be a major draw card, with chefs and retailers discovering products that kind to the environment, kind to consumers and a big hit on the menu. In 2008, the show will be held at the Melbourne Exhibition and Convention Center from September 22-25. For further information please contact Australian Exhibition Services at the address below.
Timothy Collett, Exhibition DirectorDiversified Exhibitions AustraliaIlloura Plaza, 424 St Kilda RoadMelbourne Victoria 3004Australia
Tel: +61-3-9261 4500Fax: +61-3-9261 4545Email: [email protected] Web: http://www.finefoodexpo.com.au
Major Wholesalers
Metcash Limited and Campbells Cash & Carry PO Box 6226 Silverwater Business Centre Silverwater NSW 1811 Australia
Tel: +61-2-9741 3000Fax: +61-2-9741 3399Email: [email protected] Web: http://www.metcash.com/
No Frills Wholesale Cash N Carry
44 Gormanston RdMoonah Tasmania 7009Australia
Tel: +61-3-6211 6522Fax: +61-3-6278 0525Email: [email protected] Web: www.tasiw.com.au
UNCLASSIFIED USDA Foreign Agricultural Service

GAIN Report - AS7067 Page 36 of 37
Major Retailers
Coleswww.coles.com.au
Woolworthswww.woolworthslimited.com.au
Aldi www.aldi.com.au
IGAwww.iga.net.au
Foodworkswww.foodworks.com.au
Bibliography
AC Nielsen Convenience Report, 2007AC Nielsen Grocery Report, 2005 and 2006Australian Bureau of Agricultural and Resource Economics (ABARE), Australian Food Statistics 2006 Available at www.abareconomics.com ABARE, Australian Commodities 2007 Available at www.abareconomics.com Australian Bureau of Statistics (ABS) Catalogue Numbers 5368, 5422, 6440, 8501, 8622,
8624, Available at www.abs.gov.au Australian Government Department of Foreign Affairs and Trade, United States fact sheet
2007Australian Government Department of Agriculture, Fisheries and Forestry (DAFF) Australian Convenience Store News 2007DAFF National food industry strategy 2002CEASA Australian Grocery Industry Review 2005Euromonitor, World Retail Data and Statistics 2007Food News Bulletins 2006 to 2007Freshlogic report to the National food Industry Council, Australian food industry: Retail market
trends and their implications 2006Griffith, G. (2004) The impact of supermarkets on farm suppliers, Australian Economic Review
37 (3) pp.329-336KordaMentha, Retail pharmacy: Industry vitals 2006Progressive Grocer Annual Report 2005Rabobank Agribusiness Review August and July 2007Reserve Bank of Australia (RBA) Exchange Rates, Available at www.rba.gov.au Retail World MagazineRetail World Annual Report 2005
UNCLASSIFIED USDA Foreign Agricultural Service

GAIN Report - AS7067 Page 37 of 37
Retail World’s Australasian Grocery Guide 2007Smith, R. (2004) The Australian grocery industry, Australian Economic Review 37 (3) pp.304-
310Spencer, S & Kneebone, M 2007, FoodMap: A comparative analysis of Australian food
distribution channels, Australian Government Department of Agriculture, Fisheries and Forestry, Canberra.
University of Western Sydney, The processed food product system in Australia, 2001
UNCLASSIFIED USDA Foreign Agricultural Service

![[PPT]Cash Reconciliation & Internal Controls - sfsd.mt.gov > …sfsd.mt.gov/Portals/24/LGSB/OtherPresentations/Cash... · Web viewCash Reconciliations ~ Related Internal Controls](https://img.pdfslide.us/doc/110x75/5ae6c0457f8b9acc268dc729/pptcash-reconciliation-internal-controls-sfsdmtgov-sfsdmtgovportals24lgsbotherpresentationscashweb.jpg)