Embed Size (px)
Citation preview
ARTICLE IN PRESS
Mechanical Systemsand
Signal Processing
0888-3270/$ - se
doi:10.1016/j.ym
�CorrespondE-mail addr
Mechanical Systems and Signal Processing 21 (2007) 824–839
www.elsevier.com/locate/jnlabr/ymssp
Approximate Entropy as a diagnostic tool for machinehealth monitoring
Ruqiang Yan, Robert X. Gao�
Department of Mechanical and Industrial Engineering, University of Massachusetts, Amherst, MA 01003, USA
Received 7 April 2005; received in revised form 16 February 2006; accepted 22 February 2006
Available online 4 April 2006
Abstract
This paper presents a new approach to machine health monitoring based on the Approximate Entropy (ApEn), which is a
statistical measure that quantifies the regularity of a time series, such as vibration signals measured from an electrical
motor or a rolling bearing. As the working condition of a machine system deteriorates due to the initiation and/or
progression of structural defects, the number of frequency components contained in the vibration signal will increase,
resulting in a decrease in its regularity and an increase in its corresponding ApEn value. After introducing the theoretical
framework, numerical simulation of an analytic signal is presented that establishes a quantitative relationship between the
severity of signal degradation and the ApEn values. The results of the simulation are then verified experimentally, through
vibration measurement on a realistic bearing test bed. The study has shown that ApEn can effectively characterise the
severity of structural defect, with good computational efficiency and high robustness.
r 2006 Elsevier Ltd. All rights reserved.
Keywords: Approximate Entropy; Machine health monitoring; Computational efficiency
1. Introduction
The past decades have seen increasing attention from the research community worldwide on machinecondition monitoring and health diagnosis. The efforts have fuelled the continued advancement of sensing aswell as signal-processing technologies. In addition to commonly used time (statistical [1–4]) and frequency(spectral [2,5,6]) domain techniques, advanced signal processing techniques, such as blind source separation,and wavelet transforms, have been investigated as new tools for fault detection in mechanical systems [7–10].Due to instantaneous variations in friction, damping, or loading conditions, machine systems are oftencharacterised by non-linear behaviours. Therefore, techniques for non-linear parameter estimation provide agood alternative to extracting defect-related features hidden in the measured signals that may not beeffectively identified using other techniques.
A number of non-linear parameter identification techniques have been investigated, such as Correlation
Dimension [11] and Complexity Measure [12,13], for patient sleep evaluation [14], gearbox tooth defect
e front matter r 2006 Elsevier Ltd. All rights reserved.
ssp.2006.02.009
ing author. Tel.: +1 413 5450868; fax: +1 413 5451027.
ess: [email protected] (R.X. Gao).
ARTICLE IN PRESSR. Yan, R.X. Gao / Mechanical Systems and Signal Processing 21 (2007) 824–839 825
diagnosis [15], and rolling bearing defect detection [16,17]. Reliable estimation of the Correlation Dimension ofa time series requires that a large quantity of data points be calculated [18,19], leading to lengthycomputational time and insuitability for on-line, real-time applications. The Complexity Measure, incomparison, is computationally more efficient. The complexity of a signal can be described by two measures:the Lempel– Ziv Complexity [12,20] and Approximate Entropy (ApEn) [13,21]. The Lempel– Ziv Complexity
indicates the degree of regularity of a time series, and has shown to be effective in quantifying the relationshipbetween brain activity patterns and depth of anesthesia (DOA) in patients [22]. As an example, theelectroencephalographs (EEG) of test patients have shown a higher Complexity value in the awake state thanin the sleep state. Furthermore, studies on the heart’s conducting system have shown that important indicatorsof the heart rhythm regularity, such as Sinus rhythm (SR), ventricular tachycardia (VT), and ventricularfibrillation (VF) [23], could be effectively detected and separated through Complexity thresholding, whereasother techniques, such as Fourier transform-based VF-filtering, has shown difficulty. Analysis of Complexity
values resulting from vibration measurement on a large rotating machine [24] has shown that the inceptionand growth of faults in the machine could be correlated with changes in the Complexity value. Another studyon defects detection in rolling bearings has established quantitative relationship between the Complexity valueand the defect size, and consequently the defect severity level [25].
Evaluation of the Complexity values of a time-series is based on a ‘‘coarse-graining’’ operation by which thedata sequence is transformed into a pattern of only a few symbols, e.g. 0 and 1, and involves data sequencecomparison and number counting in only one dimension [20]. In comparison, Approximate Entropy
expresses the regularity of a time series in multiple dimensions, and contains more time-related information[21]. This makes it an attractive tool for monitoring system dynamics, as information on the temporalprogression of a defect is valuable not only for diagnosing the current machine condition, but also inpredicting its future behaviour. In a study on turbo generator, it was found that the ApEn values haveincreased significantly after looseness of the bearing bushing was identified, when compared with normaloperation conditions [26]. In the field of biomedical engineering, studies on foetal heart rates usingcardiotocography (CTG) have shown correlation between the increase of ApEn values and pathologicalconditions [27]. Similar studies on EEG signals have found that an increase of the ApEn values can be used todetect and characterise eplieptic activities [28]. In another study, different sleep states were successfullyidentified by variations of the ApEn values of EEG signals [29]. In the field of physiological data analysisfor plants, ApEn values were found to be clearly indicative of changes in the sap flow dynamics of twotropical tree species under water deficit [30]. In addition, ApEn has been applied to the detection of humanmotion, in which static background, motion envents, and temporal clutter could be distinguished from eachother, based on their ApEn values [31]. Furthermore, ApEn has shown to be effective as a feature detector, foridentifying potential areas of interest within an image for target detection and image compression [32,33].Recently, the application of ApEn has been extended to assess subtle, exploitable changes in financial markettime series [34].
This paper investigates the utility of ApEn as a measure for characterising machine operationconditions, with the goal to introduce a quantitative diagnostic tool for machine health monitoring. Afterpresenting the theoretical background, the effects of several parameters that are of key relevance to the ApEn
calculation, e.g. data length, sampling rate, dimension, and tolerance value, are discussed. Numericalsimulation of an analytic signal is then presented to establish a quantitative relationship between the signalregularity (which is affected by the degradation of structural health due to defect propagation) and the ApEn
values. Simulation results are then experimentally verified, using vibration signals measured on a realisticbearing test bed. Good agreement between the simulation and experimentation was found, confirming theeffectiveness of ApEn in characterising the severity of structural defect, and its computational efficiency andhigh robustness.
2. Theoretical background
For a time series S containing N data points {x(1), x(2),y,x(N)}, its ‘‘regularity’’ can be measuredby ApEn in a multiple dimensional space [13], in which a series of vectors are constructed and
ARTICLE IN PRESSR. Yan, R.X. Gao / Mechanical Systems and Signal Processing 21 (2007) 824–839826
expressed as
X ð1Þ ¼ fxð1Þ;xð2Þ; . . . ;xðmÞg
X ð2Þ ¼ fxð2Þ;xð3Þ; . . . ;xðmþ 1Þg
. . .
X ðN �mþ 1Þ ¼ fxðN �mþ 1Þ;xðN �mþ 2Þ; . . . ; xðNÞg:
(1)
In Eq. (1), each of the vectors is composed of m consecutive and discrete data points of the time series S
[13,21]. The distance dðX ðiÞ; X ðjÞÞ between two vectors X(i) and X(j) can be defined as the maximum differencein their respective corresponding elements:
dðX ðiÞ;X ðjÞÞ ¼ maxk¼1;2;:::;m
ðjxði þ k � 1Þ � xðj þ k � 1ÞjÞ, (2)
where i ¼ 1; 2; . . . ;N �mþ 1, j ¼ 1; 2; . . . ;N �mþ 1, and N is the number of data points contained in thetime series.
For each vector X(i), a measure that describes the similarity between the vector X(i) and all other vectorsX ðjÞ; j ¼ 1; 2; . . . ;N �mþ 1; jai can be constructed as
Cmi ðrÞ ¼
1
N � ðm� 1Þ
Xjai
Yfr� d½X ðiÞ;X ðjÞ�g; j ¼ 1; 2; . . . ;N �mþ 1, (3)
where
Yfxg ¼1; xX0;
0; xo0:
((4)
The symbol r in Eq. (3) represents a predetermined tolerance value, defined as
r ¼ k � stdðSÞ, (5)
where k is a constant (k40), and stdðdÞ represents the standard deviation of the time series. By defining
fmðrÞ ¼
1
N �mþ 1
Xiln ½Cm
i ðrÞ�; i ¼ 1; 2; . . . ;N �mþ 1 (6)
the ApEn value of the time series can be calculated as
ApEnðm; rÞ ¼ limN!1½fmðrÞ � fmþ1
ðrÞ�. (7)
For practical applications, a finite time series consisting N data points is used to estimate the ApEn value ofthe time series, which is defined as
ApEnðm; r;NÞ ¼ fmðrÞ � fmþ1
ðrÞ. (8)
Eq. (8) indicates the similarity among the reconstructed vectors within the time series, when the dimensionof the vectors has increased from m to m+1 [21]. This affects the regularity of the time series being analysedand consequently, the associated ApEn value. The greater the regularity is, the lower the ApEn value. As anexample, a periodic time series containing only a single frequency component will have a low ApEn value(which approaches zero), due to the high regularity of the signal. In contrast, complex time series containingmultiple frequency components will have high ApEn values, due to a low level of regularity.
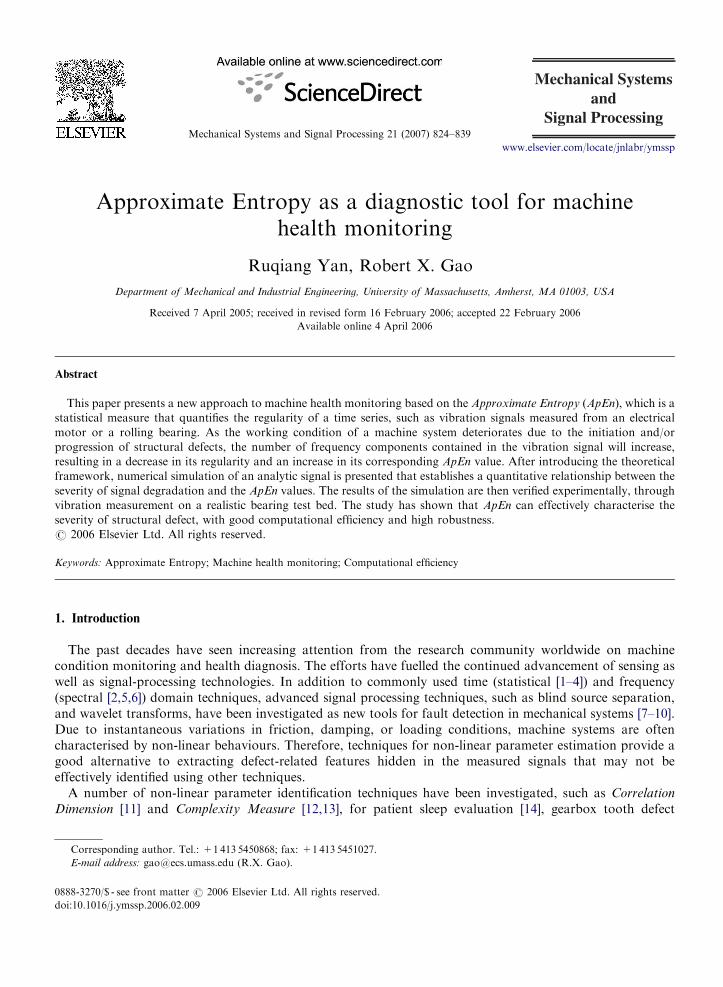
To calculate the ApEn value of a given time series S, data points contained within the series are firstrearranged into a series of m and an m+1 dimensional vectors, respectively, as illustrated in Fig. 1. Thedistances between two corresponding data points from each vector are then calculated. Based on Eq. (3), thesimilarity measure for the reconstructed vectors under a given r value is obtained, for each dimension m andm+1. Subsequently, the ApEn value for the time series S with N data points is calculated using Eq. (8). Toensure consistency of the ApEn calculation, a minimum data length N, as well as appropriate dimension m andtolerance r need to be determined. In the presented study, the effects of data length, dimension, and toleranceon the ApEn value calculation have been investigated, based on realistic vibration signals measured from abearing test bed.
ARTICLE IN PRESS
Fig. 1. Major steps in the Approximate Entropy calculation.
2000 3000 4000 50000 1000 6000
-0.4
-0.2
0
0.2
0.4
0.6
-0.6
Sampling Data Points
Sig
nal (
V)
0 50 100 150 2000
0.02
0.04
0.06
0.08
0.10
Frequency
PS
D (
Wat
ts/H
z)
f uf m
f BP
FO
2% f B
PF
O
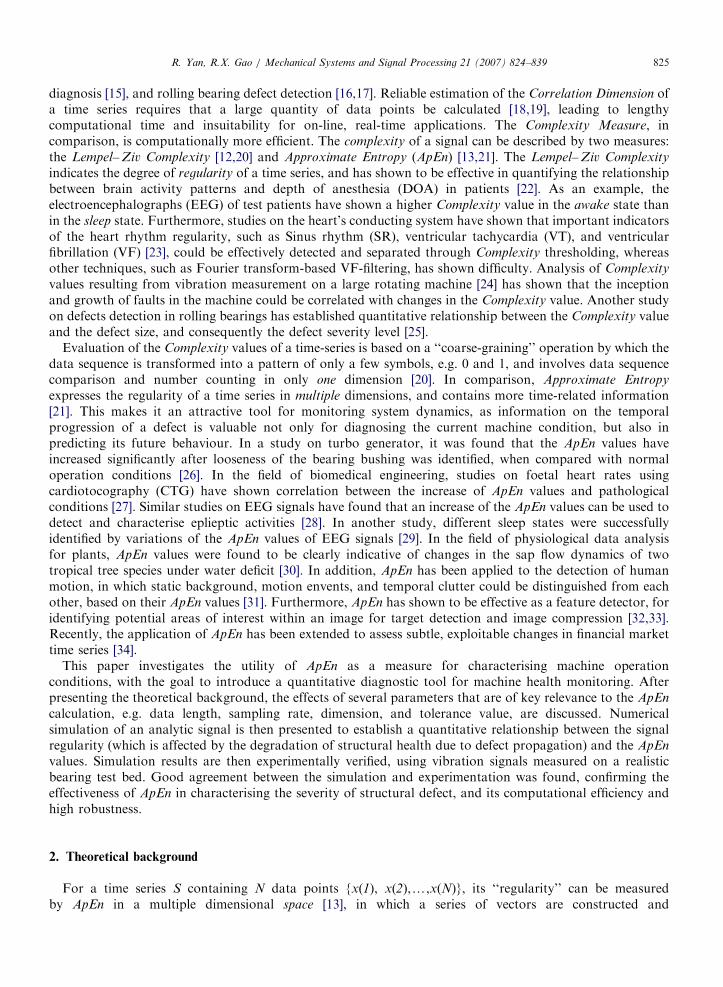
Fig. 2. Vibration signal from an undamaged, ‘‘healthy’’ bearing.
R. Yan, R.X. Gao / Mechanical Systems and Signal Processing 21 (2007) 824–839 827
2.1. Effect of data length
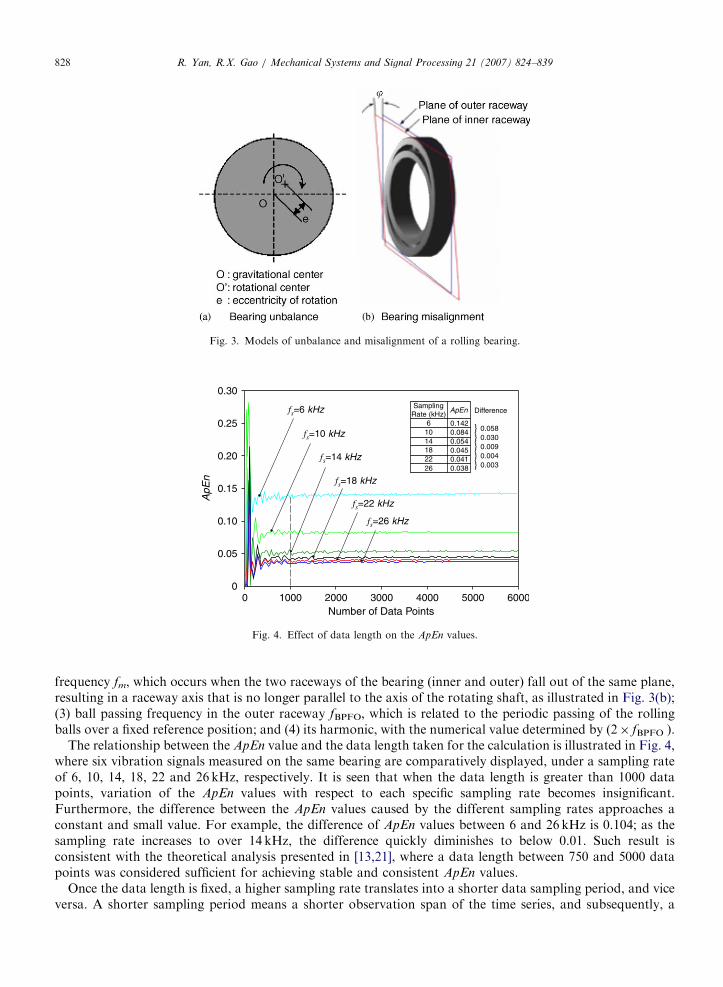
Fig. 2 illustrates a vibration signal measured from an undamaged, ‘‘healthy’’ bearing under a radial load of9 kN and a sampling rate of 10 kHz. The power spectrum density of the signal indicates the existence of fourmajor frequency components: (1) bearing unbalance frequency fu, which occurs when the gravitational centreof the bearing does not coincide with its rotational center, as illustrated in Fig. 3(a); (2) misalignment
ARTICLE IN PRESS
Fig. 3. Models of unbalance and misalignment of a rolling bearing.
Number of Data Points0 1000 2000 3000 4000 5000 6000
ApE
n
0.05
0.10
0.15
0.20
0.25
0.30
fs=6 kHz
fs=10 kHz
fs=14 kHz
fs=18 kHz
fs=22 kHz
fs=26 kHz
0
SamplingRate (kHz)
61014182226
0.1420.0840.0540.0450.0410.038
ApEn Difference
0.0580.0300.0090.0040.003
}}}}}
Fig. 4. Effect of data length on the ApEn values.
R. Yan, R.X. Gao / Mechanical Systems and Signal Processing 21 (2007) 824–839828
frequency fm, which occurs when the two raceways of the bearing (inner and outer) fall out of the same plane,resulting in a raceway axis that is no longer parallel to the axis of the rotating shaft, as illustrated in Fig. 3(b);(3) ball passing frequency in the outer raceway fBPFO, which is related to the periodic passing of the rollingballs over a fixed reference position; and (4) its harmonic, with the numerical value determined by (2� fBPFO ).
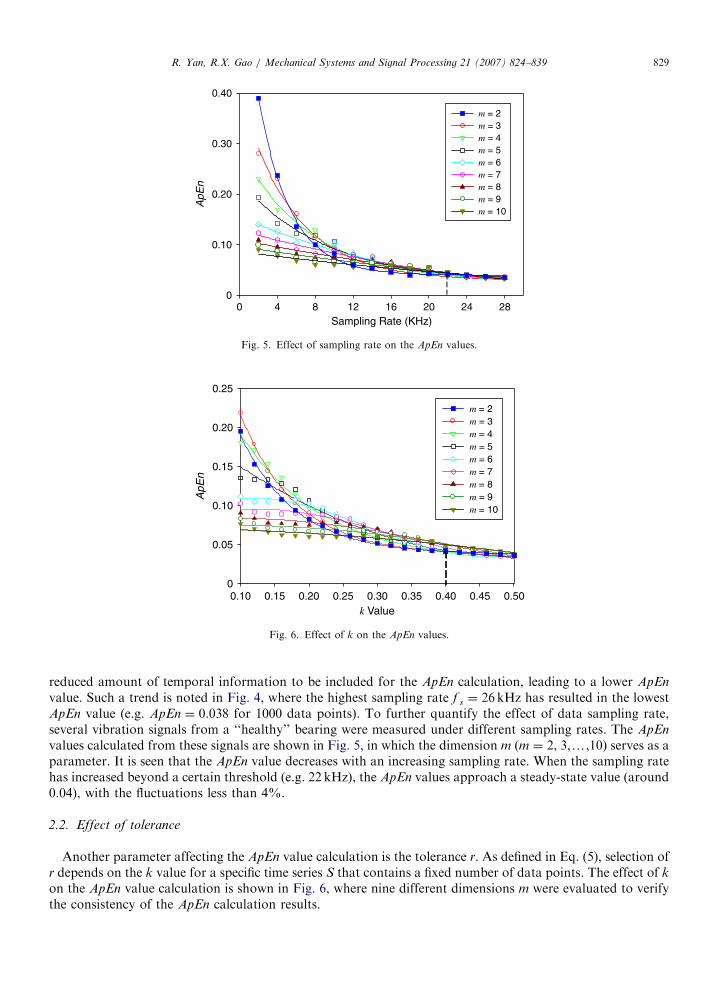
The relationship between the ApEn value and the data length taken for the calculation is illustrated in Fig. 4,where six vibration signals measured on the same bearing are comparatively displayed, under a sampling rateof 6, 10, 14, 18, 22 and 26 kHz, respectively. It is seen that when the data length is greater than 1000 datapoints, variation of the ApEn values with respect to each specific sampling rate becomes insignificant.Furthermore, the difference between the ApEn values caused by the different sampling rates approaches aconstant and small value. For example, the difference of ApEn values between 6 and 26 kHz is 0.104; as thesampling rate increases to over 14 kHz, the difference quickly diminishes to below 0.01. Such result isconsistent with the theoretical analysis presented in [13,21], where a data length between 750 and 5000 datapoints was considered sufficient for achieving stable and consistent ApEn values.
Once the data length is fixed, a higher sampling rate translates into a shorter data sampling period, and viceversa. A shorter sampling period means a shorter observation span of the time series, and subsequently, a
ARTICLE IN PRESS
8 12 16 200
0.40
0
0.10
0.20
0.30
Sampling Rate (KHz)
ApE
n
2824
m = 2m = 3m = 4m = 5m = 6m = 7m = 8m = 9m = 10
4
Fig. 5. Effect of sampling rate on the ApEn values.
ApE
n
m = 2m = 3m = 4m = 5m = 6m = 7m = 8m = 9m = 10
k Value0.10 0.15 0.20 0.25 0.30 0.35 0.40
0.05
0.10
0.15
0.20
0.25
00.45 0.50
Fig. 6. Effect of k on the ApEn values.
R. Yan, R.X. Gao / Mechanical Systems and Signal Processing 21 (2007) 824–839 829
reduced amount of temporal information to be included for the ApEn calculation, leading to a lower ApEn
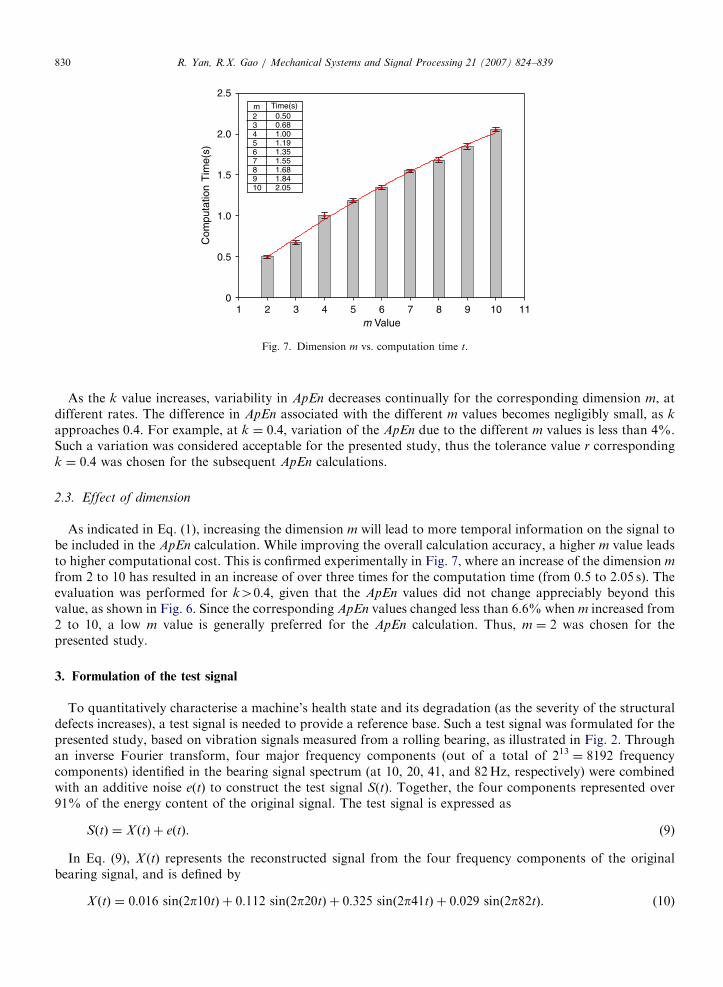
value. Such a trend is noted in Fig. 4, where the highest sampling rate f s ¼ 26 kHz has resulted in the lowestApEn value (e.g. ApEn ¼ 0.038 for 1000 data points). To further quantify the effect of data sampling rate,several vibration signals from a ‘‘healthy’’ bearing were measured under different sampling rates. The ApEn
values calculated from these signals are shown in Fig. 5, in which the dimension m (m ¼ 2, 3,y,10) serves as aparameter. It is seen that the ApEn value decreases with an increasing sampling rate. When the sampling ratehas increased beyond a certain threshold (e.g. 22 kHz), the ApEn values approach a steady-state value (around0.04), with the fluctuations less than 4%.
2.2. Effect of tolerance
Another parameter affecting the ApEn value calculation is the tolerance r. As defined in Eq. (5), selection ofr depends on the k value for a specific time series S that contains a fixed number of data points. The effect of k
on the ApEn value calculation is shown in Fig. 6, where nine different dimensions m were evaluated to verifythe consistency of the ApEn calculation results.
ARTICLE IN PRESS
3 5 81
2.5
0
0.5
1.0
1.5
m Value
Com
puta
tion
Tim
e(s)
109
2.0
6 112 4 7
m Time(s)2345678910
0.500.681.001.191.35
2.051.84
1.551.68
Fig. 7. Dimension m vs. computation time t.
R. Yan, R.X. Gao / Mechanical Systems and Signal Processing 21 (2007) 824–839830
As the k value increases, variability in ApEn decreases continually for the corresponding dimension m, atdifferent rates. The difference in ApEn associated with the different m values becomes negligibly small, as k
approaches 0.4. For example, at k ¼ 0:4, variation of the ApEn due to the different m values is less than 4%.Such a variation was considered acceptable for the presented study, thus the tolerance value r correspondingk ¼ 0:4 was chosen for the subsequent ApEn calculations.
2.3. Effect of dimension
As indicated in Eq. (1), increasing the dimension m will lead to more temporal information on the signal tobe included in the ApEn calculation. While improving the overall calculation accuracy, a higher m value leadsto higher computational cost. This is confirmed experimentally in Fig. 7, where an increase of the dimension m
from 2 to 10 has resulted in an increase of over three times for the computation time (from 0.5 to 2.05 s). Theevaluation was performed for k40:4, given that the ApEn values did not change appreciably beyond thisvalue, as shown in Fig. 6. Since the corresponding ApEn values changed less than 6.6% when m increased from2 to 10, a low m value is generally preferred for the ApEn calculation. Thus, m ¼ 2 was chosen for thepresented study.
3. Formulation of the test signal
To quantitatively characterise a machine’s health state and its degradation (as the severity of the structuraldefects increases), a test signal is needed to provide a reference base. Such a test signal was formulated for thepresented study, based on vibration signals measured from a rolling bearing, as illustrated in Fig. 2. Throughan inverse Fourier transform, four major frequency components (out of a total of 213 ¼ 8192 frequencycomponents) identified in the bearing signal spectrum (at 10, 20, 41, and 82Hz, respectively) were combinedwith an additive noise e(t) to construct the test signal S(t). Together, the four components represented over91% of the energy content of the original signal. The test signal is expressed as
SðtÞ ¼ X ðtÞ þ eðtÞ. (9)
In Eq. (9), X ðtÞ represents the reconstructed signal from the four frequency components of the originalbearing signal, and is defined by
X ðtÞ ¼ 0:016 sinð2p10tÞ þ 0:112 sinð2p20tÞ þ 0:325 sinð2p41tÞ þ 0:029 sinð2p82tÞ. (10)
ARTICLE IN PRESS
2000 3000 4000 50000 1000 6000
-0.4
-0.2
0
0.2
0.4
0.6
-0.6
Sampling Data Points
Sig
nal (
V)
-0.4
-0.2
0
0.2
0.4
0.6
-0.6
Sig
nal (
V)
2000 3000 4000 50000 1000 6000Sampling Data Points(a) (b)
Fig. 8. Test signal formulated as a reference base for quantitative ApEn evaluation.
Table 1
ApEn value of test signal under various SNR
R. Yan, R.X. Gao / Mechanical Systems and Signal Processing 21 (2007) 824–839 831
The noise component e(t) is defined by the signal-to-noise ratio (SNR) [35] as
SNR ¼ 10 log10X ðtÞ�� ��
2=M
eðtÞ�� ��
2=L
, (11)
where X ðtÞ�� ��
2¼P
X ðtÞ2, eðtÞ�� ��
2¼P
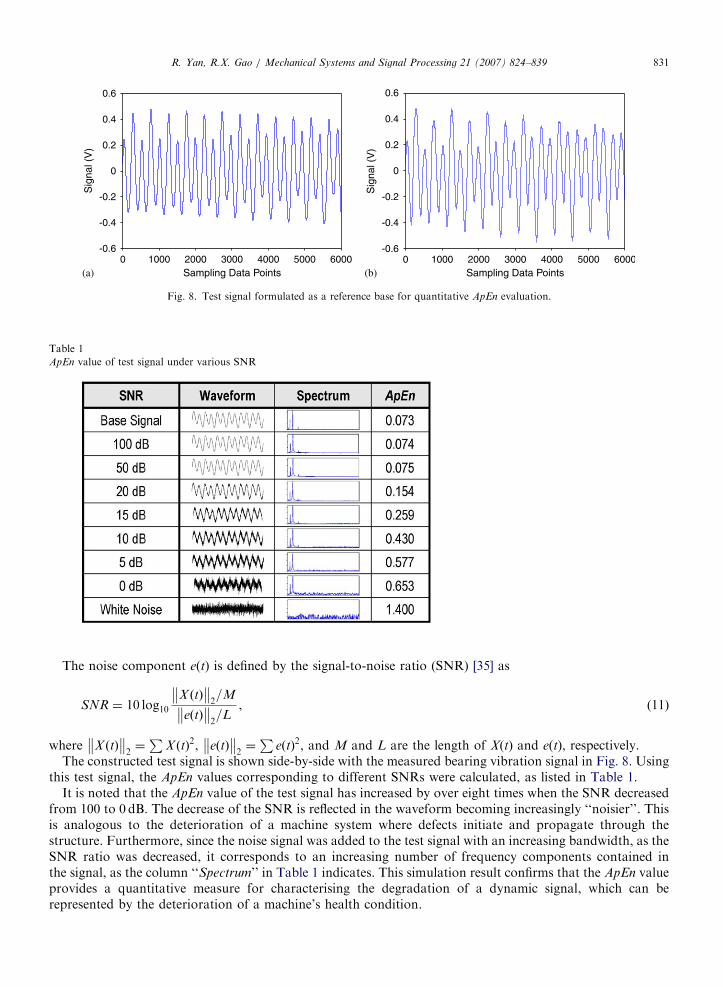
eðtÞ2, and M and L are the length of X(t) and e(t), respectively.The constructed test signal is shown side-by-side with the measured bearing vibration signal in Fig. 8. Using
this test signal, the ApEn values corresponding to different SNRs were calculated, as listed in Table 1.It is noted that the ApEn value of the test signal has increased by over eight times when the SNR decreased
from 100 to 0 dB. The decrease of the SNR is reflected in the waveform becoming increasingly ‘‘noisier’’. Thisis analogous to the deterioration of a machine system where defects initiate and propagate through thestructure. Furthermore, since the noise signal was added to the test signal with an increasing bandwidth, as theSNR ratio was decreased, it corresponds to an increasing number of frequency components contained inthe signal, as the column ‘‘Spectrum’’ in Table 1 indicates. This simulation result confirms that the ApEn valueprovides a quantitative measure for characterising the degradation of a dynamic signal, which can berepresented by the deterioration of a machine’s health condition.
ARTICLE IN PRESS
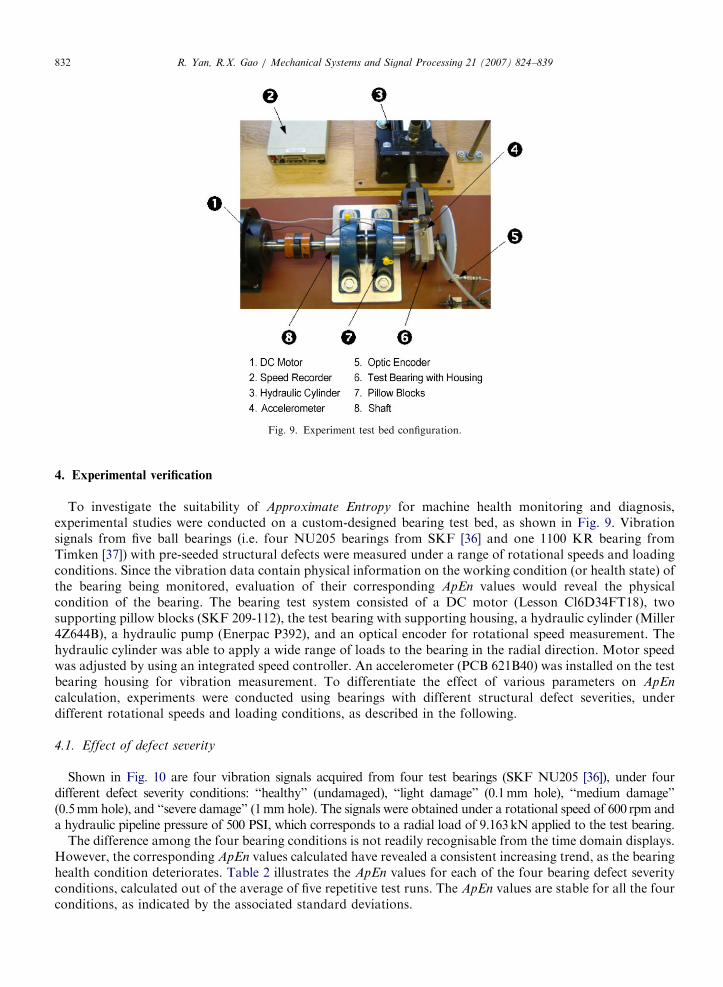
Fig. 9. Experiment test bed configuration.
R. Yan, R.X. Gao / Mechanical Systems and Signal Processing 21 (2007) 824–839832
4. Experimental verification
To investigate the suitability of Approximate Entropy for machine health monitoring and diagnosis,experimental studies were conducted on a custom-designed bearing test bed, as shown in Fig. 9. Vibrationsignals from five ball bearings (i.e. four NU205 bearings from SKF [36] and one 1100 KR bearing fromTimken [37]) with pre-seeded structural defects were measured under a range of rotational speeds and loadingconditions. Since the vibration data contain physical information on the working condition (or health state) ofthe bearing being monitored, evaluation of their corresponding ApEn values would reveal the physicalcondition of the bearing. The bearing test system consisted of a DC motor (Lesson Cl6D34FT18), twosupporting pillow blocks (SKF 209-112), the test bearing with supporting housing, a hydraulic cylinder (Miller4Z644B), a hydraulic pump (Enerpac P392), and an optical encoder for rotational speed measurement. Thehydraulic cylinder was able to apply a wide range of loads to the bearing in the radial direction. Motor speedwas adjusted by using an integrated speed controller. An accelerometer (PCB 621B40) was installed on the testbearing housing for vibration measurement. To differentiate the effect of various parameters on ApEn
calculation, experiments were conducted using bearings with different structural defect severities, underdifferent rotational speeds and loading conditions, as described in the following.
4.1. Effect of defect severity
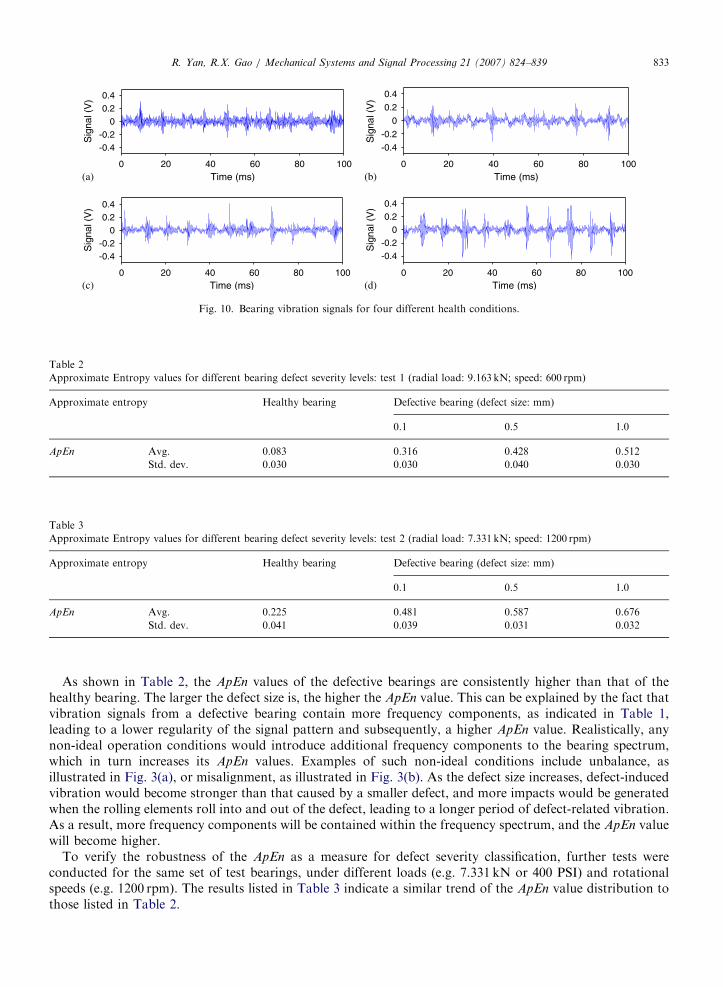
Shown in Fig. 10 are four vibration signals acquired from four test bearings (SKF NU205 [36]), under fourdifferent defect severity conditions: ‘‘healthy’’ (undamaged), ‘‘light damage’’ (0.1mm hole), ‘‘medium damage’’(0.5mm hole), and ‘‘severe damage’’ (1mm hole). The signals were obtained under a rotational speed of 600 rpm anda hydraulic pipeline pressure of 500 PSI, which corresponds to a radial load of 9.163kN applied to the test bearing.
The difference among the four bearing conditions is not readily recognisable from the time domain displays.However, the corresponding ApEn values calculated have revealed a consistent increasing trend, as the bearinghealth condition deteriorates. Table 2 illustrates the ApEn values for each of the four bearing defect severityconditions, calculated out of the average of five repetitive test runs. The ApEn values are stable for all the fourconditions, as indicated by the associated standard deviations.
ARTICLE IN PRESS
Table 2
Approximate Entropy values for different bearing defect severity levels: test 1 (radial load: 9.163 kN; speed: 600 rpm)
Approximate entropy Healthy bearing Defective bearing (defect size: mm)
0.1 0.5 1.0
ApEn Avg. 0.083 0.316 0.428 0.512
Std. dev. 0.030 0.030 0.040 0.030
-0.4-0.2
00.20.4
0 20 40 60 80 100Time (ms)
Sig
nal (
V)
-0.4
-0.2
0
0.2
0.4
0 20 40 60 80 100Time (ms)
Sig
nal (
V)
-0.4-0.2
00.20.4
0 20 40 60 80 100Time (ms)
Sig
nal (
V)
-0.4-0.2
00.20.4
0 20 40 60 80 100Time (ms)
Sig
nal (
V)
(a) (b)
(c) (d)
Fig. 10. Bearing vibration signals for four different health conditions.
Table 3
Approximate Entropy values for different bearing defect severity levels: test 2 (radial load: 7.331 kN; speed: 1200 rpm)
Approximate entropy Healthy bearing Defective bearing (defect size: mm)
0.1 0.5 1.0
ApEn Avg. 0.225 0.481 0.587 0.676
Std. dev. 0.041 0.039 0.031 0.032
R. Yan, R.X. Gao / Mechanical Systems and Signal Processing 21 (2007) 824–839 833
As shown in Table 2, the ApEn values of the defective bearings are consistently higher than that of thehealthy bearing. The larger the defect size is, the higher the ApEn value. This can be explained by the fact thatvibration signals from a defective bearing contain more frequency components, as indicated in Table 1,leading to a lower regularity of the signal pattern and subsequently, a higher ApEn value. Realistically, anynon-ideal operation conditions would introduce additional frequency components to the bearing spectrum,which in turn increases its ApEn values. Examples of such non-ideal conditions include unbalance, asillustrated in Fig. 3(a), or misalignment, as illustrated in Fig. 3(b). As the defect size increases, defect-inducedvibration would become stronger than that caused by a smaller defect, and more impacts would be generatedwhen the rolling elements roll into and out of the defect, leading to a longer period of defect-related vibration.As a result, more frequency components will be contained within the frequency spectrum, and the ApEn valuewill become higher.
To verify the robustness of the ApEn as a measure for defect severity classification, further tests wereconducted for the same set of test bearings, under different loads (e.g. 7.331 kN or 400 PSI) and rotationalspeeds (e.g. 1200 rpm). The results listed in Table 3 indicate a similar trend of the ApEn value distribution tothose listed in Table 2.
ARTICLE IN PRESS
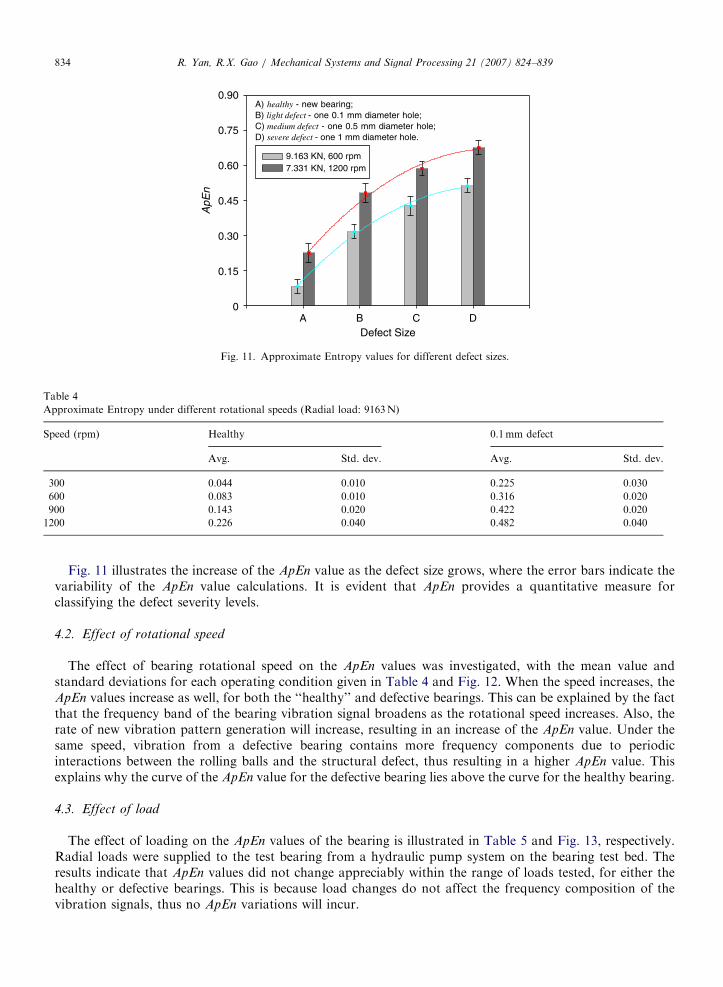
A CB
A) healthy - new bearing;B) light defect - one 0.1 mm diameter hole;C) medium defect - one 0.5 mm diameter hole;D) severe defect - one 1 mm diameter hole.
Defect Size
ApE
n
0.15
0.30
0.45
0.60
0.90
0
0.75
9.163 KN, 600 rpm7.331 KN, 1200 rpm
D
Fig. 11. Approximate Entropy values for different defect sizes.
Table 4
Approximate Entropy under different rotational speeds (Radial load: 9163N)
Speed (rpm) Healthy 0.1mm defect
Avg. Std. dev. Avg. Std. dev.
300 0.044 0.010 0.225 0.030
600 0.083 0.010 0.316 0.020
900 0.143 0.020 0.422 0.020
1200 0.226 0.040 0.482 0.040
R. Yan, R.X. Gao / Mechanical Systems and Signal Processing 21 (2007) 824–839834
Fig. 11 illustrates the increase of the ApEn value as the defect size grows, where the error bars indicate thevariability of the ApEn value calculations. It is evident that ApEn provides a quantitative measure forclassifying the defect severity levels.
4.2. Effect of rotational speed
The effect of bearing rotational speed on the ApEn values was investigated, with the mean value andstandard deviations for each operating condition given in Table 4 and Fig. 12. When the speed increases, theApEn values increase as well, for both the ‘‘healthy’’ and defective bearings. This can be explained by the factthat the frequency band of the bearing vibration signal broadens as the rotational speed increases. Also, therate of new vibration pattern generation will increase, resulting in an increase of the ApEn value. Under thesame speed, vibration from a defective bearing contains more frequency components due to periodicinteractions between the rolling balls and the structural defect, thus resulting in a higher ApEn value. Thisexplains why the curve of the ApEn value for the defective bearing lies above the curve for the healthy bearing.
4.3. Effect of load
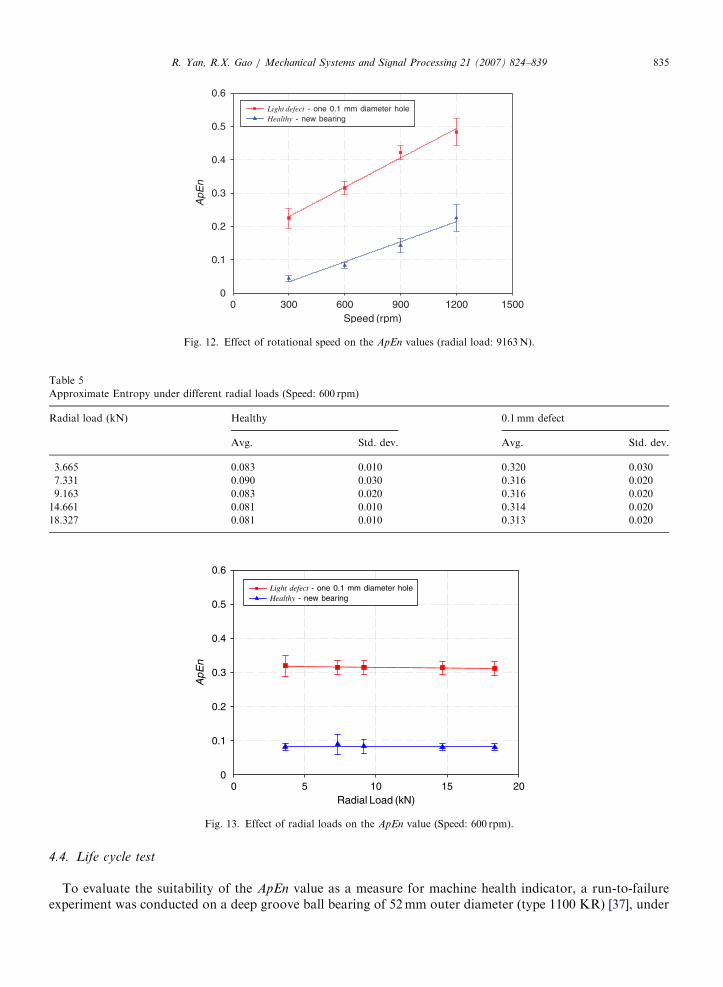
The effect of loading on the ApEn values of the bearing is illustrated in Table 5 and Fig. 13, respectively.Radial loads were supplied to the test bearing from a hydraulic pump system on the bearing test bed. Theresults indicate that ApEn values did not change appreciably within the range of loads tested, for either thehealthy or defective bearings. This is because load changes do not affect the frequency composition of thevibration signals, thus no ApEn variations will incur.
ARTICLE IN PRESS
Speed (rpm)0 300 600 900 1200 1500
ApE
n
0.1
0.2
0.3
0.4
0.5
0.6
0
Light defect - one 0.1 mm diameter holeHealthy - new bearing
Fig. 12. Effect of rotational speed on the ApEn values (radial load: 9163N).
Table 5
Approximate Entropy under different radial loads (Speed: 600 rpm)
Radial load (kN) Healthy 0.1mm defect
Avg. Std. dev. Avg. Std. dev.
3.665 0.083 0.010 0.320 0.030
7.331 0.090 0.030 0.316 0.020
9.163 0.083 0.020 0.316 0.020
14.661 0.081 0.010 0.314 0.020
18.327 0.081 0.010 0.313 0.020
Radial Load (kN)0 5 10 15 20
ApE
n
0.1
0.2
0.3
0.4
0.5
0.6
0
Light defect - one 0.1 mm diameter holeHealthy - new bearing
Fig. 13. Effect of radial loads on the ApEn value (Speed: 600 rpm).
R. Yan, R.X. Gao / Mechanical Systems and Signal Processing 21 (2007) 824–839 835
4.4. Life cycle test
To evaluate the suitability of the ApEn value as a measure for machine health indicator, a run-to-failureexperiment was conducted on a deep groove ball bearing of 52mm outer diameter (type 1100 KR) [37], under
ARTICLE IN PRESSR. Yan, R.X. Gao / Mechanical Systems and Signal Processing 21 (2007) 824–839836
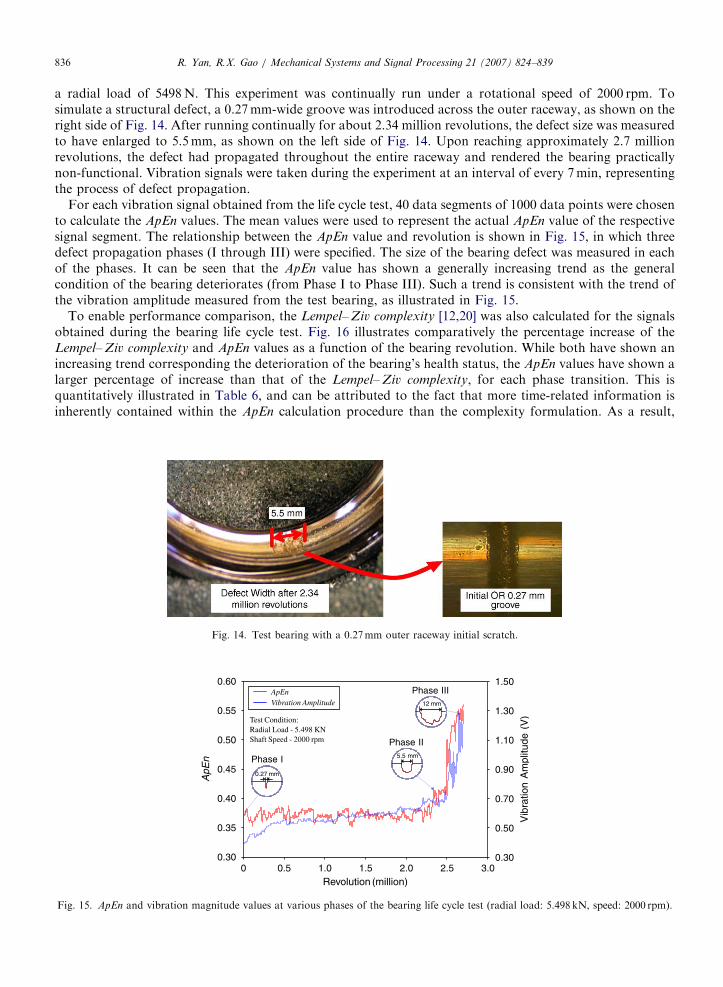
a radial load of 5498N. This experiment was continually run under a rotational speed of 2000 rpm. Tosimulate a structural defect, a 0.27mm-wide groove was introduced across the outer raceway, as shown on theright side of Fig. 14. After running continually for about 2.34 million revolutions, the defect size was measuredto have enlarged to 5.5mm, as shown on the left side of Fig. 14. Upon reaching approximately 2.7 millionrevolutions, the defect had propagated throughout the entire raceway and rendered the bearing practicallynon-functional. Vibration signals were taken during the experiment at an interval of every 7min, representingthe process of defect propagation.
For each vibration signal obtained from the life cycle test, 40 data segments of 1000 data points were chosento calculate the ApEn values. The mean values were used to represent the actual ApEn value of the respectivesignal segment. The relationship between the ApEn value and revolution is shown in Fig. 15, in which threedefect propagation phases (I through III) were specified. The size of the bearing defect was measured in eachof the phases. It can be seen that the ApEn value has shown a generally increasing trend as the generalcondition of the bearing deteriorates (from Phase I to Phase III). Such a trend is consistent with the trend ofthe vibration amplitude measured from the test bearing, as illustrated in Fig. 15.
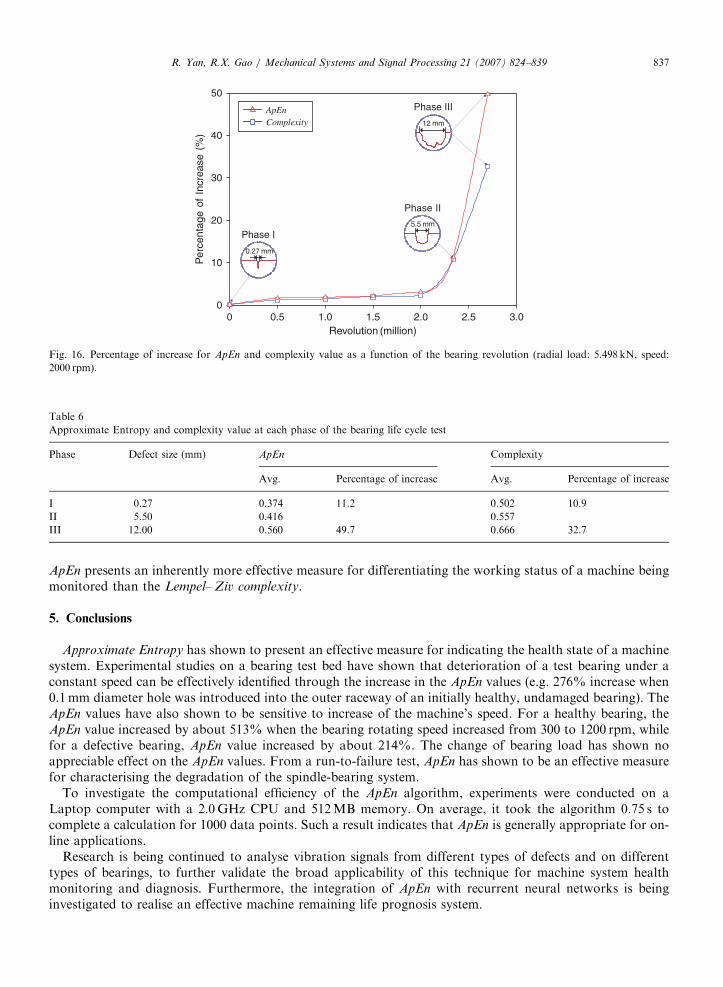
To enable performance comparison, the Lempel– Ziv complexity [12,20] was also calculated for the signalsobtained during the bearing life cycle test. Fig. 16 illustrates comparatively the percentage increase of theLempel– Ziv complexity and ApEn values as a function of the bearing revolution. While both have shown anincreasing trend corresponding the deterioration of the bearing’s health status, the ApEn values have shown alarger percentage of increase than that of the Lempel– Ziv complexity, for each phase transition. This isquantitatively illustrated in Table 6, and can be attributed to the fact that more time-related information isinherently contained within the ApEn calculation procedure than the complexity formulation. As a result,
Fig. 14. Test bearing with a 0.27mm outer raceway initial scratch.
Vib
ratio
n A
mpl
itude
(V
)
1.0 1.5 2.0 2.50 0.5
0.60
0.30
0.40
0.50
0.55
Revolution (million)
ApE
n
3.0
Phase I
Phase II
Phase III
Test Condition:Radial Load - 5.498 KNShaft Speed - 2000 rpm
0.45
0.35
1.50
0.30
0.70
1.10
1.30
0.90
0.50
ApEnVibration Amplitude
Fig. 15. ApEn and vibration magnitude values at various phases of the bearing life cycle test (radial load: 5.498 kN, speed: 2000 rpm).
ARTICLE IN PRESS
0 0.5 1.0 1.5 2.0 2.5 3.00
10
20
30
40
50
ComplexityApEn
Phase I
Phase II
Phase III
Per
cent
age
of I
ncre
ase
(%)
Revolution (million)
Fig. 16. Percentage of increase for ApEn and complexity value as a function of the bearing revolution (radial load: 5.498 kN, speed:
2000 rpm).
Table 6
Approximate Entropy and complexity value at each phase of the bearing life cycle test
Phase Defect size (mm) ApEn Complexity
Avg. Percentage of increase Avg. Percentage of increase
I 0.27 0.374 11.2 0.502 10.9
II 5.50 0.416 0.557
III 12.00 0.560 49.7 0.666 32.7
R. Yan, R.X. Gao / Mechanical Systems and Signal Processing 21 (2007) 824–839 837
ApEn presents an inherently more effective measure for differentiating the working status of a machine beingmonitored than the Lempel– Ziv complexity.
5. Conclusions
Approximate Entropy has shown to present an effective measure for indicating the health state of a machinesystem. Experimental studies on a bearing test bed have shown that deterioration of a test bearing under aconstant speed can be effectively identified through the increase in the ApEn values (e.g. 276% increase when0.1mm diameter hole was introduced into the outer raceway of an initially healthy, undamaged bearing). TheApEn values have also shown to be sensitive to increase of the machine’s speed. For a healthy bearing, theApEn value increased by about 513% when the bearing rotating speed increased from 300 to 1200 rpm, whilefor a defective bearing, ApEn value increased by about 214%. The change of bearing load has shown noappreciable effect on the ApEn values. From a run-to-failure test, ApEn has shown to be an effective measurefor characterising the degradation of the spindle-bearing system.
To investigate the computational efficiency of the ApEn algorithm, experiments were conducted on aLaptop computer with a 2.0GHz CPU and 512MB memory. On average, it took the algorithm 0.75 s tocomplete a calculation for 1000 data points. Such a result indicates that ApEn is generally appropriate for on-line applications.
Research is being continued to analyse vibration signals from different types of defects and on differenttypes of bearings, to further validate the broad applicability of this technique for machine system healthmonitoring and diagnosis. Furthermore, the integration of ApEn with recurrent neural networks is beinginvestigated to realise an effective machine remaining life prognosis system.

ARTICLE IN PRESSR. Yan, R.X. Gao / Mechanical Systems and Signal Processing 21 (2007) 824–839838
Acknowledgment
The authors gratefully acknowledge funding provided to this research by the National Science Foundationunder award # DMI-0218161. Experimental support from the SKF and Timken companies are appreciated.
References
[1] D. Dyer, R.M. Stewart, Detection of rolling element bearing damage by statistical vibration analysis, Journal of Mechanical Design
100 (1978) 229–235.
[2] N. Tandon, A comparison of some vibration parameters for the condition monitoring of rolling element bearings, Journal of the
International Measurement Confederation 12 (3) (1994) 285–289.
[3] H.R. Martin, F. Honarvar, Application of statistical moments to bearing failure detection, Applied Acoustics 44 (1995) 67–77.
[4] F. Honarvar, H.R. Martin, New statistical moments for diagnostics of rolling element bearings, Journal of Manufacturing Science
and Engineering 119 (1997) 425–432.
[5] A. Sturm, S. Billhardt, Envelope curve analysis of machines with rolling-element bearings, in: Proceedings of IFAC/IMACS
Symposium on Fault Detection, Supervision and Safety for Technical Processes—SAFEPROCESS’91, Baden-Baden, Germany,
September 10–13, 1991, pp. 529–533.
[6] R. Jones, Enveloping for bearing analysis, Sound and Vibration 30 (1996) 10–15.
[7] G. Gelle, J. Galy, G. Delaunay, Blind source separation: a tool for system monitoring and fault detection? in: Proceedings of IFAC/
IMACS Symposium on Fault Detection, Supervision and Safety for Technical Processes—SAFEPROCESS 2000, Budapest,
Hungary, 14–16 June, 2000, pp. 705–710.
[8] S. Petropol, S. Lesecq, A. Barraud, Fault detection using on-line wavelet analysis: application induction motor, in: Proceedings of
IFAC/IMACS Symposium on Fault Detection, Supervision and Safety for Technical Processes—SAFEPROCESS 2000, Budapest,
Hungary, 14–16 June, 2000, pp. 1125–1130.
[9] C. Wang, R. Gao, Wavelet transform with spectral post-processing for enhanced feature extraction, IEEE Transactions on
Instrumentation and Measurement 52 (4) (2003) 1296–1301.
[10] Z.K. Peng, F.L. Chu, Application of the wavelet transform in machine condition monitoring and fault diagnostics: a review with
bibliography, Mechanical Systems and Signal Processing 18 (2) (2004) 199–221.
[11] D. Rulle, Deterministic chaos: the science and the fiction, Proceedings of the Royal Society of London A 427 (1990) 241–248.
[12] A. Lempel, J. Ziv, On the complexity of finite sequences, IEEE Transactions on Information Theory 22 (1) (1976) 75–81.
[13] S.M. Pincus, Approximate Entropy as a measure of system complexity, Proceedings of the National Academy of Sciences of the
United States of America 88 (6) (1991) 2297–2301.
[14] T. Kobayashi, S. Madokoro, Y. Wada, Human sleep EEG analysis using the correlation dimension, Clinical Electroencephalography
32 (3) (2001) 112–118.
[15] J.D. Jiang, J. Chen, The application of correlation dimension in gearbox condition monitoring, Journal of Sound and Vibration 224
(1999) 529–541.
[16] D. Logan, J. Mathew, Using the correlation dimension for vibration fault diagnosis of rolling element bearings-I. Basic concepts,
Mechanical Systems and Signal Processing 10 (3) (1996) 241–250.
[17] D. Logan, J. Mathew, Using the correlation dimension for vibration fault diagnosis of rolling element bearings-II. Selection of
experimental parameters, Mechanical Systems and Signal Processing 10 (3) (1996) 251–264.
[18] L.A. Smith, Intrinsic limits on dimension calculations, Physical Letters A 133 (6) (1998) 283–288.
[19] J. Theiler, Estimating fractal dimension, Journal of the Optical Society of America A-Optics and Image Science A 7 (1990)
1055–1073.
[20] F. Kaspar, H.G. Schuster, Easily calculable measure for the complexity of spatiotemporal patterns, Physical Review A 36 (2) (1987)
842–848.
[21] S.M. Pincus, Approximate Entropy as a complexity measure, Chaos 5 (1) (1995) 110–117.
[22] X. Zhang, R.J. Roy, EEG complexity as a measure of depth of anesthesia for patients, IEEE Transactions on Biomedical Engineering
48 (12) (2001) 1424–1433.
[23] X. Zhang, Y. Zhu, N.V. Thakor, Z. Wang, Detecting ventricular tachycardia and fibrillation by complexity measure, IEEE
Transactions on Biomedical Engineering 46 (5) (1999) 548–555.
[24] L.S. Qu, J.D. Jiang, The complexity analysis of vibration signals of large rotating machinery, Journal of Xi’an Jiaotong University 32
(6) (1998) 31–35 (in Chinese).
[25] R. Yan, R.X. Gao, Complexity as a measure for machine health evaluation, IEEE Transactions on Instrumentation and
Measurement 53 (4) (2004) 1237–1334.
[26] Y.G. Xu, L.L. Li, Z.J. He, Approximate Entropy and its applications in mechanical fault diagnosis, Information and Control 31 (6)
(2002) 547–551 (in Chinese).
[27] M.G. Signorini, G. Magenes, S. Cerutti, D. Arduini, Linear and nonlinear parameters for the analysis of fetal heart rate signal from
cardiotocographic recordings, IEEE Transactions on Biomedical Engineering 50 (3) (2003) 365–374.
[28] L. Diambra, J.C. Bastos, C.P. Malta, Epileptic activity recognition in EEG recording, Physica A 273 (1999) 495–505.

ARTICLE IN PRESSR. Yan, R.X. Gao / Mechanical Systems and Signal Processing 21 (2007) 824–839 839
[29] R. Acharya U., O. Faust, N. Kannathal, T. Chua, S. Laminarayan, Non-linear analysis of EEG signals at various sleep stages,
Computer Methods and Programs in Biomedicine 80 (2005) 37–45.
[30] G.M. Souza, R.V. Ribeiro, M.G. Santos, H.L. Ribeiro, R.F. Oliveira, Approximate Entropy as a measure of complexity in sap flow
temporal dynamics of two tropical tree species under water deficit, Annals of the Brazilian Academy of Sciences 76 (3) (2004)
625–630.
[31] P.M. Ngan, Motion detection using Approximate Entropy, in: Proceedings of the Digital Image Computing Techniques and
Applications/ Image and Vision Computing, Massey University, New Zealand, 1997, pp. 379–384.
[32] P.G. Ducksbury, Target detection and intelligent image compression, in: Proceedings of the SPIE, vol. 4050, 2000, pp. 86–97.
[33] P.G. Ducksbury, M.J. Varga, Feature detection and fusion for intelligent compression, in: Proceedings of the SPIE, vol. 4380, 2001,
pp. 162–173.
[34] S. Pincus, R.E. Kalman, Irregularity, volatility, risk, and financial market time series, Proceedings of the National Academy of
Sciences of the United States of America 101 (38) (2004) 13709–13714.
[35] P.H. Carter, Unknown transient detection using wavelets, in: Proceedings of the SPIE, vol. 2242, 1994, pp. 803–814.
[36] SKF Interactive Bearing Catalog: http://www.skf.com/portal/skf_us/home/products?contentId=056001&lang=en.
[37] Timken Bearing Catalog: http://www.timken.com/industries/torrington/catalog/pdf/fafnir/wide_inn.pdf.
![Entropy stable ENO scheme … · The ENO reconstruction procedure has been very successfully em-ployed to approximate systems of hyperbolic conservation laws, [8, 15, 17]. Extensions](https://img.pdfslide.us/doc/110x75/6117dbe98dfbd9699074d53f/entropy-stable-eno-the-eno-reconstruction-procedure-has-been-very-successfully.jpg)