Embed Size (px)
Citation preview
USE OF EMERGENCY FOOD BY FOOD PANTRY CLIENTS IN FAIRFAX, VIRGINIA
by
Flora Elliott Szatkowski
Thesis submitted to the Faculty of the
Virginia Polytechnic Institute and State University
in partial fulfillment of the requirements for the degree of
MASTER OF SCIENCE
in
Human Nutrition and Foods
APPROVED: A AY |).
Mary. Korslund, Chairman
Amelia Finan a Denise Brochetti
May, 1995 Blacksburg, Virginia


USE OF EMERGENCY FOOD BY FOOD PANTRY CLIENTS IN FAIRFAX, VIRGINIA
by
Flora Elliott Szatkowski
Mary K. Korslund, Chairman
Department of Human Nutrition and Foods
(ABSTRACT)
Demand for emergency food at food pantries nationwide has increased rapidly
during the past 15 years. Food pantries have varied policies for distributing
food to clients. Clients of a food pantry in Fairfax, Virginia, were surveyed to
determine their satisfaction with the food they received and to help develop
guidelines in order to improve future food deliveries. Thirty-six food deliveries
were made during a 6-week study period. The population studied consisted of
79 children (under age 19) and 41 adults. Children were present in 89% of the
households; of these, 77% were headed by single women and 6%, by single
men. Eighty-eight percent were satisfied with the foods they received. Clients
wished they had received more meat, fresh milk, cheese, eggs, and pasta.
Powdered milk was the only food received that was reported as disliked by
more than one family. When foods delivered were compared with foods used,
clients used less powdered milk, dry beans, and peanut butter than they
received, but more fresh milk, meat, cheese, eggs, and fresh vegetables and
fruits than were delivered by the pantry driver. Recommended guidelines for
types and amounts of foods were developed using basic nutrition principles, as
described in the USDA food guide pyramid, modified to fit the types of foods
that are available in food pantries and the preferences of those sampled.

DEDICATION
To all people ©
who have known hunger,
particularly the children.
iii
ACKNOWLEDGMENTS
I want to thank all the people of Fairfax FISH who patiently put up with this
project, including all the telephone captains and drivers whose ears | talked off
and whose brains I picked. In particular, I wish to thank Kathy Weaver,
president of Fairfax FISH, who is the person for whom the word “tireless” was
coined. Her energy is exceeded only by her willingness to share it, and her
_ knowledge of FISH was invaluable.
Susan Wiley was a wonderful resource for helping me try to reach this
formidable population, and held my hand through the statistical analysis.
My committee members, Amelia Finan and Denise Brochetti, thoughtfully read
and commented on the project from start to finish, and I thank them for all
their fine insights. Most especially, I must thank Mary Korslund for her
unbounded encouragement during this project and over the past five years.
She will be sorely missed by her students as she retires from Virginia Tech this
year—we have been lucky to know her.
iv
TABLE OF CONTENTS
ADSL .......cccccceccceeeeeeeeeenseeeceeseceeeeescecensseseteeseececeesesntsceneeseceeeesateneceatnteneeeoees ii
Dedication .........cccccececeeseccececeeeee ee ens eset eens ee eeeeeseseseees sees eens esse es eeneneeeeeensneseeeenes iii
ACKNOW]EA METIS .........eceecececsscnccececncesceccecscercncceceseessenetecesseeeessensoeereaeseeeeenese iv
Tn troduction ........ccccccseecscccscsncneceseeceeneesesecsssceseseesrsececeeeeeceesseaeeeeesennereseseseeneese 1
The hunger problem and some approaches to it ..............ecceseececeseeceeenees 1
Fairfax FISH, Inc. ........ ccc ccccsencccctcecvacencccccccecusseccccecesecesersceeessessuuscccsessecs 3
Review of Literature...........c cc ccccccccessceecsceceneececencncscececeesssscecencececeseeseencenenseeneees 5
What are hunger and food S€CULity?..........cccesecscecencecsceceseesecececeenesereceees 5
Who uses food pantries?..........cccccccceceeesscecececeeeseereescceeecsecescesesscesecsoeees 6
What kinds of foods do clients receive? ............cccceeeeeeeeeeeeeeeeneeseeeeeseeeees 8
How is the food distributed? ..........cc ccc cccceceececcecenceeeesenenenerecesceceeceeenes 10
What guidelines exist for providing food for food pantry clients?.......... 12
Methodology. ..........ccececesecccnsscecccscscececeescscesssecenceeeessneeenseeecseeeeessnsseuseasenseseress 14
Overview Of Study design .............:ececeseceeececeeseesecesscnceseeseeseencesecerecscees 14
Population Studied ............ccccccscececeetecececeececeeeesssecsasecsceaessesnsnaseeseneneees i5
Pilot StUAY ........ cece scecececeececeseeesceeeecscesencecseeeenseneeresneseeeeeceseaeeeseneeanenes 16
THE INCENTIVE.........cccceceec ccs ecece eres eneneecneenseseenesseaneseensceesenesseeenseesertaees 17
The SUrvey INStrUMeENts ...........cececcceceeereeececseeceesescssesecesesecececesecececeseees 17
Datar AMALYSIS .......cc cc cececececeeeeeeeeeececeeeseceeecssenessseeececscecesesesecececsseeesenenes 19
Population characteristics ...........ccccccsescececscecessceceeecsceeeceeesenseseeeueneeoees 21
Hunger in the studied population ............cccccecccececenececeseseeeseececeeeseseeees 23
Foods received by Clients ............ccececeseceeeececeeteeecececescceneeceesececessececueeas 26
Satisfaction ..........cccccceccccceceeeceee nee eeneeececeeseeceescnscsssecceereeeeseaceesensneseess 29
DiSSAatiSfaction. ..........ccccccccececeecssceceeceeseescecesseeeseesonsesceaeeeesessenseasesenenes 34
DIiVEr iN Put ........c cc cececececeeeeeeencesenstesecececeeeeeaeegescsceeeesasetesteeseeeeeesensseess 37
DISCUSSION ........ccceccecsccecsecsceececsceeoecsenesecesaeseceeceseeeeenseesecceceeseseeeseseeseseeeeeenees 42
Hungry Children ...........ccccececssescsccneenececensscnccceseseesssenssessecestecseeaeers veeees 42
FOOdS provided..........ccccccsceseeeecececcecececeecscecessscecsceseessesesesecesecesesseeeseeees 43
Diversity--in servers and the Served ...........ccccssececceccesscesseesncecconceeneenees 46
COMNCIUSIONS 1.0... ccc ccc eee eee e en ceecencesceeccescencesceeeeceseeseeseesceseeeceseeseeseneeecescesereeees 48
Bibliography ..........cccscscscssscecseecseececcececececscscesseeseaeeesececsesaeesascessceoeateeeeeeeeeeers 52
Appendix A. Food package guidelines from Link...............cccccceceeeceseseneeeneneoes 56
Appendix B. Food package guidelines from the Navy Relief Society ............... 58
Appendix C. Food package guidelines from the Maryland Food Committee....59
Appendix D. Thrifty Food Plan food list for a month ............cccccecesesseeeeereeeenes 60
Appendix E. Client reminder letter ..............cecesesscescecececsenerecesstacececssseseeeees 61
Appendix F. Fairfax FISH client Survey ................cccccscscsceecesscnesessanceceaeeseetnes 62
Appendix G. Fairfax FISH survey for clients without telephones.................... 66
Appendix H. Telephone survey Questions .............ccccsccsececeeeseesecsseasensceseraseres 72

Appendix I. Driver SUIVey ..........ccccccecesceessceceeceenseeeeceeseeeecesseeeseeseseesesneseeasenes 74
Appendix J. Fairfax FISH Report Form. ............cceccceeseceeeeceeecesesereeeenserscnsenees 78
Vit ce ceecececececeeseccecececececeseeecececeassceeeesceresesesesesecsceoneesesececseecseseeeseceeeeetaneenees 79
FIGURES
Figure 1. Number of adults and children in famihes ................cccecececeeeceneeeeees 22
Figure 2. Responses to question about how much food clients..................0068 25
usually had in the house
Figure 3. Responses to question about how much food clients had .............. 25 during the week after FISH delivery
Figure 4. Number of items reported by clients as received from FISH,........... 28 already in the home, and used during the week following the FISH delivery
TABLES
Table 1. Numbers of types of foods brought by FISH, amount used.,.............. 30 and relationships
Table 2. Foods clients wished to have delivered, by category................... eeeeee 32
Table 3. Special requests made by clients to drivers before deliveries............ 35
Table 4. Foods clients reported that they would not eat, reasons................... 36 for not eating the foods, and what clients intended to do with the food
Table 5. General comments by families who received food from .................... 38 Fairfax FISH
Table 6. Factors listed by drivers as to how they choose foods for families.....39
Table 7. Proposed guidelines for choosing foods for Fairfax FISH clients. ....... 50
Table 8. Proposed shopping list for drivers taking food to FISH clients.......... ol
vil
INTRODUCTION
The hunger problem and some approaches to it
A lack of adequate food for good nutrition is a reality, not just for
famine-stricken areas of developing countries, but for millions of people in the
United States. “Between 1985 and 1990, the number of people in the United
States who lacked enough to eat each month increased 50%, from 20 million to
30 million—12% of the total population. This included 12 million children
under the age of 18” (Bread for the World 1994). Although those figures have
been challenged because of the difficulty of identifying the population, in 1989
alone, nearly 40 million people received some type of food assistance (Levedahl
and Matsumoto 1990). An additional $3 billion to $4 billion worth of food was
distributed through private channels.
Several government programs address the hunger problem in the United
States. They reach people in their family units, as well as in schools and day
care facilities. Briefly, the federal government programs include:
¢ Food stamps: This program provides coupons that can be exchanged for
food in grocery stores and other outlets to needy households. About $23
billion in benefits go to about 27 million Americans annually (Havemann
1995).
¢ Child nutrition programs: The National School Lunch and School
Breakfast programs provide subsidized or free meals to children in
public schools. The Child Care Food program reaches children in day
care settings; while the Special Milk program provides milk to a much
smaller population.

¢ WIC: Women, Infants, and Children benefit from this program, which
provides vouchers for certain foods needed by these nutritionally at-risk
groups. Nutrition education and health services are also provided.
¢ Commodity Supplemental Food Program: This program distributes food
commodities to needy people through state and local agencies. Three
other federal programs also supply food to the needy, distributed
through both public and private outlets. (Levedahl and Matsumoto
1990).
The needs of some people are not adequately met by these programs
alone. A relatively new system of food assistance has grown up from charitable
organizations to reach millions of Americans, many of whom are also receiving
government assistance. Growth of this food assistance sector was dramatic
throughout the 1980s, and the population served has become far more diverse
than the stereotypical homeless males that once almost exclusively patronized
soup kitchens (Campbell 1990, Reschovsky 1991). Today’s clients at food
pantries and soup kitchens are largely families with young children (Hunger in
America 1992). Recent studies suggest that more than 25 million Americans,
nearly half under 17, use emergency food from food pantries, soup kitchens,
and other programs (How Hungry is America? 1994).
Emergency food assistance has become well organized. At the national
level are large food banks, the largest of which is Second Harvest. Second
Harvest is a network of 185 regional food banks. It serves as a collection and
distribution channel for food and grocery products from hundreds of national
donor companies. Food donated may be mislabeled, discontinued,
overstocked, or otherwise unmarketable food, but all food is required to be safe
to eat and safely handled throughout the distribution chain (King 1989).

Regional food banks distribute food from Second Harvest and other food
banks to the local food pantries and soup kitchens that actually distribute the
food to the people. Local groups pay a small charge to the food banks for
shipping and handling the food. Food pantries and soup kitchens also receive
many of their supplies from donations by local food markets and the general
public. Recent estimates suggest that there are as many as 30,000 local
charities and other agencies that distribute food nationwide (Bread for the
World 1993).
Emergency food sites “have become less emergency oriented and more a
part of the permanent safety net” (Foodbanks adapting... 1992). Food
pantries are therefore on the front lines of those striving to end hunger. There
is a great demand for food from food pantries, and the largely volunteer
workforce at pantries does its best to help the hungry by providing food for a
few days or weeks at a time.
Fairfax FISH, Inc.
Fairfax FISH (For Immediate Sympathetic Help) is a coalition of churches
that responds to the needs of people in the Fairfax area in times of emergency
financial crisis. Among the help given are rental and utility monetary
assistance, payment for prescriptions, transportation to medical appointments,
and emergency food. Help usually is given on a one-time basis; that is, a client
may be helped only once per year with financial assistance, although food may
be provided more often, if needed.
Clients seeking food call Fairfax County Human Services Intake at a
central number, where a social worker screens them, then calls a FISH
telephone captain. The captain relays the needs to a driver, who then goes to
one of FISH’s eight church-based food pantries, where he or she chooses food
for the family. The driver may also stop at a supermarket and buy up to $20
worth of additional groceries, at his or her discretion, although it is not
uncommon for drivers to spend more and consider it a personal donation.
Drivers make food decisions for a family based on very little information.
They typically know only the ages and genders of the family members. Thus, it
may be that food delivered to a family is influenced more by a driver’s food
preferences and habits than by the family’s needs. Many drivers are retired
men, who may have little or no experience in meal planning. Even drivers who
plan family meals daily express uncertainty about choosing food for others.
Like the rest of the country’s food pantries, FISH has seen an explosion
in demand. According to FISH annual reports, in 1972, there were only 8 food
requests; five years later, 36 requests were recorded; in 1989, 105 requests
were filled; and 1993 brought 357 completed requests for food.
Fairfax FISH would like to have a set of guidelines to make choosing
foods easier for drivers and to ensure that each family receives the food it
wants and needs. No other study has looked at food pantry clients’ food
preferences or surveyed the people who choose food for those clients. This
investigator assessed how well the needs of clients were being met to provide a
foundation for developing guidelines for drivers to use in choosing foods for
others. The results can also be used to help donors select foods for the
pantries that are most wanted and needed by clients.
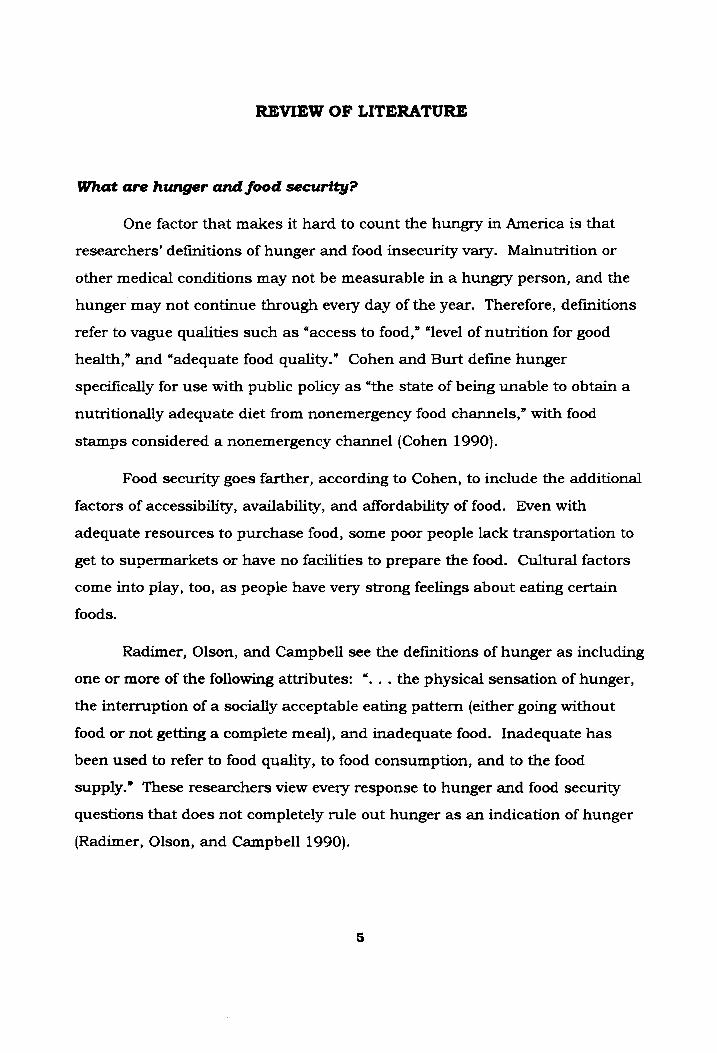
REVIEW OF LITERATURE
What are hunger and food security?
One factor that makes it hard to count the hungry in America is that
researchers’ definitions of hunger and food insecurity vary. Malnutrition or
other medical conditions may not be measurable in a hungry person, and the
hunger may not continue through every day of the year. Therefore, definitions
refer to vague qualities such as “access to food,” “level of nutrition for good
health,” and “adequate food quality.” Cohen and Burt define hunger
specifically for use with public policy as “the state of being unable to obtain a
nutritionally adequate diet from nonemergency food channels,” with food
stamps considered a nonemergency channel (Cohen 1990).
Food security goes farther, according to Cohen, to include the additional
factors of accessibility, availability, and affordability of food. Even with
adequate resources to purchase food, some poor people lack transportation to
get to supermarkets or have no facilities to prepare the food. Cultural factors
come into play, too, as people have very strong feelings about eating certain
foods.
Radimer, Olson, and Campbell see the definitions of hunger as including
« one or more of the following attributes: “. .. the physical sensation of hunger,
the interruption of a socially acceptable eating pattern (either going without
food or not getting a complete meal), and inadequate food. Inadequate has
been used to refer to food quality, to food consumption, and to the food
supply.” These researchers view every response to hunger and food security
questions that does not completely rule out hunger as an indication of hunger
(Radimer, Olson, and Campbell 1990).
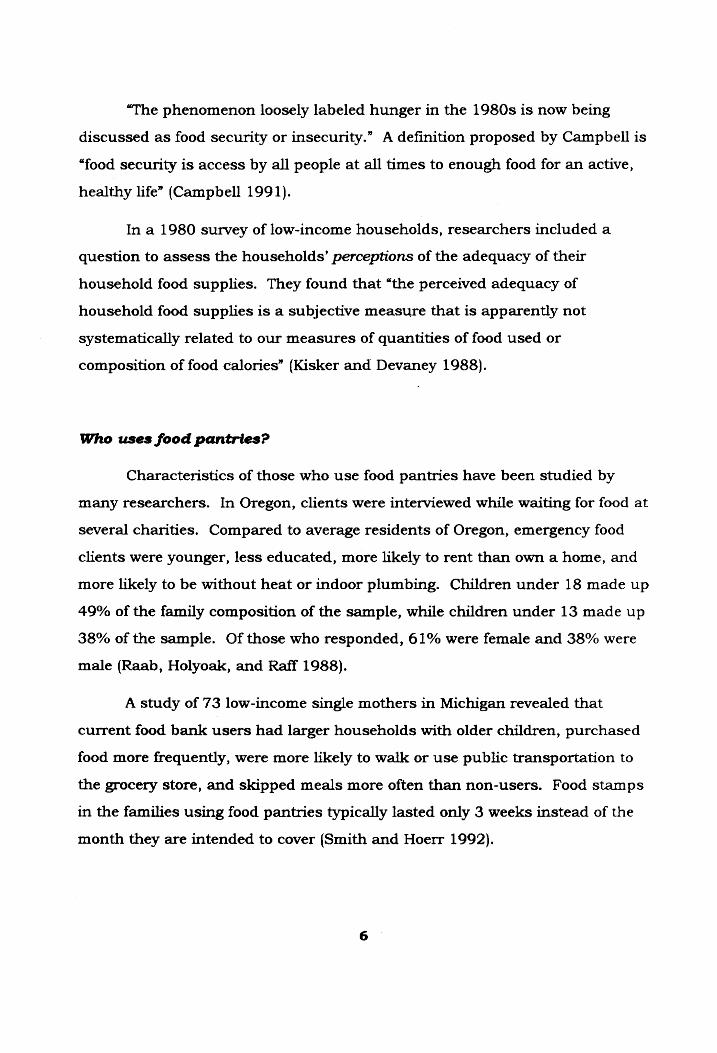
“The phenomenon loosely labeled hunger in the 1980s is now being
discussed as food security or insecurity.” A definition proposed by Campbell is
“food security is access by all people at all times to enough food for an active,
healthy life’ (Campbell 1991).
In a 1980 survey of low-income households, researchers included a
question to assess the households’ perceptions of the adequacy of their
household food supplies. They found that “the perceived adequacy of
household food supplies is a subjective measure that is apparently not
systematically related to our measures of quantities of food used or
composition of food calories” (Kisker and Devaney 1988).
Who uses food pantries?
Characteristics of those who use food pantries have been studied by
many researchers. In Oregon, clients were interviewed while waiting for food at
several charities. Compared to average residents of Oregon, emergency food
clients were younger, less educated, more likely to rent than own a home, and
more likely to be without heat or indoor plumbing. Children under 18 made up
49% of the family composition of the sample, while children under 13 made up
38% of the sample. Of those who responded, 61% were female and 38% were
male (Raab, Holyoak, and Raff 1988).
A study of 73 low-income single mothers in Michigan revealed that
current food bank users had larger households with older children, purchased
food more frequently, were more likely to walk or use public transportation to
the grocery store, and skipped meals more often than non-users. Food stamps
in the families using food pantries typically lasted only 3 weeks instead of the
month they are intended to cover (Smith and Hoerr 1992).
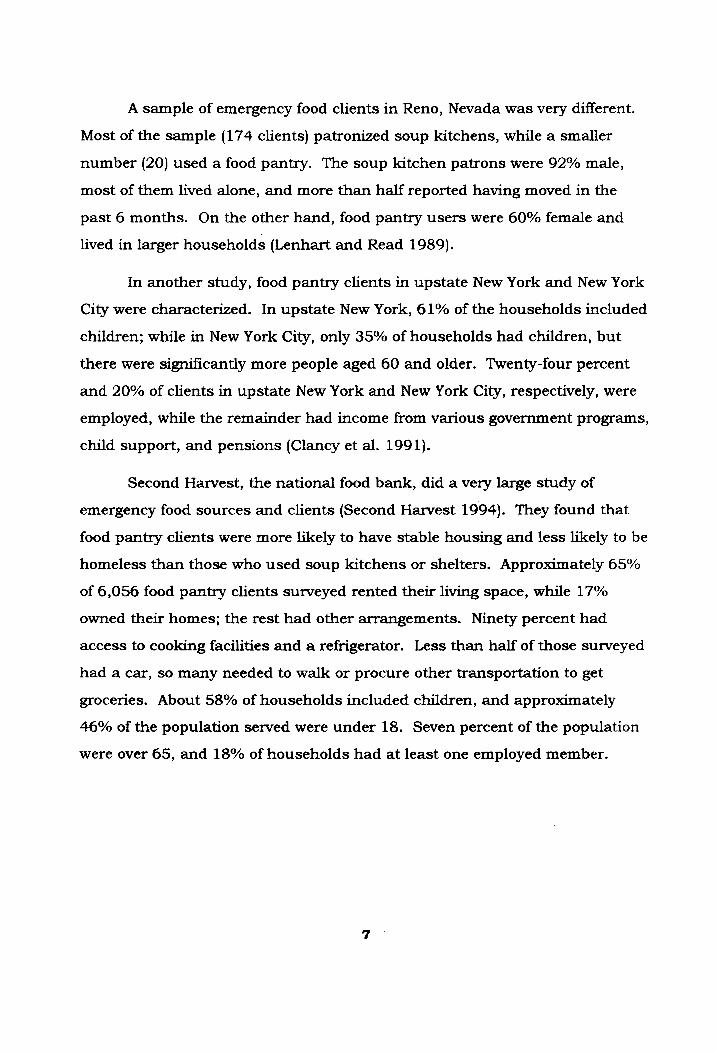
A sample of emergency food clients in Reno, Nevada was very different.
Most of the sample (174 clients) patronized soup kitchens, while a smaller
number (20) used a food pantry. The soup kitchen patrons were 92% male,
most of them lived alone, and more than half reported having moved in the
past 6 months. On the other hand, food pantry users were 60% female and
lived in larger households (Lenhart and Read 1989).
In another study, food pantry clients in upstate New York and New York
City were characterized. In upstate New York, 61% of the households included
children; while in New York City, only 35% of households had children, but
_ there were significantly more people aged 60 and older. Twenty-four percent
and 20% of clients in upstate New York and New York City, respectively, were
employed, while the remainder had income from various government programs,
child support, and pensions (Clancy et al. 1991).
Second Harvest, the national food bank, did a very large study of
emergency food sources and clients (Second Harvest 1994). They found that
food pantry clients were more likely to have stable housing and less likely to be
homeless than those who used soup kitchens or shelters. Approximately 65%
of 6,056 food pantry clients surveyed rented their living space, while 17%
owned their homes; the rest had other arrangements. Ninety percent had
access to cooking facilities and a refrigerator. Less than half of those surveyed
had a car, so many needed to walk or procure other transportation to get
groceries. About 58% of households included children, and approximately
46% of the population served were under 18. Seven percent of the population
were over 65, and 18% of households had at least one employed member.
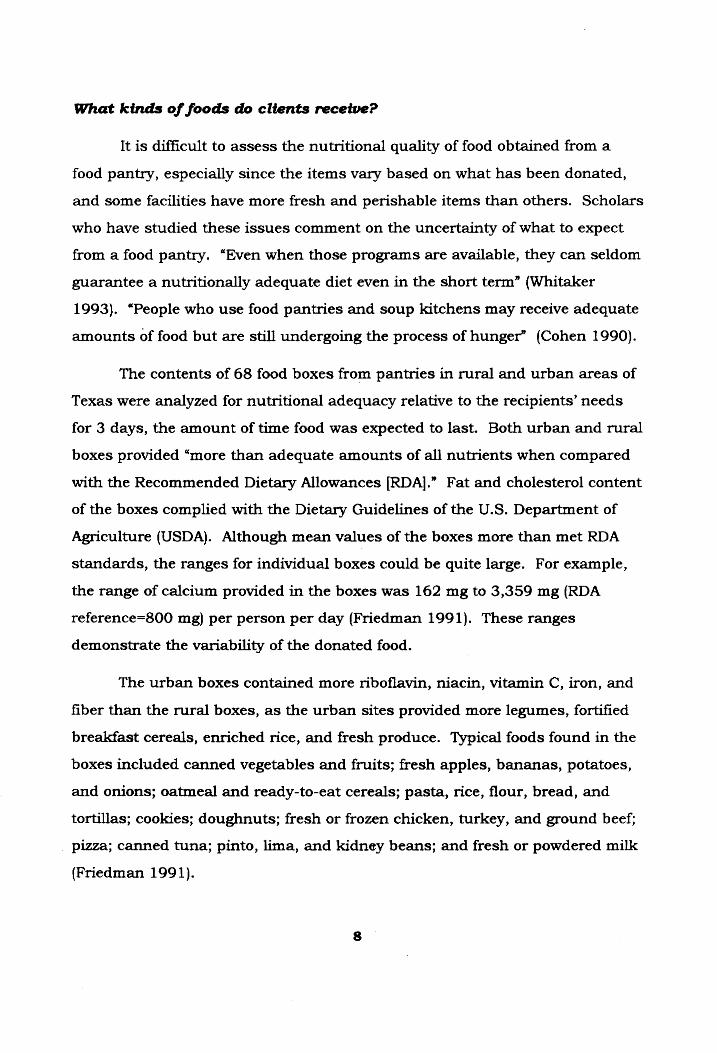
What kinds of foods do clients receive?
It is difficult to assess the nutritional quality of food obtained from a
food pantry, especially since the items vary based on what has been donated,
and some facilities have more fresh and perishable items than others. Scholars
who have studied these issues comment on the uncertainty of what to expect
from a food pantry. “Even when those programs are available, they can seldom
guarantee a nutritionally adequate diet even in the short term” (Whitaker
1993). “People who use food pantries and soup kitchens may receive adequate
amounts of food but are still undergoing the process of hunger” (Cohen 1990).
The contents of 68 food boxes from pantries in rural and urban areas of
Texas were analyzed for nutritional adequacy relative to the recipients’ needs
for 3 days, the amount of time food was expected to last. Both urban and rural
boxes provided “more than adequate amounts of all nutrients when compared
with the Recommended Dietary Allowances [RDA].” Fat and cholesterol content
of the boxes complied with the Dietary Guidelines of the U.S. Department of
Agriculture (USDA). Although mean values of the boxes more than met RDA
standards, the ranges for individual boxes could be quite large. For example,
the range of calcium provided in the boxes was 162 mg to 3,359 mg (RDA
reference=800 mg) per person per day (Friedman 1991). These ranges
demonstrate the variability of the donated food.
The urban boxes contained more riboflavin, niacin, vitamin C, iron, and
fiber than the rural boxes, as the urban sites provided more legumes, fortified
breakfast cereals, enriched rice, and fresh produce. Typical foods found in the
boxes included canned vegetables and fruits; fresh apples, bananas, potatoes,
and onions; oatmeal and ready-to-eat cereals; pasta, rice, flour, bread, and
tortillas; cookies; doughnuts; fresh or frozen chicken, turkey, and ground beef;
pizza; canned tuna; pinto, lima, and kidney beans; and fresh or powdered milk
(Friedman 1991).
Researchers in Delaware assessed the foods available to emergency food
centers during one month. They classified the food according to the USDA’s
food guide pyramid and the minimum recommended servings per person per
day. They found that food centers were able to meet the needs of 6,509 people
per day with foods from the “Bread, Cereal, Rice, and Pasta” group, but only
478 people per day with adequate servings from the “Milk, Yogurt, and Cheese”
group. Other food groups fell between these two extremes. The researchers
suggested that discretionary spending by the emergency food centers be
focused on increasing the amounts of dairy products available for distribution
(Cotugna et al. 1994).
Employing a 24-hour dietary recall, Reno, Nevada researchers evaluated
the diets of 174 soup kitchen patrons and 20 food pantry clients. They found
that diets were lowest in calcium, thiamin, and vitamin C, based on the RDA
for the clients’ ages and genders. Otherwise, diets met at least two-thirds of
the RDA (Lenhart and Read 1989).
A survey of emergency food providers in southern Ontario revealed that
nutrition knowledge and skills were lacking among emergency food providers
and their clients, yet the agencies were more concerned about shortages of food
than learning more about nutrition (Kennedy et al. 1989). The same
researchers questioned clients about their food preferences. They found that
foods such as lentils, chickpeas, kidney beans, dry beans, tomato paste, and
powdered milk were poorly accepted by participants, suggesting that clients
might not be taking advantage of the nutritional quality that is available due to
taste and preference. No other studies were found that explored the
preferences of the emergency food clients.
How is the food distributed?
Fairfax County food pantries deliver different varieties of foods to clients
in amazingly varied ways. For example, some pantries include only shelf-
stable, donated foods, while others regularly stock perishables in their own
freezers and refrigerators. Most depend largely on foods collected by members
of churches. Below is a sampling of the practices of a few of the pantries
serving Fairfax County; there are more than 30 other food pantries available in
churches and other organizations in Fairfax County (Fairfax-Falls Church
United Way 1993).
Link, Inc., a group in western Fairfax County serving 40 to 70 families
monthly, takes calls from clients through an answering machine. Food is
delivered to the families the following day. In addition to staple foods, it
receives leftover produce from a local farmers’ market and it provides grocery
store gift certificates to supplement the food that is donated. Link has a set of
guidelines it uses to decide which foods and what quantities are given to each
family (Tacci 1994),
Koininia Foundation, Inc., provides 3 days’ worth of food to families in the
Franconia area of Fairfax County. Clients come to its warehouse on weekday
mornings to pick up food. They are given a list of foods available and check off
the foods they want. Foods are then packed by a pantry worker. Besides food
donations from churches and other civic associations, Koininia also procures
food from the Capital Area Community Food Bank (part of the Second Harvest
network) and from surplus government commodity distributions (Dwinnele
1994).
Share, a group that serves the McLean area of Fairfax County, opens its
pantry for 2 hours only on Wednesdays and two Saturdays per month. Only
non-perishable items are available, and pantry volunteers allow one bag of
10
groceries per person per week, choosing foods in accordance with the worker’s
judgment (Respaff 1994).
Clients are screened by family counselors before they can get food at
ECHO, Inc., which serves the Springfield area of the county. Once accepted,
the client is given 1 to 3 weeks’ supply of food, including perishables such as
meat, eggs, bread, and margarine. The pantry is open weekday mornings and
three evenings each week (Curtis 1994).
Reston Interfaith, Inc., is staffed by paid workers who choose food for
clients. Clients must fill out an application before receiving food. A family of
four is given two to three bags of groceries, estimated at about 50 pounds of
food, to last 3 to 4 days. Food is donated by churches and businesses, as well
as farmers’ markets (Bordeaux 1994).
Lazarus at the Gate attempts to fill in the gaps left by other food
pantries. This group of volunteers and paid workers operates a warehouse and
distributes food nightly at 16 sites throughout Northern Virginia. Each client is
given enough food for one day, and the choice of food is based on what is
available (McMannon 1994).
Fairfax FISH, Inc., delivers food to clients from its eight church pantries
on the day of the request in most cases. In addition to the staples donated by
church members, drivers are authorized to purchase up to $20 worth of
perishable food for each family. Fairfax FISH’s Policy and Procedures Manual
does not include any official guidelines for choosing food; the decisions are
totally up to the driver.
11

What guidelines exist for providing food for food pantry clients?
Although most of the food pantry personnel contacted in Fairfax County
reported that their volunteers and employees choose food for clients using their
own judgment, some pantries both in Fairfax County and elsewhere follow
written guidelines.
Link, Inc. has guidelines for a week’s food for a single person and for a
family of four (Appendix A). The package for one person includes a minimum
of 18 shelf-stable items from 11 categories, plus a $5 supermarket gift
certificate to be used to supplement the food. The package for four consists of
‘a minimum of 35 items from 19 categories plus a $10 gift certificate. Items in
both lists include bread, cereal, beans, canned meats and entrees, canned
vegetables and fruits, pasta and/or rice, and powdered or canned milk. Larger
families also get pancake mix, peanut butter, jelly, and spaghetti sauce.
Optional items include desserts, tea, and coffee. The guidelines suggest that
the food for one will fit into one grocery bag; the food for four will fit into four
bags (Tacci 1994).
Guidelines for 2 days’ food for a family of four by the Navy Relief Society
(Appendix B) recommend 17 items from 11 categories, including cereal,
noodles, meats, peanut butter, jelly, crackers, canned fruits and vegetables,
soup, dry milk, and juice (Navy Relief Society 1987).
The Maryland Food Committee’s manual for operating a food pantry
includes sample lists of food for families of one, two, three, and four people
(Appendix C). These guidelines are for three days’ food. The package for a
single person includes 16 or more items and includes canned meat, soup,
vegetables, fruit, and juice; dry beans, cereal, canned or powdered milk;
cheese; and peanut butter. There are also optional ground beef and fresh
bread. The package for four includes 32 items, with the same variety as listed
12
for one. This manual cautions the volunteer not to underestimate the
importance of providing nutritious foods: “it is very often the case that these
people have already been living on potatoes for a week or cornflakes for three
days” (Maryland Food Committee 1986).
Washington State University’s Cooperative Extension has produced a
videotape to train food pantry workers to choose food for clients. That
videotape uses the USDA food pyramid as a tool for choosing the right
quantities of nutritious foods. They recommend 6-11 servings (or more) from
the grain group; 5 servings of fruits and vegetables; 2 servings of milk, cheese,
or leafy vegetables; and 2-3 servings of meat or meat substitutes per person
per day. The videotape shows how to judge serving sizes. The videotape also
suggests food choices for pregnant women and for those with lactose
intolerance, HIV-AIDS, cancer, heart disease, hypertension, and diabetes
(Poehlitz and Butkus 1994).
Another source of food planning guidance is the USDA’s Thrifty Food
Plan. It was designed as the basis for benefits in the Food Stamp Program and
as a model for economical, nutritious meal planning. The plan provides a
detailed list of types and quantities of foods that could be used to feed a family
of four for a month (Appendix D). The cost of the foods listed was $256 per
month in 1982. Although this list is too specific to be useful amid the
frequently changing stocks of a food pantry, it could serve as a well-researched
starting place (Consumer Nutrition Division 1983).
Guidelines for donations to food pantries parallel the guidelines for
distribution, using the USDA food guide pyramid (Krummel 1994, Washington
State Food and Nutrition Council 1994) and food safety guidelines (Albrecht
and Lauterbach 1993).
13
METHODOLOGY
Overview of study design
Data were collected using four different survey instruments completed
by the client, the researcher, the driver, and the telephone captain:
¢ Aclient survey form was delivered to clients with their food. It was a
simplified family food diary of foods received from FISH and eaten during
one week, plus satisfaction and food security questions.
¢ A brief telephone survey was conducted by the researcher shortly after food
was delivered. It included questions on usual food security, food sources,
and comments on what was received.
¢ A driver survey was filled out by drivers to verify details of food delivered
and information about that delivery.
¢ A Fairfax FISH Report was completed by each telephone captain including
the basic information on client address, family size, and the basic delivery
information.
All clients who received food from Fairfax FISH during 6 consecutive
weeks of October and November 1994 were included in the study. Survey
forms placed in each of FISH’s eight church pantries along with a sign alerted
drivers to the study.
Clients called Fairfax County Human Services Intake to request food. A
county worker screened requesters, then called the FISH captain on duty and
relayed basic information on the client. The captain then called the FISH
driver and relayed the same information to the driver. The driver might then
14
verify by telephone that someone would be at home to receive the food; during
that call, the driver might also ask what the client needed or wanted. The
driver then went to one of FISH’s eight food pantries to select and obtain the
food; while there, the driver picked up a client survey form to give to the client
and a driver survey form to fill out. En route to the client’s home, the driver
might or might not stop at a supermarket to buy up to $20 in additional
groceries or other requested items.
The researcher called each telephone captain as a reminder about the
study and to have him or her remind the driver to look for the forms. At the
end of each captain’s duty, the researcher again called the captain to determine
if a food delivery had been made and to obtain the name and phone number of
clients receiving food. If the captain had any questions about the survey, the
researcher also called the driver involved.
The next day, or as soon as the client could be reached, the researcher
telephoned the client to ascertain whether he or she had received the food
survey form and to see if there were any questions. At that time the telephone
survey was conducted. Two weeks later, the client was called again if the
survey had not been returned. After a month with no response, the client was
sent a letter (Appendix E) and a new survey if there had still been no response.
Population studied
The population studied encompassed all people who requested food from
FISH. The sample included everyone who requested food during 6 consecutive
weeks of October and November 1994, thus it was a self-selecting sample. The
36 deliveries during this period accounted for about 11% of the 325 Fairfax
FISH food deliveries in 1994. Five weeks were originally scheduled for data
15
collection, because Fairfax FISH has a 5-week rotating schedule of churches
responsible for drivers and captains, and in 5 weeks every church would have
been responsible for at least one day’s deliveries. However, after 5 weeks, there
had been fewer requests than anticipated, so data collection continued for one
more week. The study could not be continued longer because, during the
following week, Thanksgiving baskets were to be delivered to the most needy
families, and very little food would be requested.
Pilot study
A pilot study was conducted for one week in August 1994 to determine
the feasibility of the study and to evaluate the survey instruments and their
rate of return. Each client who called that week was given a three-page survey
with his or her food delivery. That week brought 11 food requests. Only one
survey was returned without a follow-up call, so the researcher called all the
clients who had telephones to ask if they needed help; one more survey was
returned. The researcher then sent the remaining nine clients an additional
survey with a letter, and received only one more response.
Interestingly, all three returned client surveys were completed by men,
which was atypical of the population being studied; this population is
composed largely of households without any men. In the pilot study, all
drivers returned their surveys, and there seemed no need to alter that form.
The pilot study indicated a need to make it more convenient to respond
to the questions and to emphasize the value of their answers to future service
from Fairfax FISH. Therefore the survey instrument was simplified to fit on
only one page (front and back), and the remaining questions, many of them
open-ended, were moved to a telephone survey form. The incentive of a
drawing for gift certificates was emphasized with bold type on the survey’s
16
cover letter and by the researcher during telephone follow-up. Also stressed in
the letter and by phone was the value of clients’ input to future service by
FISH. All changes were made to increase response rate by making responses
easier and by reminding the clients of the survey more effectively.
The incentive
A lottery for $100 in grocery store gift certificates was provided to give
clients an additional incentive to return the surveys. This lottery was described
in the cover letter accompanying the survey and reemphasized during the
telephone interview and in a follow-up letter.
Gift certificates were solicited from the four largest supermarket chains
in the Fairfax FISH area. Two supermarkets did not contribute; however, Giant
Food contributed $50 in gift certificates and Shopper’s Food Warehouse
contributed a $25 gift certificate. The researcher purchased the remaining $25
gift certificate. The total was sent to a single family after a random drawing in
mid-December 1994.
The survey instruments
The client food survey (Appendix F) was designed to find out what foods
clients received, what they had on hand, and what foods they used during the
week following the food delivery. Food items were categorized into 24 broad
general types to correspond with the foods usually found in food pantries and
with items drivers often purchase at the store. No attempt was made to judge
the nutrient value of any foods.
17

In addition to the food diary were two questions. One simply asked if
the client was satisfied with the food delivered, and the other was a food
security question derived from a study of low-income households (Kisker and
Devaney 1988). The food security question referred to the week of the delivery,
and served as an additional measure of satisfaction.
Clients without telephones were given a different survey form (Appendix
G), since they could not be contacted for a telephone interview. This form
included questions from the telephone interview plus the questions on the
client survey form.
Each client survey form was placed in a stamped envelope addressed to
FISH’s post office box, as FISH workers may not disclose their addresses,
phone numbers, or full names to clients.
The telephone survey (Appendix H) consisted of six questions. The first
question asked about other food sources clients might use, such as school
lunches and breakfasts, other food programs, restaurants, and family and
friends. The second and third questions dealt with foods the family received
but did not intend to eat. The next question gave clients an opportunity to
name foods they did not receive, but would like to have received. Usual
household food security was the subject of the next question, and the final
question simply asked for additional comments.
The client was contacted for the telephone survey the day after the food
delivery. If the client could not be reached that day, the researcher continued
to call every day for up to two weeks or until contact was made.
The driver survey (Appendix I) began with a checklist of foods taken to
the client; this list corresponded with the food diary in the client survey. Some
18

information was requested about the client, then about the driver. There were
also two questions asking how the driver chose the food and for any tips other
drivers might find helpful. Drivers picked up surveys in the pantries at the
same time they picked up food for the clients, and mailed the forms in a
stamped, pre-addressed envelope.
The Fairfax FISH Report (Appendix J) is completed by telephone captains
for every financial assistance, transportation, and food request, whatever the
outcome. It was not designed for this study, but it is routinely used to track
basic data about the client, driver, time and money spent, and the captain’s
comments on the case.
Data analysis
Results from the survey instruments were analyzed using NCSS (Number
Cruncher Statistical System 1992) and Microsoft Excel (1992). Descriptive
statistics were compiled for all responses.
An index was designed by the researcher to evaluate the amount of each
food category specified on the instruments: the amount of food used by the
families responding was divided by the amount of food that was delivered by
FISH. This index indicated the types of foods that were being over- or
undersupplied by FISH. The categories were then analyzed by bivariate
regression, with the amount delivered as the independent variable and the
amount used as the dependent variable; these correlation coefficients were
used to determine how much the amount used by families varied based on the
amount supplied.
19

Bivariate regression was also applied to determine if significant
relationships existed between family size and the amount of food delivered,
family size and the amount used, and the amount of food delivered according
to the client and the driver. For all calculations, statistical significance was
determined to be p<0.05.
20
RESULTS
Population characteristics
During the 6-week study period, 36 deliveries of food were made to 35
different families; one family received two deliveries. The deliveries provided
food for a total of 120 people: 41 adults and 79 children.
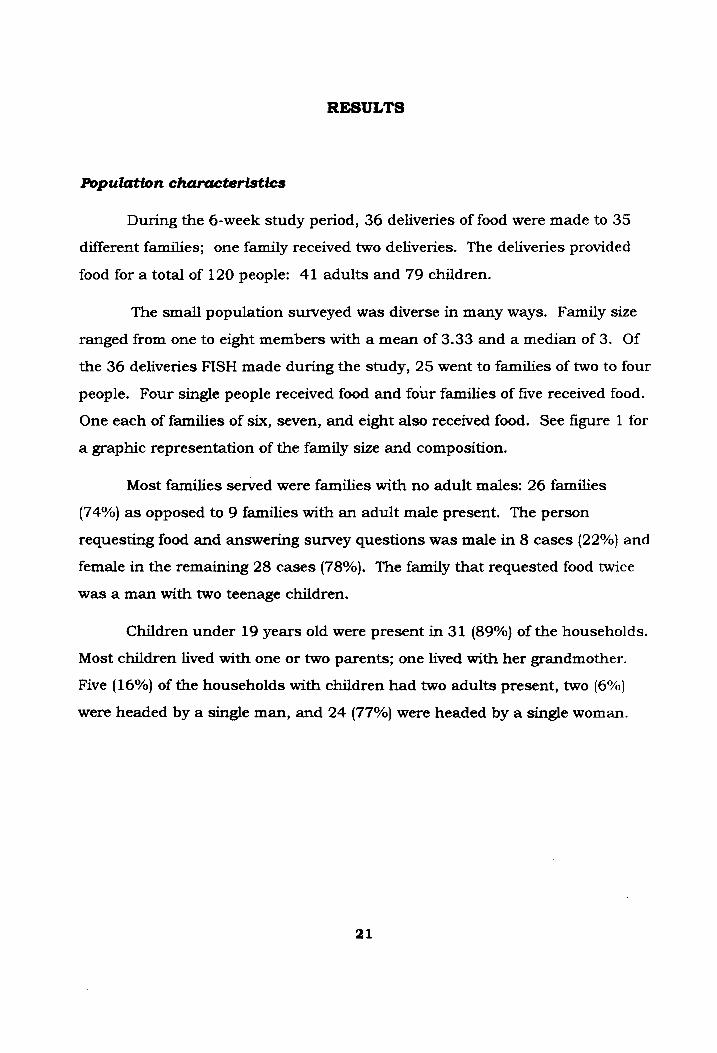
The small population surveyed was diverse in many ways. Family size
ranged from one to eight members with a mean of 3.33 and a median of 3. Of
the 36 deliveries FISH made during the study, 25 went to families of two to four
people. Four single people received food and four families of five received food.
One each of families of six, seven, and eight also received food. See figure 1 for
a graphic representation of the family size and composition.
Most families served were families with no adult males: 26 families
(74%) as opposed to 9 families with an adult male present. The person
requesting food and answering survey questions was male in 8 cases (22%) and
female in the remaining 28 cases (78%). The family that requested food twice
was a man with two teenage children.
Children under 19 years old were present in 31 (89%) of the households.
Most children lived with one or two parents; one lived with her grandmother.
Five (16%) of the households with children had two adults present, two (6%)
were headed by a single man, and 24 (77%) were headed by a single woman.
21

Individual
families oo
served by ed
FISH —_— [_] Number of children
—_—_—__————— Mi Number of adults
z=
0 2 4 6 8
Number in family
Figure 1. Number of adults and children in families (n=35).
2 N

The ethnicity of the families was determined for 28 (80%) of the 35
families served. Of those, 61% were Caucasian, 36% were Black, and 4% were
Asian; 21% were of Hispanic origin. In Fairfax County, residents are 81%
Caucasian, 8% Black, 9% Asian, and 6% Hispanic (Fairfax County Office of
Management and Budget 1994).
A telephone in the home was noted in the study because of its telephone
survey component. In this group of 35 families, 30 (86%) had telephones, 4
{11%) had no telephones, and one man’s phone was disconnected between the
time of the delivery and the follow-up call. Four families with phones were
unable to be reached for the follow-up calls; two of these moved before they
could be contacted. Of the 26 people who were contacted by telephone, three
adults were unable to understand English sufficiently to answer all of the
questions; however, in two cases, teenage children answered for their parents.
A need for special diets was noted by six families. Four families
requested low-fat foods, two requested vegetarian foods for adults, one
indicated a need for low-sugar foods, and one family included a diabetic child.
Hunger in the studied population
A basic assumption of this study was that anyone who called and
requested food was hungry; however, hunger as measured by the study came
in many forms. Responses to the food security question in the telephone
interview revealed disparate descriptions of usual food in the homes. Of the 27
families who responded to the question, two (7%) selected “We have enough of
all the foods we want to eat.” Ten (37%) chose “We have enough food but not
always what we want.” Eleven (41%) chose “We sometimes don’t have enough
23
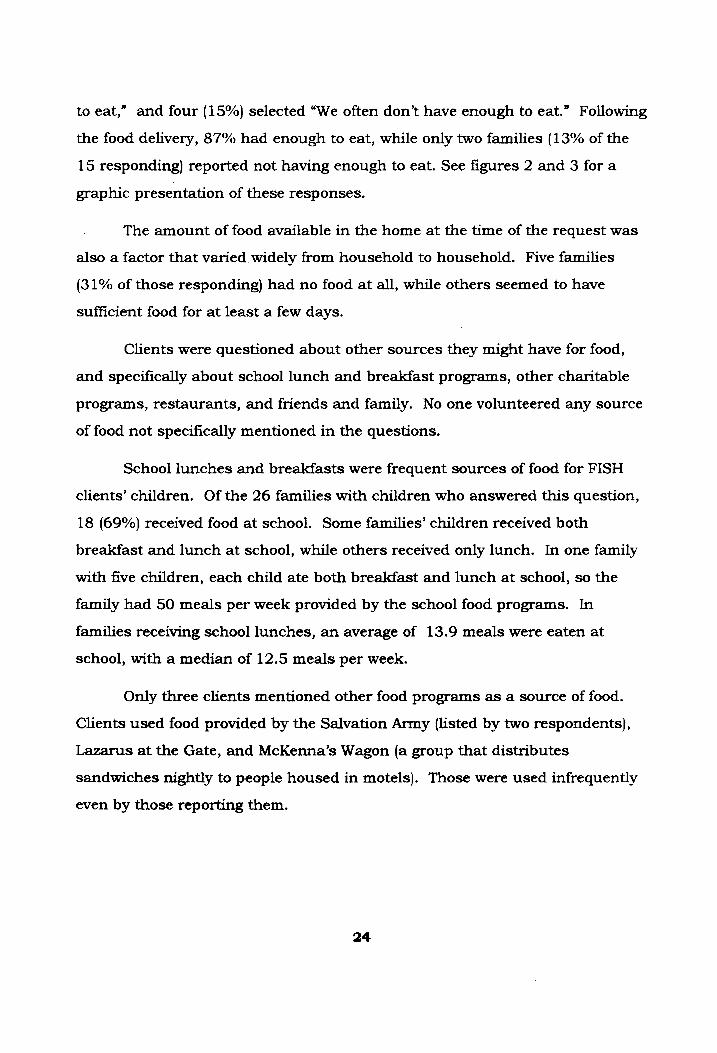
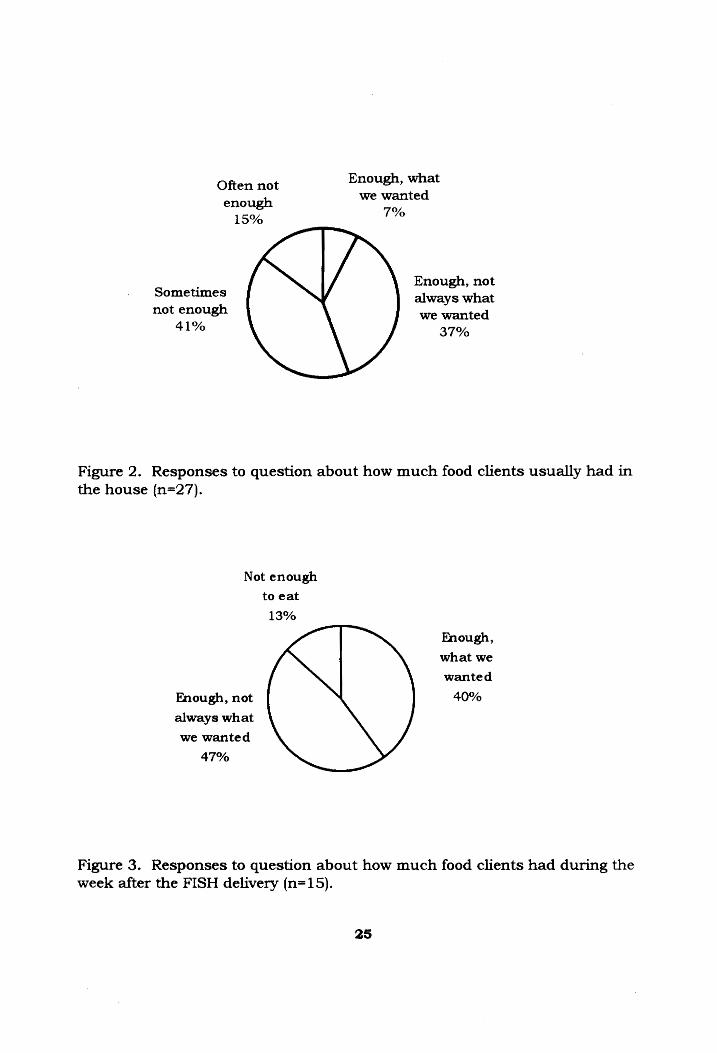
to eat,” and four (15%) selected “We often don’t have enough to eat.” Following
the food delivery, 87% had enough to eat, while only two families (13% of the
15 responding) reported not having enough to eat. See figures 2 and 3 fora
graphic presentation of these responses.
The amount of food available in the home at the time of the request was
also a factor that varied widely from household to household. Five families
(31% of those responding) had no food at all, while others seemed to have
sufficient food for at least a few days.
Clients were questioned about other sources they might have for food,
and specifically about school lunch and breakfast programs, other charitable
programs, restaurants, and friends and family. No one volunteered any source
of food not specifically mentioned in the questions.
School lunches and breakfasts were frequent sources of food for FISH
clients’ children. Of the 26 families with children who answered this question,
18 (69%) received food at school. Some families’ children received both
breakfast and lunch at school, while others received only lunch. In one family
with five children, each child ate both breakfast and lunch at school, so the
family had 50 meals per week provided by the school food programs. In
families receiving school lunches, an average of 13.9 meals were eaten at
school, with a median of 12.5 meals per week.
Only three clients mentioned other food programs as a source of food.
Clients used food provided by the Salvation Army (listed by two respondents},
Lazarus at the Gate, and McKenna’s Wagon (a group that distributes
sandwiches nightly to people housed in motels). Those were used infrequently
even by those reporting them.
24
Enough, what Often not
we wanted enough 70;
15% °
. Enough, not Sometimes always what
not enough we wanted 4 1% 379 Yo
Figure 2. Responses to question about how much food clients usually had in the house (n=27).
Not enough
to eat
13%
Enough,
what we
wanted
Enough, not 40%
always what
we wanted
47%
Figure 3. Responses to question about how much food clients had during the
week after the FISH delivery (n=15).
25
Two clients reported regularly eating in restaurants because of their
work schedules. One single man said he ate in a restaurant one or two times
every day. A single mother with one child ate lunch at a restaurant six times
per week.
Four families received emergency food from family and/or friends on a
regular basis; none said the family received more than one meal weekly from
those people.
Foods received by clients
Sixteen families (44%) completed the checklist of foods received. They
reported receiving an average of 38 food items (median = 37; standard
deviation = 17). However, the number of items received varied from 10 (a
family of two) to 75 (a family of four).
Those same families reported having an average of about 9 items
(standard deviation = 15) already in the home, although the median of these
figures was only 1.25, partly because five families reported having no food at
all; the range of responses was from 0 to 54 items. The family with 54 food
items already in the home seemed to have a good quantity and variety for its
four family members, but that family apparently did not think so.
Drivers reported delivering an average of 39 food items (standard
deviation = 15) in the 27 deliveries reported, with a median of 36. These values
ranged from 8 items to 61 items. Twelve complete data sets were available for
comparing the families’ reports with the drivers’ reports; clients reported
receiving an average of five items less than drivers reported delivering; however,
six clients (50%) reported receiving less than drivers said they had delivered,
and five clients (42%) claimed to receive more than the driver reported. In only
one case were client and driver in accord on the amount delivered.
26
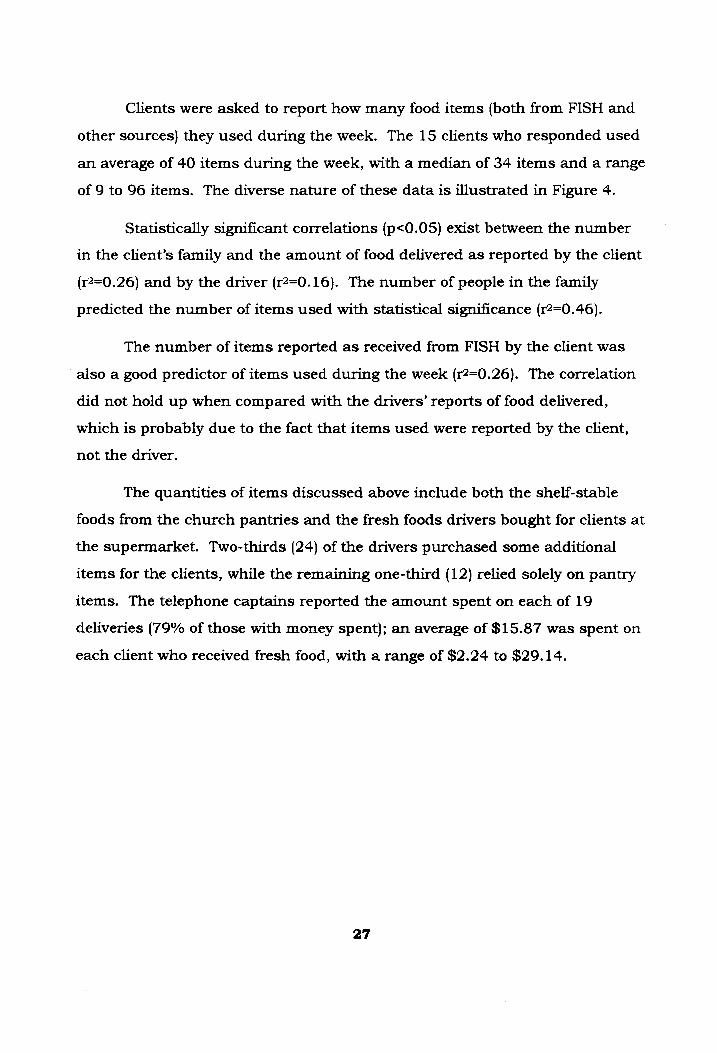
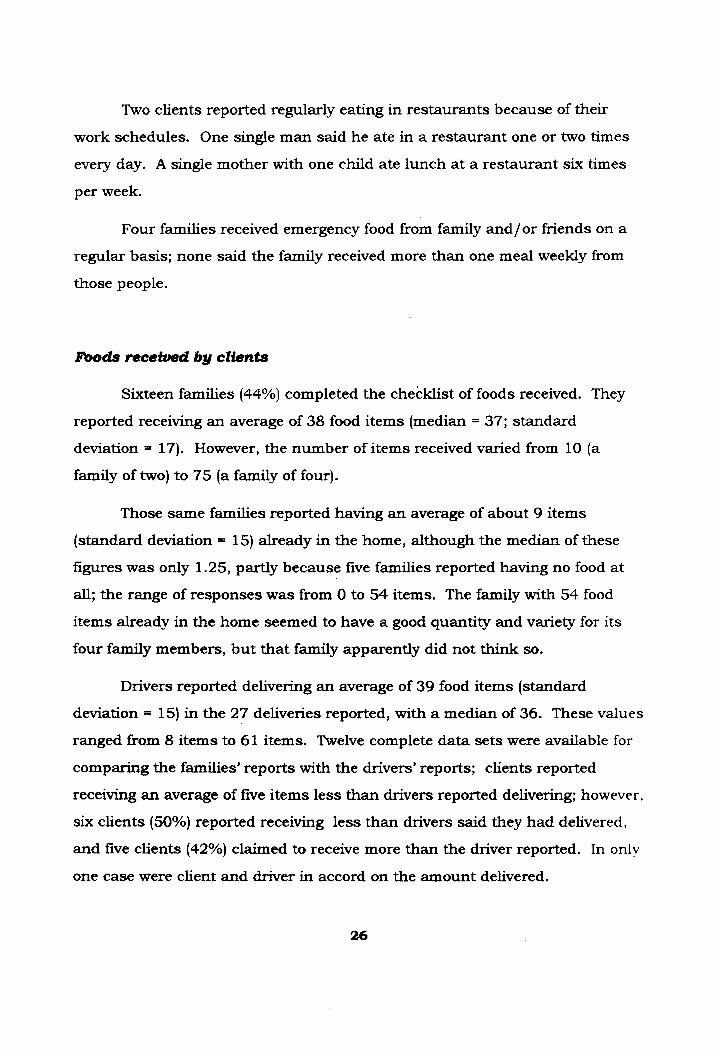
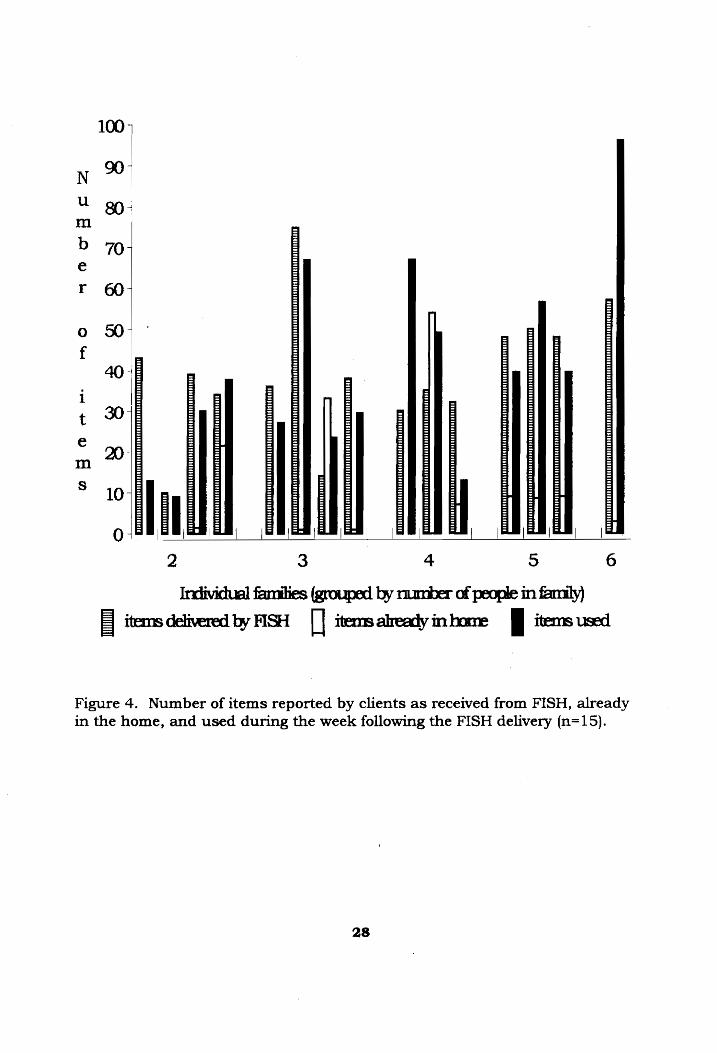
Clients were asked to report how many food items (both from FISH and
other sources) they used during the week. The 15 clients who responded used
an average of 40 items during the week, with a median of 34 items and a range
of 9 to 96 items. The diverse nature of these data is illustrated in Figure 4.
Statistically significant correlations (p<0.05) exist between the number
in the client’s family and the amount of food delivered as reported by the client
(r2=0.26) and by the driver (r2=0.16). The number of people in the family
predicted the number of items used with statistical significance (r2=0.46).
The number of items reported as received from FISH by the client was
‘also a good predictor of items used during the week (r?=0.26). The correlation
did not hold up when compared with the drivers’ reports of food delivered,
which is probably due to the fact that items used were reported by the client,
not the driver.
The quantities of items discussed above include both the shelf-stable
foods from the church pantries and the fresh foods drivers bought for clients at
the supermarket. Two-thirds (24) of the drivers purchased some additional
items for the clients, while the remaining one-third (12) relied solely on pantry
items. The telephone captains reported the amount spent on each of 19
deliveries (79% of those with money spent); an average of $15.87 was spent on
each client who received fresh food, with a range of $2.24 to $29.14.
27
toope a
ry
©
oR
ot
=
ULL
LLL
LCE REEL
EO
Leet LLL
ey Pt
=
rq
ny
J
cn) = =
=
i]
7 7 7 = ~
om pnd
Pd 4
=
=
=
PERE
EEULLECE ELLE
R EOL
L
LEU
SOUL
LL L
ULL
LEER
LOR
E CUPP CEE
E LU
LL
LULL
fl 2 3 | 4 5 6
Individual families (grouped by number of people in family) items delivered by FISH [ | items already in home i items used
Figure 4. Number of items reported by clients as received from FISH, already in the home, and used during the week following the FISH delivery (n=15).
28

Only 14 clients completed both the part of the food diary about foods
received and the part about foods used during the week. The numbers are
small, but the data are compelling. An index was devised to assess the relative
quantities of food delivered to and used by the subgroup of 14 families: the
amount of food used was divided by the amount FISH delivered. Index
numbers lower than 0.5 signify that less than half of the food brought was
used; numbers higher than 2.0 indicate that more than twice as much food
was used as was delivered. The foods, quantity delivered to and used by the
14 families, and the indexes are listed in table 1. The foods that stand out as
oversupplied include dried milk and dried beans, peas, and lentils. Foods
clients used their own resources to obtain include cheese; fresh meat, fish, or
poultry; fresh milk; and eggs.
Satisfaction
Seventeen families responded to the very general question, “Were you
satisfied with the food FISH provided this week?” Of those, 15 (88%) were
satisfied and 2 (12%) were not.
Those same 17 clients responded to a question describing their food
situation for the week following the food delivery. Six (38%) chose “We had
enough of all the foods we wanted to eat.” Seven (44%) chose “We had enough
food, but not always what we wanted,” and two (13%) responded, “We didn’t
have enough to eat.” An additional client chose both of the last two responses.
When 28 clients were asked if they wished for additional foods to have been delivered, 18 (63%) answered in the affirmative and 10 (37% of those responding) wanted nothing more. The desired foods are listed in table 2.
29
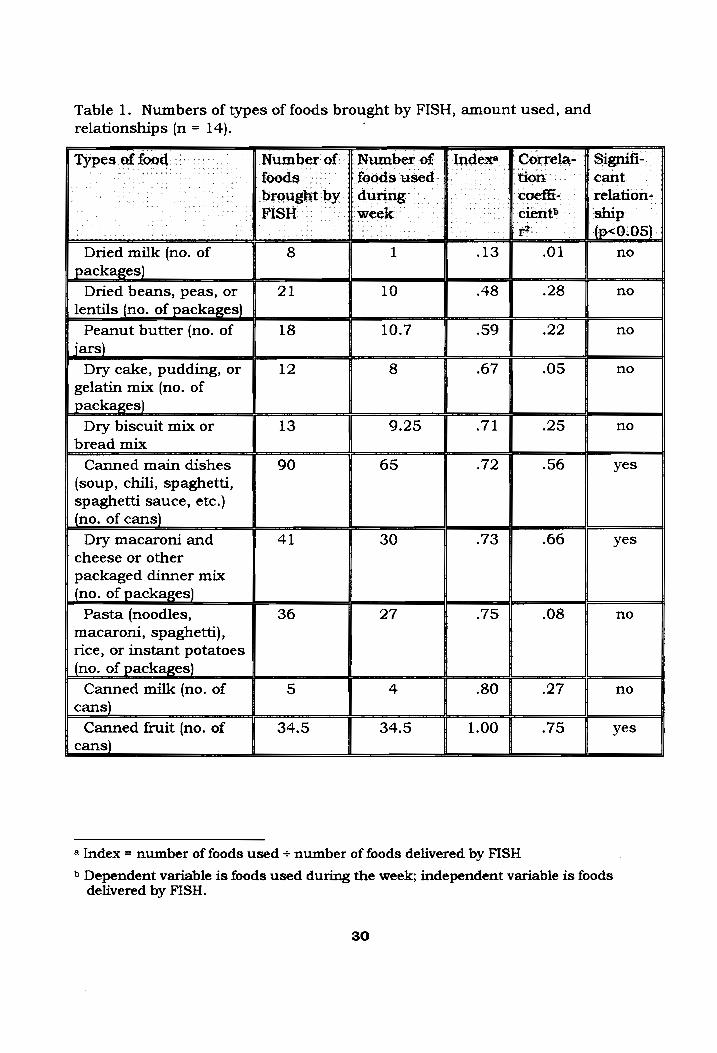
Table 1. Numbers of types of foods brought by FISH, amount used, and
relationships (n = 14).
Types of food Number of | Number of { Index | Correla- | Signifi- foods foods used tion cant brought by | during coeffi- relation-
FISH week cient ship r? (p<0.05)
Dried milk (no. of 8 1 13 .O1 no
packages)
Dried beans, peas, or 21 10 .48 .28 no
lentils (no. of packages)
Peanut butter (no. of 18 10.7 09 22 no
jars) Dry cake, pudding, or 12 8 .67 05 no
gelatin mix (no. of packages)
Dry biscuit mix or 13 9.25 71 .25 no
bread mix
Canned main dishes 90 65 .72 .06 yes
(soup, chili, spaghetti, spaghetti sauce, etc.)
(no. of cans)
Dry macaroni and 41 30 73 .66 yes
cheese or other packaged dinner mix
(no. of packages)
Pasta (noodles, 36 27 75 .08 no
macaroni, spaghetti), rice, or instant potatoes
(no. of packages) _
Canned milk (no. of 5 4 .80 27 no cans) _
Canned fruit (no. of 34.5 34.5 1.00 75 yes
cans)
@ Index = number of foods used + number of foods delivered by FISH
b Dependent variable is foods used during the week; independent variable is foods delivered by FISH.
30

Table 1. Numbers of types of foods brought by FISH, amount used, and relationships (n = 14) (continued).
Types of food Number of || Number of { Indexes | Correla- | Signifi- foods foods used | tion cant brought by | during coeffi- relation-
FISH week cient? ship r? {p<0.05)
Baby food and 0 0 1.00 1.00 yes
formula (no.of jars or cans}
Cereal (no. of 24 25 1.04 .39 yes
packages)
Canned vegetables 61 65 1.07 21 no
(no. of cans)
Canned meat, tuna, or 38 41 1.08 32 yes
other fish (no. of cans)
Fresh bread (no. of 18 20.5 1.14 62 yes loaves or packages)
Jelly or jam (no. of 9 12.25 1.36 .O1 no
jars) Condiments (mustard, 7 11 1.57 .o2 yes
ketchup, sauces)
Fresh vegetables and 19 35 1.84 25 no
fruits (no. of kinds)
Cheese (no. of 2 8.5 2.83 .40 yes packages)
Fresh meat, fish, or 13 37.5 2.88 .96 yes
chicken (no. of pounds)
Fresh milk (no. of 9 29.5 3.27 11 no quarts)
Eggs (dozens) 2.95 9 3.60 .00 no
4 Index = number of foods used + number of foods delivered by FISH
b Dependent variable is foods used during the week; independent variable is foods delivered by FISH.
31
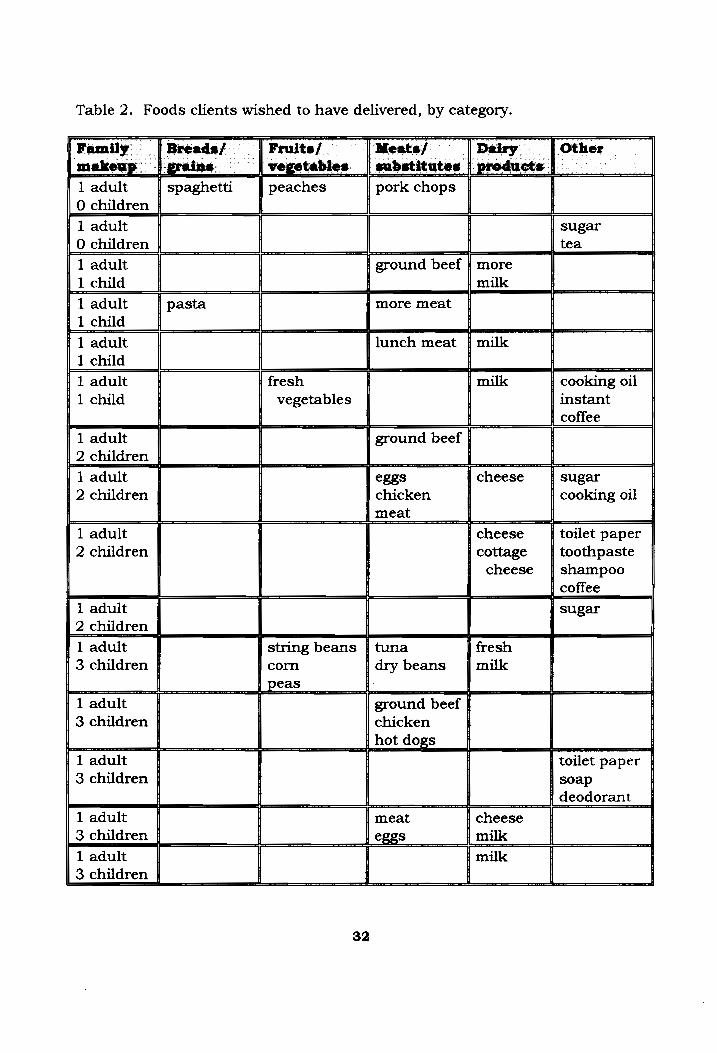
Table 2. Foods clients wished to have delivered, by category.
Family Breads/ Fruits / Meats/ Dairy Other makeup | grains vegetables | substitutes | products
1 adult spaghetti peaches pork chops
O children
1 adult sugar O children tea
1 adult ground beef | more 1 child milk
1 adult pasta more meat 1 child
1 adult lunch meat 4 milk 1 child
1 adult fresh milk cooking oil
1 child vegetables instant coffee
1 adult ground beef
2 children
1 adult eggs cheese sugar 2 children chicken cooking oil
meat
1 adult cheese toilet paper 2 children cottage toothpaste
cheese | shampoo
coffee
1 adult sugar 2 children
1 adult string beans | tuna fresh 3 children corn dry beans milk
peas
1 adult ground beef 3 children chicken
hot dogs
1 adult toilet paper
3 children soap deodorant
1 adult meat cheese 3 children eggs milk
1 adult milk
3 children
32

Table 2. Foods clients wished to have delivered, by category (continued)
Family: Breads / Fruits/ Meats/ Dairy Other
makeup | grains vegetables | substitutes | products 1 adult Ramen pork chops | more sugar
5 children noodles eggs milk
more cereal
2 adults turkey or
2 children ham
2 adults spaghetti fresh fruit
6 children (apples, oranges bananas
grapes)
33
Meat, milk, cheese, eggs, and pasta led the items in frequency of mention.
Rarely donated items such as sugar, tea, coffee, cooking oil, and personal
articles each appeared multiple times.
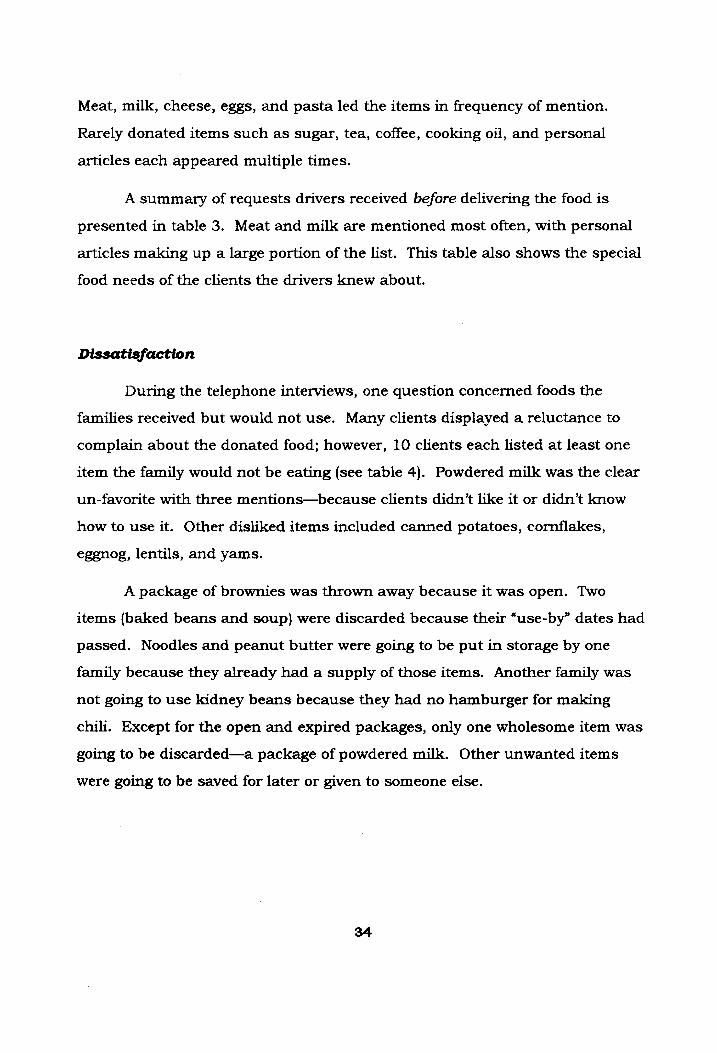
A summary of requests drivers received before delivering the food is
presented in table 3. Meat and milk are mentioned most often, with personal
articles making up a large portion of the list. This table also shows the special
food needs of the clients the drivers knew about.
Dissatisfaction
During the telephone interviews, one question concerned foods the
families received but would not use. Many clients displayed a reluctance to
complain about the donated food; however, 10 clients each listed at least one
item the family would not be eating (see table 4). Powdered milk was the clear
un-favorite with three mentions—because clients didn’t like it or didn’t know
how to use it. Other disliked items included canned potatoes, cornflakes,
eggnog, lentils, and yams.
A package of brownies was thrown away because it was open. Two
items (baked beans and soup) were discarded because their “use-by” dates had
passed. Noodles and peanut butter were going to be put in storage by one
family because they already had a supply of those items. Another family was
not going to use kidney beans because they had no hamburger for making
chili. Except for the open and expired packages, only one wholesome item was
going to be discarded—a package of powdered milk. Other unwanted items
were going to be saved for later or given to someone else.
34
Table 3. Special requests made by clients to drivers before deliveries.
Family mekeup j{ Special diet or food needs Items requested
1 adult adult is vegetarian bread 1 child both on low-fat diets milk
1 adult baby formula 1 child
1 adult adult on low-fat diet
1 child
1 adult 1 child is diabetic
2 children
1 adult adult on low-fat diet cooking oil
2 children fruit juice or punch
1 adult diapers 3 children
1 adult toilet paper 3 children soap, shampoo
lunch fixings
1 adult meat
3 children milk eggs vegetables
1 adult adult on low-sugar diet 4 children
1 adult tampons 4 children
1 adult meat 5 children canned products
2 adults meats 2 children
2 adults milk
2 children meat
eggs tuna helper
2 adults adults are vegetarians 3 children father on low-fat diet
2 adults diapers 5S children
2 adults fresh milk 6 children diapers
35

Table 4. Foods clients reported that they would not eat, reasons for not eating the foods, and what clients intended to o with the food.
Foods clients did not intend to eat
Reason What was to be done
with food
baked beans can was out of date throw it away
brownies bag was open throw it away
canned potatoes don’t like them may use in a stew
cornflakes don’t like them may add sugar and eat them
eggnog don’t like it serve to company during holidays
kidney beans don’t have any will donate to charity hamburger to use with them
lentils don’t like them or know | give to sister
how to prepare them
noodles have too many keep until needed
peanut butter have too much keep until needed
powdered milk don’t like it leave in cupboard until
find a use for it
powdered milk kids don’t like it may use if we are desperate
powdered milk no instructions on
preparation
throw it away
soup can was out of date throw it away
yams don’t like them will donate to charity
36
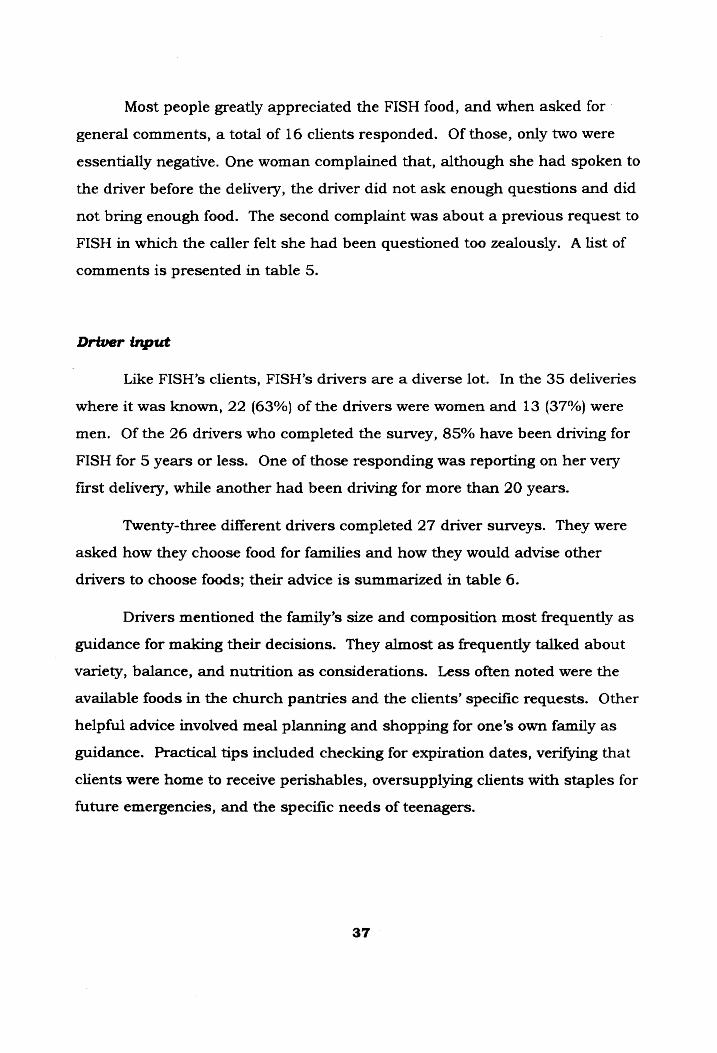
Most people greatly appreciated the FISH food, and when asked for
general comments, a total of 16 clients responded. Of those, only two were
essentially negative. One woman complained that, although she had spoken to
the driver before the delivery, the driver did not ask enough questions and did
not bring enough food. The second complaint was about a previous request to
FISH in which the caller felt she had been questioned too zealously. A list of
comments is presented in table 5.
Driver input
Like FISH’s clients, FISH’s drivers are a diverse lot. In the 35 deliveries
where it was known, 22 (63%) of the drivers were women and 13 (37%) were
men. Of the 26 drivers who completed the survey, 85% have been driving for
FISH for 5 years or less. One of those responding was reporting on her very
first delivery, while another had been driving for more than 20 years.
Twenty-three different drivers completed 27 driver surveys. They were
asked how they choose food for families and how they would advise other
drivers to choose foods; their advice is summarized in table 6.
Drivers mentioned the family’s size and composition most frequently as
guidance for making their decisions. They almost as frequently talked about
variety, balance, and nutrition as considerations. Less often noted were the
available foods in the church pantries and the clients’ specific requests. Other
helpful advice involved meal planning and shopping for one’s own family as
guidance. Practical tips included checking for expiration dates, verifying that
clients were home to receive perishables, oversupplying clients with staples for
future emergencies, and the specific needs of teenagers.
37
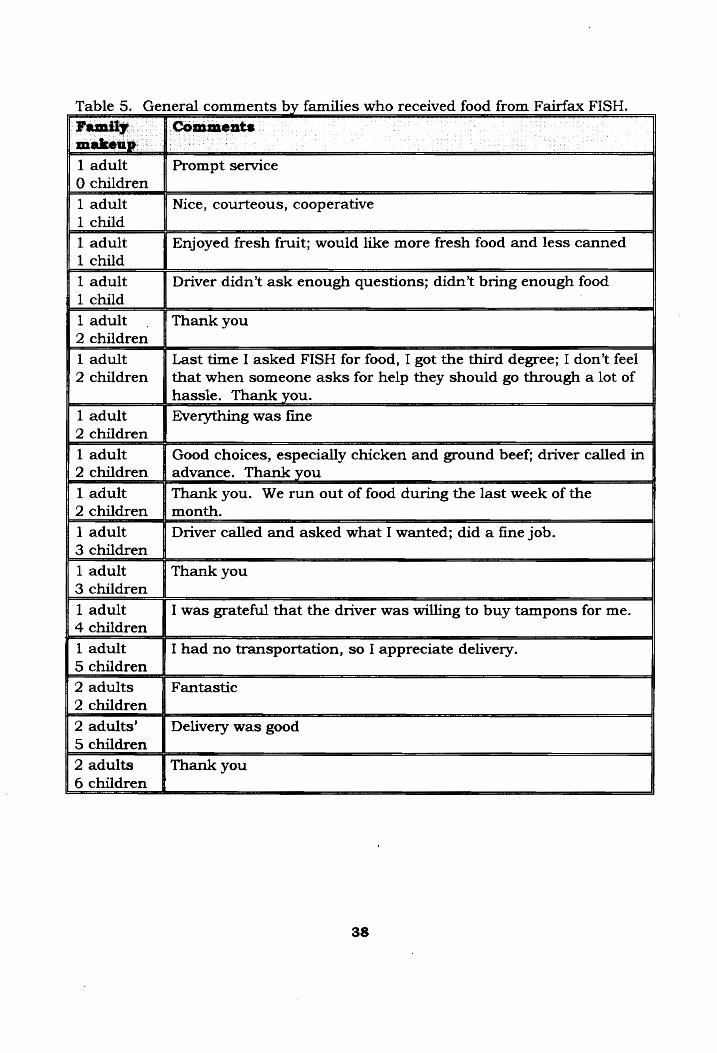
Table 5. General comments by families who received food from Fairfax FISH.
Family Comments makeup
1 adult Prompt service O children
1 adult Nice, courteous, cooperative
1 child
1 adult Enjoyed fresh fruit; would like more fresh food and less canned
1 child
1 adult Driver didn’t ask enough questions; didn’t bring enough food 1 child
ladult | | Thank you
2 children
1 adult Last time I asked FISH for food, I got the third degree; I don’t feel 2 children j that when someone asks for help they should go through a lot of
hassle. Thank you.
1 adult Everything was fine 2 children
1 adult Good choices, especially chicken and ground beef; driver called in 2 children { advance. Thank you
1 adult Thank you. We run out of food during the last week of the 2 children | month.
1 adult Driver called and asked what I wanted; did a fine job. 3 children
1 adult Thank you 3 children
1 adult I was grateful that the driver was willing to buy tampons for me. 4 children
1 adult I had no transportation, so I appreciate delivery.
5 children
2 adults Fantastic
2 children
2 adults’ Delivery was good 5 children
2 adults Thank you 6 children
38

Table 6. Factors listed by drivers as to how they choose foods for families.
Driver's Number, | Call Variety What's | Other years -ages, and | client of foods § | in driving for | genders and ask || for good | pantry FISH and in family | what is nutrition
| gender needed
4+ yes I often leave $20 for female special needs or items
I’ve forgotten
2+ Church workers chose
male for me
2+ yes FISH captain makes male suggestions
3+ yes female
2 yes yes yes Prayerfully! female
2.5 yes Plan meals in my head female for each day
8 yes yes
female
1 yes Church workers chose
female for me
3 yes Trip through the aisles of male supermarket
6 yes yes
male
2 yes Choose enough for a female whole meal; try to bring
a couple of desserts
3to5 yes
male
3 yes Period of time male
4-5 Chose canned and boxed male foods; not sure how good
refrigeration was
20-25 yes female
20 yes yes Make sure someone is
female there to receive food
39
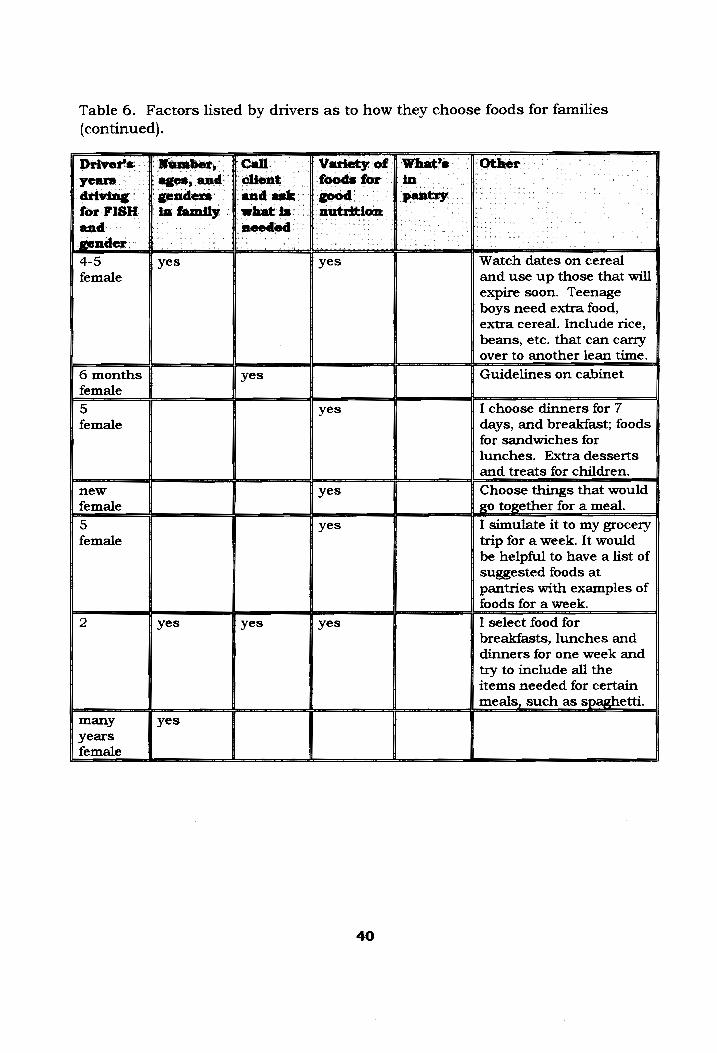
Table 6. Factors listed by drivers as to how they choose foods for families
(continued).
Driver's | Number, / Call Variety of | What’s Other years ages, and | clien foods for | in driving | genders and ask | good pantry for FISH | in family | what is nutrition and needed | gender
4-5 yes yes Watch dates on cereal female and use up those that will
expire soon. Teenage boys need extra food, extra cereal. Include rice,
beans, etc. that can carry over to another lean time.
6 months yes Guidelines on cabinet female
5 yes I choose dinners for 7 female days, and breakfast; foods
for sandwiches for lunches. Extra desserts and treats for children.
new yes Choose things that would female go together for a meal.
5 yes I simulate it to my grocery female trip for a week. It would
be helpful to have a list of suggested foods at pantries with examples of foods for a week.
2 yes yes yes I select food for breakfasts, lunches and
dinners for one week and
try to include all the items needed for certain meals, such as spaghetti.
many yes years female

Drivers unanimously reported that the church pantries were well-
stocked during the study period. When supplies are low in the pantries, there
is not much choice in variety of foods and selecting food becomes more of a
challenge. FISH had just completed its annual food drive at area supermarkets
before the study began.
41
DISCUSSION
Hungry children
As in previous studies of food pantry clients, families with children
comprised most of the study population. The majority of households were
headed by women, which is also typical of other studies. In this study, about
89% of the households included children and nearly two-thirds of those served
were children, which is a higher proportion than in many other studies (Second
Harvest 1994, Raab et al. 1988, Clancy et al. 1991).
Children under 19 are estimated to make up only about 26.4% of the
population of Fairfax County in 1995 (Fairfax County Office of Management
and Budget 1994), so children are disproportionately represented among the
hungry in this study. The large proportion of children could be explained by
adults’ ability to be more flexible in providing for themselves, but wanting to
provide more varied and generous diets to their children. The two teenagers
who answered the telephone survey questions for their non-English-speaking
mothers both reported that sometimes their mothers skipped meals so that the
children would have more to eat.
Nonetheless, the large number of children in the sample is alarming, for
children are more quickly affected by lack of adequate food. Children suffering
from hunger may not stand out in a crowd, but they can exhibit frequent |
headaches, fatigue, and irritability (Levy 1994). Hunger can lead to an inability
to concentrate in school (and the far-reaching consequences that may result),
as well as increased vulnerability to disease which leads to more missed days
of school (Food Research and Action Council 1991). Many of the concerns of
this study focus on children, because FISH serves so many of them.
42
Foods provided
The quantity of food provided to most families, taken alone, appeared
abundant for one week’s needs. Nine of the 14 families who reported on this
subject said they received more food than they used during the week. When
asked whether they had enough food during the week after FISH’s delivery,
only two clients (13%) said they did not have enough to eat. This compares
favorably with responses to a similar question asking about usual household
supplies of food. Of 27 responses to the question about usual food, 56% said
they sometimes or often did not have enough food. Additionally, 88% of
respondents claimed to be satisfied with FISH.
These data must be taken advisedly, as many clients seemed reluctant
to complain about the food that was delivered to them. When asked specifically
what foods would not be eaten, only 10 of the 27 clients responding had
anything to say (see table 4). Some foods were disliked, some were past their
“use-by” dates, and others were oversupplied.
These responses correspond with the responses (presented in table 1),
that describe the quantities of food used compared to what was brought.
People found ways to supply themselves with fresh milk, meat, eggs, etc. to
supplement the staples contributed by FISH. That behavior seems to imply
that the hunger in FISH’s territory, at least for some families, may be less
desperate than might be assumed.
It is interesting to see that the same items that appear in table 1 as
items provided by clients themselves are also present on the list of driver
requests (table 3) and the list of items clients wished they had received (table
2): namely, cheese, meat, milk, and eggs. A case can be made for providing
those items on a regular basis, especially when growing children are part of the
household.
43

On the other hand, dried milk appeared most often on the list of foods
that were not going to be eaten (table 4) because it was not well liked. Of the
eight families who reported receiving dried milk, only one used it during the
week following the delivery. Apparently dried milk is an unpopular food among
this population. A former FISH officer once remarked (off the record) that she
knew a client was truly needy when he or she was grateful to receive dried
milk. Of course, dried milk is a frequently donated item, because it has a long
shelf life and is very nutritious. It is recommended that dried milk deliveries be
accompanied by some ideas for using it in other foods or mixing it with fresh
milk to stretch the milk. Dried milk does not have the huge price advantage
over fresh milk that it once had—in March 1995, it was selling at a price
equivalent to $2.00 for a gallon of fluid milk while the same store sold fresh
milk for $2.39 per gallon—so it might be worthwhile to use fresh milk that is
more readily accepted.
Dry beans were another food item that was poorly accepted, using the
index in table 1 as a criterion. One reason for this may be that the beans are
time-consuming to prepare and people may not know how to use them. Also,
several families received more than one package of the beans, and might have
had too many to use in one week. Canned beans could be a more useful choice
for donations.
Other items in table 1 follow a pattern. The marginally accepted foods
(such as dessert mixes, biscuit mix, and packaged dinners) require more
preparation time than do comparable items such as fresh bread and cookies,
crackers, cupcakes, and other snacks. Staple items that require little or no
preparation, such as canned fruits and vegetables, cereal, and plain canned
meats or fish were better accepted than the mixtures of foods that require
preparation, such as packaged mixes.
One family noted that they would not be using the noodles and peanut
butter they received from FISH because they had too much. This may be the
reason that the pasta, rice, and potatoes category and peanut butter had such
low indexes. People may tire of eating these items when they are conserving
their resources, and choose to eat something different when it is provided.
Canned main dishes also had a marginally low index. Two reasons
could be postulated for this. Although they are easy to prepare, the mixtures
in the cans might be less acceptable to picky eaters. Also, they may be
oversupplied to the clients.
Bivariate regression performed on the foods in table 1 indicated that ©
some foods were used in quantities that depended to some extent on the
quantities in which they were supplied. For example, the amounts of canned
fruit, dinner mixes, fresh bread, and cookies and crackers were eaten in greater
amounts by families who received larger amounts of them. Other foods were
eaten in quantities that bore little or no relationship to the quantities of foods
provided: eggs; dried milk; fresh milk; pasta, rice or instant potatoes; jelly or
jam; and dry dessert mixes all had r? values of less than 0.15. Of those, jelly,
fresh milk, and eggs were used in greater quantities than they were provided;
while dried milk, pasta, and dessert mixes were not used as often as they were
provided.
Although no attempt was made to determine the nutritional content of
the foods delivered, it is obvious that trends noted in other studies apply to the
deliveries made in Fairfax County. Milk and other dairy products appeared
very low relative to the needs of the families, especially the children. People
wanted more meat, eggs, and cheese; although protein foods might have been
adequately supplied, meat, eggs, and cheese are perceived as important in the
growth of children. Fruits and vegetables were supplied, but not in quantities
45

that would supply the “five a day” that nutritionists strive for. Most people
probably had sufficient supplies of grain and cereal products, and there were
extra calories available in snacks, desserts, and other specialty items for
energy.
Although paper products and toiletries are not food items, they were
requested and wished for by some respondents to this study. As one woman
put it, without toilet paper and soap, she was in danger of losing her dignity.
Food pantries, including FISH, routinely supply disposable diapers, and it is
suggested that they expand their donations to include such items as toilet
paper, soap, shampoo, and deodorant on a limited basis. These items could be
donated to the pantries along with the foods and included in a standard food
package at no cost to the pantry.
Diversity—in servers and the served
This small study is limited in addressing the great variety of families,
living situations, and food preferences of the people who received food from
Fairfax FISH. Each family received food chosen by a different driver, so the
data are often literally apples and oranges. The nutritionist might opt for the
oranges, but they might go to a family of finicky children who would have been
better off with the slightly less nutrient-dense choice of apples. Guidelines for
a group as varied as this need to be flexible; need to account for tastes as well
as nutrition, for supply as well as demand, for preparation ease as well as for
economy.
Limitations to this study include the small sample size from a small area
of Fairfax County, Virginia. Although the sample included more than 10% of
the deliveries made during 1994—and probably a much larger percentage of
families served—it may not have any relationship to a hungry population in a
rural setting or a population with a different ethnic composition. Expectations
may be higher for this group of needy people living in the midst of an affluent
suburb: in Fairfax County, the median family income was $70,000 in 1991;
and 63% of the families earned more than $60,000 (Fairfax County Office of
Management and Budget 1994).
The client survey instrument also had limitations. The 24 food
categories could have been confusing for some people. Of the 17 people who
returned the survey, only 14 completely filled in the food diary, and some of
_those may have misunderstood the directions, because one or two surveys were
returned before the week was over. Quantities were not precise in order to
make the surveys easy to complete, but accuracy was sacrificed. A better
approach for a future study would be for the researcher to total the food items
in person, along with the recipient, then return to the client’s home for an in-
person evaluation; however, that process would be highly labor-intensive.
Although everyone contacted by phone seemed more than willing to
cooperate, the population studied was not highly motivated to complete the
survey forms. At least in this study, the more personal attention that was paid
to clients through follow-up calls and letters, the more apt they were to comply.
Several mentioned that they would be sure to return their forms in order to
participate in the gift certificate lottery.
47
CONCLUSIONS
Clients receiving food from a food pantry have definite tastes and
desires, just as paying customers do. Food pantries should try to provide the
most nutritious foods they can, but they should also provide foods people will
want to eat. Pantries can specify foods that they want to have donated, and
they can use discretionary monies to buy foods that will be utilized most fully.
In addition they can solicit feedback from clients to help improve their services.
Specifically, Fairfax FISH can:
1) Encourage drivers to find out about the specific needs of a client
during the call that is usually made to arrange for delivery. They should
inquire about family food preferences, cooking facilities and abilities, and
special dietary needs. If children are present, drivers should find out whether
children receive meals at school or need breakfast and packable lunch foods.
2) Develop more specific guidance for drivers, especially for those who
have little experience shopping and planning meals. A set of proposed
guidelines has been developed by the researcher and follows in table 7. These
guidelines are based loosely on the USDA food guide pyramid, modified to fit
the types of foods usually available in food pantries. Nutritional adequacy also
relies on the drivers’ buying additional foods according to the shopping list
described below.
3) Encourage drivers to buy fresh food for all families (except possibly
those who overuse the services of FISH), especially families with children. A
proposed shopping list follows in table 8.

4) Develop simple educational materials that can be packed with foods,
including recipes and serving ideas to help people learn to use frequently
donated foods such as powdered milk and dry beans.
5) Provide guidance for people who donate the foods to the food pantries
so that supplies are varied to suit the needs and wishes of the clients. Alert
pantry coordinators to rotate supplies so that foods are used before their
expiration dates.
6) Add toiletries to the standard package that is sent to clients.
49
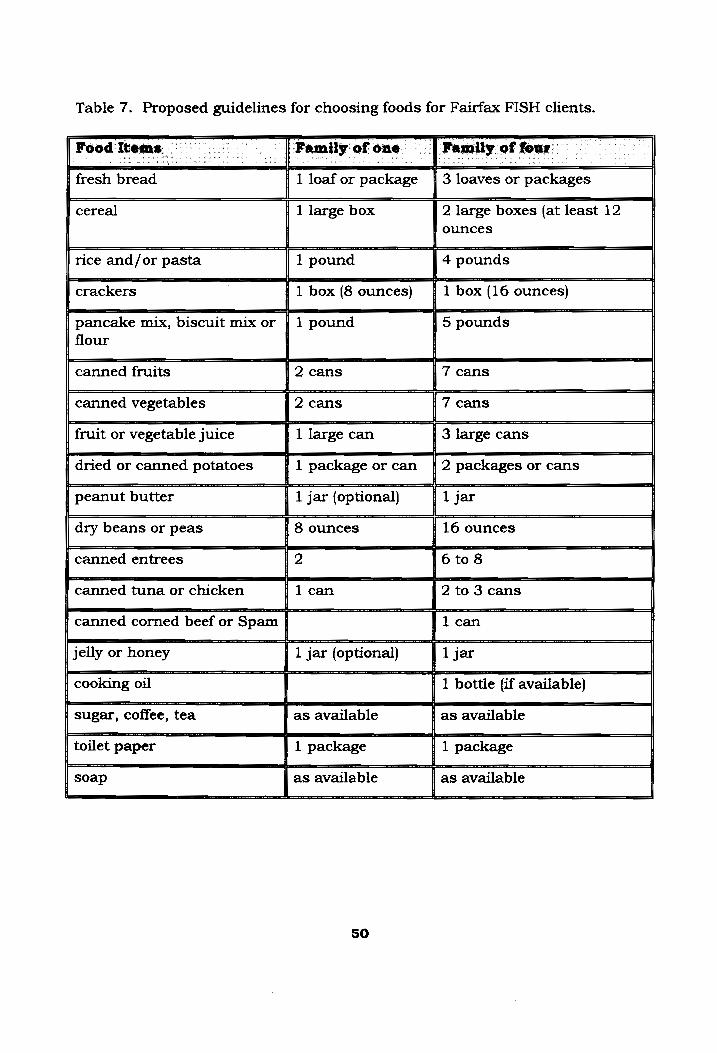
Table 7. Proposed guidelines for choosing foods for Fairfax FISH clients.
Food Items Family of one Family of four
fresh bread 3 loaves or packages
1 loaf or package
cereal 1 large box 2 large boxes (at least 12 ounces
rice and/or pasta 1 pound 4 pounds
crackers 1 box (8 ounces) 1 box (16 ounces)
pancake mix, biscuit mix or | 1 pound 5 pounds
flour
canned fruits 2 cans 7 cans
canned vegetables 2 cans 7 cans
fruit or vegetable juice 1 large can 3 large cans
dried or canned potatoes 1 package or can 2 packages or cans
peanut butter 1 jar (optional) 1 jar
dry beans or peas 8 ounces 16 ounces
canned entrees 2 6to8
canned tuna or chicken 1 can 2 to 3 cans
canned corned beef or Spam 1 can
jelly or honey 1 jar (optional) 1 jar
cooking oil 1 bottle (if available)
sugar, coffee, tea as available as available
toilet paper 1 package 1 package
soap as available as available
50

Table 8. Proposed shopping list for drivers taking food to FISH clients.
Shopping list for family of one to
two
Shopping list for family of three to
four
1 to 2 galions milk 3 gallons milk
1 bag apples or oranges 1 bag apples or oranges
1 dozen eggs 1 dozen eggs
1 pound chicken parts or ground beef 1 fresh chicken or 12 pounds ground
beef or stew meat
1 pound margarine or butter 1 pound margarine or butter
1/2 pound cheese 1 pound cheese
Note: These quantities can be purchased within the $20 guidelines; however, more money should be spent on milk for families with more than 4 children.
S51

BIBLIOGRAPHY
Albrecht J.A. and S. Lauterbach. Donating Foods. Cooperative Extension
Institute of Agriculture and Natural Resources, University of Nebraska—
Lincoln. NF93-151. 1993.
Bordeaux, J. Personal communication. September, 1994.
Bread for the World. Hunger 1992: Second Annual Report on the State of World
Hunger—Ideas that Work. Washington: Bread for the World Institute, 1991.
.Bread for the World. Hunger 1993: Uprooted People. Washington: Bread for
the World Institute, 1992.
Bread for the World. Hunger 1994: Transforming the Politics of Hunger.
Washington: Bread for the World Institute, 1993.
Bread for the World. Hunger 1995: Causes of Hunger. Silver Spring,
Maryland: Bread for the World Institute, 1994.
Campbell, C.C. Food insecurity: A nutritional outcome or a predictor variable?
Journal of Nutrition 121: 408-415, 1991.
Campbell, C.C. Private food assistance: the emerging third tier of our food
distribution system. New York’s Food & Life Sciences Quarterly 20 (1/2): 40-
44, 1990.
Clancy, K.L., J. Bowering, and J. Poppendieck. Characteristics of a random
sample of emergency food program users in New York: I. Food pantries.
American Journal of Public Health 81: 911-914, 1991.
Cohen, B.E. Food security and hunger policy for the 1990s. Nutrition Today 25
(4): 23-27, 1990.
52
Consumer Nutrition Division, Human Nutrition Information Service. The
Thrifty Food Plan, 1983. Hyattsville, MD: United States Department of
Agriculture, 1983
Cotugna, N., C.E. Vickery, and M. Glick. An outcome evaluation of a food bank
program. Journal of the American Dietetic Association 94: 888-890, 1994.
Curtis, J. Personal communication. September, 1994.
Dwinnele, J. Personal communication. September, 1994.
Fairfax County Office of Management and Budget. Demographic Reports.
Fairfax Country Office of Management and Budget, 1994.
Fairfax—Falls Church United Way. Directory of food providers serving our
Fairfax—Falls Church community. Vienna, Virginia: Fairfax—-Falls Church
United Way. 1993.
Foodbanks adapting to changing, lasting need. Nutrition Week 22(41): 3, 1992.
Food Research and Action Council. Community Childhood Hunger Identification
Project. Washington: Food Research and Action Council, 1991.
Friedman, B.J. Urban and rural food agencies provide adequate nutrition to
the hungry. Journal of the American Dietetic Association 91 {12)1589-1590.
1991.
Havemann J. House GOP maps Food Stamp cuts. The Washington Post.
March 5, 1995, p. A-1.
How Hungry Is America? Newsweek, March 14, 1994, 58-59.
Hunger in America: Who Cares? Hearing before the Select Committee on
Hunger, U.S. House of Representatives. Washington, D.C.: U.S. Government
Printing Office. 1992. |
53
Kennedy, A., J. Sheeshka, and L. Smedmar. Enhancing food security: a
demonstration support program for emergency food centre providers. Journal
of the Canadian Dietetic Association 53:284—-287, 1992.
King, S. View from a food pantry. What’s New in Home Economics 22 (3): 8-9,
1989.
Kisker, E.E. and B. Devaney. The Food Choices of Low-Income Households:
Final Report. Princeton, NJ: Mathematica Policy Research, Inc. 1988.
Krummel D.A.. National Nutrition Month® and Hunger Awareness Week: a
win-win effort. Journal of the American Dietetic Association 94 (3): 254-255.
1994.
Lenhart, N. M. and M.H. Read. Demographic profile and nutrient intake
assessment of individuals using emergency food programs. Journal of the
American Dietetic Association 89(9):1269-1272, 1989.
Levedahl, J.W., and M. Matsumoto. Food assistance. National Food Review
13 (3): 26-32, 1990.
Levy, C.W.. Mommy, I’m Hungry. Family Circle. November 22, 1994.
Maryland Food Committee, Inc. Plain Talk About Emergency Food Centers.
Baltimore, MD: The Maryland Food Committee, 1986.
McMannon, G. Personal communication. September 1994.
Microsoft Excel, Version 4.0. Microsoft Corporation. 1992.
Navy Relief Society. Food locker information. September 1987.
Number Cruncher Statistical System, Version 5.03. Jerry L. Hintze. 1992.
Poehlitz, M. and S. Butkus. Special food bags in the food bank (videotape).
Pullman, Washington: Washington State University Cooperative Extension.
1994.
54
Raab, C.A., A. Holyoak, and L.G. Raff. Bridging the hunger gap. Journal of
Home Economics 80 (3): 3-8, 1988.
Radimer, K.L., C.M. Olson, and C.C. Campbell. Development of indicators to
assess hunger. Journal of Nutrition 120: 1544-1548, 1990.
Reschovsky, J. D. The emergency food relief system: an empirical study. The
Journal of Consumer Affairs 25 (2):258-277, 1991.
Respaff, J. Personal communication. September, 1994
Second Harvest National Food Bank Network. 1993 National Research Study.
Erie, Pennsylvania: VanAmburg Group. 1994.
Smith, P.K. and S.L. Hoerr. A comparison of current food bank users, non-
users and past users in a population of low income single mothers. Journal
of Nutrition Education 24:59S—66S, 1992.
Tacci, L. Personal communication. September, 1994.
Washington State Food & Nutrition Council Hunger Committee and WSU
Cooperative Extension Special Dietary Needs for Food Banks Project. Food
Bank Wish List. Pullman, Washington: WSU Cooperative Extension, 1994.
Whitaker, William H. A charity/justice partnership for U.S. food security.
Social Work 38(4): 494-497, 1993.
55

APPENDIX A. Food package guidelines from Link.
Suggested Guidelines for the Pantry
For 1 person, approximately one grocery bag full.
1 loaf of bread and 1 package of buns. Bread supply is usually abundant, consider this a minimum. 1 small box of cereal or 1 small box of pancake mix. 1 or 2 cans of beans.
Mix or match the following to provide 14 servings: luncheon meat such as Spam (4 servings/can); tuna (2-3 servings/can); cheese (1 ounce/serving); canned entrees such as chili, stew,
pastas with meat or cheese (usually 2 servings/can, but read labels); supplement, if necessary with peanut butter.
5 cans fruits/vegetables, total, more if abundant. or 2 cans of soup. or 2 cans of tomatoes.
can potatoes.
pound of pasta or rice. 1 small box of powdered milk or can of milk. Desserts, coffee, tea, etc. if available.
$5 gift certificate.
—
=
= ot
For a family of 4, approximately 4 grocery bags full.
2 or more loaves bread, 2 or more packages rolls, etc. Be
generous. 1 large box cereal. Pancake mix or flour or other similar item. Sugar or honey if available. 1 or 2 cans beans/person or 1 pound of dry beans.
2 cans tuna. 2 to 4 cans entree such as chili, stew, chunky soups with meat. Cheese if available. 1 can luncheon meat such as Spam. Peanut butter, jelly. (In the previous 6 items, substitute one for the other freely
according to availability. The recipients probably spend some of their gift certificate in this category also.) 7 cans of vegetables, more if abundant. 4 cans fruits, more if abundant. 1 jar spaghetti sauce and 1 can tomatoes of some kind or 2 cans
tomatoes. 1 or 2 cans potatoes.
1 pound rice.
1 pound pasta. 1 can soup/person, more if plentiful.
1 large box dry milk, 1 or 2 cans evaporated milk when available.
56
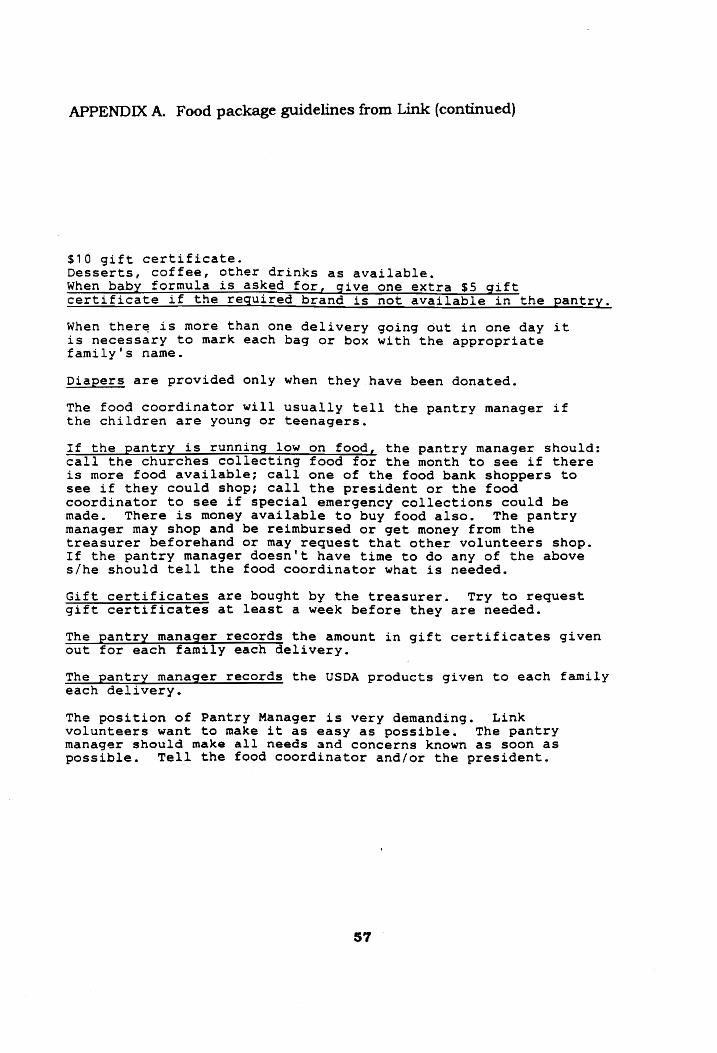
APPENDIX A. Food package guidelines from Link (continued)
$10 gift certificate. Desserts, coffee, other drinks as available. When baby formula is asked for, give one extra $5 gift
certificate if the required brand is not available in the pantry.
When there is more than one delivery going out in one day it is necessary to mark each bag or box with the appropriate family's name.
Diapers are provided only when they have been donated.
The food coordinator will usually tell the pantry manager if the children are young or teenagers,
If the pantry is running low on food, the pantry manager should: call the churches collecting food for the month to see if there is more food available; call one of the food bank shoppers to see if they could shop; call the president or the food coordinator to see if special emergency collections could be made. There is money available to buy food also. The pantry manager may shop and be reimbursed or get money from the
treasurer beforehand or may request that other volunteers shop. If the pantry manager doesn't have time to do any of the above s/he should tell the food coordinator what is needed.
Gift certificates are bought by the treasurer. Try to request
gift certificates at least a week before they are needed.
The pantry manager records the amount in gift certificates given
out for each family each delivery.
The pantry manager records the USDA products given to each family each delivery.
The position of Pantry Manager is very demanding. Link volunteers want to make it as easy as possible. The pantry
Manager should make all needs and concerns known as soon as
possible. Tell the food coordinator and/or the president.
S7
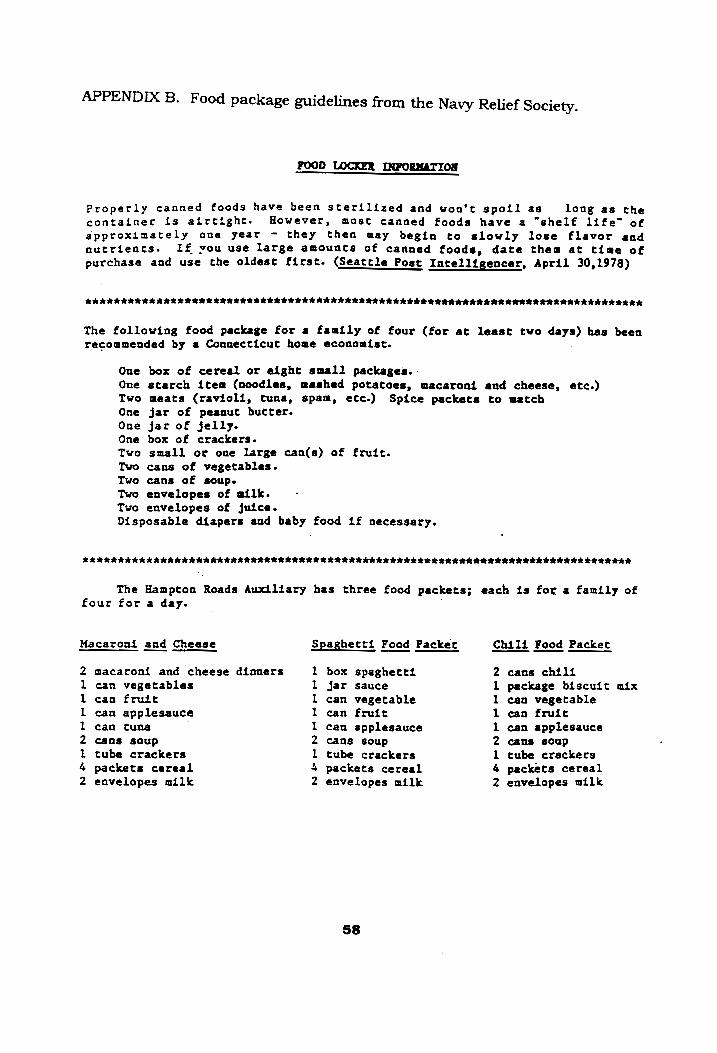
APPENDIX B. Food package guidelines from the Navy Relief Society.
FOOD LOCKER INFORMATION
Properly canned foods have been sterilized and won't spoil as long as the
container is airtight. However, most canned foods have a “shelf life” of approximately one year - they then may begin to slowly lose flavor and
nutrients. If vou use large amounts of canned foods, date them at time of purchase and use the oldest first. (Seattle Post Intelligencer, April 30,1978)
RHKREKRRRERRERERRURRERERRERRERREKERERERERERERREKARERERERRERERRRERMREREAARARKRKKKKRRKK
The following food package for a family of four (for at least two days) has been recommended by a Connecticut home economist.
One box of cereal or eight small packages. -
One starch item (noodles, mashed potatoes, macaroni and cheese, etc.)
Two meats (ravioli, tuna, spam, etc.) Spice packets to match One jar of peanut butter. One jar of jelly.
One box of crackers.
Two small or one large can(s) of fruit.
Two cans of vegetables.
Two cans of soup.
Two envelopes of milk. Two envelopes of juice. Disposable diapers and baby food if necessary.
RERRERKREKKREREEEREREERERERRERERERRERKAKREKRKREREERRKRERERRRERERREREAERRRRARKKRKAKAAKKAKIKR
The Hampton Roads Auxiliary has three food packets; each is for a family of
four for a day.
Macaroni and Cheese Spaghetti Food Packet Chili Food Packet
2 macaroni and cheese dinners 1 box spaghetet 2 cans chili 1 can vegetables 1 jar sauce l package biscuit mix
1 can fruit l can vegetable 1 can vegetable 1 can applesauce 1 can fruit 1 can fruit 1 can tuna 1 can applesauce 1 can applesauce 2 cans soup 2 cans soup 2 cans soup l tube crackers 1 tube crackers 1 tube crackers 4 packets cereal 4 packets cereal 4 packets cereal 2 envelopes milk 2 envelopes milk 2 envelopes milk
58

APPENDIX C. Food package guidelines from the Maryland Food Committee.
SAMPLE EMERGENCY FOOD PACKAGES -- 3 day supply
FAMILY OF ONE--Estimated Benefit $12.00
1 Tb. ground beef or 1 canned beef 1 corned beef or tuna or macaroni dinner 2 cans vegetables 1 rice or 2 cans potatoes or 1 bag noodles or 1 spaghetti 1 can fruit 1 can fruit juice 1 grits or 1 oatmeal i bag dried beans 3 cans soup 1 envelope crackers or 1 loaf of bread 1 package of cheese 1 canned milk or 2 envelopes dried milk 1 jar peanut butter
FAMILY OF TWO--Estimated Benefit $24.00 1 1b. ground beef and 1 canned beef or equivalent of 2 meats
corned beef or tuna or macaroni dinner cans vegetables rice or 2 cans potatoes or 1 bag noodles or 1 spaghetti cans fruit can fruit juice grits or 1 oatmeal bag dried beans cans soup envelopes crackers or 1 loaf of bread package cheese canned milk or 2 envelopes dried milk jar peanut butter
FAMILY OF THREE--Estimated Benefit $36.00 I 1b. ground beef and 2 canned beef or equivalent of 3 meats 2 corned beef or tuna or macaroni dinner 4 cans vegetables 1 rice or 3 cans potatoes or 1 bag noodles or 2 spaghetti 3 cans Fruit 2 canned fruit juice 1 grits or 1 oatmeal 1 bag dried beans 4 cans soup 3 envelopes crackers or 2 loaves of bread 1 package cheese 2 canned milk or 3 envelopes dried milk 1 jar peanut butter
FAMILY OF FOUR--Estimated Benefit $48.00 2 Ibs. ground beef and 3 canned beef or equivalent of 5 meats 2 corned beef or tuna or macaroni dinner 5 cans vegetables 1 rice or 3 potatoes or 1 bag noodles or 3 spaghetti 4 cans fruit 2 cans fruit juice 2 grits or oatmeal 1 bag dried beans 5 cans soup i box crackers or 3 loaves of bread 1 package cheese 2 canned milk or 3 envelopes dried alk 1 jar peanut butter
=
ee DD
om
pt es
| PD ee
oe
59

APPENDIX D. Thrifty Food Plan food list for a month.
Thrifty Food Plan 1983: Food list for a month:
POLAL OES. ccc rcccscevcnsece
Carrots, fresh. ..c.ccececee
Tomatoes, fresh..ccccccesve
Cabbage, fresh...cceccsees Letluc@ecccnsccccccccscece
Celery, fresh....cseccceee
Onions, mature, fresh.....
Other vegetables, fresh... Leafy greens, canned......
Tomatoes, tomato products, CANN] MG. corcvcccccsccccve
Snap beans, canned......«.
Corn, camned...ccccrcccceee
Green peas, canned......e-
Other vegetables, canned and dry .cocnccrcccccecce
Leafy greens, frozen...... Other vegetables, frozen.. Vegetable juices,
canned and frozen.....e-
Citrus fruit, fresh....... Apples, fresh.cccccccccees
Bananas, fresh..ccoccsecce
Other fruit, fresh: .......
Fruit, canned. .cccseccvcces
Fruit juice, canned.......
Fruit and fruit juice, frozen (single strength basis). cccccccacscccsces
Fruit, dried..cccccccccsce Whole~grain/high-fiber
breakfast cereals....... Other breakfast cereals...
20-3/4 1b 1-3/4 lb 2-3/4 1b 5 1b 4-1/4 1b 1 1b 3 1b 12-1/2 1b 3/4 lb
2-1/2 1b 3-1/2 1b 4-3/4 lb 2-1/4 lb
4-1/2 lb 1/2 1b 2 1b
Y-1/4 Lb 11 lb 9 1b 6 1b 2 1b 3-1/2 1b 7-1/4 1b
23-1/4 lb 1/4 lb
3 1b 3-3/4 1b
Whole-grain/high~fiber
flour, meal, rice, pasta Other flour, meal, rice,
PASTE cc cccscccncccvece Whole~grain/high~fiber
bread. .cccccccccscscvess
Other bread. ...cccccesecces Bakery products, mixtures
_ Mostly grain. .ceccsevece Milk, yogurt.cccccccassese Cheese. .cccccccccccesscens
Cream, ice cream,
Other mixtures... seseve
SoOupBecccccccccccceccvccse
Meat, variety meats.......
Poultry .ccccccccccccccsecs Fish, shellfish....cssseee
Bacon, sausage,
luncheon meats. cecccsees Mixtures, mostly meat and
Altermates..coccccccnses EG gS. ccccccccccccccccesess Dry beans. ..csccscccscccce Mature beans, canned......
Peanut butter. .cccsccccese Nuts (shelled weight)..... Margarine, butter. ......0.- Shortening, oil,
Salad dressing. ...cccece SUZaT. coccccccccccccccsccs
Other sweets... ccccccccace
Soft drinks, punches, ades
2-1/4 lb
31-1/4 lt
3-1/2 1d 20—1/2 1b
10-3/4 is
$1-3/4 qs 2-3/4 1b
4-3/4 lb 2-1/2 1d 24-1/2 1> 14 1b 2 1b
6-3/4 1b
1-1/4 1b
4-2/3 doz 4-1/4 1b
3-3/4 lb
2-1/4 1d
1 ib
4 1b
6 1b
7-3/4 1b
4-3/4 lb
6-1/4 qt
roevides for the food needs for a four-person household (man and voman 20=50 and children 6-8 and 9-11 years of age). In addition to foods listed,
most families use some other foods: coffee, tea, cocoa, leavening agents, and seasonings. Approximately one percent above the cost of the foods on the list
is allowed for purchase of these foods when costs for the plan are estimated.
60
APPENDIX E. Client reminder letter.
FAIRFAX FISH, INC.
Attention: Flora
P.O. Box 2254
Fairfax, VA 22031-0254
November 30, 1994
Dear FISH Client:
Recently we delivered a questionnaire concerning our service along with
some food for your family. We have not received your completed questionnaire, and we have been unable to reach you by phone to find
out why. Enclosed is another questionnaire in case you have lost the first one.
We really hope to hear from you. We are trying to improve our food delivery service for everyone in need.
Remember, if you return the questionnaire, your name will be included in a drawing for a $100 gift certificate. We must receive your questionnaire by December 12 for your name to be included in the drawing. Thank you for your time and help.
Sincerely,
Fairfax FISH
61
APPENDIX F. Fairfax FISH client survey.
Fairfax FISH Food Survey
{clients uth telephones)
The food you are receiving today is from Fairfax FISH, a group of
churches that helps families with emergency services. To help us help
people in times of need, we are asking you to complete this survey about
the foods you received today. Your answers will help us learn what kinds
of foods our clients want and need; and how we can serve these needs
better.
The results of this study will be confidential. Researchers will not
release your individual information to anyone else.
The names of those who complete the questionnaire will be
included in a drawing for $100.00 in gift certificates donated by local
grocery stores, which will be awarded in December, 1994. Only one
participant will receive the gift certificates, but it could be you!
Thank you so much for your help.
Sincerely,
Fairfax FISH
62

APPENDIX F. Fairfax FISH client survey (continued).
INSTRUCTIONS
Please fill out the first 2 columns of question #1 (about foods
received} as soon as you can, then complete the remaining questions at
the end of the week. A FISH volunteer will call you soon to see if you
need any help with the survey and ask a few additional questions. If you
have any questions, please call Fairfax County Human Intake Services at
222-3582, and ask for Flora of FISH to return your call.
Please return the survey in the envelope provided when it is
complete. Thank you.
For all members of the household, please complete the following
information:
Name (first name is OK) Age Sex Special food needs (low sodium or vegetarian, for example)
JAN) (example) 63 F low-sugar
Name of person filling out survey:
Date food was delivered:
63
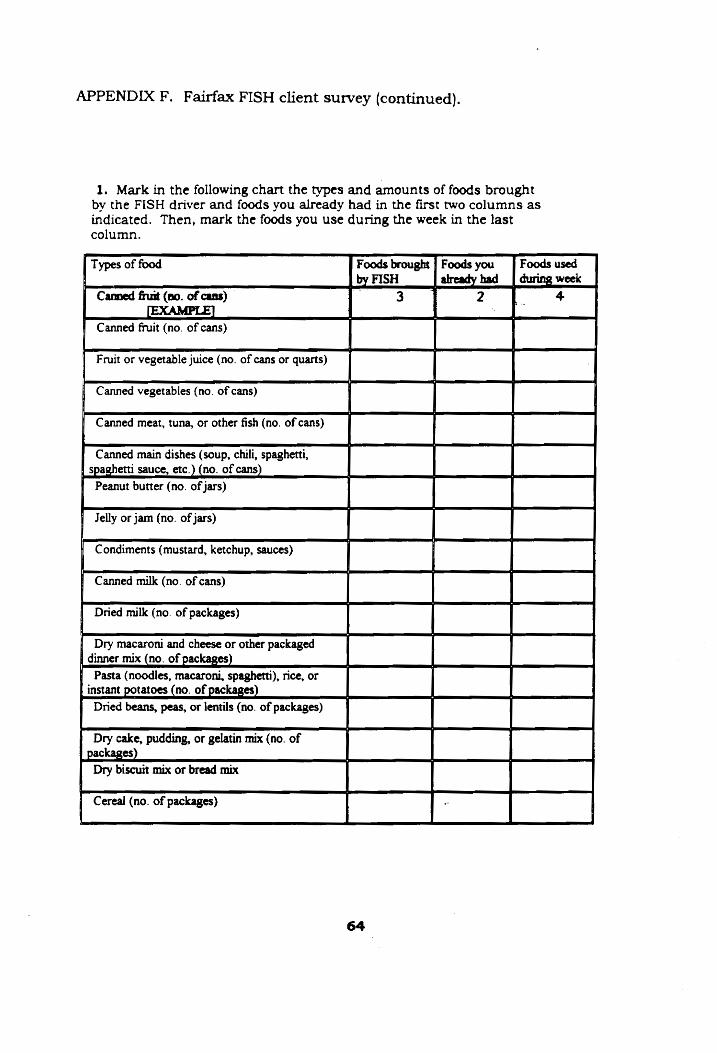
APPENDIX F, Fairfax FISH client survey (continued).
1. Mark in the following chart the types and amounts of foods brought by the FISH driver and foods you already had in the first two columns as
indicated. Then, mark the foods you use during the week in the last column.
Canned fruit (no. of cans) 3 [EXAMPLE]
b ..
Types of food Foods brought | Foods you | Foods used by FISH had | during week wy , ;
4
Canned fruit (no. of cans)
Fruit or vegetable juice (no. of cans or quarts)
Canned vegetables (no. of cans)
Canned meat, tuna, or other fish (no. of cans)
Canned main dishes (soup, chili, spaghetti,
| | spaghetti sauce, etc.) (no. of cans)
Peanut butter (no. of jars)
Jelly or jam (no. of jars)
Condiments (mustard, ketchup, sauces)
Canned milk (no. of cans)
Dried milk (no. of packages)
Dry macaroni and cheese or other packaged dinner mix (no. of packages)
Pasta (noodles, macaroni, spaghetti), rice, or | instant potatoes (no. of packages)
Dried beans, peas, or lentils (no. of packages)
Dry cake, pudding, or gelatin mix (no. of packages)
Dry biscuit mix or bread mix
Cereal (no. of packages)
64

APPENDIX F. Fairfax FISH client survey (continued).
1. (continued)
Types of food Foods brought
by FISH Foods you
already had
Foods used
during week
Fresh bread (no. of loaves or packages)
Cookies, crackers, cupcakes, or snacks (no. of packages) _
Fresh meat, fish, or chicken (no. of pounds)
Eggs (no. of eggs)
Cheese (no. of packages)
Fresh milk (no. of quarts)
Fresh vegetables and fruits (no. of kinds)
Baby food and formula (no. of jars or cans)
Other foods (please describe amount and type of each food)
Foods brought by FISH
Foods you
already had Foods used
during week
2. Were you satisfied with the food FISH provided this week?
Yes
No
3. Which statement describes your food this week? (check one)
We had enough of all the foods we wanted to eat.
We had enough food, but not always what we wanted.
We didn’t have enough to eat.
65

APPENDIX G. Fairfax FISH survey for clients without telephones.
Fairfax FISH Food Survey
(clents without telephones)
The food you are receiving today is from Fairfax FISH, a group of
churches that helps families with emergency services. To help us help
people in times of need, we are asking you to complete this survey about
the foods you received today. Your answers will help us learn what kinds
of foods our clients want and need; and how we can serve these needs
better.
The results of this study will be confidential. Researchers will not
release your individual information to anyone else.
The names of those who complete the questionnaire will be
included in a drawing for $100.00 in gift certificates donated by local
grocery stores, which will be awarded in December, 1994. Only one
participant will receive the gift certificates, but it could be you!
Thank you so much for your help.
Sincerely,
Fairfax FISH

APPENDIX G. Fairfax FISH survey for clients without telephones (continued).
INSTRUCTIONS
Please fill out the first 2 columns of question #1 (about foods
received) as soon as you can, then complete the remaining questions at
the end of the week. If you have any questions, please call Fairfax County
Human Intake Services at 222-3582, and ask for Flora of FISH to return
your call.
Please return the survey in the envelope provided when it is
complete. Thank you.
For all members of the household, please complete the following
information:
Name (first name is OK) Age Sex Special food needs (low sodium of vegetarian, for example)
JAN (example) 63 [F low-sugar
Name of person filling out survey:
Date food was delivered:
67

APPENDIX G. Fairfax FISH survey for clients without telephones (continued).
1. Mark in the following chart the types and amounts of foods brought by the FISH driver and foods you already had in the first two columns as indicated. Then, mark the foods you use during the week in the last
column.
Types of food Foods brought | Foods you Foods used by FISH already during week
| Canned fruit (no. of cans) oo 3B ep 2. + JTEXAMPLE]
Canned fruit (no. of cans)
Fruit or vegetable juice (no. of cans or quarts)
Canned vegetables (no. of cans)
Canned meat, tuna, or other fish (no. of cans)
Canned main dishes (soup, chili, spaghetti, spaghetti sauce, etc.) (no. of cans)
Peanut butter (no. of jars)
Jelly or jam (no. of jars)
Condiments (mustard, ketchup, sauces)
Canned milk (no. of cans)
Dried milk (no. of packages)
Dry macaroni and cheese or other packaged dinner mix (no. of packages)
Pasta (noodles, macaroni, spaghetti), rice, or
instant potatoes (no. of packages) _
Dried beans, peas, or lentils (no. of packages)
Dry cake, pudding, or gelatin mix (no. of packages)
Dry biscuit mix or bread mix
Cereal (no. of packages)
68
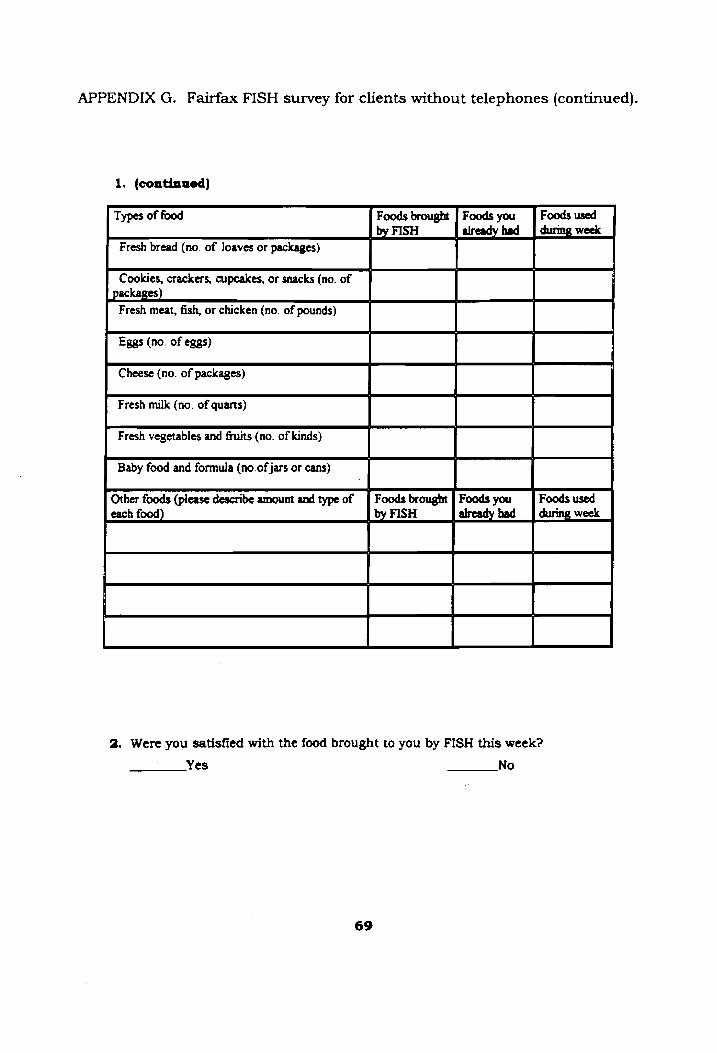
APPENDIX G. Fairfax FISH survey for clients without telephones (continued).
1. (continued)
Types of food Foods brought [| Foods you | Foods used
by FISH already had during week _
Fresh bread (no. of loaves or packages)
Cookies, crackers, cupcakes, or snacks (no. of ackages)
Fresh meat, fish, or chicken (no. of pounds)
Eggs (no. of eggs)
Cheese (no. of packages)
Fresh milk (no. of quarts)
Fresh vegetables and fruits (no. of kinds)
Baby food and formula (no.of jars or cans)
Other foods (please describe amount and type of [| Foods brought | Foods you Foods used each food) by FISH already had __ | during week
2. Were you satisfied with the food brought to you by FISH this week?
Yes No
69
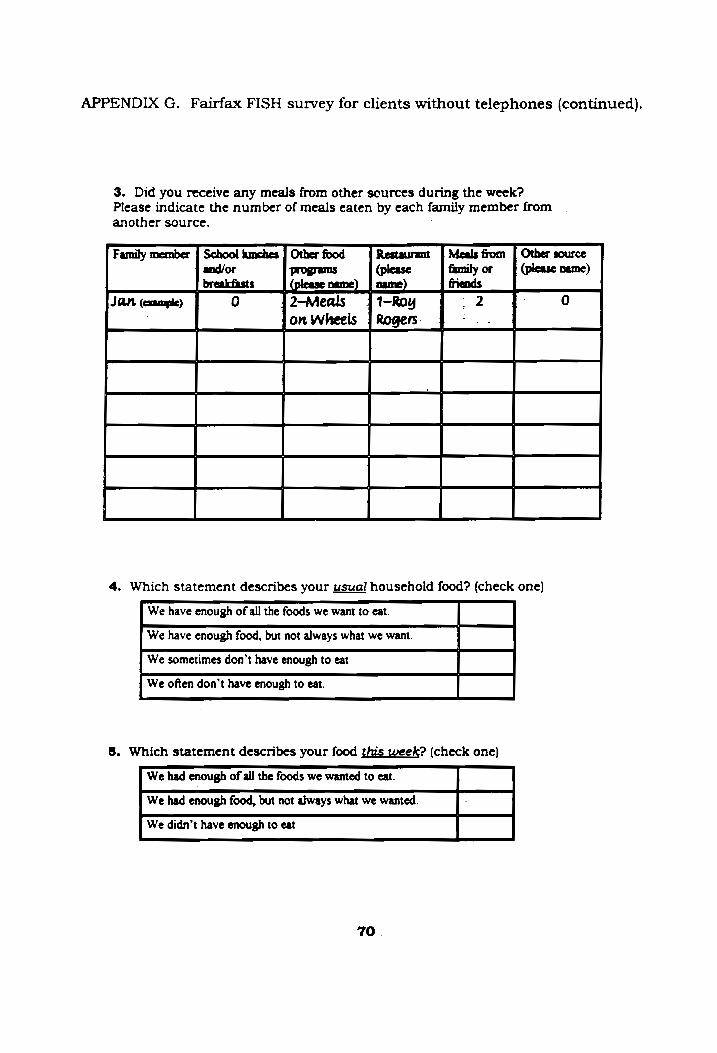
APPENDIX G. Fairfax FISH survey for clients without telephones (continued).
3. Did you receive any meals from other scurces during the week? Please indicate the number of meals eaten by each family member from another source.
Family member | School lunches | Other food Restaurant | Meals from | Other source and/or programs (please family or (please name) breakfasts lease name) | name) friends
JAN (example) 0 {2-Meals 4 1-Roy 2 0 on Wheels | Rogers.
4. Which statement describes your usual household food? (check one)
We have enough of all the foods we want to eat.
We have enough food, but not always what we want.
We sometimes don’t have enough to eat We often don’t have enough to eat.
5. Which statement describes your food this week? (check one)
We had enough of all the foods we wanted to eat.
We had enough food, but not always what we wanted.
We didn’t have enough to eat
70
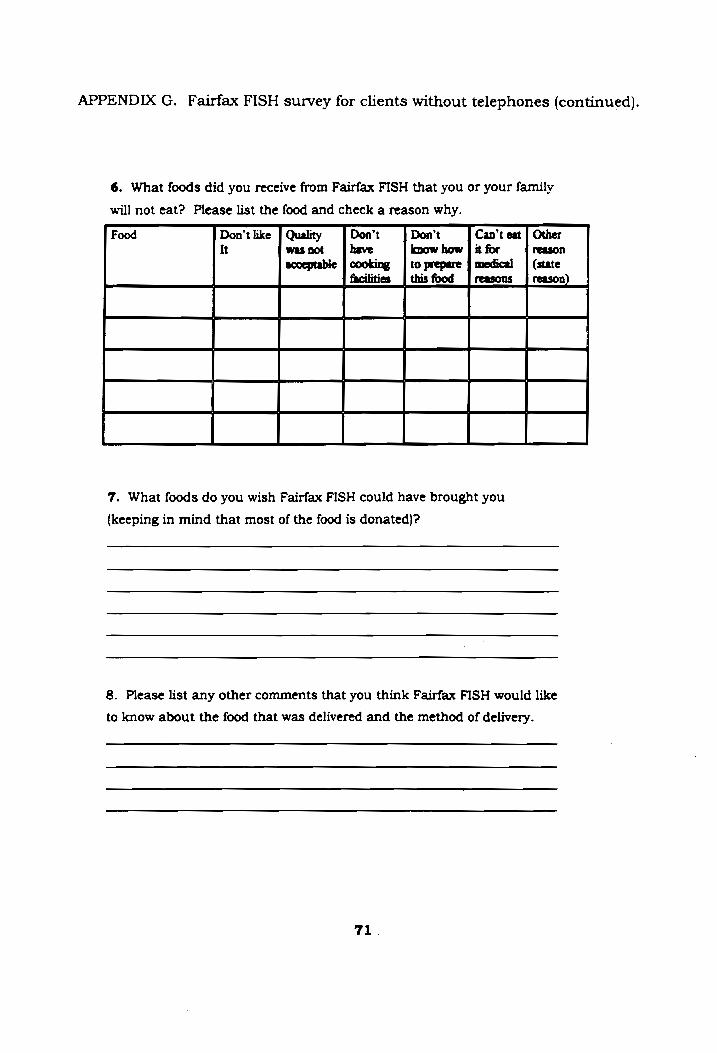
APPENDIX G. Fairfax FISH survey for clients without telephones (continued).
6. What foods did you receive from Fairfax FISH that you or your family
will not eat? Please list the food and check a reason why.
Food Don’t like | Quality Don’t Don't Can’t eat | Other
It was not have know how | it for reason
acceptable | cooking | to prepare ] medical | (state facilities [this food | reasons | reason)
7. What foods do you wish Fairfax FISH could have brought you
(keeping in mind that most of the food is donated)?
8. Please list any other comments that you think Fairfax FISH would like
to know about the food that was delivered and the method of delivery.
71
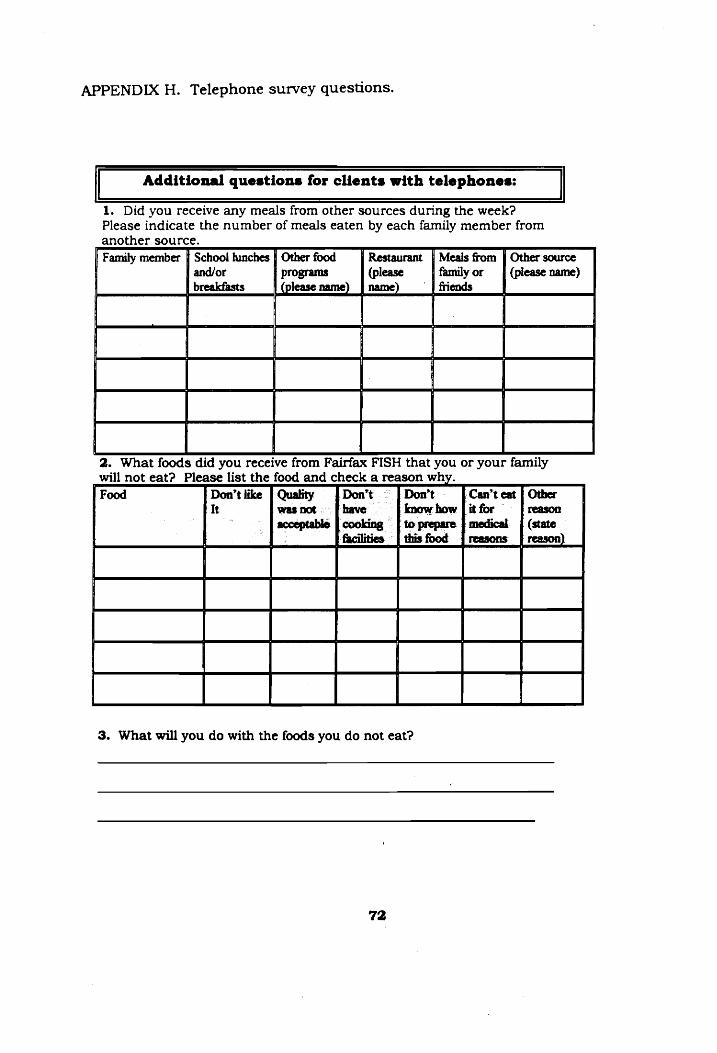
APPENDIX H. Telephone survey questions.
Additional questions for clients with telephones:
1. Did you receive any meals from other sources during the week? Please indicate the number of meals eaten by each family member from another source. Family member | School lunches Restaurant | Meals from | Other source
and/or (please family or (please name) breakfasts (please name) § name) friends
will not eat? Please list the
2. What foods did you receive from Fairfax FISH that you or your family food and check a reason why. Food Don’t like Don’t . | Don’t | Can’t eat | Other
It ‘have «| knowhow | it for _—f reason : | cooking © | to prepare | medical | (state
facilities - | this food | reasons [| reason)
3. What will you do with the foods you do not eat?
72
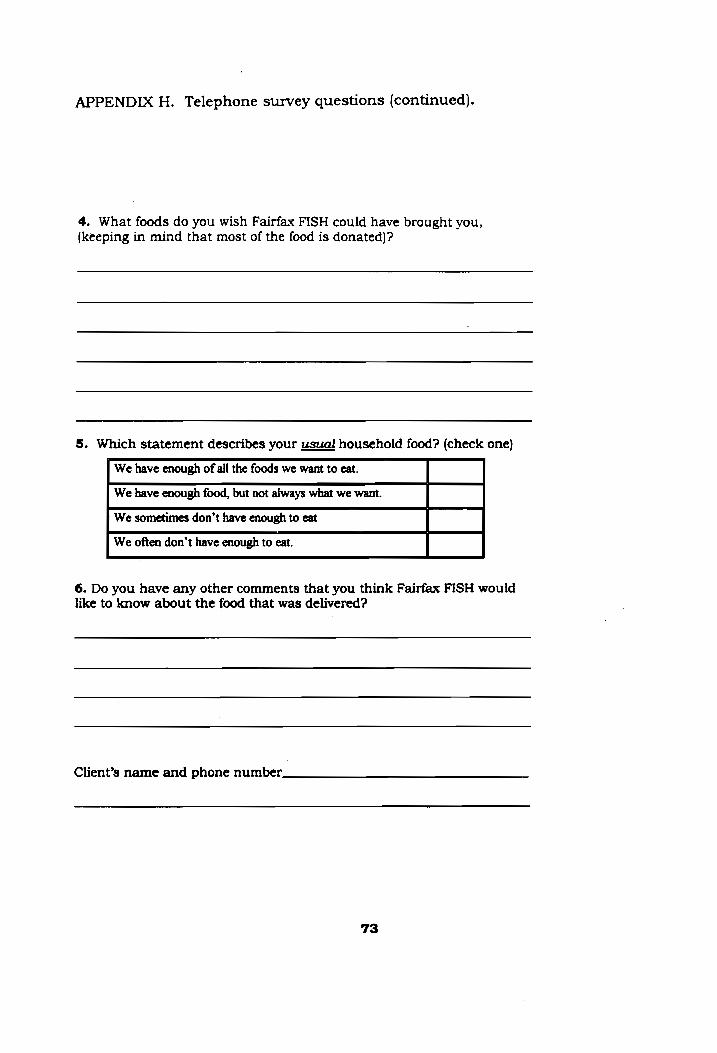
APPENDIX H. Telephone survey questions (continued).
4. What foods do you wish Fairfax FISH could have brought you, (keeping in mind that most of the food is donated)?
5. Which statement describes your usual household food? (check one)
We have enough of all the foods we want to eat.
We have enough food, but not always what we want.
We sometimes don’t have enough to eat
We often don’t have enough to eat.
6. Do you have any other comments that you think Fairfax FISH would like to know about the food that was delivered?
Client’s name and phone number
73
APPENDIX I. Driver survey.
Fairfax FISH Driver Survey
This week, we are conducting a survey of our clients who receive
food in order to learn what foods our clients want and need. We hope it
will be helpful to drivers, so they will have a stronger basis for choosing
foods for clients. Please deliver a copy of the food survey to the client
with the food you are taking. Notice that there is one survey for
clients who have telephones, and a different one for clients who do
not have telephones.
In conjunction with our survey of the food people are receiving
from FISH, it would be helpful if you would complete this short
questionnaire so we can verify what foods the clients received today.
Please mark the quantities and types of foods you have delivered to
the client and answer the remaining questions based on your judgment.
Return the questionnaire in the enclosed envelope. Thank you.
If you have any questions, please call your captain and someone
will call you back as soon as possible.
Sincerely,
Fairfax FISH
74
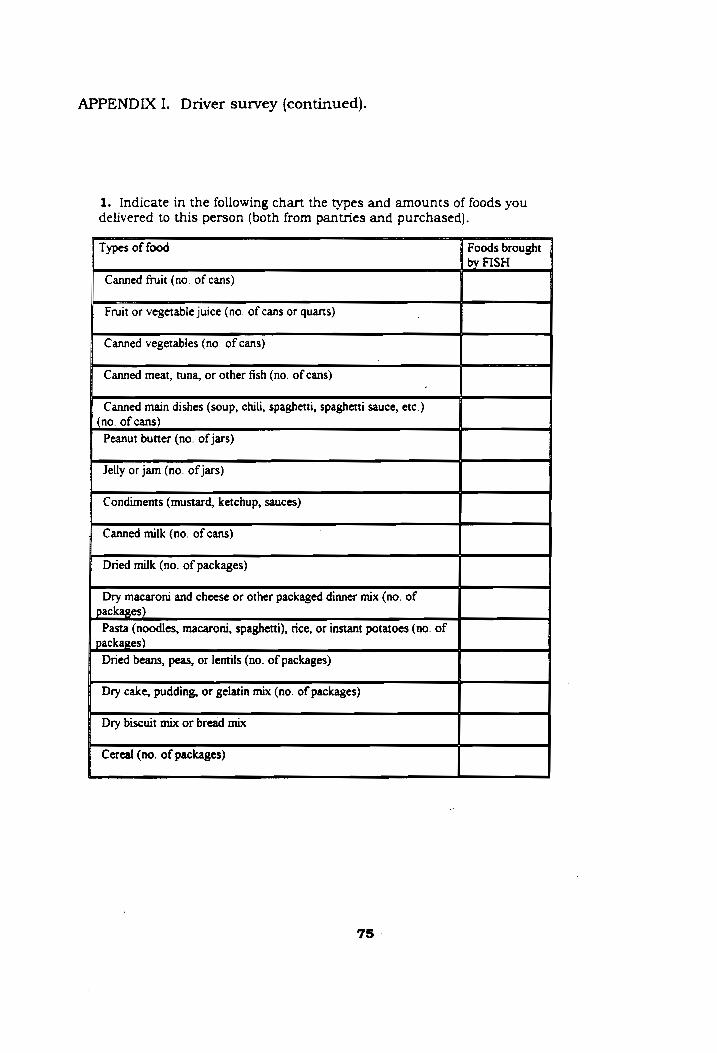
APPENDIX I. Driver survey (continued).
1. Indicate in the following chart the types and amounts of foods you
delivered to this person (both from pantries and purchased).
Types of food Foods brought by FISH
Canned fruit (no. of cans)
Fruit or vegetable juice (no. of cans or quarts)
Canned vegetables (no. of cans)
Canned meat, tuna, or other fish (no. of cans)
Canned main dishes (soup, chili, spaghetti, spaghetti sauce, etc.) (no. of cans)
Peanut butter (no. of jars)
Jelly or jam (no. of jars)
Condiments (mustard, ketchup, sauces)
Canned milk (no. of cans)
Dried milk (no. of packages)
Dry macaroni and cheese or other packaged dinner mix (no. of packages)
Pasta (noodles, macaroni, spaghetti), rice, or instant potatoes (no. of
packages)
Dried beans, peas, or lentils (no. of packages)
Dry cake, pudding, or gelatin mix (no. of packages)
Dry biscuit mix or bread mix
Cereal (no. of packages)
7S
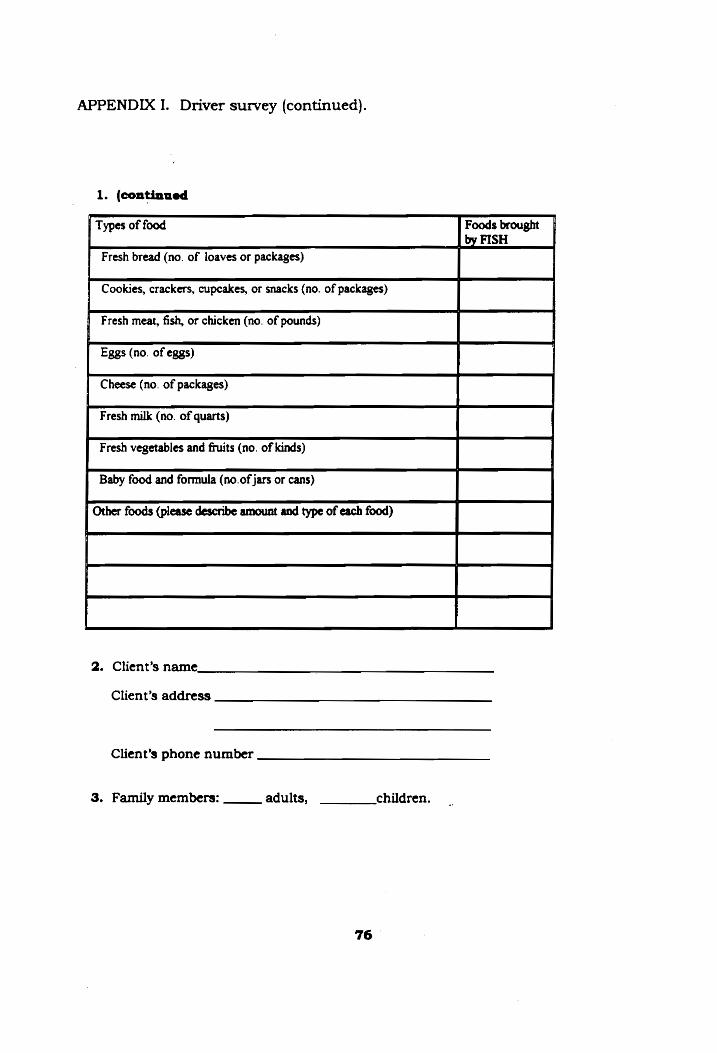
APPENDIX I. Driver survey (continued).
1. (continued
Types of food Foods brought by FISH
Fresh bread (no. of loaves or packages)
Cookies, crackers, cupcakes, or snacks (no. of packages)
Fresh meat, fish, or chicken (no. of pounds)
Eggs (no. of eggs)
Cheese (no. of packages)
Fresh milk (no. of quarts)
Fresh vegetables and fruits (no. of kinds)
Baby food and formula (no.of jars or cans)
Other foods (please describe amount and type of each food)
2. Client’s name
Client’s address
Client’s phone number
3. Family members:
76
adults, children.
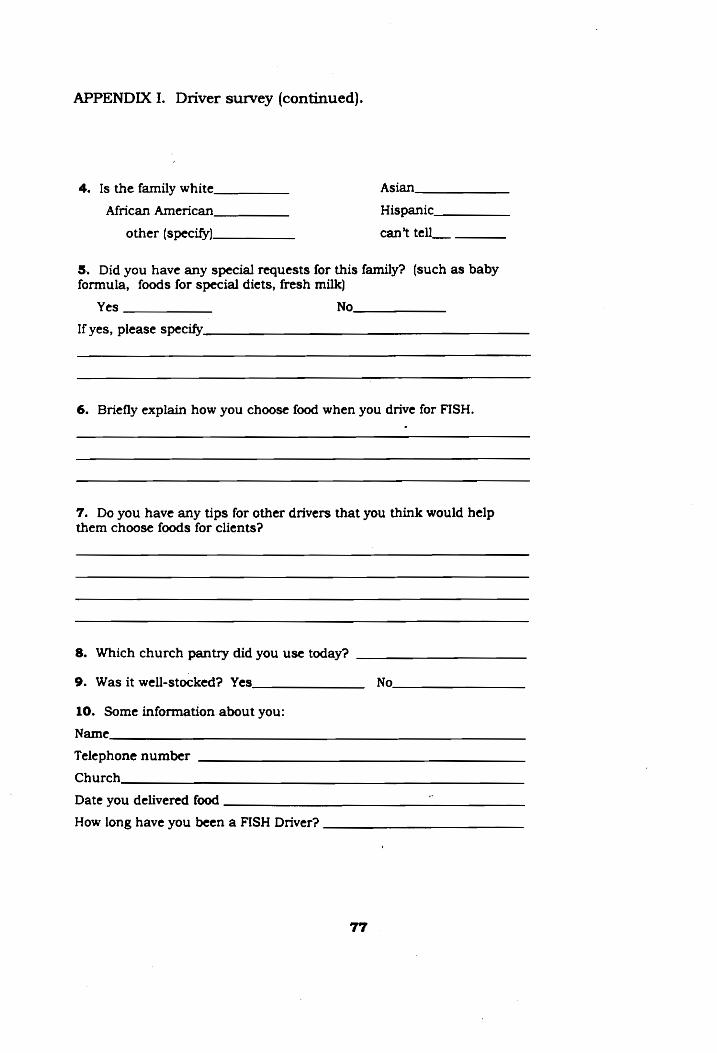
APPENDIX I. Driver survey (continued).
4. Is the family white Asian
African American Hispanic
other (specify) can't tell__
5S. Did you have any special requests for this family? (such as baby formula, foods for special diets, fresh milk)
Yes No
If yes, please specify
6. Briefly explain how you choose food when you drive for FISH.
7. Do you have any tips for other drivers that you think would help them choose foods for clients?
8. Which church pantry did you use today?
9. Was it well-stocked? Yes No
10. Some information about you:
Name
Telephone number
Church
Date you delivered food
How long have you been a FISH Driver?
77
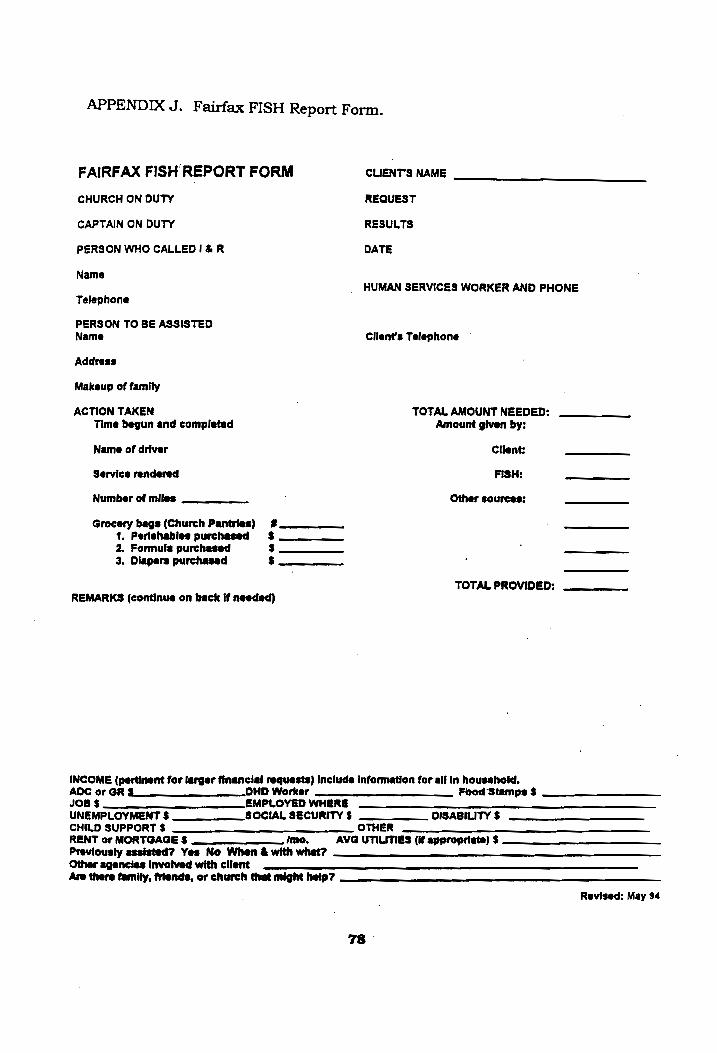
APPENDIX J. Fairfax FISH Report Form.
FAIRFAX FISH REPORT FORM CUENT'S NAME
CHURCH ON DUTY REQUEST
CAPTAIN ON DUTY RESULTS
PERSON WHO CALLEDI&R DATE
Name HUMAN SERVICES WORKER AND PHONE
Telephone
PERSON TO BE ASSISTED Name Client's Telephone
Address
Makeup of family
ACTION TAKEN . TOTAL AMOUNT NEEDED: Time begun and completed Amount given by:
Name of driver Client:
Service rendered FISH:
Number of miles Other sources:
Grocery bags (Church Pantries) #
1. Perishabies purchased §$ 2. Formula purchased $ 3. Diapers purchased $
NII
T TY |
TOTAL PROVIDED: REMARKS (continue on back if needed)
INCOME (pertinent for larger financial requests) Include information for aif in household.
ADC or GR $_ DHD Worker Food Stamps $ JOB $ EMPLOYED WHERE UNEMPLOYMENT $ SOCIAL SECURITY $ _.__.___ DISABILITY $ CHILD SUPPORT $ OTHER RENT or MORTGAGE $ fmo. AVG UTILITIES (if appropriate) $
Previously assisted? Yes No When & with what? Other agencies involved with client Are there family, friends, or church that might help?
Revised: May 94
78
VITA
Born on August 5, 1952, Flora Elliott Szatkowski grew up in Cocoa
Beach, Florida, graduating from Cocoa Beach High School in 1970. She
graduated with honors from Purdue University in 1974 with a major in Foods
in Business.
She worked as an editorial assistant at Creative Food Service in New
York City in 1974 and 1975. She became an associate editor at Better Homes
and Gardens Books in Des Moines, Iowa, where she planned, wrote, and edited
best-selling cookbooks from 1975 through 1978. In 1979, she became a
freelance food consultant and journalist, continuing to work for Better Homes
and Gardens, as well as magazines and newspapers. In 1982, Flora became
editor of publications at Campbell Soup Company, where she was responsible
for all cookbooks produced by the company, as well as certain advertising and
promotional projects.
Since 1987, she has again been a freelance worker, concentrating on the
editorial aspects of cookbooks and other publications. In addition, she has
devoted time to raising her two children and volunteering at schools and in
community projects. She has served as a telephone captain for Fairfax FISH
for four years, and coordinates the FISH volunteers at her church.
She completed a Master of Science degree in Human Nutrition and
Foods at Virginia Tech in May 1995.
Loos O,
79


![PANDIT DEENDAYAL PETROLEUM UNIVERSITY SCHOOL OF … Tech_EE _ Sem 5 and 6 IVSyllabus_ Approved BOS.pdf1 approved bos nov 2019 (ay 2019-20) [2017 batch onwards] pandit deendayal petroleum](https://img.pdfslide.us/doc/110x75/5e86b2611ecb4837a0033bbb/pandit-deendayal-petroleum-university-school-of-techee-sem-5-and-6-ivsyllabus.jpg)