Embed Size (px)
Citation preview

BACKGROUNDPAPER July 2007, Number 55
Appropriation by Litigation:Estimating the Cost of JudicialMandates for State and LocalEducation SpendingByChris Atkins,Senior Tax Counsel
including a new business tax applied to acompany’s gross receipts (called the “margins”tax) and an increase in the excise tax oncigarettes.
These changes—which will affectArkansas’s and Texas’s long-term spending, taxburden, and business tax climate—are all partof a larger, and growing, trend. Since 1977courts in 27 states have held that spending onschools is constitutionally inequitable orinadequate. These decisions often lead todramatic short-term increases in educationspending as lawmakers comply with courtmandates. In nine states lawmakers raisedtaxes by over $13 billion to meet these newspending obligations. Similar cases arecurrently pending in other states.
Commentators have written many books,articles, and research papers concerning courtinvolvement in the school finance contro-versy. But few studies have attempted acomprehensive, state-by-state measure of thelong-term fiscal impact of court education
The author received significant research assistance from law clerks Allison B. Clements andJoseph D. Henchman.
Acknowledgments: Gerald Prante, Bill Ahern, Patrick Fleenor, Curtis Dubay, Scott Hodge, EricHanushek, Joe Crosby, Dan Lips, Michael Petrelli, James Guthrie, Matthew Springer
1 See Transcript, “Republican Presidential Debate in South Carolina”, New York Times (5/15/2007), located athttp://www.nytimes.com/2007/05/15/us/politics/16repubs-text.html?pagewanted=10&_r=1.
2 91 S.W.3d 472 (2002).
3 See House Bills 1-5, 2006 Leg., Special Sess. (Tx. 2006).
I. IntroductionWhen asked how he responded to chargesthat he raised taxes as governor of Arkansas,GOP presidential candidate Mike Huckabeepartially shifted the blame to the ArkansasSupreme Court: “Do I apologize for comply-ing with a Supreme Court order to improveeducation in a state that desperately neededit? Of course I don’t, because our educationsystem did improve.”1 Huckabee was referringto his 2004 approval of an increase in severaltaxes to raise over $360 million for educationspending in order to comply with the Arkan-sas Supreme Court’s ruling in the case of LakeView v. Huckabee.2
In May 2006, Texas Governor Rick Perryresponded to a similar court order by signinga series of bills to substantially reduce localproperty taxes and replace that local revenueby pouring billions of new state dollars intopublic education.3 The bills also madesignificant changes to the Texas tax system,

2
mandates4 and none have presented a state-by-state estimate of the cost of legislation approved tocomply with court education mandates.
How much more are states spending oneducation as a result of these mandates? Havelawmakers increased taxes to comply with themandates, and if so, how much? Has compliancewith court mandates led to long-term increases inper-pupil spending? This study—the first in a newseries called Appropriation by Litigation—willanswer these questions.
II. SummaryTwenty-seven states have increased school spend-ing or raised taxes to comply with court mandates.Legislative responses to court mandates vary, butthey typically provide more funding for recurringexpenses (i.e. teacher salaries), capital expenses(i.e. facility construction or repair) or take theform of general grants that seek to equalizefunding among school districts. Since 1977,lawmakers have authorized an additional $34billion in annual spending or taxes to comply withcourt mandates, which equals an average of $976per pupil5 (see Table 1).
The short-term fiscal impact of court man-dates varies greatly among the twenty-seven states.Lawmakers in New Jersey complied with courtorders by enacting a series of spending plans thatwere expected to increase recurring and capitalfunding commitments by over $6,648 per pupil.In New York lawmakers approved a massive newschool construction project, with an approved costof $3,633 per pupil, after courts mandated thatthe legislature fix school facilities. In Iowa,lawmakers provided a small increase, amountingto $85 per pupil, to settle a case out of court. InNorth Carolina, seven years after a court mandate,lawmakers provided additional funding of only$16 per pupil.
While many states have financed court-mandated spending increases either by spendingsurplus funds or cutting spending in otherprogram areas, nine states have explicitly raisedtaxes. Table 2 contains an overview of specificstate tax increases enacted in conjunction withcourt-mandated spending increases. It shows thatlawmakers have approved nearly $13 billion in
Table 1
Legislative Responses to Court Education Mandates Total $34 Billion Annually,Average $976 Per Pupil2004 Dollars
Total Cost of Legislative Total Cost Per PupilCompliance with (Enrollment in Year
State Court Mandate of Compliance) RankNew Jersey $ 8,264,577,894 $ 6,648 1New York $ 10,567,5 91,325 $ 3,633 2Connecticut $ 1,527,583,067 $ 2,478 3New Hampshire $ 422,996,933 $ 2,066 4Massachusetts $ 1,437,993,080 $ 1,638 5Maryland $ 1,365,036,131 $ 1,575 6Kansas $ 720,183,954 $ 1,570 7New Mexico $ 426,651,609 $ 1,332 8Kentucky $ 722,647,284 $ 1,136 9Ohio $ 2,041,282,061 $ 1,109 10Washington $ 779,290,429 $ 1,004 11Wyoming $ 88,655,521 $ 931 12Montana $ 101,268,971 $ 693 13Texas $ 2,650,185,411 $ 655 14Missouri $ 470,615,917 $ 543 15Arizona $ 434,585,890 $ 512 16Tennessee $ 355,736,877 $ 451 17Arkansas $ 197,270,453 $ 436 18North Dakota $ 28,306,048 $ 280 19Colorado $ 197,456,446 $ 273 20Vermont $ 23,538,941 $ 222 21Michigan $ 375,482,209 $ 218 22California $ 989,000,000 $ 153 23Idaho $ 31,136,653 $ 122 24Alaska $ 13,152,701 $ 98 25Iowa $ 40,000,000 $ 85 26North Carolina $ 21,762,673 $ 16 27
Total: $ 34,293,988,476 Average: $ 976 a
a) Weighted averageSource: Tax Foundation calculations based on data from the National Center for EducationStatistics and the Bureau of Labor Statistics
Table 2
Nine States Raise Taxes by a Total of Nearly $13 Billion Annually to FinanceCourt-Mandated Spending
Real State Tax IncreaseState Year (2004 Dollars)
Arkansas 2004 $ 366.3 millionKentucky 1990 $ 985.7 millionMaryland 2002 $ 106.5 millionMissouri 1993 $ 405.3 millionNew Hampshire 1999 $ 423 millionNew Jersey 1976 $ 2 billionNew Jersey 1990 $ 4 billionTennessee 1992 $ 310 millionTexas 2006 $ 3.9 billiona
Vermont 1997 $ 86 millionTotal: $ 12.6 billion
a) The tax increase in Texas was offset by local property tax relief, but this tax relief wentbeyond what the state Supreme Court required.Source: National Conference of State Legislatures; National Association of State BudgetOfficers; Fiscal Notes; Official State Reports
4 A recent study by Christopher Berry did estimate the long-term impact of school finance judgments on state education spending. See “Christopher Berry,School Finance Judgments and State Fiscal Policy,” in School Money Trials, at 213 (Brookings Institution Press 2007). Unlike this study, Berry did not presenthis findings on a state-by-state basis. Berry also estimated the long-term impact of court mandates on all education spending (federal, state and local), statespending, and local spending. The present study excludes federal spending.
5 Unless otherwise indicated, throughout this study the term “per pupil spending” means real per pupil state and local spending, expressed in terms of 2004 pricelevels as reported in Consumer Price Index-Urban data.

3
annual tax increases to fund new educationspending required by the courts.
With lawmakers approving an average of$976 per pupil in court-mandated spendingincreases, one would presume that educationspending in these states would be demonstrablyhigher in years after the court ruling. Curiously,however, this is not the case.
Comparing long-term recurring and capitalspending trends in states before and after courtmandates on education shows that even a hefty,short-term increase in education spending tocomply with a court order does not alwaystranslate into permanently higher levels ofspending. This is particularly true of states wherelawmakers complied with court orders by increas-ing recurring expenditures; increases in capitalexpenditures exhibit more longevity.
In eighteen states there is enough data toanalyze the long-term fiscal impact of courtmandates on recurring spending compared to abaseline measured by spending trends before thecourt mandate (see Table 3). The results rangefrom a massive $3,084 increase above the baselinein Vermont to a decline of $4,326 below thebaseline in New Jersey. Fourteen of the eighteenstates showed recurring spending above thebaseline, with six states increasing spending morethan $1,000 per pupil above it. Four statesshowed spending below the baseline after a courtmandate.
Overall, the results were somewhat surprising:despite increasing recurring spending to complywith court mandates, these eighteen states arespending $284 less per pupil on recurring spend-ing (overall) in 2004 than we would have expectedbased on growth trends before the court man-dates.
The results for capital spending are different.Of the five states where data is available tocompare long-term capital spending trends after acourt decision, three showed spending above thepre-mandate baseline, while two states showedspending below it (see Table 4). Overall, in 2004the five states exceeded the pre-mandate capitalspending baseline by $164 per pupil.
Courts are clearly having a fiscal impact onstate budgets in the short-term, where mandatesare forcing lawmakers to immediately increasestate spending on education. In the long-term,however, the overall impact on state budgets isquestionable. Particularly in states where courtsforced lawmakers to increase recurring expendi-tures, the evidence suggests that appropriation bylitigation is not a particularly efficient means ofsecuring permanent funding increases for schools.
III. School FinanceMandates: BriefBackgroundState courts have wrestled with the issue ofeducation finance for over three decades. In thattime, plaintiffs (often parents, teachers, adminis-trators, or some combination of the three) haveattempted to convince state courts that statelawmakers have a constitutional duty to provide ahigher level of education funding. Plaintiffs havesuccessfully made these claims in twenty-sevenstates since 1977, with theories that first focusedon equitable distribution of school funding but
Table 3
Actual State and Local Recurring Spending Is $284 Per Pupil Less thanProjections Based on Growth Before Court Mandates2004 Dollars
Difference Between ActualRecurring Spending and
Projected Recurring SpendingState After Court Decision Rank
Vermont $ 3,084 1North Dakota $ 2,102 2Massachusetts $ 2,050 3Ohio $ 1,324 4Tennessee $ 1,152 5Wyoming $ 1,050 6New Hampshire $ 931 7Maryland $ 775 8Alaska $ 759 9Arizona $ 689 10Missouri $ 400 11Michigan $ 280 12Arkansas $ 99 13North Carolina $ 89 14Kentucky – $ 87 15Idaho – $ 234 16Texas – $ 1,588 17New Jersey – $ 4,326 18Weighted Average – $ 284Weighted Average without N.J. $ 72
Note: Insufficient data to analyze trends in Connecticut, Iowa, Kansas, Montana, WashingtonSource: Tax Foundation calculations based on data from Census Bureau, National Center forEducation Statistics, and Bureau of Labor Statistics
Table 4
Actual State and Local Capital Spending Is $164 Per Pupil Higher ThanProjections Based on Growth Before Court Mandates
Difference Between ActualCapital Spending and
Projected Capital SpendingState After Court Decision Rank
Ohio $ 293 1New Mexico $ 280 2California $ 202 3New Jersey – $ 29 4Colorado – $ 166 5Weighted Average $ 164
Source: Tax Foundation calculations based on data from Census Bureau, National Center forEducation Statistics, and Bureau of Labor Statistics

4
have evolved and now argue for higher spendingto achieve “adequacy” of school funding.
Court involvement in school finance had itsgenesis in the civil rights movement of the 1960s,with litigants desiring the noble goal of enhancededucational opportunity for school childrenregardless of race, wealth, or location. Twoacademic studies gave litigants the rhetoricalammunition they needed by arguing, among otherthings, that school finance systems violated dueprocess if they were based on anything other thanthe wealth of the state as a whole.6 With theacademic groundwork in place, lawsuits started toproliferate.
The first such judicial mandate requiredhigher state spending in order to boost spendingin poor school districts. In 1971 the CaliforniaSupreme Court rendered its decision in Serrano v.Priest,7 a case brought by parents of schoolchildren in low-income school districts. The courtruled that a disparity in funding between schooldistricts violated the state constitution’s guaranteeof equal protection under the law. It did so, in thecourt’s opinion, because wealthier districts hadlarger tax bases which allowed them to maintainhigher levels of per pupil spending at lower taxrates.8 After making this finding it remanded thecase to a district court for trial. Eventually, thecase made its way back to the state SupremeCourt, which ordered the state legislature toequalize education funding between rich and poordistricts.9
Serrano concerned educational equity within astate. The central issue was whether California hada constitutional duty to supplement local educa-tion spending such that school districts—nomatter how wealthy or poor—would spendroughly the same amount per pupil. Equitylawsuits dominated education finance cases fromthe 1970s through the 1980s, when they weresupplanted by a new legal theory that quicklygained prominence.
In 1989, the Kentucky Supreme Court issuedits landmark ruling in Rose v. Council for BetterEducation.10 The source of the litigation wassection 183 of the Kentucky Constitution, whichsays “The General Assembly shall, by appropriatelegislation, provide for an efficient system of
common schools throughout the State.” Indefining what “efficient” meant, the KentuckySupreme Court (in a 5-2 decision) adopted thefollowing nine factors:
1) The establishment, maintenance andfunding of common schools in Kentucky isthe sole responsibility of the GeneralAssembly.
2) Common schools shall be free to all.
3) Common schools shall be available to allKentucky children.
4) Common schools shall be substantiallyuniform throughout the state.
5) Common schools shall provide equaleducational opportunities to all Kentuckychildren, regardless of place of residence oreconomic circumstances.
6) Common schools shall be monitored by theGeneral Assembly to assure that they areoperated with no waste, no duplication, nomismanagement, and with no politicalinfluence.
7) The premise for the existence of commonschools is that all children in Kentucky havea constitutional right to an adequateeducation.
8) The General Assembly shall provide fundingwhich is sufficient to provide each child inKentucky an adequate education.
9) An adequate education is one which has asits goal the development of the sevencapacities recited previously.11
Applying those factors to the educationsystem in Kentucky, the state Supreme Courtordered the legislature to devise a completely neweducation system that provided “equitabledistribution of funds” as well as an “adequate”level of quality instruction in the schools them-selves. The Rose decision thus laid the groundworkfor plaintiffs in other states to argue that statelawmakers had a constitutional duty to bothequalize and increase education funding.
The Kentucky legislature responded bypassing the Kentucky Education Reform Act(KERA), one of the most comprehensive stateeducation reforms ever enacted. It completely
6 See, e.g. Coons, et al, Private Wealth and Public Education, Harvard University Press (1970); Arthur Wise, Rich Schools: PoorSchools—The Promise of Educational Opportunity, University of Chicago Press (1968).
7 5 Cal.3d 584 (1971) (Serrano I).
8 See Peter Schrag, Final Test: The Battle for Adequacy in America’s Schools, at 76 (The New Press 2003).
9 18 Cal.3d 728 (1976) (Serrano II).
10 790 S.W.2d 186 (Ky. 1989).
11 Id.

5
revamped the state’s education system by adding anew testing system to measure progress andproviding approximately $500 million per year (or$1,136 per pupil in 2004 dollars) in additionalstate funds financed by increases in the sales andcorporate income tax rates.12
According to research conducted by MelissaBurke, KERA achieved mixed results in reformingKentucky’s schools. She found that, while KERAdid lead to more equitable spending acrossdistricts, there is no evidence that the gaps in testscores among those districts have narrowed.13
Surprisingly, as the data in section III show,Kentucky is actually spending less in 2004 thanone would have expected based on trends in placebefore 1989—the year Rose was decided.14
Regardless of the fiscal impact of the Rose decisionin Kentucky, it certainly set the stage for otherstate courts to shift focus from equity to adequacy.
IV. Estimating the Costsof School FinanceMandates
A. OverviewCourts rarely mandate that the legislature increaseschool funding by specific amounts although afew have done exactly that (see sidebar). Moretypically, as in the Kentucky example above,courts will mandate that the legislature “fix” thesystem and instruct—or strongly hint—that moremoney is required.
Courts usually order the legislature todetermine the cost of funding an adequateeducation and then provide the necessary funding.After issuing its ruling, the court will then
12 Schrag, supra note 8 at 70-71; Carr and Fuhrman, The Politics of School Finances in the 1990s, at 156, in EQUITY AND ADEQUACY IN EDUCATION FINANCE:ISSUES AND PERSPECTIVES, National Research Council (1999)
13 See Melissa Burke, Education Reform, Redistribution, and Student Achievement: Evidence from the Kentucky Education Reform Act, manuscript (October 2003),located at http://www.princeton.edu/~maclark/kera.pdf/.
14 An alternative method of projecting per pupil spending in Kentucky, presented in the Appendix, estimates that Kentucky is actually spending $479 more in2004 due to the decision.
Table 5
States Enacted Over $34 Billion in Spending Increases to Comply with Court Rulings on Education Finance2004 Dollars
Note: States with n/a in recurring, one-time and settlement per pupil columns are not included in average calculations; see Appendix for methodology.Source: Tax Foundation calculations based on data from National Center for Education Statistics and Bureau of Labor Statistics
Funds Appropriated Per PupilFunds Appropriated in Total (Enrollment in Year of Decision)
Per Court Mandate Per Court MandateRecurring One-Time Spending per Recurring One-Time Spending per
State Spending Spending Settlement Total Spending Spending Settlement TotalAlaska $ 13,152,701 n/a n/a $ 13,152,701 $ 98 n/a n/a $ 98Arizona $ 434,585,890 n/a n/a $ 434,585,890 $ 512 n/a n/a $ 512Arkansas $ 125,018,380 $ 72,252,074 n/a $ 197,270,454 $ 274 $ 161 n/a $ 436California n/a n/a $ 989,000,000 $ 989,000,000 n/a n/a $ 153 $ 153Colorado n/a n/a $ 197,456,446 $ 197,456,446 n/a n/a $ 273 $ 273Connecticut $ 1,527,583,067 n/a n/a $ 1,527,583,067 $ 2,478 n/a n/a $ 2,478Idaho $ 7,548,280 $ 23,588,373 n/a $ 31,136,653 $ 29 $ 92 n/a $ 122Iowa n/a n/a $ 40,000,000 $ 40,000,000 n/a n/a $ 85 $ 85Kansas $ 720,183,954 n/a n/a $ 720,183,954 $ 1,570 n/a n/a $ 1,570Kentucky $ 722,647,284 n/a n/a $ 722,647,284 $ 1,136 n/a n/a $ 1,136Maryland $ 1,365,036,131 n/a n/a $ 1,365,036,131 $ 1,575 n/a n/a $ 1,575Massachusetts $ 1,437,993,080 n/a n/a $ 1,437,993,080 $ 1,638 n/a n/a $ 1,638Michigan $ 83,440,491 $ 292,041,718 n/a $ 375,482,209 $ 49 $ 170 n/a $ 218Missouri $ 470,615,917 n/a n/a $ 470,615,917 $ 543 n/a n/a $ 543Montana $ 67,899,539 $ 33,369,432 n/a $ 101,268,971 $ 465 $ 228 n/a $ 693New Hampshire $ 422,996,933 n/a n/a $ 422,996,933 $ 2,066 n/a n/a $ 2,066New Jersey $ 1,214,480,671 $ 7,050,097,223 n/a $ 8,264,577,894 $ 1,077 $ 5,571 n/a $ 6,648New Mexico n/a $ 426,651,609 n/a $ 426,651,609 n/a $ 1,332 n/a $ 1,332New York n/a $ 10,567,591,325 n/a $ 10,567,591,325 n/a $ 3,633 n/a $ 3,633North Carolina $ 21,762,673 n/a n/a $ 21,762,673 $ 16 n/a n/a $ 16North Dakota n/a n/a $ 28,306,048 $ 28,306,048 n/a n/a $ 280 $ 280Ohio $ 746,640,316 $ 1,294,641,745 n/a $ 2,041,282,061 $ 408 $ 701 n/a $ 1,109Tennessee $ 355,736,877 n/a n/a $ 355,736,877 $ 451 n/a n/a $ 451Texas $ 2,650,185,411 n/a n/a $ 2,650,185,411 $ 655 n/a n/a $ 655Vermont $ 23,538,941 n/a n/a $ 23,538,941 $ 222 n/a n/a $ 222Washington $ 779,290,429 n/a n/a $ 779,290,429 $ 1,004 n/a n/a $ 1,004Wyoming $ 88,655,521 n/a n/a $ 88,655,521 $ 931 n/a n/a $ 931Total $ 13,278,992,484 $ 19,760,233,499 $ 1,254,762,494 $ 34,293,988,476 n/a n/a n/a n/aWeighted Average n/a n/a n/a n/a $ 550 $ 2,216 $ 162 $ 976

6
legislatures comply and ordering lawmakers backto the drawing board when they do not.
Accordingly, we cannot measure the fiscalimpact of school finance litigation merely bylooking at court opinions. Rather, we have to lookto the legislative response and the long-termimpact on per-pupil spending. Since courts oftenclosely monitor the legislative proceedings toensure compliance, it is reasonable to measurecourt impact on education funding by estimatinghow much lawmakers increased spending tocomply and how much per-pupil spendingincreased after the decision.
B. What Lawmakers Authorized in theShort Term
How much increased spending did lawmakersauthorize to comply with court mandates? Table 5presents the findings based on estimates of theprojected cost of court compliance legislationwhen it was enacted.
Table 6
Nine States Raised Taxes by $13 Billion to Fully or Partially Finance Court-Mandated Spending
RealRevenue
Real Per PupilNominal Revenue (EnrollmentRevenue Raised in Year of
State Year Tax Increasesa Raised (2004 Dollars) Enactment)Arkansas 2004 -Increased sales tax rate (5.125 to 6 percent)
-Increased corporate franchise tax rate (.27 to .3 percent)-Increased wholesale vending tax rate (4.5 to 6 percent) $ 366.3 million $ 366.3 million $ 818
Kentucky 1990 -Increased sales tax rate (5 to 6 percent)-increased corporate income tax rates $ 682 million $ 985.7 million $ 1,549
Maryland 2002 -Increased cigarette tax rate (from 66 cents to $1 per pack) $ 101.4 million $ 106.5 million $ 123Missouri 1993 -Increased corporate income tax rate (from 5 to 6.25 percent)
-Limited federal tax deduction for wealthy taxpayers $ 310 million $ 405.3 million $ 468New Hampshire 1999 -Imposed new statewide property tax
-Increased business profits tax (from 7 to 8 percent)-Increased business enterprise tax (from .25 to .50 percent)-Imposed new 8 percent tax on car rentals-Increased the real estate transfer tax (from .50 to .75 cents per $100)-Permanently adopted the 5.5 percent tax on communications-Permanently adopted the 8 percent tax on meals and rooms $ 365 million $ 423 million $ 2,066
New Jersey 1976 -Imposed personal income tax ~$ 600 million ~$ 2 billion $ 1,3961990b -Income and sales tax increases associated with passage of
New Jersey’s Quality Education Act $ 2.8 billion $ 4 billion $ 3,714Tennessee 1992 -Increased sales tax rate from 5.5 to 6.0 percent ~$ 230 million ~$ 310 million $ 362Texas 2006c -Imposed new gross receipts tax at rates of 1 percent or 0.5 percent,
depending on business structure-Phased out old franchise tax-Increased cigarette excise tax from 41 cents to $1.41 per pack-Expanded sales tax on motor vehicles ~$ 4.1 billion ~$ 3.9 billion $ 881
Vermont 1997 -Raised taxes on rooms and meals, gasoline, corporationsand telecommunications ~$ 73 million ~$ 86 million $ 811
Total $ 12.6 billionWeighted Average $ 1,155
a) Unless indicated, these measures only increased state-level taxes.b) This tax increase was later scaled back after significant public opposition.c) The Texas state tax increases were more than offset by expected local property tax relief provided by the state, but not all the local tax relief was mandated bythe state’s Supreme Court.Source: National Conference of State Legislatures; National Association of State Budget Officers; Fiscal Notes; Official State Reports
Select Courts Have Mandated SpecificEducation Funding Levels
While most courts refrain from mandating specific funding levels ineducation finance rulings, courts in a few states have done so. Forexample:
In Arizona, a lower court judge ordered the state to restore $90million in funding to the budget. This ruling (known as Roosevelt II)was later reversed on appeal.
In the case of Montoy v. State, the Kansas Supreme Court orderedthe state to increase education spending by at least $285 million.
After the New York legislature failed to comply with the state Su-preme Court’s ruling in Campaign for Fiscal Equity v. State, specialmasters appointed by the court found that the state needed to spendover $14 billion on school facilities in order to meet its constitu-tional mandate (lawmakers later provided approximately $10.6 billion,less than the court demanded).
sometimes act as referee over the subsequentlegislative proceedings, giving its approval when

7
Table 5 segments the data into three catego-ries: recurring increases, one-time increases, andincreases used to settle a case out of court.Recurring increases are funds spent solely foroperation expenses i.e. salaries, etc. One-timeincreases are funds spent for recurring or capitalexpenses, but solely on a one-time basis. Settle-ment increases also include recurring or capitalincreases, but were separated out since they areincreases that are meant to stop a court fromissuing a mandate. These three estimates are thenconverted into per pupil numbers and aggregatedinto one total estimate.
The total amount spent by states to complywith court mandates exceeds $34 billion. The topfive states in total real dollar amounts are NewYork ($10.6 billion), New Jersey ($8.3 billion),Texas ($2.7 billion), Ohio ($2.0 billion), andConnecticut ($1.5 billion). Adjusting for enroll-ment (using data from the year of the courtmandate), the biggest increases were enacted inNew Jersey ($6,648 per pupil), New York($3,633), Connecticut ($2,478), New Hampshire($2,066), and Massachusetts ($1,638).
The New York increase ($10.6 billion total or$3,633 per pupil) is the total price tag of a capitalschool construction program that the New YorkGeneral Assembly approved in its 2006 session tocomply with the New York Court of Appealsmandate in Campaign for Fiscal Equity v. State.15
The New Jersey increases represent an assortmentof funding adjustments approved by New Jerseylawmakers in response to the Abbott mandateswhich began in 1990 and continued thereafter.The Appendix contains details about the courtcompliance legislation passed in each state.
Amounts approved by lawmakers to complywith court mandates for recurring educationalexpenses account for more than one-third ($13.2billion) of the $34 billion total. Connecticut is thestate that was forced to authorize the mostrecurring spending on a per-pupil basis ($2,478).This figure represents the total cost in 2006 of theEducation Cost Sharing (ECS) program thatprovides a base level of funding in all localities.The ECS system was enacted to comply with theConnecticut Supreme Court’s decision in Hortonv. Meskill.16
Despite this massive investment of statedollars to assuage the Connecticut Supreme
Court, Connecticut finds itself entangled in newlitigation over school finance issues.17 Thisundoubtedly prompted Governor Jodi Rell toundercut the lawsuit by proposing an additional$3.4 billion in new spending over five yearsfinanced by an increase in the rates of tax onincome and cigarettes.18
This trend—compliance with court mandatesfollowed by more lawsuits and mandates—istypical in most states under court order toimprove school finance systems. Indeed, of thetwenty-seven states where courts have mandated
Table 7
Recurring Spending Per Pupil, Adjusted for Inflation, Grew Faster in 14States, Slower in 4 States After Court Mandate1977 – 2004
Growth Rate Growth RateBefore After
Decision/ Decision/Settlement Settlement Change
Decision/ (1977 to (Year of in PercentageSettlement the Year of Decision Growth Increase in
State Year Decision) to 2004) Rate Growth Rate RankAlaska 1999 – 0.05% 1.50% 1.55% n/a n/aArizona 1998 0.66% 2.74% 2.09% 317% 2Arkansas 2001 3.08% 3.59% 0.51% 16% 12California 2000 n/a n/a n/a n/a n/aColorado 2000 n/a n/a n/a n/a n/aConnecticut 1977 n/a n/a n/a n/a n/aIdaho 1998 2.47% 1.83% – 0.65% – 26% 15Iowa 2004 n/a n/a n/a n/a n/aKansas 2005 n/a n/a n/a n/a n/aKentucky 1989 2.55% 2.45% – 0.09% – 4% 14Maryland 1996 1.33% 2.51% 1.18% 89% 7Massachusetts 1993 1.01% 3.12% 2.11% 210% 4Michigan 1997 1.69% 2.13% 0.44% 26% 11Missouri 1994 2.05% 2.61% 0.56% 27% 10Montana 2005 n/a n/a n/a n/a n/aNew Hampshire 1997 2.77% 4.35% 1.58% 57% 9New Jersey 1990 4.05% 1.90% – 2.16% – 53% 17New Mexico 1999 n/a n/a n/a n/a n/aNew York 1995 n/a n/a n/a n/a n/aNorth Carolina 1997 2.14% 2.33% 0.19% 9% 13North Dakota 1994 0.82% 3.94% 3.12% 381% 1Ohio 1997 1.90% 4.20% 2.30% 121% 5Tennessee 1993 1.88% 3.68% 1.80% 95% 6Texas 1989 3.32% 1.90% – 1.42% – 43% 16Vermont 1997 2.27% 7.05% 4.78% 211% 3Washington 1977 n/a n/a n/a n/a n/aWyoming 1995 2.16% 3.46% 1.30% 60% 8
Notes: New Jersey, Tennessee, and Texas have had multiple decisions. These growthestimates are based only on the first decisions (1990, 1993, and 1989, respectively). NewHampshire has also had multiple decisions. The New Hampshire estimate here is based on thefirst decision to hold the state’s school financing system unconstitutional (1997). North Dakotahas had one decision and one case that led to a settlement. Table 4 uses the earlier N.D.decision (1994) as the baseline for analysis, since legislative reports show that lawmakersresponded to it as if it were a mandate. Some states were excluded due to paucity of data orbecause the court mandate involved capital spending.Source: Tax Foundation calculations based on data from Census Bureau, National Center forEducation Statistics, and Bureau of Labor Statistics
15 86 N.Y.2d 307, 631 N.Y.S.2d 565 (1995).
16 172 Conn. 615, 376 A.2d 359 (Conn. 1977).
17 A group of plaintiffs has filed another suit against the state of Connecticut, titled Connecticut Coalition for Justice in Education Funding, Inc. (CCJEF) v. Rell,which alleges that the state has failed to provide sufficient resources to ensure quality educational outcomes. See Molly Hunter, Connecticut Plaintiffs File SchoolFunding Lawsuit, National Access Network (November 29, 2005), located at http://www.schoolfunding.info/news/litigation/11-29-05ctcomplt.php3.

8
more state money for schools, sixteen are stillpresently embroiled in litigation.
Legislation passed pursuant to court order toimprove capital facilities or otherwise make one-time investments accounts for almost two-thirds($19.8 billion) of the total. New York ($10.6billion) and New Jersey ($7.1 billion) account formost of this amount.
Four states settled cases out of court, addingalmost $1.3 billion to total education costs. Thelargest settlement was in California, where thestate agreed to a one-time allocation of $989million to settle the case of Williams v. State.19 Thecostliest settlements were in North Dakota ($280per pupil) and Colorado ($273 per pupil).
Whether financing additional recurringdollars or one-time investments in capital con-struction, lawmakers in twenty-seven states haveapproved, on average, the annual equivalent of an
additional $976 per pupil (in 2004 dollars) tocomply with court mandates on school financing.
C. State Tax Increases Enacted to FundCourt Compliance
Lawmakers in some states, of course, had to raisetaxes to fully or partially finance court-mandatedspending. Some tax increases were designed toraise state funds to equalize spending betweendistricts, others were raised to increase overallspending, and others were increased to offset localproperty taxes. States that did not raise taxes hadto cut spending in other areas or use reserve funds.
Our analysis indicates that nine states haveraised a variety of state taxes to comply with courtorders (see Table 6). These tax increases shiftedjust under $13 billion from taxpayers to stategovernment, enough revenue to add $1,155dollars per pupil in education spending in thesestates.
D. What Happened to Long-TermSpending?
While it is useful to catalogue the estimated costsof court-mandated school finance legislation aslawmakers approved it, it is not the only properway to calculate the impact courts are having oneducation funding. It is also important to seewhether this legislation (and the court rulings thatspawned it) has had a lasting impact on schoolfunding. In other words, did funding continue ata higher level after the court mandates or did iteventually fall to pre-litigation levels?
To answer this question this section analyzesper pupil spending before and after the courtmandates in the states for which sufficient data isavailable. The analysis separates per pupil fundinginto amounts spent for recurring (operational) andcapital (facilities) due to the fact that some courtmandates dealt with overall spending levels whileothers dealt with school facilities. Tables 7-9present the results of this methodology (which isexplained in more detail in the Appendix) forrecurring and capital funds, respectively.
Table 7 compares average annual growth ratesin recurring per pupil spending in states beforeand after litigation. The data shows that fourteenstates had higher growth in per pupil spendingafter a court mandate than before, with six ofthese states seeing per pupil spending growth ratesdouble after litigation. Only four states had lessgrowth after litigation than before, and only one
18 See Christopher Keating, Legislators Find Some Snags in Education Proposal, Hartford Courant (March 26, 2007).
19 Case No. 312236, (Superior Court of San Francisco County, May 2000).
Table 8
In Most States, Recurring Spending Per Pupil Lower in 2004 Than It WouldHave Been If Pre-Litigation Growth Trend Had Continued
ProjectedActual Recurring
Decision/ Recurring SpendingSettlement Spending If No Total Percentage
State Year Per Pupil Litigation Difference Rank Differencea
Alaska 1999 $ 10,271 $ 9,513 $ 759 9 8.00%Arizona 1998 $ 5,954 $ 5,265 $ 689 10 13.10%Arkansas 2001 $ 6,820 $ 6,720 $ 99 13 1.50%California 2000 n/a n/a n/a n/a n/aColorado 2000 n/a n/a n/a n/a n/aConnecticut 1977 n/a n/a n/a n/a n/aIdaho 1998 $ 6,046 $ 6,279 – $ 234 16 – 3.70%Iowa 2004 n/a n/a n/a n/a n/aKansas 2005 n/a n/a n/a n/a n/aKentucky 1989 $ 6,291 $ 6,378 – $ 87 15 – 1.40%Maryland 1996 $ 8,757 $ 7,982 $ 775 8 9.70%Massachusetts 1993 $ 10,064 $ 8,013 $ 2,050 3 25.60%Michigan 1997 $ 9,416 $ 9,136 $ 280 12 – 0.60%Missouri 1994 $ 7,520 $ 7,121 $ 400 11 5.60%Montana 2005 n/a n/a n/a n/a n/aNew Hampshire 1997 $ 9,148 $ 8,217 $ 931 7 11.30%New Jersey 1990 $ 12,706 $ 17,031 – $ 4,326 18 – 25.40%New Mexico 1999 n/a n/a n/a n/a n/aNew York 1995 n/a n/a n/a n/a n/aNorth Carolina 1997 $ 6,748 $ 6,659 $ 89 14 1.30%North Dakota 1994 $ 7,993 $ 5,891 $ 2,102 2 35.70%Ohio 1997 $ 9,158 $ 7,834 $ 1,324 4 16.90%Tennessee 1993 $ 6,583 $ 5,431 $ 1,152 5 21.20%Texas 1989 $ 6,905 $ 8,492 – $ 1,588 17 – 18.70%Vermont 1997 $ 11,270 $ 8,186 $ 3,084 1 37.70%Washington 1977 n/a n/a n/a n/a n/aWyoming 1995 $ 9,732 $ 8,682 $ 1,050 6 12.10%Weighted Average $ 8,116 $ 8,400 – $ 284 – 3.30%Weighted Average $ 7,713 $ 7,641 $ 72 1.00%without N.J.
a) Calculated by using the formula (X-Y)/Y, where X = 2004 recurring per pupil spending andY = 2004 projected recurring per pupil spending using straight-line methodNotes: See notes for Table 7.Source: Tax Foundation calculations based on data from Census Bureau, National Center forEducation Statistics, and Bureau of Labor Statistics

9
state (New Jersey) saw growth drop by more thanhalf.
The states with the biggest jump in recurringper pupil spending growth after litigation areAlaska (negative to positive), followed by NorthDakota (381 percent increase), California (333percent), Arizona (317 percent) and Vermont(211 percent). Four states did experience decreasesin their growth rate after litigation, including NewJersey (53 percent drop in growth), Texas (43percent drop), Idaho (26 percent drop) andKentucky (4 percent drop).
Table 8 projects 2004 recurring per pupilspending in eighteen states based on the trend inpre-litigation growth presented in Table 7. Theprojections were generated using a simple,straight-line growth projection. In the Appendixwe present an alternative calculation based on perpupil spending growth trends in other states.
As Table 8 reveals, 14 of the 18 states hadhigher actual recurring per pupil spending in2004 than we would have expected based ontrends prior to school finance court mandates. Sixstates (Vermont, North Dakota, Massachusetts,Ohio, Tennessee and Wyoming) each had differ-ences of at least $1,000 between actual recurringspending per pupil in 2004 and projected spend-ing. Eight states have spending differences thatexceed 10 percent of projected spending. Onlyfour states had actual spending less than projectedspending. Two of those states, Idaho and Ken-tucky, showed small differences, less than 4percent, and two had larger negative differences.
The overall results depend largely on whetherNew Jersey is included in the data set. With NewJersey included, average recurring per pupilspending in these eighteen states is $284 less thanthe baseline. This represents a percentage decreaseof 3.3 percent below projections. Since New Jerseyis the clear outlier in Table 8 (for reasons whichare explored later) it is useful to look at the
Figure 1
Vermont Per Pupil Spending Sharply Higher After Ruling in Brigham v.State of Vermont
Source: Tax Foundation calculations based on data from Census Bureau, National Center forEducation Statistics, and Bureau of Labor Statistics
$0
$2,000
$4,000
$6,000
$8,000
$10,000
$12,000
Projected Per Pupil Spending Based on Prelitigation Trends
Actual Per Pupil Spending
2004200119981995199219891986198319801977
numbers with that state excluded. Without NewJersey, average recurring per pupil spending inthese 20 states is $72 higher than projections, anoverall difference of over $350 per pupil.
Courts in some states mandated that lawmak-ers improve school facilities. Some of these courtmandates have occurred too recently to perform acomprehensive analysis of post-mandate growth,but Table 9 presents the impact these rulings hadon per pupil capital spending in five states. Onceagain, we use pre-litigation growth to create abaseline to which actual spending is compared.
Table 9
Court Mandates Increased Capital Spending by $164 Per Pupil in Five States
Real Growth Real Growth Differencein Capital in Capital in Growth ProjectedSpending Spending Rate Before 2004 2004
Decision/ Per Pupil Per Pupil and After Capital CapitalSettlement Before After Decision or Spending Spending Percentage
State Year Litigation Litigation Settlement Per Pupil Per Pupil Difference DifferenceCalifornia 2000 4.42% 8.47% 4.05% $ 1,433 $ 1,231 $ 202 16.4%Colorado 2000 2.21% – 1.24% – 3.45% $ 1,128 $ 1,294 – $ 166 – 12.8%New Jersey 1998 7.26% 6.89% – 0.37% $ 1,416 $ 1,445 – $ 29 – 2.0%New Mexico 1999 3.00% 7.70% 4.70% $ 1,401 $ 1,121 $ 280 25.0%Ohio 1997 3.89% 8.22% 4.33% $ 1,180 $ 887 $ 293 33.0%Weighted Averages $ 1,366 $ 1,202 $ 164 13.6%
Source: Tax Foundation calculations based on data from Census Bureau, National Center for Education Statistics, and Bureau of Labor Statistics

10
but declined in two (Colorado and New Jersey).In New Mexico, where a trial court in 1999ordered the state to create a new capital fundingsystem in the case of Zuni School District v. State,20
lawmakers responded by increasing capitalfunding by $400 million. By 2004 this translatedinto an increase of $280 in real capital per pupilspending.
In Ohio the state Supreme Court ordered thestate to revise its funding system in the 1997 caseof DeRolph v. State.21 Later that year lawmakersapproved S.102 which injected at least $1 billionin new capital spending into the state budget,with promises to inject as much as $10 billionmore.22 As a result Ohio spending on capitalfacilities spiked and in 2004 reached levels thatwere at least $293 higher per pupil than weotherwise would have expected.
The New Jersey Supreme Court mandated achange in facilities funding in Abbott V.23 Inresponse New Jersey lawmakers approved theEducation Facilities Construction and FinancingAct,24 which promised $6 billion in capitalspending for the plaintiffs in the case (certainschool districts) and $2.6 billion for non-plaintiffschool districts. Curiously, however, New Jersey’sper pupil capital spending was higher before 1998(the year Abbott V was decided) than after. Thisanomaly is discussed more below.
The overall impact of court mandates appearsgreater when the mandate requires increases incapital as opposed to recurring spending. Not onlyis the total difference ($164 per pupil) betweenactual spending and the projected baseline greaterthan the total difference in the recurring states inTable 8, but since capital per pupil spending istypically less than recurring per pupil spending,the magnitude of the difference is larger as well.The gap (13.6 percent) between overall actualcapital spending in 2004 and the projectedbaseline is much larger than either gap calculatedin Table 8 (-3.3 percent with New Jersey included,1.0 percent with New Jersey excluded).
E. A Look at State-Specific Trends inPer-Pupil Spending
Several states, including Vermont and NorthDakota, had large positive differences betweenactual per pupil spending and the projected
Figure 2
North Dakota Per Pupil Spending Rises Sharply After Decision in BismarckPublic School District #1 v. State
$0
$2,000
$4,000
$6,000
$8,000
Projected Per Pupil Spending Based on Prelitigation Trends
Actual Per Pupil Spending
2004200119981995199219891986198319801977
Source: Tax Foundation calculations based on data from Census Bureau, National Center forEducation Statistics, and Bureau of Labor Statistics
Figure 3
Kentucky Per Pupil Spending Flat After Decision in Rose v. Council forBetter Education
Source: Tax Foundation calculations based on data from Census Bureau, National Center forEducation Statistics, and Bureau of Labor Statistics
$0
$2,000
$4,000
$6,000
$8,000
Projected Per Pupil Spending Based on Prelitigation Trends
Actual Per Pupil Spending
2004200119981995199219891986198319801977
Real capital spending growth per pupilincreased following court mandates in three of thefive states (California, New Mexico, and Ohio)
20 CV-98-14-II (Dist. Ct., McKinley County Oct. 14, 1999).
21 78 Ohio St.3d 193, 677 N.E.2d 733 (1997).
22 See David Sciarra, Koren Bell and Susan Kenyon, Safe and Adequate: Using Litigation to Address Inadequate K-12 School Facilities, 1, 13 (July 2006), located athttp://www.edlawcenter.org/ELCPublic/Publications/PDF/Safe_and_Adequate.pdf.
23 Abbott v. Burke, 153 N.J. 480, 710 A.2d 450 (1998).
24 S. 200, 209th Leg. (N.J. 1998).

11
baseline after a court mandate. Others, likeKentucky, had slightly negative differences despitehefty spending increases to comply with a courtmandate. New Jersey is in a class by itself, approv-ing the highest amount of per pupil spending tocomply with court mandates but seeing a large,negative difference between actual spending andthe projected baseline. This section will examinethese states more closely and then explore thereasons why some states had per pupil spendinglower than the baseline projections.
Figures 1 and 2 are graphic illustrations of therecurring per pupil spending trends in Vermontand North Dakota from 1977 to 2004. Theyshow dramatic differences in recurring per pupilspending before and after court mandates.
In Vermont (see Figure 1), recurring per pupilspending grew by an average annual rate of 2.27percent from 1977 until 1997, the year theVermont Supreme Court declared the state schoolfinancing scheme unconstitutional in the case ofBrigham v. State of Vermont.25 That year, thelegislature approved a package that would increaseeducation spending by $20 million per year (theequivalent of over $1,000 per pupil in 2004) andraise taxes by approximately $73 million.26 From1997 until 2004, per pupil spending grew muchfaster—7.05 percent—than during the previous20 years. In 2004, this translated into a differenceof $3,084 per pupil between actual recurringspending and the projected baseline.
North Dakota is a good example of theimpact a court ruling can have on educationspending even in the absence of an immediatelegislative response (see Chart 2). In 1994, theNorth Dakota Supreme Court ruled, in BismarckPublic School District #1 v. State,27 that the state’sschool finance system violated the state constitu-tion. However, at the time North Dakota requiredthe vote of 4 out of 5 justices to hold a statuteunconstitutional, and only 3 signed on to themajority opinion.28
Thus, there was no immediate pressure forlawmakers to increase education spending or raisetaxes to pay for such spending. Nevertheless,North Dakota lawmakers made a conscious effortto increase education spending above the levelsthat existed prior to the Bismarck decision.29
As a result of the legislature’s actions recurringper pupil spending growth in North Dakota afterthe Bismarck decision was sharply higher from1994 to 2004 (3.94 percent) than from 1977 to1994 (.82 percent). In 2004, this translated into adifference of $2,102 per pupil between actual andprojected spending.
In 2003, a new lawsuit against the state wasfiled but settled out of court after North Dakotalawmakers agreed to increase education spendingby $30 million per year starting in 2006.30
Figure 4
New Jersey Per Pupil Spending Lower After Decision in Abbott II (1990)
Source: Tax Foundation calculations based on data from Census Bureau, National Center forEducation Statistics, and Bureau of Labor Statistics
$0
$2,000
$4,000
$6,000
$8,000
$10,000
$12,000
$14,000
$16,000
$18,000
Projected Per Pupil Spending Based on Prelitigation Trends
Actual Per Pupil Spending
2004200119981995199219891986198319801977
25 166 Vt. 246, 692 A.2d 384 (1997).
26 Act 60, 16 V.S.A. §§ 4000 et seq. (2001).
27 511 N.W.2d 247 (N.D. 1994).
28 N.D. Const. art. 6, § 4.
29 See North Dakota 2007 Legislative Council Report at 174, located at http://www.legis.nd.gov/assembly/59-2005/interim-info/final-reports/edfinal.pdf. (“Eachsession since the (Bismarck) decision, the Legislative Assembly has increased funding for elementary and secondary education and changed the manner in whichthat funding was to be distributed.”).

12
A few states do show flat or even lowerrecurring per pupil spending growth after courtmandates. In each case this is due to one or moreof the following factors: a response that increasedspending by a relatively small amount; a responsethat came many years after the court mandate; aresponse that represented a one-time increase inrecurring spending; swings in enrollment in thelate 1970s and early 1980s that distort recurringper pupil spending growth before the courtdecisions, or; gradual, long-term erosion in theinitial investment required by the court man-date.31
North Carolina (difference of $89 per pupil)is one of the states that complied with a courtruling by approving a relatively small increase inspending. After the North Carolina SupremeCourt ruled, in Leandro v. State,32 that the currentfunding scheme violated the state constitution, thelegislature responded in 2004 by approving amodest $22.5 million ($16 per pupil) increase fora pilot program to remedy the alleged constitu-tional defect.33 This increase came seven years afterthe Leandro decision.
Idaho (difference of –$234 per pupil) is oneof the states that passed a relatively small, largelyone-time court compliance package. The responseby Idaho lawmakers to the ISSEO mandate was anincrease of only $122 per pupil overall (which wasmostly an investment in facilities) and was notenacted until 2006—eight years after the decision.
The two biggest surprises in the data areKentucky and New Jersey. In Kentucky, home ofthe landmark Rose ruling, spending appears
Figure 5
New Jersey Enrollment Growth Compared With National Trends
Source: Tax Foundation calculations based on data from Census Bureau, National Center forEducation Statistics, and Bureau of Labor Statistics
-4%
-3%
-2%
-1%
0%
1%
2%
3%
New Jersey Enrollment Growth
National Enrollment Growth
2004200119981995199219891986198319801977
First Abbott Decision in 1990
Figure 6
Slow Enrollment Growth Pushed Up New Jersey’s Per Pupil Spending BeforeAbbott Decisions; Rapid Growth Depressed It Afterward
Source: Tax Foundation calculations based on data from Census Bureau, National Center forEducation Statistics, and Bureau of Labor Statistics
First Abbott Decision in 1990
$0
$2,000
$4,000
$6,000
$8,000
$10,000
$12,000
$14,000
New Jersey Real Recurring Per Pupil Spending
U.S. Average Real Recurring Per Pupil Spending
2004200119981995199219891986198319801977
30 See Id. at 175 (“The terms and conditions required thatthe Governor, by executive order, create the North DakotaCommission on Education Improvement and submit tothe Legislative Assembly in 2007 an executive budget thatincludes at least $60 million more in funding forelementary and secondary education than the amountappropriated by the Legislative Assembly in 2005. Inreturn, the plaintiffs agreed to stay the litigation until theclose of the 2007 legislative session and at that time todismiss the action without prejudice if the LegislativeAssembly appropriated at least the additional $60million.”).
31 See Scharg, supra note 8, at 94, where he theorizes thatKentucky started “backsliding” on its fiscal commitmentin KERA when it cut the state sales tax in 1995.
32 346 N.C. 336, 488 S.E.2d 249 (1997).
33 See North Carolina Justice Center, Ignoring the Constitu-tion, 3 NC Policy Brief 14 at 1 (June 1, 2005) located athttp://www.ncjustice.org/media/library/365_ncpbv3n14.pdf (“Last year, just as the Court wasreaffirming the Leandro decision, North Carolina finallybegan to take some modest ‘baby steps’ toward compli-ance with the Leandro mandate.”).

13
virtually unchanged after lawmakers passed theKentucky Education Reform Act (KERA) tocomply with the court mandate. Even thoughKERA pumped over $1,136 per pupil intoeducation (Table 1), recurring spending per pupilincreased only about $350 from 1990 to 1991.Thereafter, per pupil spending continued to growat about the same rate after the decision as before,with increases in the mid-1990s and a slightdecrease around the year 2000 (see Figure 3).
The biggest apparent anomaly in our recur-ring per pupil data is New Jersey. Lawmakers inthat state increased spending nearly $7 billion($6,648 per pupil) in the wake of court mandates.This ranks first on an inflation-adjusted per pupilbasis (see Table 1). Looking at recurring per pupilspending before and after the decisions in NewJersey, however, we see that projected per pupilspending was actually greater than actual per pupilspending (see Table 7 and Figure 4). We see thesame trend in New Jersey (though not as pro-nounced) in the capital per pupil spending data(see Table 8). The discrepancy in both cases islikely due to anomalies in New Jersey per pupilspending growth before the decision.
Table 10
Comparing Recurring Per Pupil Spending Growth in Mandate and Non–mandate States
AverageAverage Recurring
Plaintiff Recurring Per Pupil SpendingVictories in States Per Pupil Spending Spending GrowthEducation Added to Spending Growth in in Non- in Non-Finance Mandate in Mandate Mandate Mandate Mandate Total Growth
Year Cases State Pool States States States States Difference Difference1977 2 WA, CT $ 4,859 $ 4,701 $ 1591978 2 $ 5,171 6.42% $ 4,818 2.49% $ 353 3.93%1979 2 $ 5,162 –0.16% $ 4,794 –0.48% $ 368 0.32%1980 2 $ 5,242 1.53% $ 4,779 –0.32% $ 463 1.85%1981 2 $ 5,371 2.48% $ 4,810 0.64% $ 562 1.83%1982 2 $ 5,408 0.69% $ 4,873 1.31% $ 536 –0.62%1983 2 $ 5,489 1.49% $ 5,093 4.51% $ 396 –3.03%1984 2 $ 5,625 2.47% $ 5,253 3.15% $ 372 –0.68%1985 2 $ 5,927 5.38% $ 5,488 4.47% $ 439 0.90%1986 2 $ 5,883 –0.75% $ 5,852 6.64% $ 30 –7.39%1987 2 $ 6,516 10.77% $ 6,030 3.03% $ 486 7.74%1988 2 $ 6,817 4.61% $ 6,251 3.66% $ 566 0.95%1989 4 KY, TX $ 5,561 –18.41% $ 6,529 4.45% –$ 967 –22.86%1990 5 NJ $ 6,304 13.36% $ 6,470 –0.90% –$ 165 14.26%1991 5 $ 6,342 0.60% $ 6,550 1.25% –$ 208 –0.65%1992 5 $ 6,561 3.45% $ 6,449 –1.55% $ 112 5.01%1993 7 MA, TN $ 6,392 –2.57% $ 6,598 2.32% –$ 206 –4.89%1994 9 MO, ND $ 6,600 3.25% $ 6,551 –0.72% $ 49 3.97%1995 11 NY, WY $ 7,460 13.02% $ 6,275 –4.21% $ 1,185 17.23%1996 12 MD $ 7,374 –1.15% $ 6,274 –0.02% $ 1,100 –1.13%1997 17 MI, NH, NC, OH, VT $ 7,272 –1.38% $ 6,254 –0.32% $ 1,019 –1.06%1998 19 AZ, ID $ 7,445 2.37% $ 6,679 6.81% $ 765 –4.44%1999 21 AK, NM $ 7,669 3.01% $ 6,880 3.01% $ 789 0.00%2000 23 CA, CO $ 7,637 –0.42% $ 7,127 3.59% $ 510 –4.00%2001 24 AR $ 7,756 1.56% $ 7,233 1.48% $ 523 0.08%2002 24 $ 8,053 3.83% $ 7,388 2.15% $ 665 1.69%2003 24 $ 8,251 2.45% $ 7,603 2.92% $ 647 –0.46%2004 25 IA $ 8,488 2.88% $ 7,885 3.70% $ 604 –0.82%Average Annual Growth: 2.09% 1.93%
Source: Tax Foundation calculations based on data from Census Bureau, National Center for Education Statistics, and Bureau of Labor Statistics
Figure 7
Proliferation of Court Mandates Leads to Expanding Per Pupil Funding GapBetween Mandate, Nonmandate States
Source: Tax Foundation calculations based on data from Census Bureau, National Center forEducation Statistics, and Bureau of Labor Statistics
$-1,500
$-1,000
$-500
$0
$500
$1,000
$1,500
Average PPS in Mandate States Less Average PPS in Nonmandate States
2004200119981995199219891986198319801977

14
pupil spending. Thus, the trend in the first half ofthe data set a high baseline that is tough to eclipseeven for a state under court order to increaseeducation spending.
The New Jersey anomaly is confirmed by thefindings of Frederick Hess from the AmericanEnterprise Institute.34 In looking at trends beforeand after the New Jersey Abbott rulings, Hessfound that teacher compensation actually in-creased prior to the legislature’s response to Abbottand then declined in the decade following.35 Hessalso found that per pupil spending as a percentageof the national average grew from 1980 to 1994but declined from 1994 to 2003.36
One final note on per pupil spending in NewJersey: the districts that compose the plaintiffs inthe Abbott cases—the so-called Abbott districts—have higher per pupil spending than other schooldistricts in New Jersey. According to one study,Abbott districts average per pupil expenditures of$14,796 while the overall New Jersey average perpupil expenditure is just under $12,000.37
F. A Look at General Trends in StatesWith and Without Court Mandates
Beyond focusing on the impact of court mandatesin particular states, it is also useful to examine perpupil spending trends in states with and withoutcourt mandates. This data reveals two interestingtrends: first, the states with court mandates spend,on average, $600 more on recurring spending perpupil in 2004 than states without court mandates;secondly, the states with court mandates havehigher personal income that states without, andconsequently are more likely to spend more oneducation even in the absence of court mandates.Overall, this makes it impossible to say with
Table 11
Relationship between Personal Income and Education Spending
DirectEducation
2004 2004 Per 2004 Direct Spending asPersonal Capita Education a Percentage 2004Income 2004 Personal Spending of Personal 2004 Per Pupil
Region ($thousands) Population Income ($thousands) Income Enrollment SpendingUnited States $9,687,225,896 293,058,438 $33,056 $397,932,125 4.11% 48,195,800 $8,257Mandate States $6,017,514,750 176,936,701 $34,009 $252,069,241 4.19% 29,696,100 $8,488Non-Mandate States $3,669,711,146 116,121,737 $31,602 $145,862,884 3.97% 18,499,700 $7,885
Source: Tax Foundation calculations based on data from the Census Bureau, National Center for Education Statistics, and Bureau of Economic Analysis
$0
$5,000
$10,000
$15,000
$20,000
$25,000
$30,000
$35,000
$40,000
Non-mandate States
Mandate States
Figure 8
Mandate States Have Higher Personal Income, Higher Per Pupil Spending
Source: Tax Foundation calculations based on data from the Census Bureau, National Center forEducation Statistics, and Bureau of Economic Analysis
Enrollment growth in New Jersey was almostnever equal to the national trend from 1977 to2004. During the late 1970s and into the early1990s enrollment growth in the Garden Statelagged behind the national average (see Figure 5)which pushed per pupil spending up compared tothe national average (see Figure 6). The oppositehappened from the early 1990s to 2004, withenrollment growth consistently above the nationalaverage, which put downward pressure on per
34 See Frederick Hess, “Adequacy Judgments and School Reform,” in School Money Trials (Martin West, ed.) (Brookings Institution Press 2007).
35 See Id. at 181.
36 See Id. at 182 (Table 7-1).
37 See News Release, High Degree of Equity in NJ Schools, Spending Data Show, Education Law Center (March 26, 2007), located at http://www.edlawcenter.org/ELCPublic/elcnews_070326_SpendingDataShowsEquity.htm.
15
certainty that the court mandates account for thedifferences in per pupil spending between the twogroups of states, and casts further doubt on theidea that court mandates have led to long-termincreases in education spending.
Table 10 tracks average per pupil spending inthe mandate and non-mandate states from 1977to 2004. A state is not included as a msandatestate until the year in which a court orderslawmakers to equalize and/or increase schoolspending. Since only two mandates took place inthe first half of the data set it is most useful tofocus on the latter half (1988 to 2004) since thetotal number of mandates grew from two totwenty-four during this period.
From 1989 to 1994, the difference in perpupil spending between mandate and non-mandate states changed dramatically. WhenKentucky and Texas were added to the pool ofmandate states in 1989, spending in the mandatestates was nearly $1,000 less per pupil than in thenon-mandate states (see Figure 7 for a graphicalrepresentation). As the number of states in themandate pool grew from four in 1989 to eleven in1995, the spending difference between mandateand non-mandate states quickly went from$1,000 less to $1,000 more per pupil. Between1995 and 2004 this difference eventually settledand equaled $604 per pupil in 2004, with 25states in the mandate pool and the remaining 25states in the non-mandate pool.
Do court mandates explain the difference inper pupil spending between the two groups ofstates, or are there other differences that mightaccount for the discrepancy? One possibleexplanation is that the states where mandatesoccurred were more likely to spend more oneducation even in the absence of court involve-ment. Thus, as more states were added to themandate pool starting in 1989, the differencespiked because the states added to the mandatepool were more likely to have higher spending.The data in Table 11 lends some credence to thistheory by comparing education spending topersonal income in the mandate and non-mandatestates.
Overall, the mandate states had higher perpupil spending and higher per capita personalincome in 2004 (see Figure 8). In 2004 themandate states also spent more on education as apercentage of income (4.19 percent) than thenon-mandate states (3.97 percent).
Looking at 2004 data on a state-by-state basisthe relationship between education spending andpersonal income becomes more pronounced.
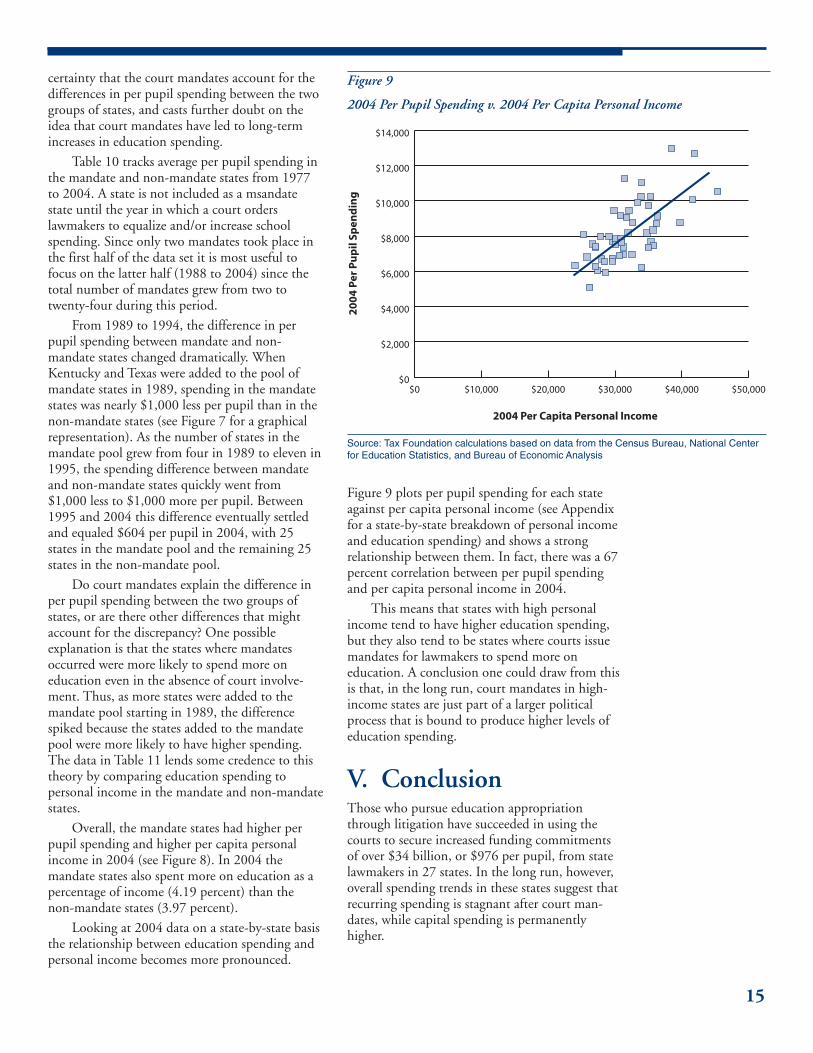
Figure 9 plots per pupil spending for each stateagainst per capita personal income (see Appendixfor a state-by-state breakdown of personal incomeand education spending) and shows a strongrelationship between them. In fact, there was a 67percent correlation between per pupil spendingand per capita personal income in 2004.
This means that states with high personalincome tend to have higher education spending,but they also tend to be states where courts issuemandates for lawmakers to spend more oneducation. A conclusion one could draw from thisis that, in the long run, court mandates in high-income states are just part of a larger politicalprocess that is bound to produce higher levels ofeducation spending.
V. ConclusionThose who pursue education appropriationthrough litigation have succeeded in using thecourts to secure increased funding commitmentsof over $34 billion, or $976 per pupil, from statelawmakers in 27 states. In the long run, however,overall spending trends in these states suggest thatrecurring spending is stagnant after court man-dates, while capital spending is permanentlyhigher.
Figure 9
2004 Per Pupil Spending v. 2004 Per Capita Personal Income
Source: Tax Foundation calculations based on data from the Census Bureau, National Centerfor Education Statistics, and Bureau of Economic Analysis
$0 $10,000 $20,000 $30,000 $40,000 $50,000$0
$2,000
$4,000
$6,000
$8,000
$10,000
$12,000
$14,000
2004 Per Capita Personal Income
20
04
Per
Pu
pil
Spen
din
g

16
Table 12
Comparison of Census Bureau and Tax Foundation State and Local Per PupilSpending Estimates
Census Bureau Tax Foundation2004 Recurring State 2004 Recurring Stateand Local Per Pupil and Local Per Pupil
State Spending Estimate Spending EstimateAlabama $ 6,553 $ 6,707Alaska $ 10,114 $ 10,271Arizona $ 6,036 $ 5,954Arkansas $ 6,740 $ 6,820California $ 7,748 $ 7,697Colorado $ 7,412 $ 7,460Connecticut $ 10,788 $ 10,561Delaware $ 10,228 $ 10,245Florida $ 6,784 $ 6,967Georgia $ 7,733 $ 7,709Hawaii $ 8,533 $ 8,767Idaho $ 6,028 $ 6,046Illinois $ 8,656 $ 8,182Indiana $ 8,280 $ 7,844Iowa $ 7,631 $ 7,849Kansas $ 7,518 $ 7,383Kentucky $ 6,888 $ 6,291Louisiana $ 7,209 $ 7,374Maine $ 9,534 $ 9,452Maryland $ 9,212 $ 8,757Massachusetts $ 10,693 $ 10,064Michigan $ 9,072 $ 9,084Minnesota $ 8,359 $ 8,725Mississippi $ 6,237 $ 6,343Missouri $ 7,331 $ 7,520Montana $ 7,763 $ 7,997Nebraska $ 8,032 $ 8,179Nevada $ 6,399 $ 6,222New Hampshire $ 8,860 $ 9,148New Jersey $ 12,981 $ 12,706New Mexico $ 7,331 $ 7,553New York $ 12,930 $ 12,986North Carolina $ 6,702 $ 6,748North Dakota $ 7,727 $ 7,993Ohio $ 8,963 $ 9,158Oklahoma $ 6,176 $ 6,544Oregon $ 7,619 $ 7,623Pennsylvania $ 9,979 $ 9,922Rhode Island $ 9,903 $ 11,028South Carolina $ 7,184 $ 7,437South Dakota $ 6,949 $ 6,955Tennessee $ 6,504 $ 6,583Texas $ 7,104 $ 6,905Utah $ 5,008 $ 5,108Vermont $ 11,128 $ 11,270Virginia $ 8,225 $ 8,355Washington $ 7,243 $ 7,375West Virginia $ 8,475 $ 8,076Wisconsin $ 9,226 $ 9,467Wyoming $ 9,363 $ 9,732Weighted Average $ 8,452 $ 8,257
Source: Tax Foundation calculations based on data from Census Bureau, National Center forEducation Statistics, and Bureau of Labor Statistics
38 Frederick Hess describes inquiries into the spending outcomes that plaintiffs have achieved through school finance lawsuits as the “most interesting questions”in this area of study. See Frederick Hess, “Adequacy Judgments and School Reform,” in School Money Trials (Martin West, ed.) at 159 (Brookings InstitutionPress 2007). He also finds that “...successful adequacy efforts modestly boosted total spending but had no discernable effect on teacher pay or class size.” Id. at185.
39 See Matthew G. Springer and James W. Guthrie, “Adequacy’s Politicization of the School Finance Legal Process,” in School Money Trials (Martin West, ed.) at121 (Brookings Institution Press 2007) (“Legislative and executive branch deliberations are better adapted to accommodating uncertainty, deconstructingcomplexity, and considering trade-offs since their operational arrangements permit a far wider opportunity for constructive criticism and successive approxima-tion to take place.”).
40 Schrag, supra note 8, at 233. In the same paragraph quoted, Schrag goes on to say that courts do contribute “clout” to the education finance process.
This suggests that appropriation throughlitigation is not a particularly efficient long-termsolution to perceived funding inequities orinadequacies in school finance,38 particularly forthose who seek higher levels of recurring spend-ing. This conclusion was also reached by MatthewSpringer and James Guthrie in their analysis of theimpact of adequacy lawsuits on school financelitigation.39 Peter Schrag, in his seminal volumeon education finance lawsuits, Final Test, generallyaffirms this finding by stating that “...the courtsare rarely great places to make educationalpolicy.”40
VI. MethodologyFew courts actually order state lawmakers to raisetaxes or spending by specific sums. Some courtsissue general orders requiring lawmakers to reformthe system, leaving most of the details up tolegislative discretion. Others have ordered specificactions or required specific funding levels. Thismeans that we cannot know the cost of themandates merely by looking at the rulingsthemselves.
No matter how the court words its ruling,however, most state legislatures enact some type oflegislation to comply. This legislation typicallyprovides new state money above and beyond whatis presently budgeted for education, either in theform of state equalization grants or increases inthe overall funding level.
Given this background, in our quest to gaugethe fiscal impact of court-imposed educationfunding mandates we settled on two differentmethods to estimate the cost:
• The “price tag” of legislation passed by law-makers to comply with a court mandate
• A comparison of per pupil spending before andafter the court mandate
Both methods have their strengths andweaknesses. The first method is useful for thoseconcerned with separation of powers since itestimates how much lawmakers thought they wereincreasing spending when they decided to comply
17
with the court mandate. Another strength of thefirst method is that we know for certain that everydollar of increased spending was intended tocomply with the court mandate. Its majorweakness, however, is that it really tells us nothingabout the long-term impact of court mandates oneducation spending since it is a static estimate thattakes no account of future developments.
While many states have financedcourt-mandated spending increaseseither by spending surplus funds orcutting spending in other programareas, nine states have explicitlyraised taxes.
The second method’s major strength is that itgives us a long-term view of the impact of courtmandates on education spending. It does sobecause it is based on a 27-year data set thatallows us to look at the trends in per pupilspending before and after the court mandate. Itsmajor weakness is that it cannot tell us, forcertain, how much of the subsequent increase ineducation spending is due to the court mandateand how much is due to other factors such as agrowing economy, higher levels of personalincome, increase in available revenues, politicalpressures, etc.
Taken together, both methods give a goodoverall picture of the impact courts are having oneducation spending. Thus, we decided to presentthem both, but in separate sections of the paper.The methodology used for both methods isdiscussed in more detail below.
Cost of Legislation MethodThis method seeks to gauge the projected annualcost of legislation enacted to comply with courtmandates on school finance at the time suchlegislation was enacted.
We estimated this cost by the followingmethod: first, we identified any legislation thatwas passed to comply with a court mandate on theconstitutionality of a state’s school finance system;second, we sought to obtain a fiscal note for thelegislation; and third, if a fiscal note was notavailable, we looked to other official state docu-ments, scholarly articles, news reports, or policyreports.
After we obtained initial number estimates in27 states we separated them into three categories:recurring, one-time, and settlement. We did thisbecause not all court mandates required the sameresponse from lawmakers. Some required one-timeincreases in capital spending while others requiredrecurring increases in operational expenses. Inother states, more money was provided pursuantto an out-of-court settlement.
Once we had obtained an estimate, wewanted to allow for comparisons between states.We did this by adjusting for inflation (usingconsumer price index-urban data from the Bureauof Labor Statistics) and by adjusting for enroll-ment (using data from the National Center forEducation Statistics). We used 2004 price levelsbecause the data on school spending was onlyavailable through 2004. Since the enrollmentnumbers were only available through 2003, wegrew them up to 2004 using simple, straight-linegrowth projections based on previous years.
Finally, once we had adjusted the estimatesfor enrollment and inflation we totaled allrecurring, one-time and settlement payments intoa single number allowing an overall comparisonbetween states on legislation enacted pursuant tocourt mandates on education finance.
State and Local Per Pupil SpendingProjection MethodThis method seeks to gauge whether a stateexperienced higher levels of state and local perpupil spending growth after a court mandate oneducation finance.
We did this by comparing actual state andlocal per pupil spending in each state to projectedper pupil spending using growth rates before thedecision. Since education finance decisions goback at least to the 1970s, we needed per pupilspending which covered that range. While theCensus Bureau only provides state and local perpupil spending data back to 1992, it does readilyprovide total state and local education expendi-tures for years ranging from 1977 to 2004. Weused enrollment data from the National Centerfor Education Statistics to calculate state and localper pupil spending estimates (for recurring andcapital expenses) back to 1977.
In most cases the estimation of state and localper pupil spending using this method (raw Censusspending data and NCES enrollment data)matched nicely with the Census estimates of stateand local per pupil spending. Table 12 shows that,in 2004, the difference between the overall per

18
pupil spending estimates of the Tax Foundationand the Census Bureau was less than $200 perpupil.
Finally, we adjusted state and local per pupilspending for inflation using CPI-U data from theBureau of Labor Statistics. This gave us real stateand local per pupil spending data that could becompared accurately across 27 years and betweenstates.
Comparing long-term recurring andcapital spending trends in statesbefore and after court mandates oneducation shows that even a hefty,short-term increase in educationspending to comply with a courtorder does not always translate intopermanently higher levels ofspending.
After securing estimates of real state and localper pupil spending back to 1977, we neededmethods to compare spending before and aftercourt mandates. The first decision we needed tomake was what year we would use for each state asa swivel point in before/after comparisons. Ouroptions were to use the year of the court decisionor the year in which compliance legislation waspassed. Since some states passed compliancemeasures on multiple occasions, for simplicity’ssake we decided to use the year of decision as theswivel point.41
With a swivel point year selected we now hadto determine how we were going to compare stateand local per pupil spending before and after themandate. We decided that the best way toestimate the impact would be to compare actualspending to projected spending based on growthtrends before the decision.
Of course, there are a host of protocolsavailable to project spending from years past,including average annual growth in the statebefore the decision, average annual growth in allstates after the decision, average annual growth inmandate versus non-mandate states, and averageannual growth adjusted for relative position vis-a-vis other states.
We decided to use two methods (both areexplained step by step in Table 13):
• A simple, straight-line projection using perpupil spending in the year of the court man-date and a growth rate equal to average annualgrowth from 1977 to that year. This method ispresented in the main body of the paper.
• A relative, straight-line projection using perpupil spending in the year of the court man-date and a growth rate equal to the averagenon-mandate state plus the difference betweenthe particular state’s growth rate and all non-mandate state growth rates before the year ofdecision. This method is presented solely in theAppendix, and the results for recurring andcapital spending can be found in Tables 14 and16, respectively.
After estimating our projections under bothmethods, we compared our projections to actualper pupil spending and then calculated thedifference. Table 13 shows an example of how wecalculated these projections for recurring per pupilspending in Alaska.
We used virtually the same methodology tocalculate projections with the capital (as opposedto recurring) state and local per pupil data. Theonly significant difference is that, under the
Straight-Line Projection Method1. Real recurring per pupil
spending in year of courtmandate (1999) $ 9,536
2. Average annual growth inreal recurring per pupilspending in the 5 yearsafter court mandate (1999–2004) 1.50%
3. Average annual growth inreal recurring per pupilspending in 22 years beforecourt mandate (1977–1999) –0.05%
4. 2004 projection based onpre-mandate trends (-.05percent average annualgrowth) $ 9,513
5. 2004 actual real recurringper pupil spending $ 10,271
Difference $ 759
Relative Projection Method1. Real recurring per pupil
spending in year of courtmandate (1999) $ 9,536
2. Average annual growth inreal recurring per pupilspending in 22 years beforecourt mandate (1977–1999) –0.05%
3. Average annual growth inreal recurring per pupilspending in all non-mandatestates before Alaskadecision (1977-1999) 2.30%
4. Relative growth differencein years before Alaskadecision (step 2 minusstep 3) –2.35%
5. Average annual growth inreal recurring per pupilspending in all non-mandatestates after Alaska decision(1999-2004) 2.75%
6. Projected relative Alaskagrowth rate (step 4 plusstep 5) 0.39%
7. 2004 projection based onrelative growth rate $ 9,724
8. 2004 actual real recurringper pupil spending $ 10,271
Difference $ 547
Table 13
Explanation of Both Projection Methods (Using Alaska as an Example)
Source: Tax Foundation calculations based on data from Census Bureau, National Center forEducation Statistics, and Bureau of Labor Statistics
41 For swivel points in states with multiple decisions (e.g. New Jersey) we used the year of the first decision to mandate changes to the education finance system.

19
Table 14
Projections of Recurring Spending Per Pupil Using Relative Method ofComparison2004
Projected2004 Per
Pupil ProjectionActual Recurring Using2004 Spending Straight-
Per Pupil (Relative Total Percent LineState Spending Method) Difference Rank Difference MethodAlaska $ 10,271 $ 9,724 $ 547 7 5.60% $ 9,513Arizona $ 5,954 $ 5,451 $ 503 8 9.20% $ 5,265Arkansas $ 6,820 $ 6,796 $ 24 13 0.30% $ 6,720California n/a n/a n/a n/a n/a n/aColorado n/a n/a n/a n/a n/a n/aConnecticut n/a n/a n/a n/a n/a n/aIdaho $ 6,046 $ 6,498 – $ 452 15 – 7.00% $ 6,279Iowa n/a n/a n/a n/a n/a n/aKansas n/a n/a n/a n/a n/a n/aKentucky $ 6,291 $ 5,811 $ 479 9 8.30% $ 6,378Maryland $ 8,757 $ 8,470 $ 287 11 3.40% $ 7,982Massachusetts $ 10,064 $ 7,970 $ 2,093 2 26.30% $ 8,013Michigan $ 9,416 $ 9,792 – $ 376 16 – 7.20% $ 9,136Missouri $ 7,520 $ 7,284 $ 236 12 3.20% $ 7,121Montana n/a n/a n/a n/a n/a n/aNew Hampshire $ 9,148 $ 8,746 $ 402 10 4.60% $ 8,217New Jersey $ 12,706 $ 15,992 – $ 3,286 18 – 20.60% $ 17,031New Mexico n/a n/a n/a n/a n/a n/aNew York n/a n/a n/a n/a n/a n/aNorth Carolina $ 6,748 $ 7,135 – $ 387 14 – 5.40% $ 6,659North Dakota $ 7,993 $ 6,027 $ 1,966 3 32.60% $ 5,891Ohio $ 9,158 $ 8,395 $ 763 5 9.10% $ 7,834Tennessee $ 6,583 $ 5,402 $ 1,181 4 21.90% $ 5,431Texas $ 6,905 $ 7,744 – $ 839 17 – 10.80% $ 8,492Vermont $ 11,270 $ 8,770 $ 2,500 1 28.50% $ 8,186Washington n/a n/a n/a n/a n/a n/aWyoming $ 9,732 $ 9,044 $ 687 6 7.60% $ 8,682Weighted Average $ 8,116 $ 8,330 – $ 214 $ 8,400Weighted Average $ 7,713 $ 7,656 $ 79 $ 7,641without N.J.
Source: Tax Foundation calculations based on data from Census Bureau, National Center forEducation Statistics, and Bureau of Labor Statistics
relative method, we used the growth rate in allstates (as opposed to non-mandate states) beforeand after the decision to calculate the relativegrowth rate. We did this simply because therewere 45 states in the non-mandate pool in thecapital data as opposed to 23 in the non-mandatepool in the recurring spending data.
Of course, in both cases there were states thatwe left out of the analysis. In the recurring andcapital projections we left out any state for whichwe did not have at least three years of data beforeor after the decision. We also did not estimateprojections for recurring spending in those stateswhere the mandate dealt only with capitalspending, and vice versa.
Table 14 presents the results of the projec-tions of 2004 per pupil recurring spending incourt mandate states using the relative projectionmethod. Using this method, we estimated thatactual per pupil spending in 18 of the mandatestates was $214 less than projected spending.Without New Jersey, actual per pupil spendingwas $79 more than projected spending. The stateswith the highest differences, and presumablywhere court mandates had the largest fiscalimpact, were Vermont, Massachusetts, NorthDakota, Tennessee, and Ohio. While a few statesshow results that are qualitatively different underboth methods, the overall projections produced bythe two methods do not appear to be significantlydifferent (see Table 15).
Table 16 presents the results of the projec-tions of 2004 per pupil capital spending in courtmandate states using the relative projectionmethod. The results under the relative method aremostly consistent with the straight-line methodwith the exception of New Mexico, where therelative method yields a projection lower ($1,040)than that of the straight-line method ($1,121).
Table 15
Comparing Results of 2004 Per Pupil SpendingProjection Methods
Overall 2004 Overall 2004Per Pupil Per PupilSpending SpendingProjection Projection
Projection Method (with N.J.) (w/o N.J.)Straight-line method $ 8,400 $ 7,641Relative method $ 8,330 $ 7,656Total Difference $ 70 –$ 15Percentage Difference Negligible Negligible
Source: Tax Foundation calculations based on data fromCensus Bureau, National Center for Education Statistics, andBureau of Labor Statistics
Table 16
2004 Capital Per Pupil Spending Projections Using Relative Method ofComparison
ProjectedActual 2004 Capital Projection2004 Per Pupil Using
Capital Spending Straight-Per Pupil (Relative Line
State Spending Method) Difference MethodCalifornia $ 1,433 $ 1,169 $2 64 $ 1,231Colorado $ 1,128 $ 1,227 –$ 99 $ 1,294New Jersey $ 1,416 $ 1,469 –$ 52 $ 1,445New Mexico $ 1,401 $ 1,040 $ 361 $ 1,121Ohio $ 1,180 $ 899 $ 281 $ 887
$ 1,366 $ 1,163 $203 $1,202
Source: Tax Foundation calculations based on data from Census Bureau, National Center forEducation Statistics, and Bureau of Labor Statistics

20
Table 17
Details on Legislative Compliance with Court Mandates
Description of Recurring Description of Capital or Description of SettlementState Dollars Provided Year One-Time Dollars Provided Year Dollars Provided Year
Alaska Debt service in HB 281 which 1999 n/a n/aprovided for new schoolconstruction
Arizona FIRST legislation approved in 1998 1998 n/a n/aArkansas Spending approved in 2006 2006 $34.7 million approved by 2005 n/a
special session Facilities Commission in 2005;$50 million in building debtapproved by legislature in 2005
California n/a n/a $800 for school repairs in some 2004schools, $138.7 million forinstructional materials, $50 millionfor assessment of facilities
Colorado n/a n/a In settlement state committed 2000$180million dollars to fund schoolrepair and construction in theneediest school districts over morethan a decade
Connecticut Total cost in 2006 of Education 1977 n/a n/aCost Sharing (ECS)
Idaho Recurring maintenance expenses 2006 Transfer from the General 2006 n/aassociated with one-time capital Fund to the Public Schoolexpenses Facilities Cooperative Fund
Iowa n/a n/a $40 million securitized from 2004tobacco settlement fund tosettle case
Kansas $290 million in additional money 2005 n/a n/aprovided by legislature in 2005session;$466 in additional money 2006 n/a n/aprovided by 2006 legislature(phased in over three-yearperiod)
Kentucky Additional money appropriated 1990 n/a n/ain Kentucky Education ReformAct of 1990
Maryland Additional money appropriated 2002 n/a n/astarting in 2002 when stateadopted findings of ThorntonCommission
Massachusetts Increase in funds following 1993 n/a n/aEducation Reform Act of 1993
Michigan School aid changes occurred as 1998 One time payment to plaintiffs 1998 n/athe result of the Durant decision. and non-plaintiffs in 1998Three major bills were enactedon 11/19/97 that impacted schoolaid for 1997-98 and 1998-99.The bills are S.B. 178, S.B. 719and H.B. 5083.
Missouri New spending for education as 1993 n/a n/aa result of the OutstandingSchools Act of 1993
VII. Appendix:Background Data onLitigation and EducationSpending
The following tables in the Appendix containa list of the states with court mandates, the name
of the case in which the mandate occurred,whether additional litigation is currently pending,a description of the legislation enacted to complywith the rulings, per pupil spending in each statecompared to personal income, a breakdown oftotal education spending in the mandate states byyear from 1988 to 2004, and a summary of totaleducation spending and nominal and real perpupil spending in all states, mandate states, andnon-mandate states from 1988 to 2004.

21
Table 17 (continued)
Details on Legislative Compliance with Court Mandates
Description of Recurring Description of Capital or Description of SettlementState Dollars Provided Year One-Time Dollars Provided Year Dollars Provided Year
Montana $33.1 million in additional 2005 Additional capital funding 2005 n/arecurring funds appropriated in provided in 2005 special2005 regular session; $37.1 in sessionadditional recurring fundsappropriated in 2005 specialsession
New Hampshirea Total increase in state and local 1999 n/a n/ataxes caused by state impositionof statewide property tax andother tax increases (containedin HB 117 (1999)) and localproperty tax cuts in some areas
New Jersey $640 million provided in 1990 in 1990, S. 200 (Education Facilities 1998 n/aresponse to Abbott II and $249.8 1998 Construction and Financingmillion provided in 1998 in Act) passed to comply withresponse to Abbott IV Abbott decisions -- $6 billion
of $8.5 billion earmarked forplaintiff districts; FY 05budget provided additional $100million in school constructionmoney for Abbott districts.
New Mexico n/a n/a Additional capital funding 2001 n/aprovided in 2001 legislativesession
New York n/a n/a Capital funding provided in 2006 2006 n/alegislative session
North Carolina Seed money for Disadvantaged 2005 n/a n/aStudent Supplemental Funding(DSSF)
North Dakota n/a n/a n/a Plaintiffs dropped claims in 2006exchange for $60 million biennialincrease
Ohio Increase in H.B. 94 (2001) 2001 Capital funding estimated as a 1997 n/aresult of passage of S. 102 in1997
Tennessee $280 million increase in Education 1992 n/a n/aImprovement Act of 1992;$7 million increase in Teacher 1995 n/a n/aSalary Equity Act of 1995
Texas Increased state support by $528 1990 n/a n/amillion in 1990 plan;Property tax relief provided 2006 n/a n/ain 2006 HB 1
Vermont Additional grants contained in 1997 n/a n/aAct 60 passed in 1997
Washington Basic Education Act of 1977; 1977 n/a n/aAppropriations Act of 1977
Wyoming New school district funding 1998 n/a n/aapproved in 1998
a) The New Hampshire response to Claremont originally involved $825 million in new state taxes, which was offset by local property taxes decreasing in someareas due to the new property tax system. To calculate the overall impact we offset the $825 million state increase by the reduction in local property tax collectionsfrom 1999 to 2000 which, according to Census, was approximately $460 million.Source: Tax Foundation; Fiscal Notes; Official State Reports; Media Reports; Policy Reports

22
Table 18
State Education Spending and Personal Income in 2004
Direct2004 Direct Education
2004 2004 Per Education Spending as aPersonal Income 2004 Capita Spending 2004 2004 Per Percentage
($thousands) Population Personal ($thousands) Enrollment Pupil of PersonalState (BEA) (Census) Income (Census) (NCES) Spending IncomeUnited States $ 9,687,225,896 293,058,438 $ 33,056 $ 397,932,125 48,195,800 $ 8,257 4.11%Mandate States 6,017,514,750 176,936,701 34,009 252,069,241 29,696,100 8,488 4.19Non-Mandate States 3,669,711,146 116,121,737 31,602 145,862,884 18,499,700 7,885 3.97Alabama $ 126,654,900 4,517,442 $ 28,037 $ 4,889,854 729,100 $ 6,707 3.86%Alaska 22,259,283 656,834 33,889 1,369,167 133,300 10,271 6.15Arizona 164,122,222 5,745,674 28,564 5,700,099 957,300 5,954 3.47Arkansas 70,852,806 2,746,823 25,794 3,055,157 448,000 6,820 4.31California 1,268,049,043 35,841,254 35,380 49,693,128 6,456,300 7,697 3.92Colorado $ 164,673,261 4,598,507 $ 35,810 $ 5,681,933 761,700 $ 7,460 3.45%Connecticut 158,567,087 3,493,893 45,384 6,008,046 568,900 10,561 3.79Delaware 29,300,334 828,762 35,354 1,190,474 116,200 10,245 4.06Florida 564,997,468 17,366,593 32,534 18,026,663 2,587,400 6,967 3.19Georgia 264,728,035 8,935,151 29,628 11,713,397 1,519,500 7,709 4.42Hawaii $ 41,129,018 1,259,299 $ 32,660 $ 1,597,413 182,200 $ 8,767 3.88%Idaho 38,229,084 1,394,524 27,414 1,522,295 251,800 6,046 3.98Illinois 442,349,163 12,713,548 34,794 17,074,320 2,086,700 8,182 3.86Indiana 187,532,764 6,223,329 30,134 7,936,873 1,011,900 7,844 4.23Iowa 91,229,998 2,953,679 30,887 3,692,933 470,500 7,849 4.05Kansas $ 85,520,120 2,738,356 $ 31,230 $ 3,408,157 461,600 $ 7,383 3.99%Kentucky 111,873,024 4,140,427 27,020 4,061,844 645,700 6,291 3.63Louisiana 121,780,899 4,495,706 27,088 5,262,330 713,600 7,374 4.32Maine 39,235,543 1,313,921 29,861 1,850,733 195,800 9,452 4.72Maryland 220,603,188 5,553,249 39,725 7,574,262 864,900 8,757 3.43Massachusetts $ 267,972,288 6,435,995 $ 41,636 $ 9,783,840 972,200 $ 10,064 3.65%Michigan 320,260,846 10,093,398 31,730 16,248,806 1,788,800 9,084 5.07Minnesota 184,225,108 5,094,304 36,163 7,220,511 827,600 8,725 3.92Mississippi 69,449,644 2,892,668 24,009 3,084,040 486,200 6,343 4.44Missouri 173,054,401 5,752,861 30,081 6,869,062 913,400 7,520 3.97Montana $ 25,790,606 926,345 $ 27,841 $ 1,157,900 144,800 $ 7,997 4.49%Nebraska 55,828,485 1,746,980 31,957 2,294,934 280,600 8,179 4.11Nevada 79,353,276 2,332,484 34,021 2,483,851 399,200 6,222 3.13New Hampshire 47,247,757 1,297,961 36,402 1,859,775 203,300 9,148 3.94New Jersey 363,157,566 8,675,879 41,858 17,711,495 1,394,000 12,706 4.88New Mexico $ 50,707,317 1,900,620 $ 26,679 $ 2,394,394 317,000 $ 7,553 4.72%New York 742,208,973 19,291,526 38,473 37,119,898 2,858,500 12,986 5.00North Carolina 252,253,409 8,531,040 29,569 9,103,819 1,349,200 6,748 3.61North Dakota 18,508,637 635,848 29,109 793,700 99,300 7,993 4.29Ohio 352,588,485 11,461,347 30,763 16,602,525 1,812,900 9,158 4.71Oklahoma $ 100,026,970 3,522,827 $ 28,394 $ 3,995,922 610,600 $ 6,544 3.99%Oregon 111,324,974 3,589,168 31,017 4,224,892 554,200 7,623 3.80Pennsylvania 413,589,148 12,377,381 33,415 17,846,036 1,798,600 9,922 4.31Rhode Island 36,678,824 1,078,930 33,996 1,765,533 160,100 11,028 4.81South Carolina 113,632,187 4,194,694 27,090 5,116,439 688,000 7,437 4.50South Dakota $ 24,053,419 770,188 $ 31,231 $ 861,762 123,900 $ 6,955 3.58%Tennessee 174,452,481 5,885,597 29,641 6,079,580 923,500 6,583 3.48Texas 690,480,232 22,517,901 30,664 29,811,512 4,317,600 6,905 4.32Utah 63,477,769 2,421,500 26,214 2,516,642 492,700 5,108 3.96Vermont 19,519,312 620,795 31,442 1,077,401 95,600 11,270 5.52Virginia $ 266,751,115 7,472,448 $ 35,698 $ 9,942,193 1,189,900 $ 8,355 3.73%Washington 216,921,198 6,205,535 34,956 7,435,169 1,008,200 7,375 3.43West Virginia 45,819,047 1,810,906 25,302 2,226,537 275,700 8,076 4.86Wisconsin 176,482,330 5,498,807 32,095 8,175,478 863,600 9,467 4.63Wyoming 17,722,852 505,534 35,058 819,401 84,200 9,732 4.62
Source: Bureau of Economic Analysis; Census Bureau; National Center for Education Statistics

23
Table 20
Total and Per Pupil Education Spending in All States, Mandate States, and Non-Mandate States (1988-2004)
1988 1989 1990 1991 1992 1993 1994 1995 1996 1997 1998 1999 2000 2001 2002 2003 2004All States Spending(Millions) $ 157,433 $ 170,084 $ 183,410 $ 197,219 $ 205,276 $ 217,626 $ 226,677 $ 238,850 $ 249,911 $ 261,206 $ 281,243 $ 298,416 $ 319,214 $ 338,064 $ 356,914 $ 377,423 $ 397,932All States Spending Real(2004 Dollars) $ 251,388 $ 259,104 $ 265,081 $ 273,530 $ 276,383 $ 284,495 $ 288,929 $ 296,054 $ 300,881 $ 307,426 $ 325,931 $ 338,360 $ 350,172 $ 360,589 $ 374,770 $ 387,474 $ 397,932All States Enrollment (Thousands) 40,104 40,461 41,136 41,966 42,742 43,384 44,031 44,761 45,532 46,050 46,467 46,780 47,135 47,596 48,107 48,463 48,196All States Real Per Pupil Spending $ 4,706 $ 4,829 $ 4,806 $ 4,794 $ 4,827 $ 4,889 $ 5,105 $ 5,264 $ 5,502 $ 5,853 $ 6,045 $ 6,268 $ 6,404 $ 6,444 $ 6,518 $ 6,466 $ 6,558Mandate States Spending(Millions) $ 5,343 $ 19,097 $ 27,994 $ 30,046 $ 32,709 $ 41,912 $ 50,369 $ 77,099 $ 84,735 $ 117,969 $ 130,680 $ 141,584 $ 194,501 $ 208,848 $ 223,196 $ 235,786 $ 252,069Real Mandate States Spending(2004 Dollars) $ 8,531 $ 29,092 $ 40,460 $ 41,671 $ 44,039 $ 54,790 $ 64,201 $ 95,564 $ 102,016 $ 138,843 $ 151,445 $ 160,536 $ 213,364 $ 222,764 $ 234,362 $ 242,065 $ 252,069Mandate States Enrollment(Thousands) 1,252 5,231 6,418 6,571 6,712 8,571 9,727 12,811 13,835 19,092 20,343 20,934 27,939 28,722 29,102 29,339 29,696Mandate States Real Per PupilSpending $ 6,817 $ 5,561 $ 6,304 $ 6,342 $ 6,561 $ 6,392 $ 6,600 $ 7,460 $ 7,374 $ 7,272 $ 7,445 $ 7,669 $ 7,637 $ 7,756 $ 8,053 $ 8,251 $ 8,488Growth in Per Pupil Spending 4.61% -18.41% 13.36% 0.60% 3.45% -2.57% 3.25% 13.02% -1.15% -1.38% 2.37% 3.01% -0.42% 1.56% 3.83% 2.45% 2.88%Non-Mandate States Spending(Millions) $ 152,091 $ 150,987 $ 155,415 $ 167,174 $ 172,567 $ 175,715 $ 176,308 $ 161,751 $ 165,177 $ 143,237 $ 150,562 $ 156,832 $ 124,713 $ 127,987 $ 133,718 $ 141,637 $ 145,863Real Non-Mandate States Spending(2004 Dollars) $ 242,856 $ 230,012 $ 224,621 $ 231,858 $ 232,344 $ 229,706 $ 224,728 $ 200,490 $ 198,865 $ 168,583 $ 174,486 $ 177,824 $ 136,808 $ 136,514 $ 140,408 $ 145,409 $ 145,863Non-Mandate States Enrollment(Thousands) 38,852 35,230 34,718 35,396 36,030 34,813 34,304 31,950 31,698 26,957 26,124 25,846 19,196 18,875 19,005 19,124 18,500Non-Mandate States RealPer Pupil Spending $ 6,251 $ 6,529 $ 6,470 $ 6,550 $ 6,449 $ 6,598 $ 6,551 $ 6,275 $ 6,274 $ 6,254 $ 6,679 $ 6,880 $ 7,127 $ 7,233 $ 7,388 $ 7,603 $ 7,885Growth in Per Pupil Spending 3.66% 4.45% -0.90% 1.25% -1.55% 2.32% -0.72% -4.21% -0.02% -0.32% 6.81% 3.01% 3.59% 1.48% 2.15% 2.92% 3.70%Difference in Per Pupil Spendingbetween Mandate andNon-Mandate States $ 566 ($ 967) ($ 165) ($ 208) $ 112 ($ 206) $ 49 $ 1,185 $ 1,100 $ 1,019 $ 765 $ 789 $ 510 $ 523 $ 665 $ 647 $ 604
Source: Tax Foundation calculations based on data from the Census Bureau, National Center for Education Statistics, and Bureau of Labor Statistics
Table 19
Total Recurring Education Spending in the Mandate States, 1988-2004 (Millions of Dollars)
Year ofState Decision 1988 1989 1990 1991 1992 1993 1994 1995 1996 1997 1998 1999 2000 2001 2002 2003 2004Connecticut 1977 $ 2,396 $ 2,714 $ 3,016 $ 3,206 $ 3,582 $ 3,539 $ 3,706 $ 3,854 $ 4,038 $ 4,082 $ 3,989 $ 4,524 $ 4,790 $ 5,115 $ 5,440 $ 5,724 $ 6,008Washington 1977 2,947 3,196 3,512 3,964 4,327 4,647 4,844 5,070 5,319 5,535 5,932 6,140 6,457 6,729 7,001 7,218 7,435Kentucky 1989 0 1,811 1,906 2,180 2,321 2,430 2,572 2,865 2,956 3,086 3,107 3,289 3,433 3,592 3,750 3,906 4,062Texas 1989 0 11,376 12,200 12,727 13,834 14,131 15,912 16,488 17,643 18,769 20,185 21,434 23,691 25,194 26,698 28,255 29,812New Jersey 1990 0 0 7,361 7,968 8,644 9,414 10,113 10,365 10,487 10,960 11,782 12,226 13,546 14,075 14,603 16,157 17,711Massachusetts 1993 0 0 0 0 0 4,819 5,342 5,658 5,900 6,148 6,790 7,289 7,865 8,469 9,073 9,429 9,784Tennessee 1993 0 0 0 0 0 2,932 3,366 3,546 3,789 4,134 4,420 4,662 4,989 5,218 5,447 5,764 6,080Missouri 1994 0 0 0 0 0 0 4,005 4,263 4,525 4,785 5,080 5,402 5,718 6,139 6,559 6,714 6,869North Dakota 1994 0 0 0 0 0 0 508 526 549 559 608 629 661 677 692 743 794New York 1995 0 0 0 0 0 0 0 23,887 24,065 24,556 25,943 27,543 29,983 31,725 33,468 35,294 37,120Wyoming 1995 0 0 0 0 0 0 0 577 581 593 605 653 685 725 764 792 819Maryland 1996 0 0 0 0 0 0 0 0 4,882 5,094 5,292 5,647 5,928 6,473 7,018 7,296 7,574Michigan 1997 0 0 0 0 0 0 0 0 0 11,069 11,981 12,590 13,289 13,467 13,645 14,947 16,249New Hampshire 1997 0 0 0 0 0 0 0 0 0 1,163 1,231 1,288 1,398 1,510 1,622 1,741 1,860North Carolina 1997 0 0 0 0 0 0 0 0 0 6,031 6,519 7,001 7,720 8,098 8,476 8,790 9,104Ohio 1997 0 0 0 0 0 0 0 0 0 10,776 11,657 12,356 13,116 13,750 14,383 15,493 16,603Vermont 1997 0 0 0 0 0 0 0 0 0 630 709 777 844 858 873 975 1,077Arizona 1998 0 0 0 0 0 0 0 0 0 0 3,705 4,002 4,346 4,575 4,803 5,252 5,700Idaho 1998 0 0 0 0 0 0 0 0 0 0 1,145 1,229 1,254 1,358 1,463 1,492 1,522Alaska 1999 0 0 0 0 0 0 0 0 0 0 0 1,130 1,169 1,226 1,283 1,326 1,369New Mexico 1999 0 0 0 0 0 0 0 0 0 0 0 1,773 1,878 2,006 2,134 2,264 2,394California 2000 0 0 0 0 0 0 0 0 0 0 0 0 37,340 41,761 46,181 47,937 49,693Colorado 2000 0 0 0 0 0 0 0 0 0 0 0 0 4,400 4,751 5,102 5,392 5,682Arkansas 2001 0 0 0 0 0 0 0 0 0 0 0 0 0 1,358 2,716 2,886 3,055Iowa 2004 0 0 0 0 0 0 0 0 0 0 0 0 0 0 0 0 3,693Mandate States Total 5,343 19,097 27,994 30,046 32,709 41,912 50,369 77,099 84,735 117,969 130,680 141,584 194,501 208,848 223,196 235,786 252,069
Source: Tax Foundation calculations based on date from the Census Bureau

BACKGROUND PAPER(ISSN 1527–0408) ispublished approximatelyfour times a year. Each studyexplores an economic issuein depth, written byFoundation economists andguest scholars.
Single copy: freeMultiple copies: $ 5 each
The Tax Foundation, a non-profit, non-partisan researchand public educationorganization, has monitoredtax and fiscal activities at alllevels of government since1937.
© 2007 Tax Foundation
Editor and CommunicationsDirector, Bill Ahern
Tax Foundation
2001 L Street, NW, Suite 1050Washington, DC 20036
ph. 202.464.6200fx. 202.464.6201
Table 21
Court Mandates and Pending Litigation
Year of Court PendingState Court Mandate Case Mandate Case Litigation?
Alaska Kasayulie v. State 1999 YesArizona Hull v Albrecht 1998 YesArkansas Lake View v. Huckabee 2001 YesCalifornia Williams v. State 2000 NoColorado Giardino v. Colorado State Board of Education 2000 YesConnecticut Horton v. Meskill 1977 YesIdaho ISEEO v. State 1998 YesIowa Coalition for a Common Cents Solution vs. State 2004 NoKansas Montoy v. State 2005 NoKentucky Rose v. Council for Better Education 1989 YesMaryland Bradford v. State Board of Education 1996 NoMassachusetts McDuffy v. Secretary of the Executive Office of Education 1993 NoMichigan Durant v. State Bd. of Education 1997 NoMissouri Committee for Educational Equality v. State of Missouri 1993 YesMontana Columbia Falls Elem. Sch. Dist. No. 6 v. State 2005 YesNew Hampshirea Opinion of the Justices 1997 YesNew Jersey Abbott v. Burke 1990 YesNew Mexico Zuni School District v. State 1999 NoNew York Campaign for Fiscal Equity v State 1995 NoNorth Carolina Leandro v. State of North Carolina 1997 YesNorth Dakota Williston Public School District No. 1 v. State 1994 YesOhio DeRolph v. State 1997 NoTennessee Tennessee Small School Systems v. McWherter 1993 NoTexas Edgewood Independent School District v. Kirby; 1989 NoTexas Neely v. West Orange-Cove 2006 NoVermont Brigham v. State of Vermont 1997 YesWashington Seattle School District No. 1 v. State 1977 YesWyoming Campbell County School District v. State 1995 Yes
Source: Tax Foundation