Embed Size (px)
Citation preview
Appropriate Water Purification Technology and Sanitation
Promotion in Rural Communities:The Dominican Republic
Dr. Pedro Bernal
Chemistry Department, Rollins College, Winter Park, FL
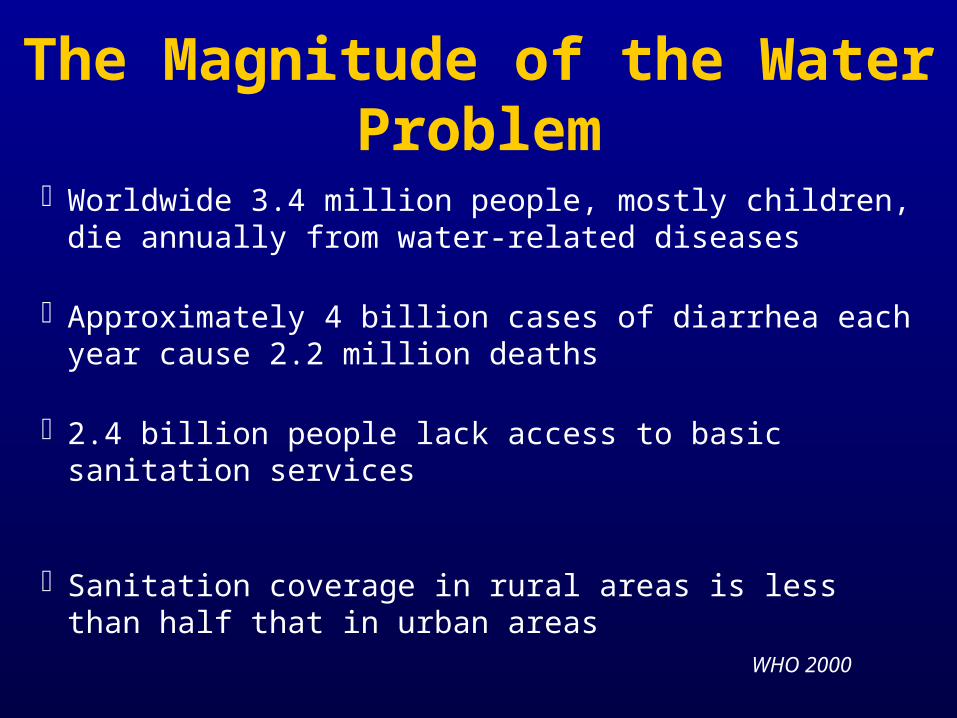
The Magnitude of the Water Problem
Worldwide 3.4 million people, mostly children, die annually from water-related diseases
Approximately 4 billion cases of diarrhea each year cause 2.2 million deaths
2.4 billion people lack access to basic sanitation services
Sanitation coverage in rural areas is less than half that in urban areas
WHO 2000
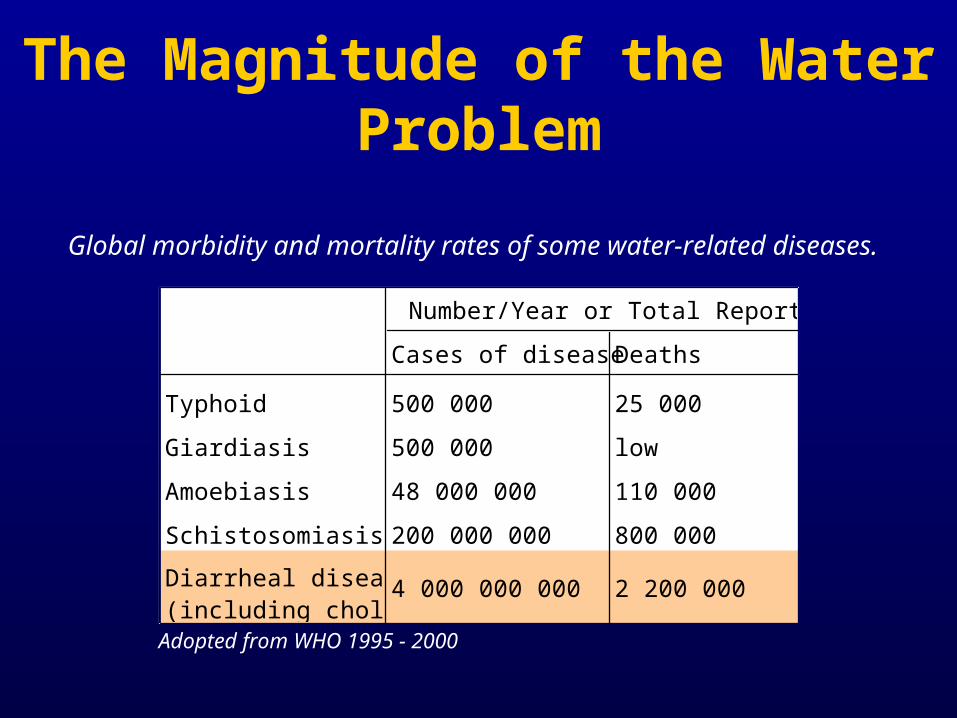
The Magnitude of the Water Problem
Cases of disease Deaths
Typhoid 500 000 25 000
Giardiasis 500 000 low
Amoebiasis 48 000 000 110 000
Schistosomiasis 200 000 000 800 000
Diarrheal disease (including cholera)
4 000 000 000 2 200 000
Number/Year or Total Reported
Global morbidity and mortality rates of some water-related diseases.
Adopted from WHO 1995 - 2000
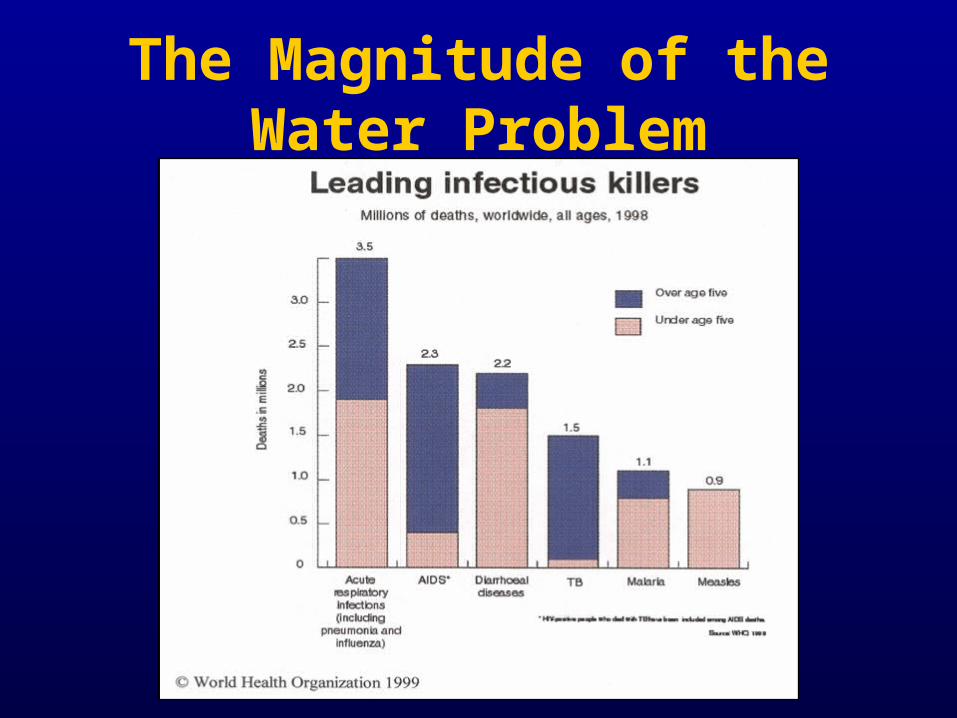
The Magnitude of the Water Problem
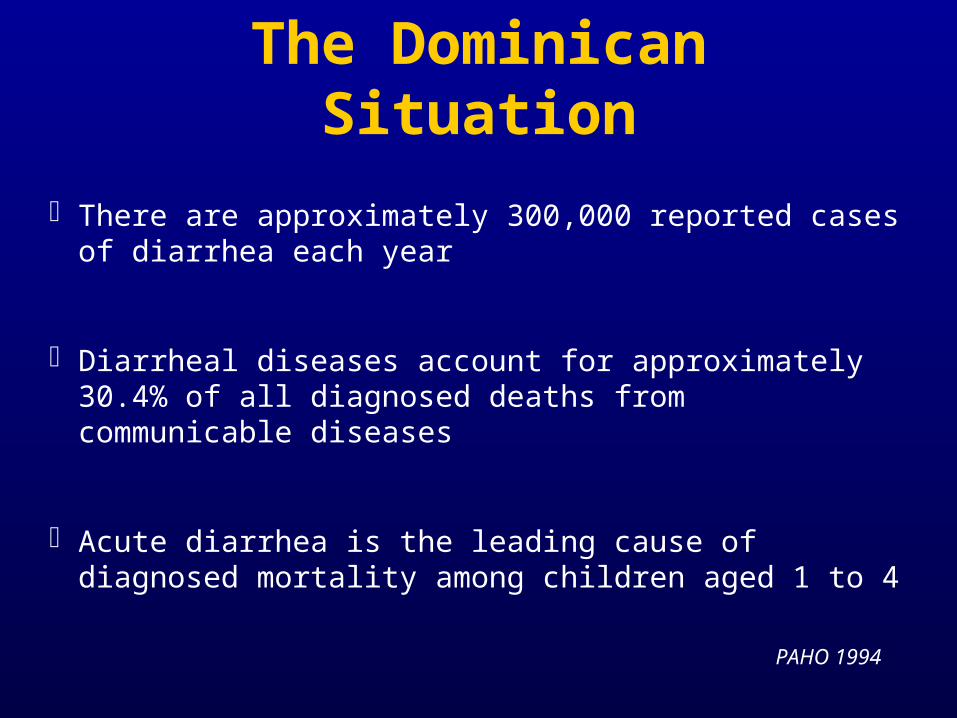
The Dominican Situation
There are approximately 300,000 reported cases of diarrhea each year
Diarrheal diseases account for approximately 30.4% of all diagnosed deaths from communicable diseases
Acute diarrhea is the leading cause of diagnosed mortality among children aged 1 to 4
PAHO 1994
The Nature of the Water Problem
Several factors influence water-related disease transmission
Water quality
Water quantity/availability
Personal and environmental hygiene and sanitation
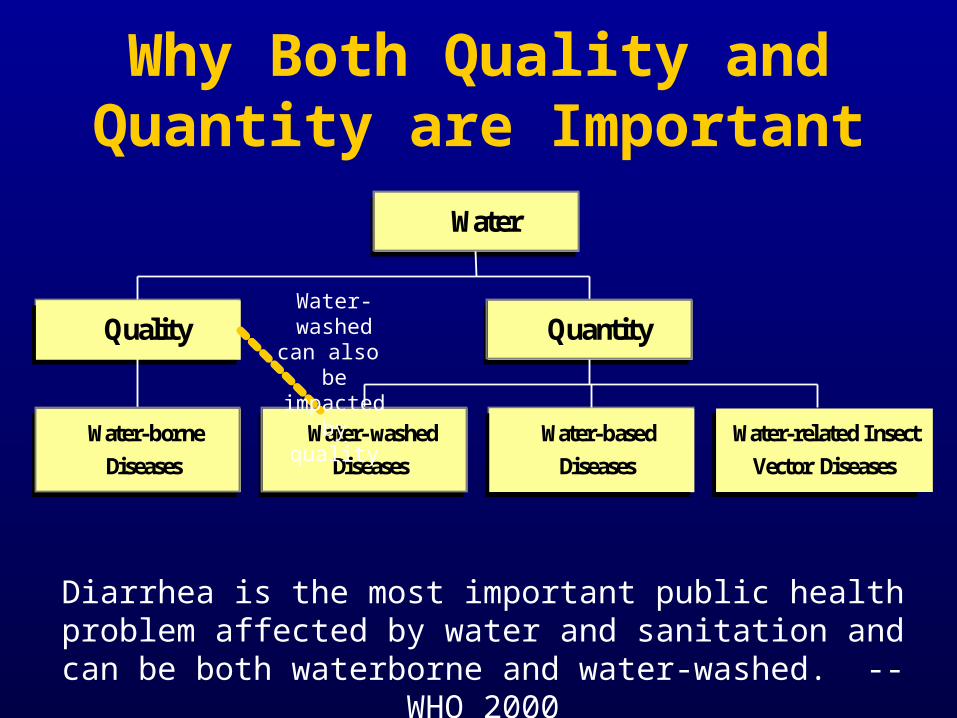
Why Both Quality and Quantity are Important
Water-borne
Diseases
Quality
Water-washed
Diseases
Water-based
Diseases
Water-related Insect
Vector Diseases
Quantity
Water
Water-washed can also be impacted by
quality
Diarrhea is the most important public health problem affected by water and sanitation and can be both waterborne and water-
washed. -- WHO 2000
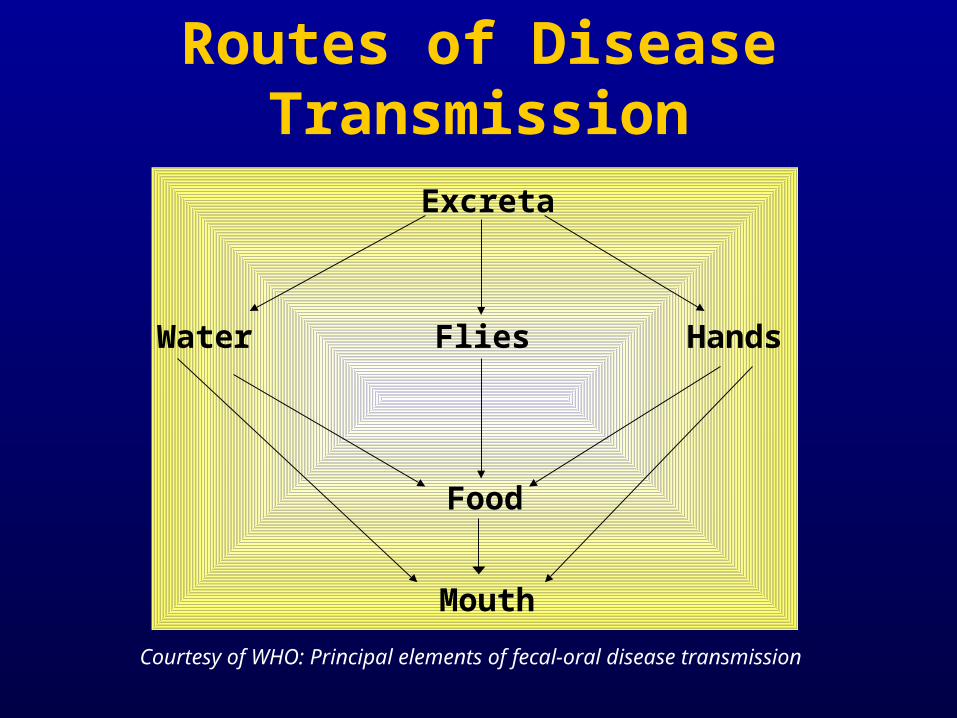
Routes of Disease Transmission
Excreta
Water HandsFlies
Food
Mouth
Courtesy of WHO: Principal elements of fecal-oral disease transmission
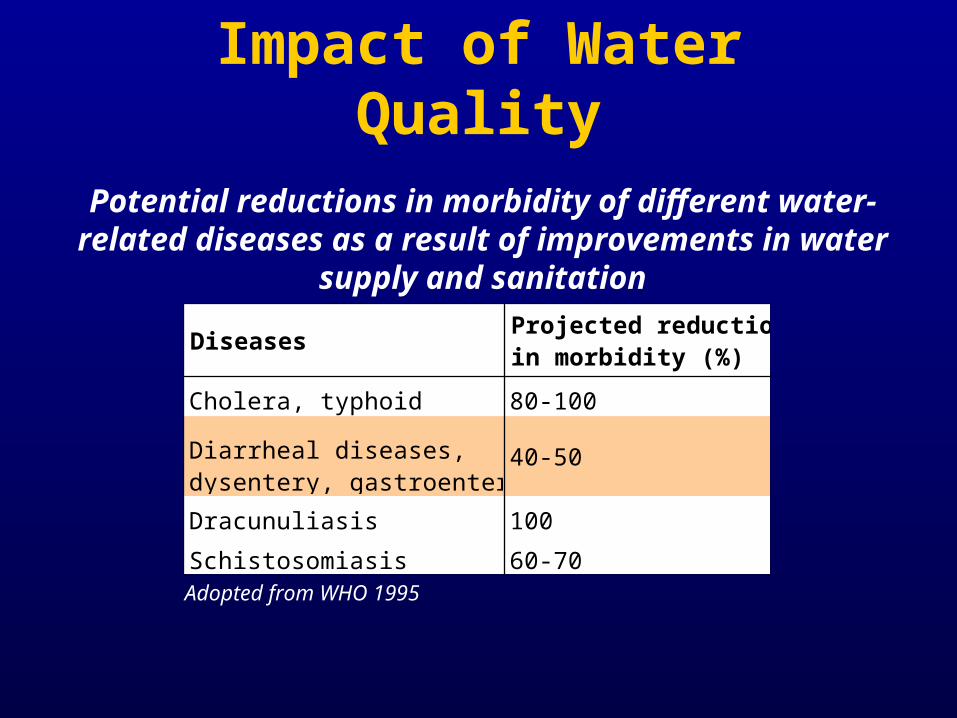
Impact of Water Quality
DiseasesProjected reduction in morbidity (%)
Cholera, typhoid 80-100
Diarrheal diseases, dysentery, gastroenteritis
40-50
Dracunuliasis 100
Schistosomiasis 60-70Adopted from WHO 1995
Potential reductions in morbidity of different water-related diseases as a result of improvements in water supply and sanitation
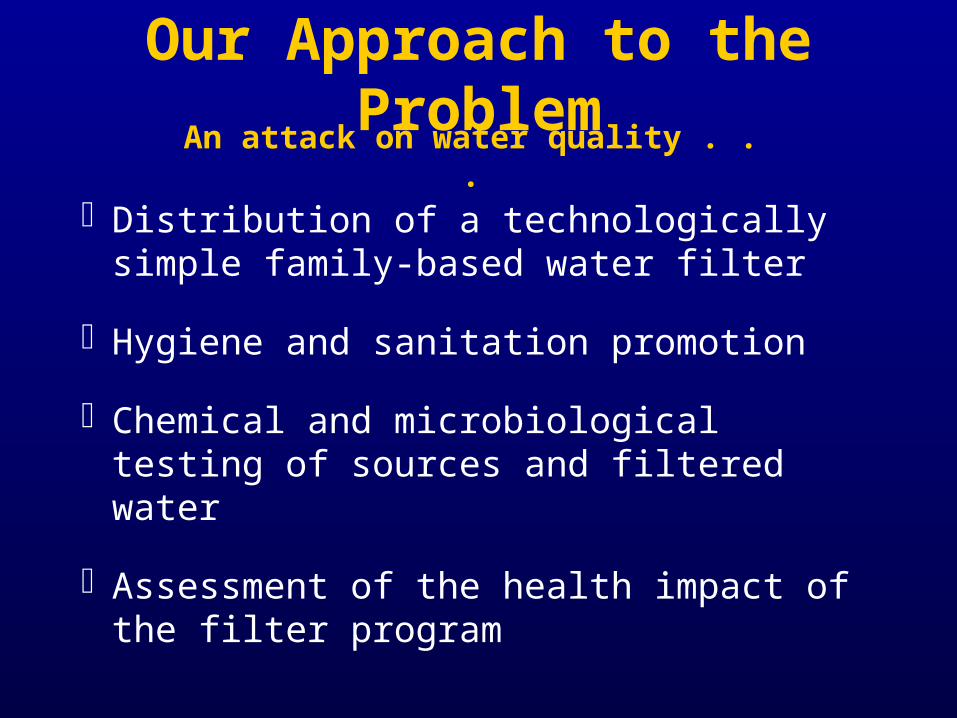
Our Approach to the Problem
Distribution of a technologically simple family-based water filter
Hygiene and sanitation promotion
Chemical and microbiological testing of sources and filtered water
Assessment of the health impact of the filter program
An attack on water quality . . .
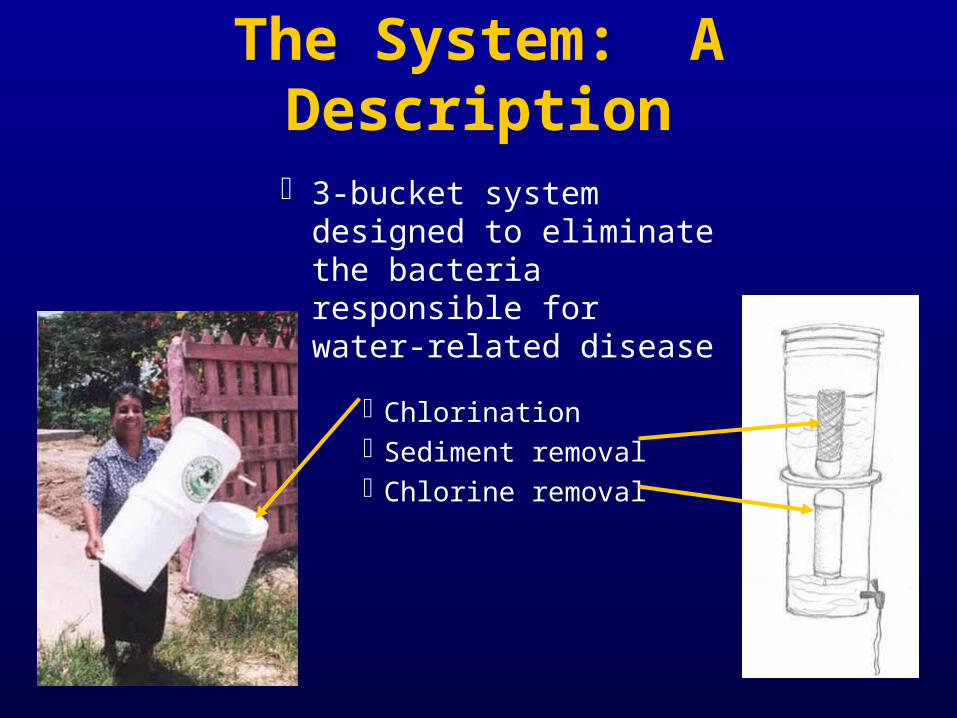
The System: A Description
3-bucket system designed to eliminate the bacteria responsible for water-related disease
Chlorination Sediment removal Chlorine removal
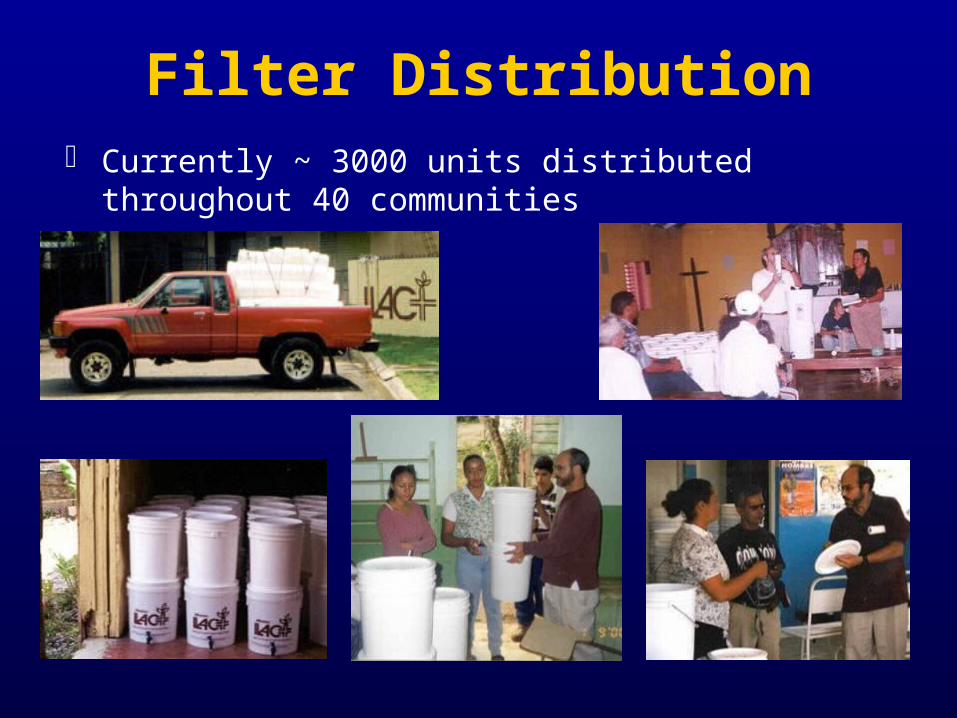
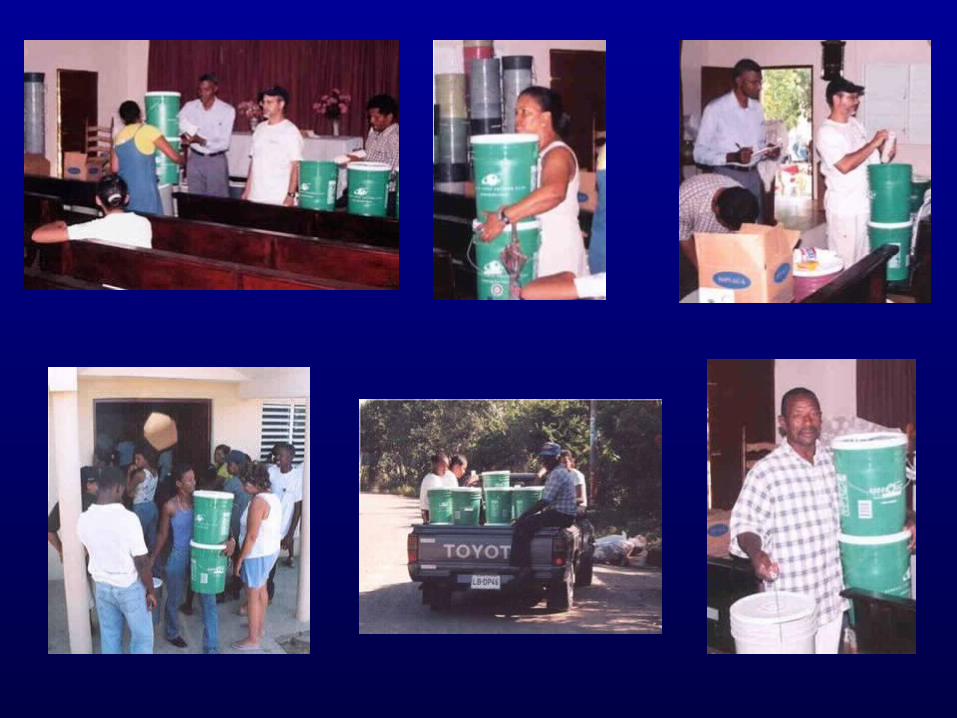
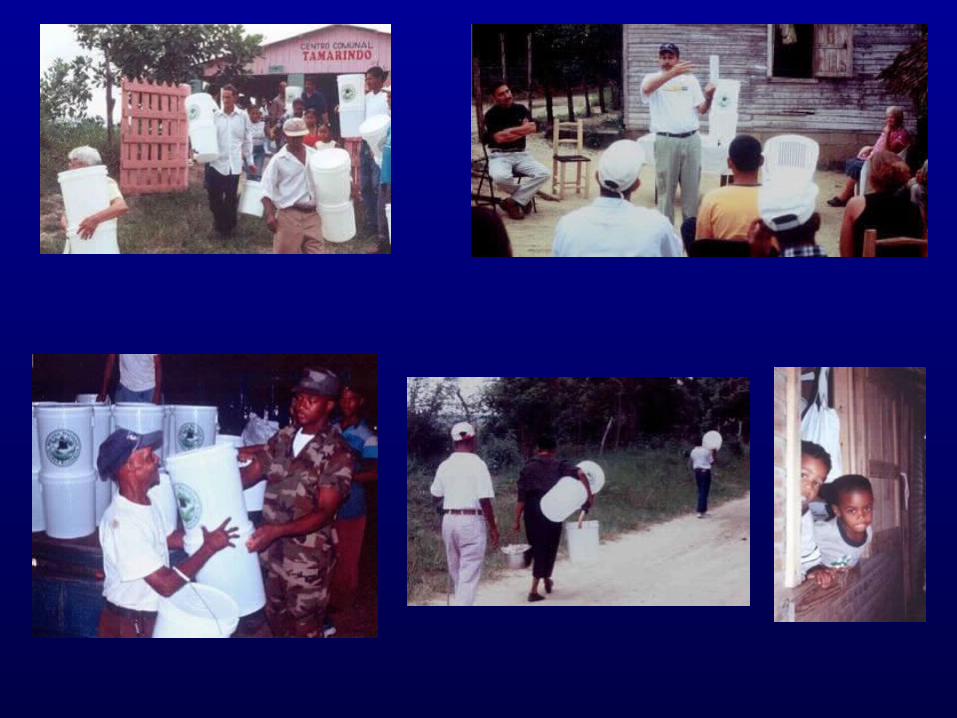
Filter Distribution Currently ~ 3000 units distributed throughout 40
communities
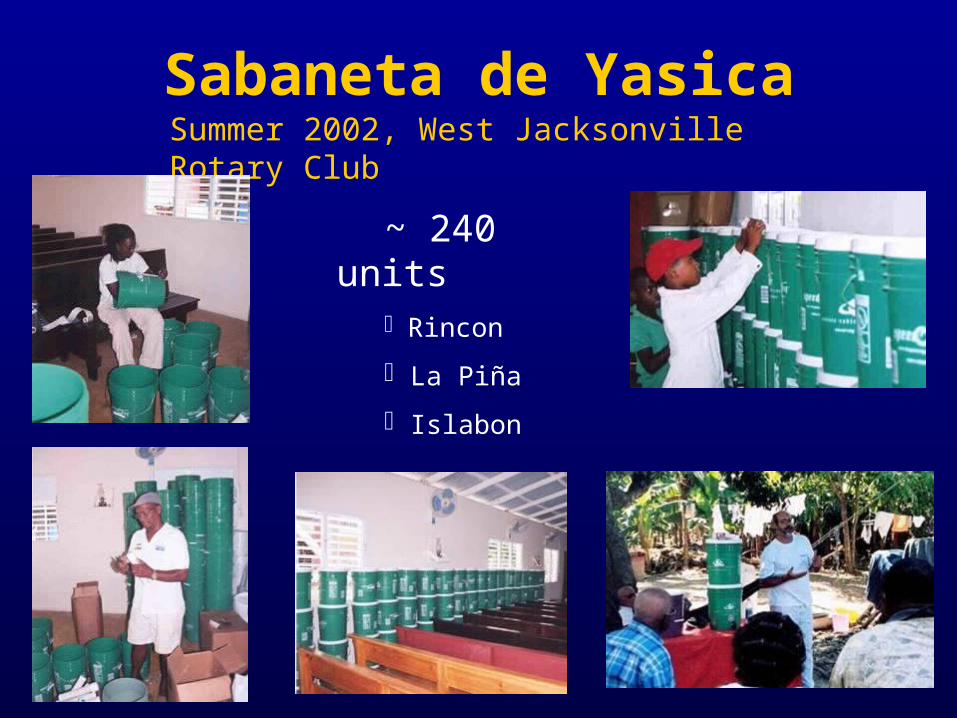
Sabaneta de YasicaSummer 2002, West Jacksonville Rotary Club
~ 240 units Rincon
La Piña
Islabon
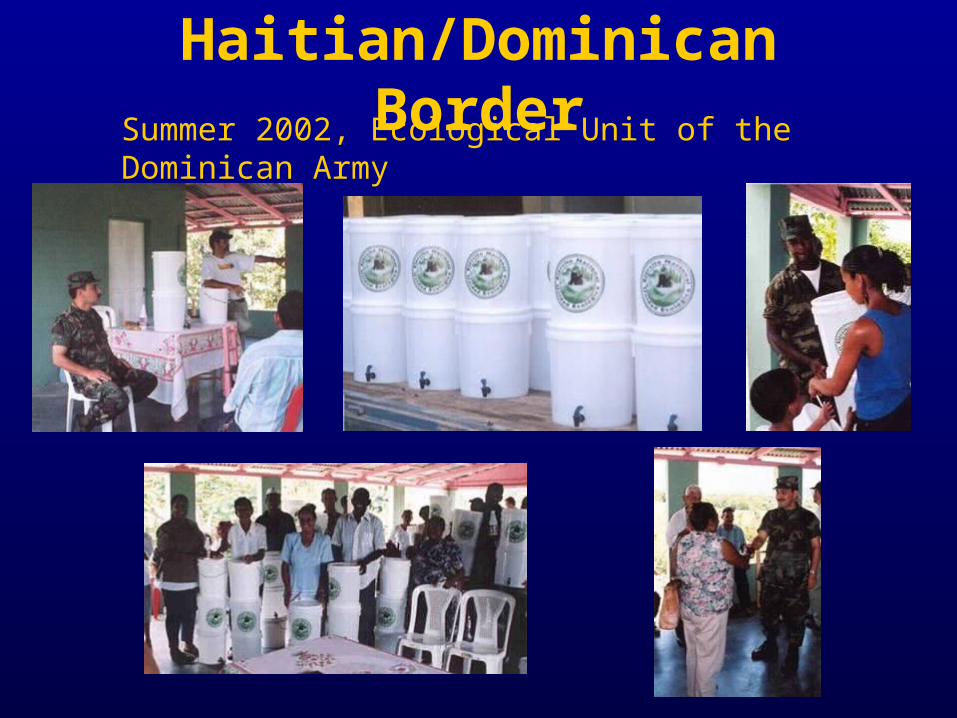
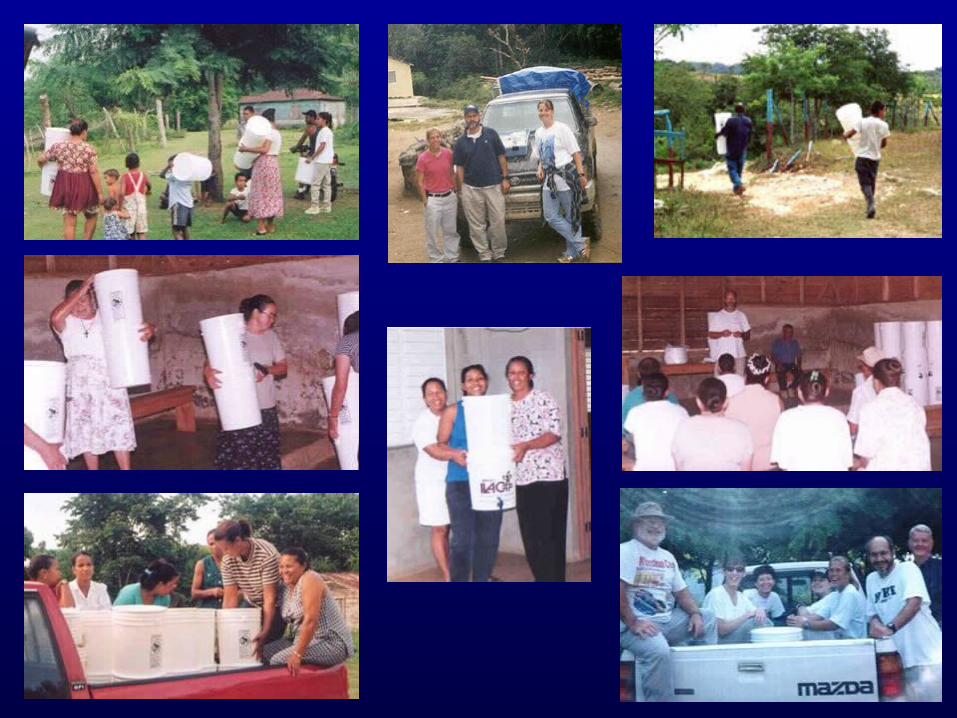
Haitian/Dominican BorderSummer 2002, Ecological Unit of the Dominican Army
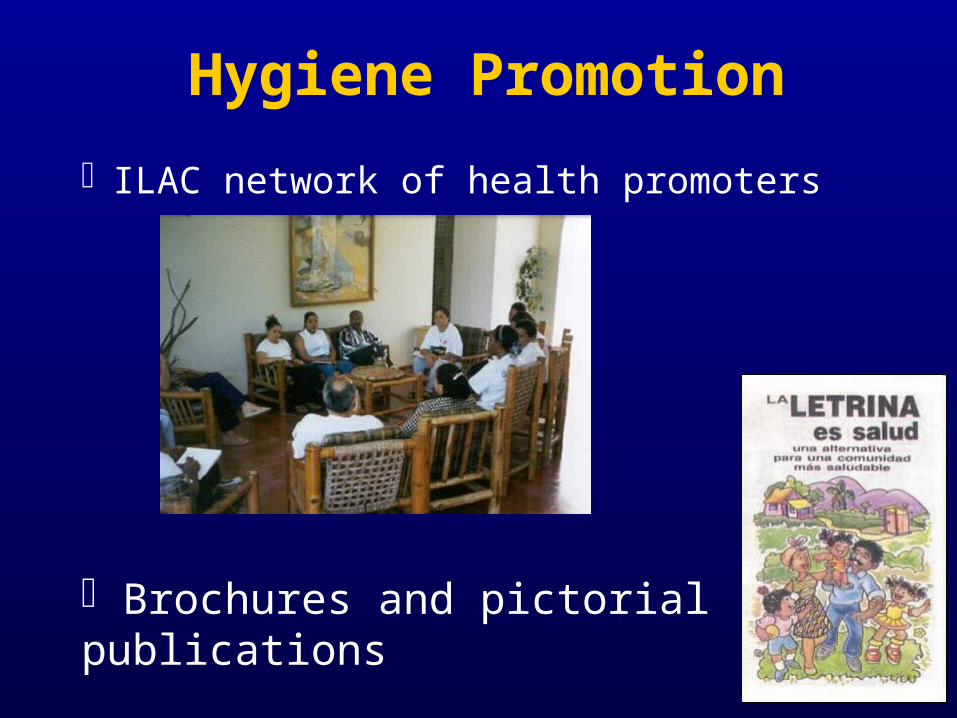
Hygiene Promotion
ILAC network of health promoters
Brochures and pictorial publications
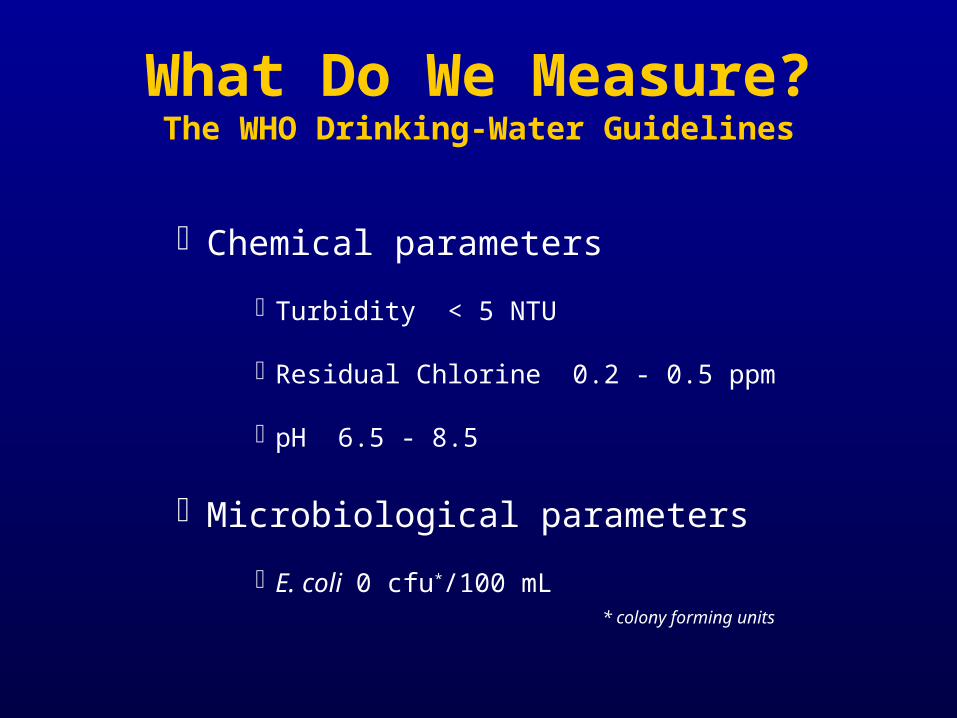
What Do We Measure?The WHO Drinking-Water Guidelines
Chemical parameters
Turbidity < 5 NTU
Residual Chlorine 0.2 - 0.5 ppm
pH 6.5 - 8.5
Microbiological parameters
E. coli 0 cfu*/100 mL * colony forming units
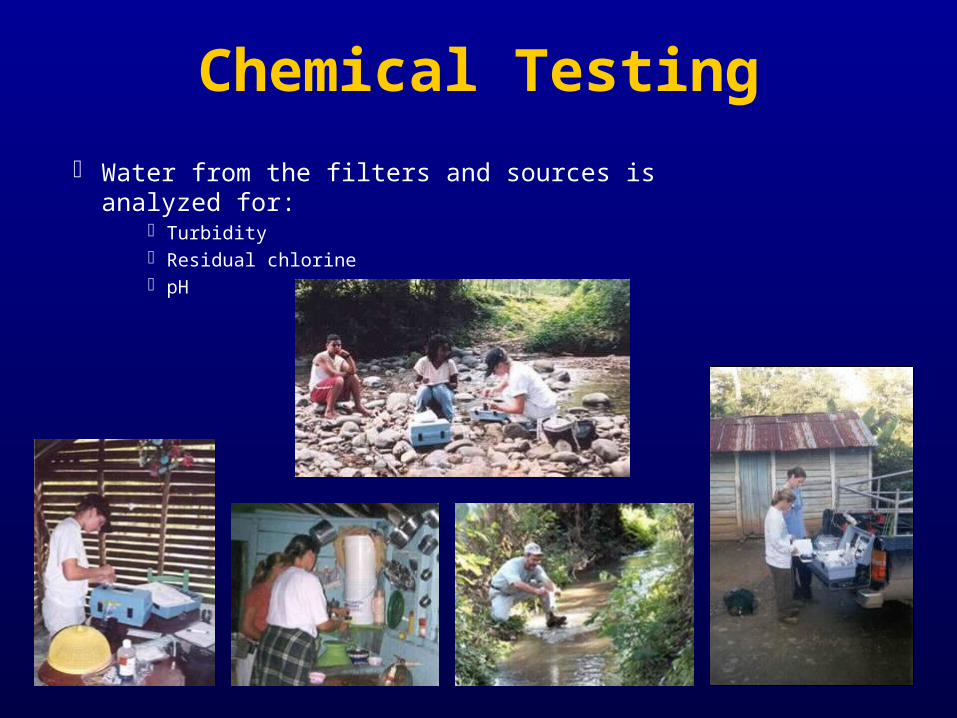
Chemical Testing
Water from the filters and sources is analyzed for: Turbidity Residual chlorine pH
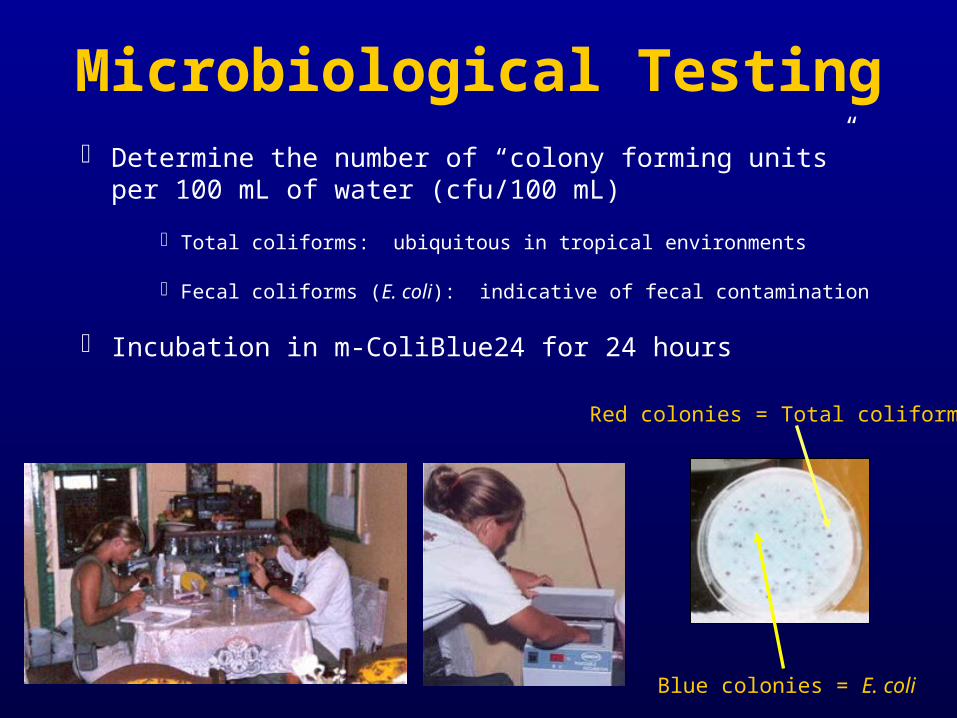
Red colonies = Total coliforms
Blue colonies = E. coli
Microbiological Testing Determine the number of “colony forming units” per 100 mL of
water (cfu/100 mL)
Total coliforms: ubiquitous in tropical environments
Fecal coliforms (E. coli): indicative of fecal contamination
Incubation in m-ColiBlue24 for 24 hours
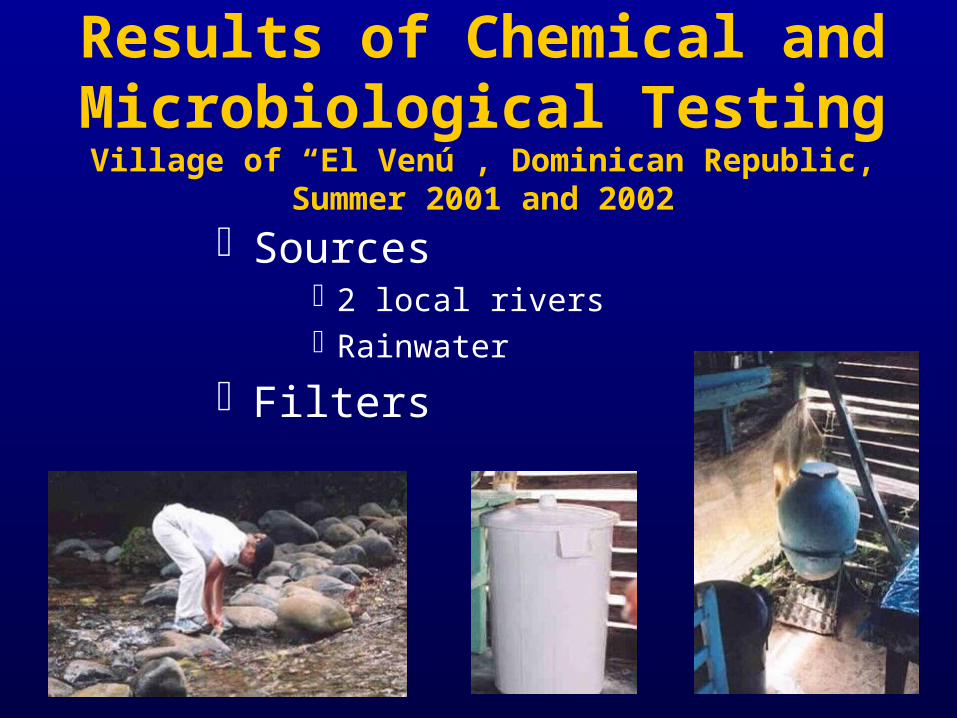
Results of Chemical and Microbiological Testing
Village of “El Venú”, Dominican Republic, Summer 2001 and 2002
Sources 2 local rivers Rainwater
Filters
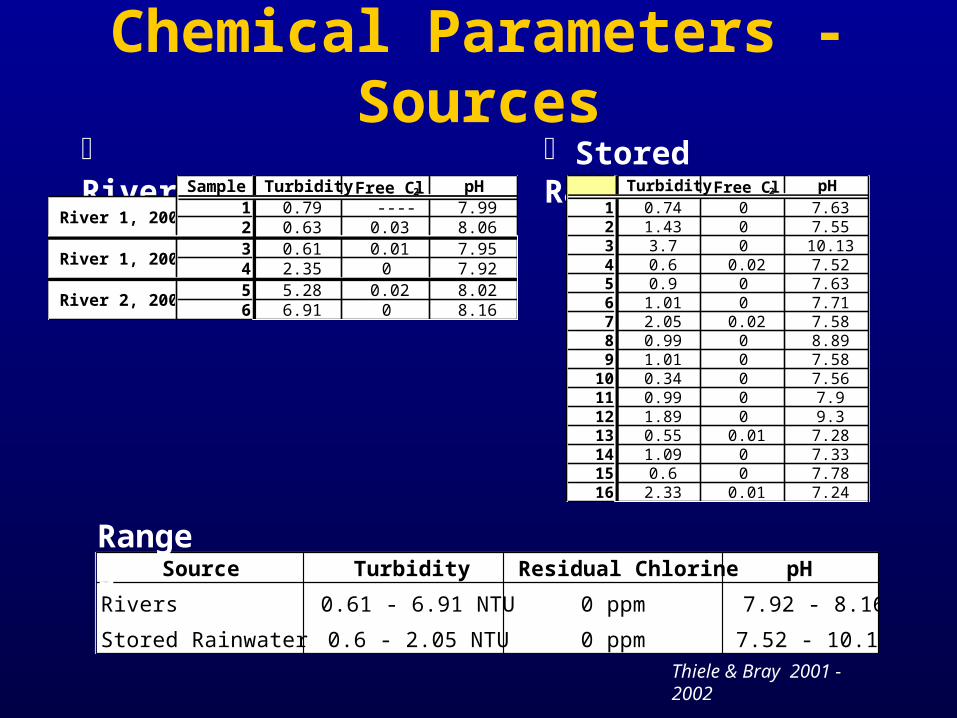
Chemical Parameters - Sources
Thiele & Bray 2001 - 2002
Source Turbidity Residual Chlorine pH
Rivers 0.61 - 6.91 NTU 0 ppm 7.92 - 8.16
Stored Rainwater 0.6 - 2.05 NTU 0 ppm 7.52 - 10.13
Rivers Stored Rainwater
Ranges
Turbidity Free Cl2 pH
1 0.74 0 7.632 1.43 0 7.553 3.7 0 10.134 0.6 0.02 7.525 0.9 0 7.636 1.01 0 7.717 2.05 0.02 7.588 0.99 0 8.899 1.01 0 7.58
10 0.34 0 7.5611 0.99 0 7.912 1.89 0 9.313 0.55 0.01 7.2814 1.09 0 7.3315 0.6 0 7.7816 2.33 0.01 7.24
Sample Turbidity Free Cl2 pH1 0.79 ---- 7.992 0.63 0.03 8.063 0.61 0.01 7.954 2.35 0 7.925 5.28 0.02 8.026 6.91 0 8.16
River 2, 2002
River 1, 2001
River 1, 2002
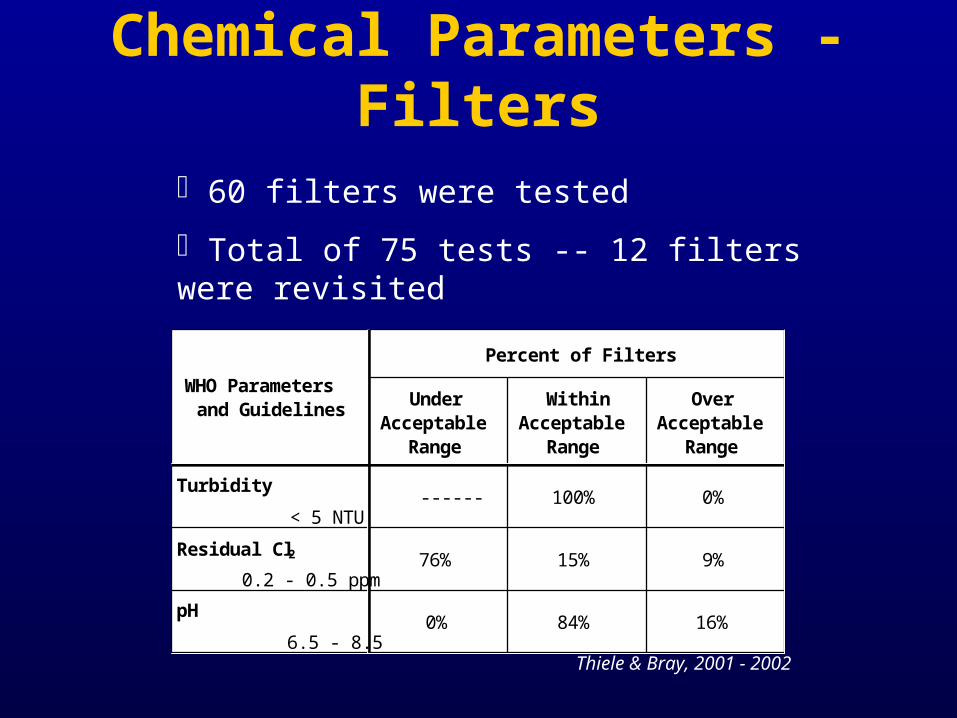
Chemical Parameters - Filters
Under Acceptable
Range
Within Acceptable
Range
Over Acceptable
Range
Turbidity
< 5 NTU
Residual Cl2
0.2 - 0.5 ppm
pH
6.5 - 8.5
15% 9%
WHO Parameters and Guidelines
Percent of Filters
0% 84% 16%
------ 100% 0%
76%
Thiele & Bray, 2001 - 2002
60 filters were tested
Total of 75 tests -- 12 filters were revisited
Why Are These Parameters Important to the Filters?
High turbidity provides a more adequate environment for microorganisms.
At a pH of around 6 the chlorine is almost 100% effective. As the pH increases the effectiveness of the chlorine decreases. (pH 9 ~ 5% efficacy)
Residual chlorine helps to maintain the disinfection.
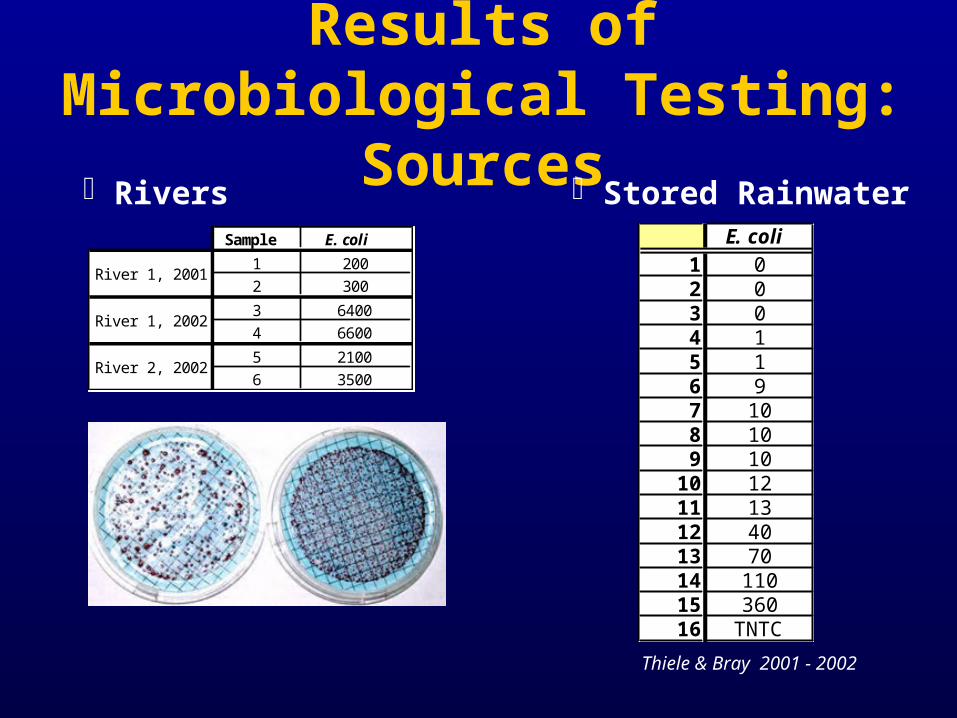
Results of Microbiological Testing: Sources
Thiele & Bray 2001 - 2002
E. coli
1 02 03 04 15 16 97 108 109 10
10 1211 1312 4013 7014 11015 36016 TNTC
Stored Rainwater RiversSample E. coli
1 2002 300
3 64004 6600
5 21006 3500
River 1, 2001
River 1, 2002
River 2, 2002
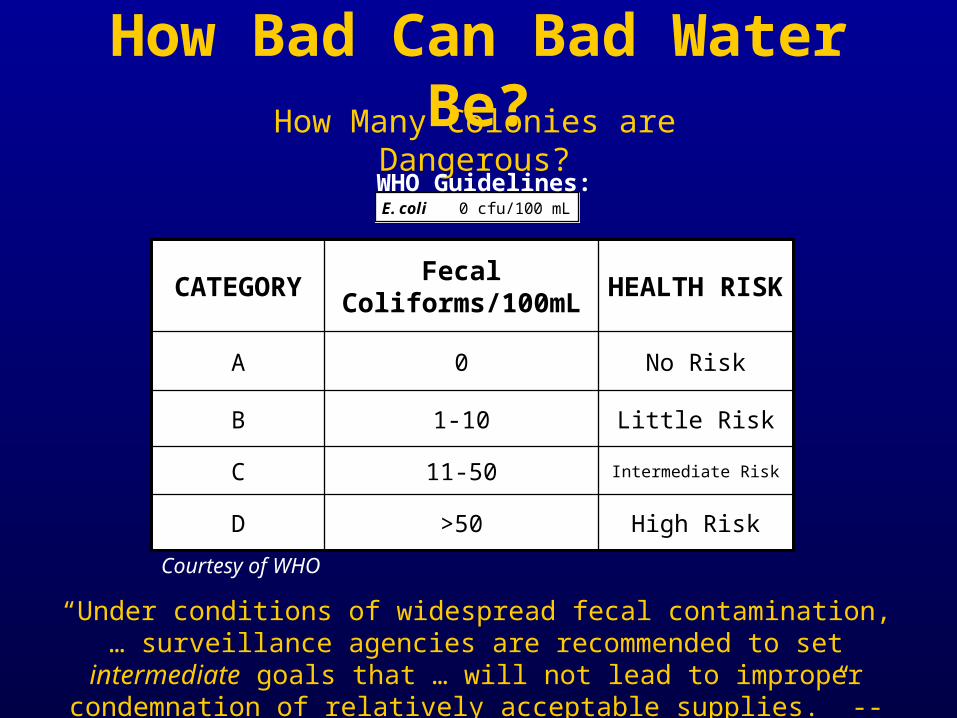
How Bad Can Bad Water Be?
High Risk>50D
Intermediate Risk11-50C
Little Risk1-10B
No Risk0A
HEALTH RISK
Fecal Coliforms/100mL
CATEGORY
Courtesy of WHO
How Many Colonies are Dangerous?
“Under conditions of widespread fecal contamination, … surveillance agencies are recommended to set intermediate goals that … will not lead to improper
condemnation of relatively acceptable supplies.” -- WHO 2000
E. coli 0 cfu/100 mLWHO Guidelines:
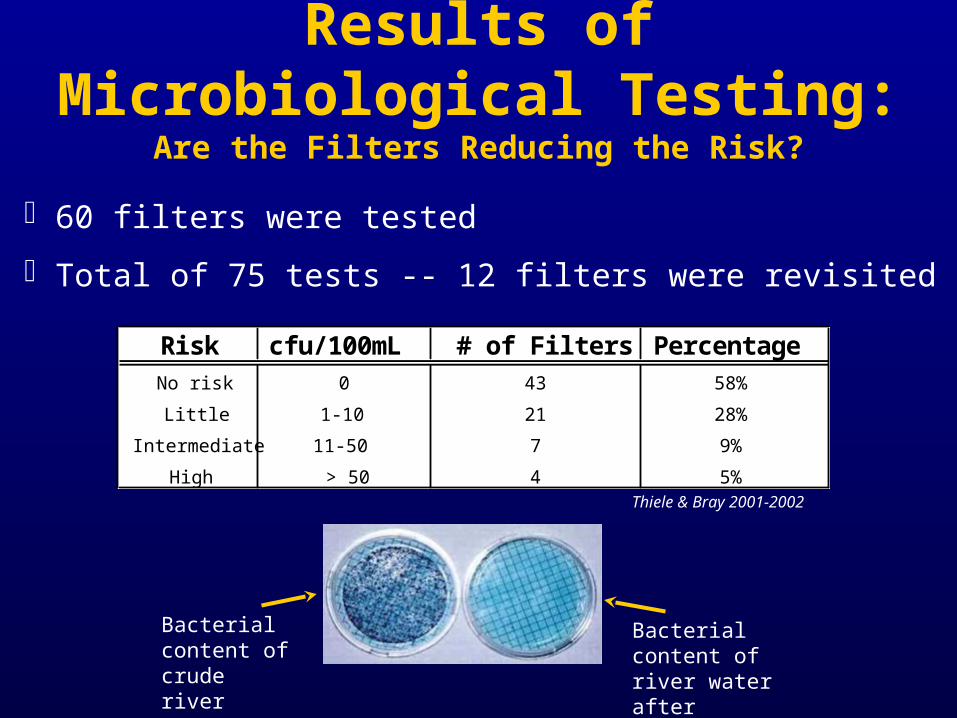
Results of Microbiological Testing:Are the Filters Reducing the Risk?
Thiele & Bray 2001-2002
Bacterial content of crude river water
Bacterial content of river water after filtration
60 filters were tested
Total of 75 tests -- 12 filters were revisited
Risk cfu/100mL # of Filters PercentageNo risk 0 43 58%
Little 1-10 21 28%
Intermediate 11-50 7 9%
High > 50 4 5%
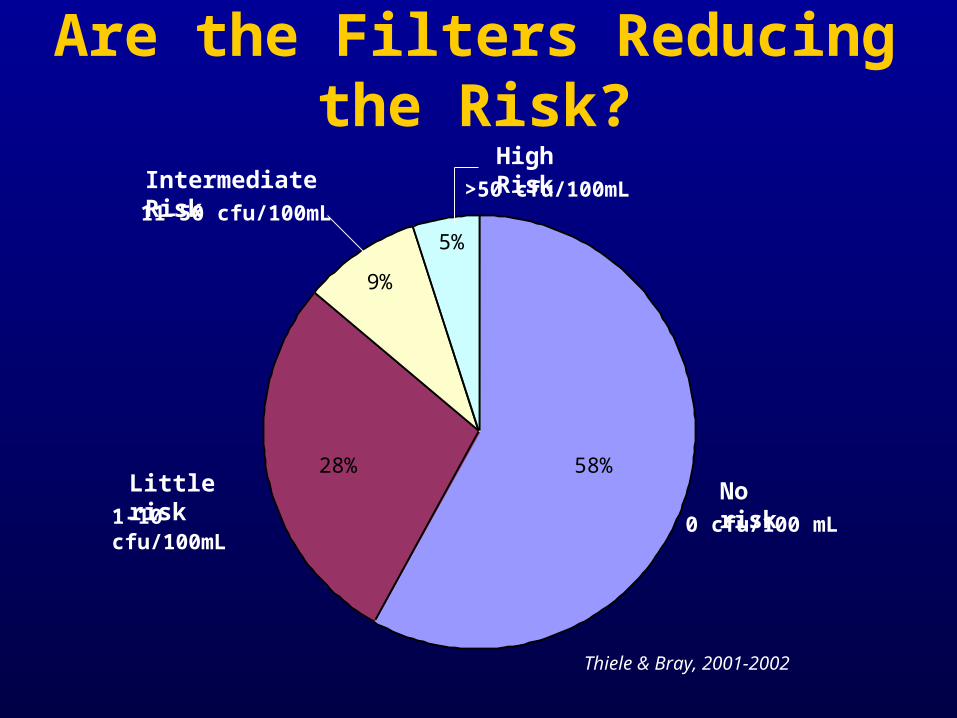
Are the Filters Reducing the Risk?
58%28%
9%
5%
0 cfu/100 mL
No risk1-10 cfu/100mL
Little risk
11-50 cfu/100mL
Intermediate Risk >50 cfu/100mL
High Risk
Thiele & Bray, 2001-2002
Conclusions
The “water problem” is complex, but the appropriate interventions can make a difference
The vast majority or filters (~90%) are producing water that presents little or no risk to the consumer
The reduction of water related diseases requires an improved water supply and an effective hygiene promotion program
Future Work
Distribution of filter systems in cooperation with interested organizations
Further development of the sanitation and hygiene education promotion
Continued assessment of filter performance
Continued student involvement in all aspects of the project
Acknowledgements
Rollins College Associated Colleges of the South (ACS) Operation Blessing International Eagle Springs Filtration Port Orange Ministerial Association Institute of Latin American Concern (ILAC) West Jacksonville Rotary Unidad Ecológica del Ejército Nacional de la República
Dominicana