Embed Size (px)
Citation preview
Approaching the NA of Water:Immersion Lithography at 193nm
Bruce Smith
Y. Fan, A. Bourov, L. Zavyalova, J. Zhou, F. Cropanese, N. Lafferty
Rochester Institute of TechnologyM. Gower, D. Ashworth
Exitech Inc.J. Webb
Corning Tropel
Outline
- 193nm immersion lithography to 38nm p/2
- Interferometric vs. projection lithography
- 1.05NA projection microstepper
- Homogeneous immersion and increasing refractive index
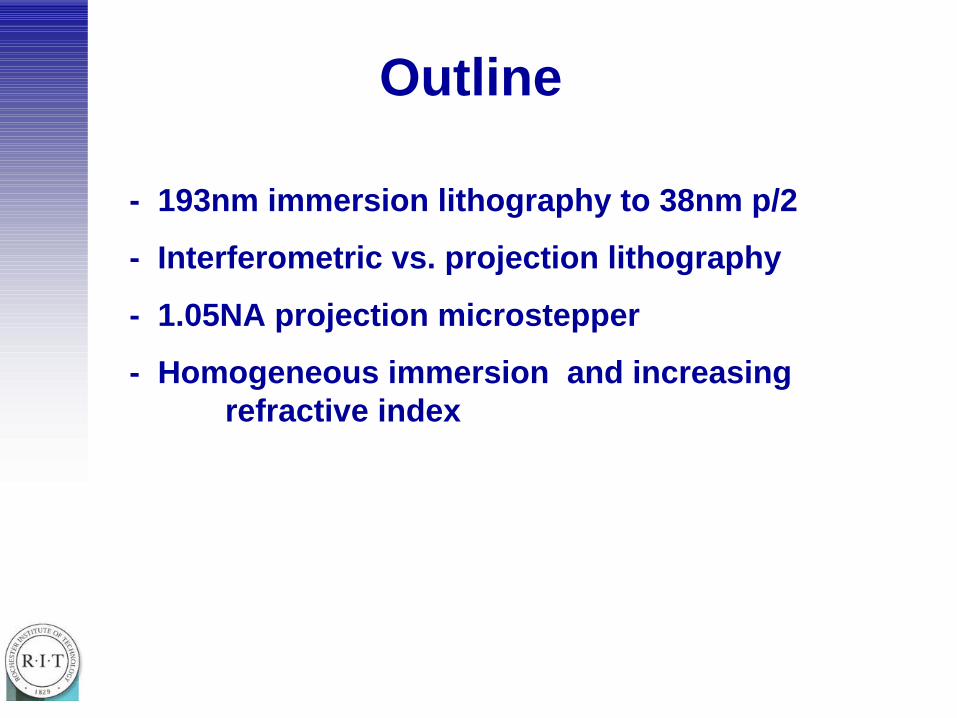
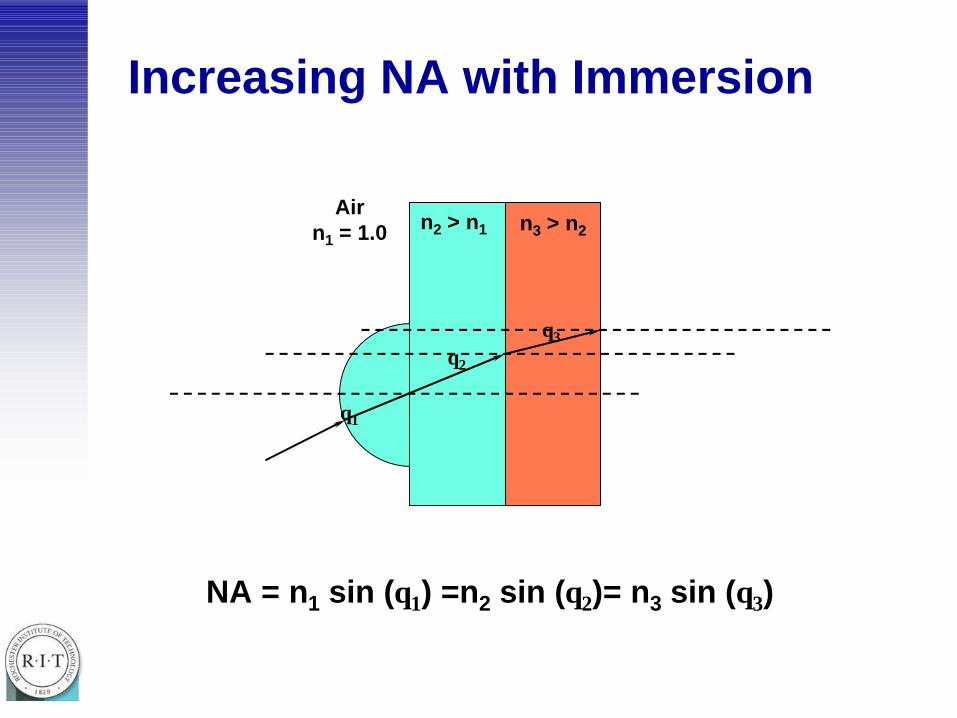
Increasing NA with Immersion
θ1
θ2
θ3
Airn1 = 1.0 n2 > n1 n3 > n2
NA = n1 sin (θ1) =n2 sin (θ2)= n3 sin (θ3)
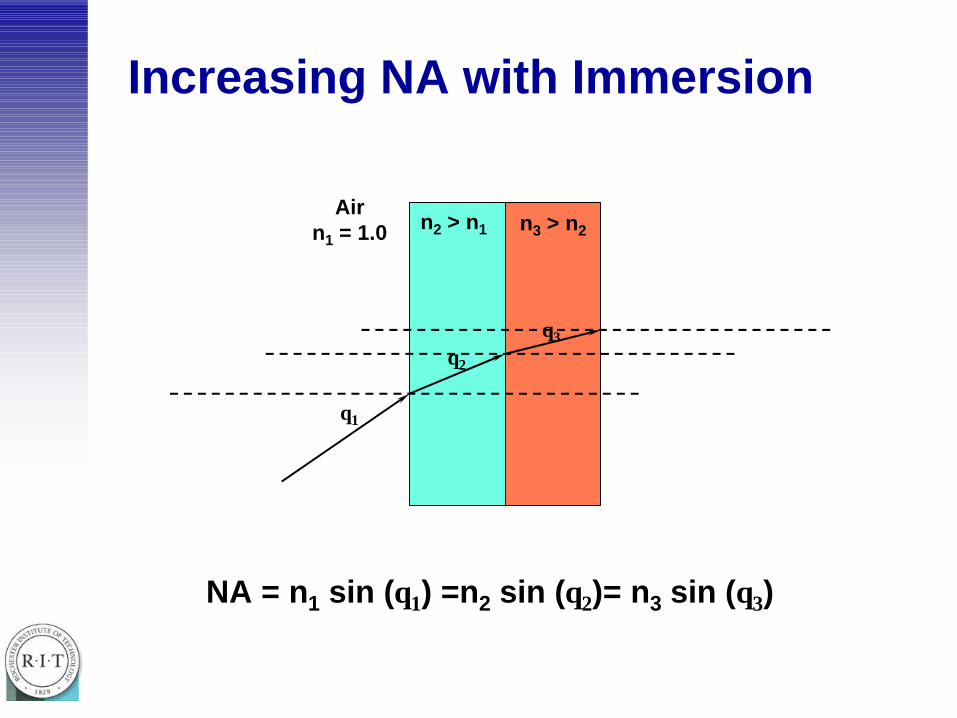
Increasing NA with Immersion
θ1
θ2
θ3
Airn1 = 1.0 n2 > n1 n3 > n2
NA = n1 sin (θ1) =n2 sin (θ2)= n3 sin (θ3)
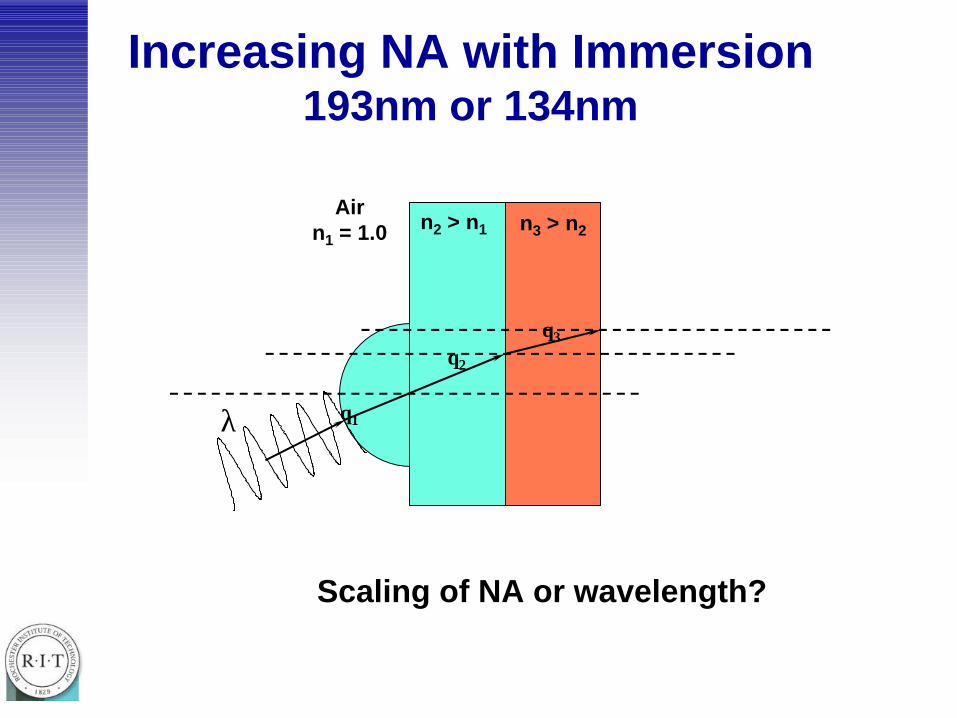
Increasing NA with Immersion193nm or 134nm
θ1
θ2
θ3
Airn1 = 1.0 n2 > n1 n3 > n2
λ
Scaling of NA or wavelength?
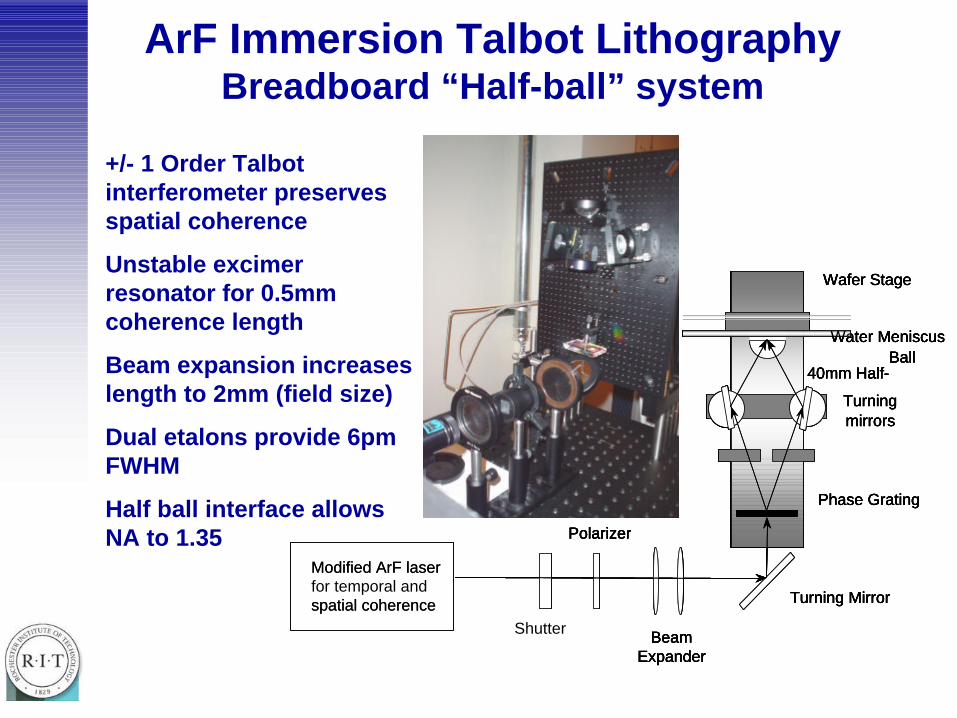
ArF Immersion Talbot LithographyBreadboard “Half-ball” system
+/- 1 Order Talbot interferometer preserves spatial coherence
Unstable excimer resonator for 0.5mm coherence length
Beam expansion increases length to 2mm (field size)
Dual etalons provide 6pm FWHM
Half ball interface allows NA to 1.35
Wafer Stage
40mm Half-Ball
Water Meniscus
Turning mirrors
Phase Grating
Turning Mirror
Polarizer
Beam Expander
Wafer Stage
40mm Half-Ball
Water Meniscus
Turning mirrors
Phase Grating
Turning Mirror
Shutter
Polarizer
Beam Expander
Modified ArF laserfor temporal and spatial coherence
Wafer Stage
40mm Half-Ball
Water Meniscus
Turning mirrors
Phase Grating
Turning Mirror
Polarizer
Beam Expander
Wafer Stage
40mm Half-Ball
Water Meniscus
Turning mirrors
Phase Grating
Turning Mirror
Polarizer
Beam Expander
Modified ArF laser
spatial coherence
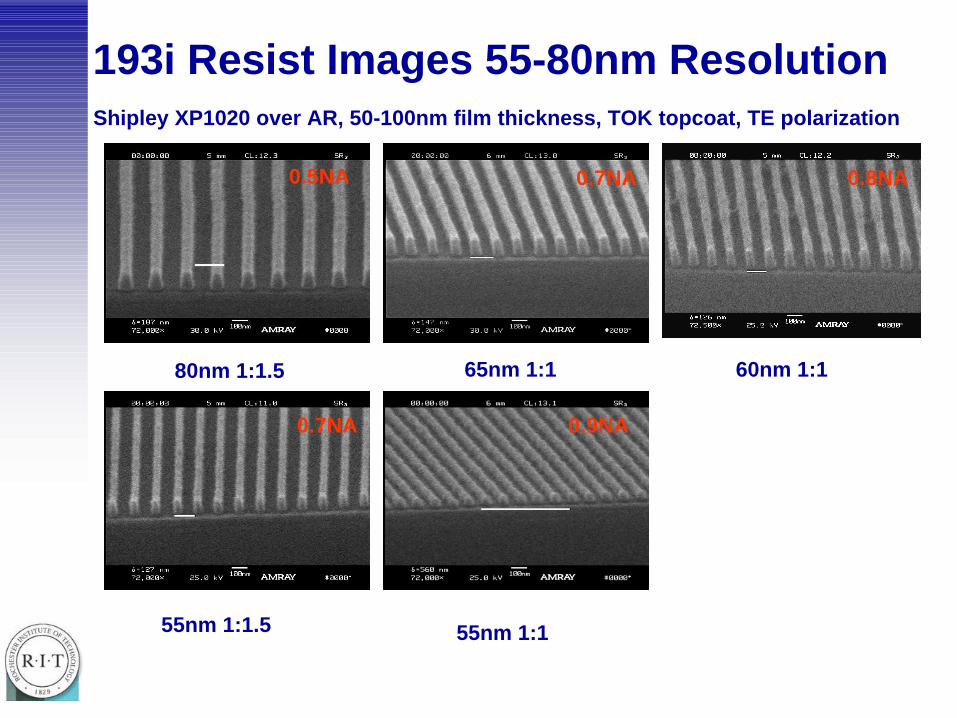
80nm 1:1.5
0.5NA
65nm 1:1
0.7NA
60nm 1:1
0.8NA
55nm 1:1.5
0.7NA
55nm 1:1
0.9NA
193i Resist Images 55-80nm ResolutionShipley XP1020 over AR, 50-100nm film thickness, TOK topcoat, TE polarization
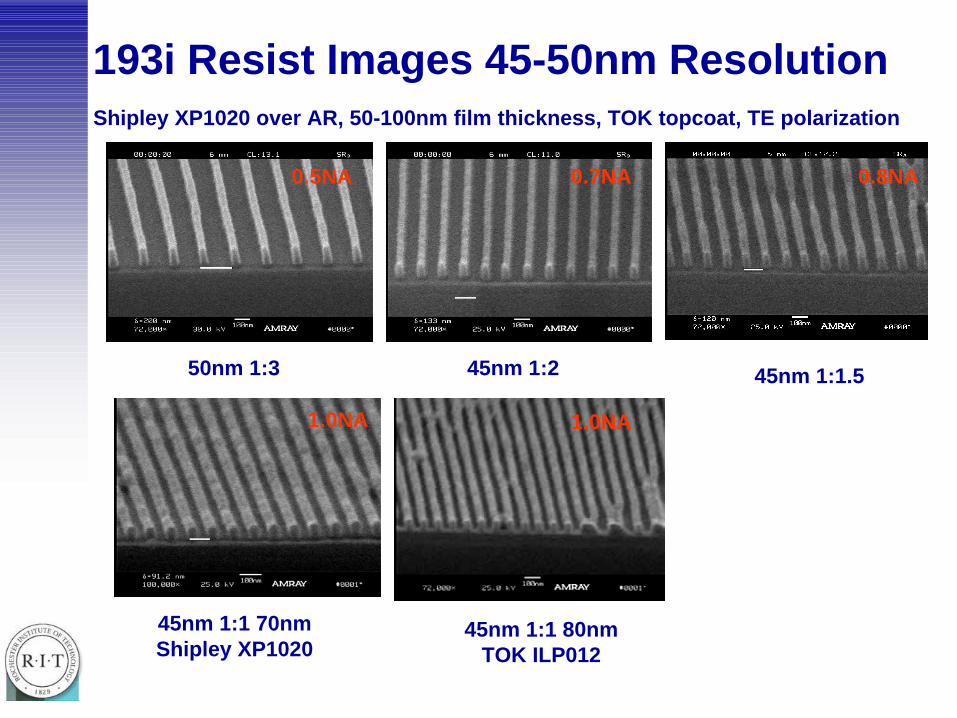
50nm 1:3
0.5NA
45nm 1:2
0.7NA
45nm 1:1.5
0.8NA
45nm 1:1 70nm Shipley XP1020
1.0NA
45nm 1:1 80nm TOK ILP012
1.0NA
193i Resist Images 45-50nm ResolutionShipley XP1020 over AR, 50-100nm film thickness, TOK topcoat, TE polarization
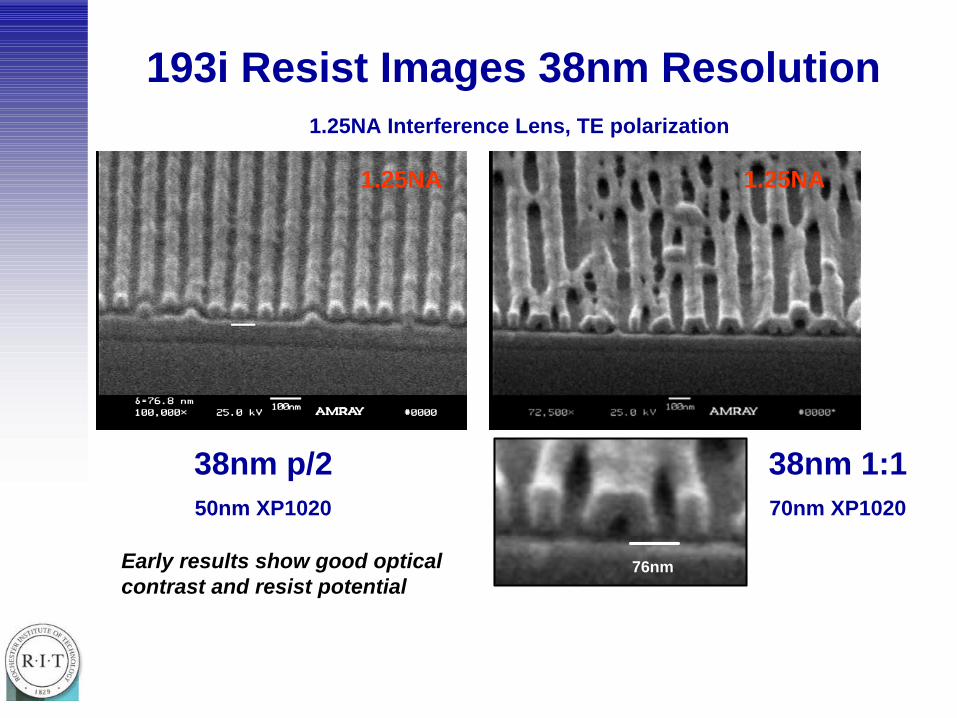
38nm p/250nm XP1020
38nm 1:170nm XP1020
1.25NA1.25NA
193i Resist Images 38nm Resolution1.25NA Interference Lens, TE polarization
76nmEarly results show good optical contrast and resist potential
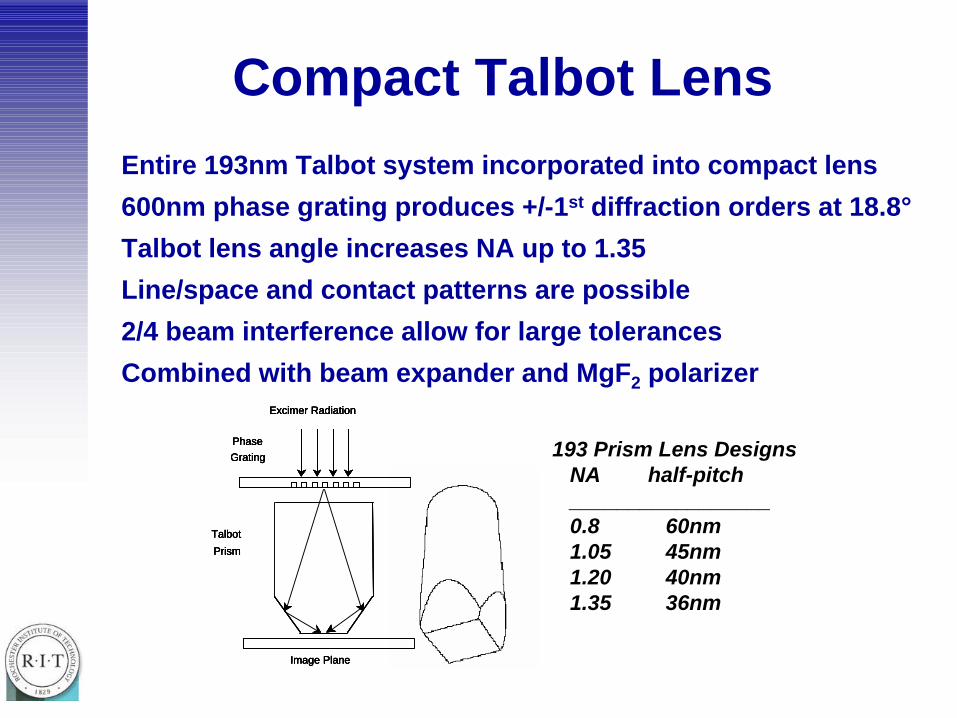
Compact Talbot LensEntire 193nm Talbot system incorporated into compact lens
600nm phase grating produces +/-1st diffraction orders at 18.8°
Talbot lens angle increases NA up to 1.35
Line/space and contact patterns are possible
2/4 beam interference allow for large tolerances
Combined with beam expander and MgF2 polarizer
193 Prism Lens DesignsNA half-pitch_________________0.8 60nm1.05 45nm1.20 40nm1.35 36nm
Excimer Radiation
Phase Grating
Talbot
Prism
Image Plane
Excimer Radiation
Phase Grating
Talbot
Prism
Image Plane
Excimer Radiation
Phase Grating
Talbot
Prism
Image Plane
Excimer Radiation
Phase Grating
Talbot
Prism
Image Plane
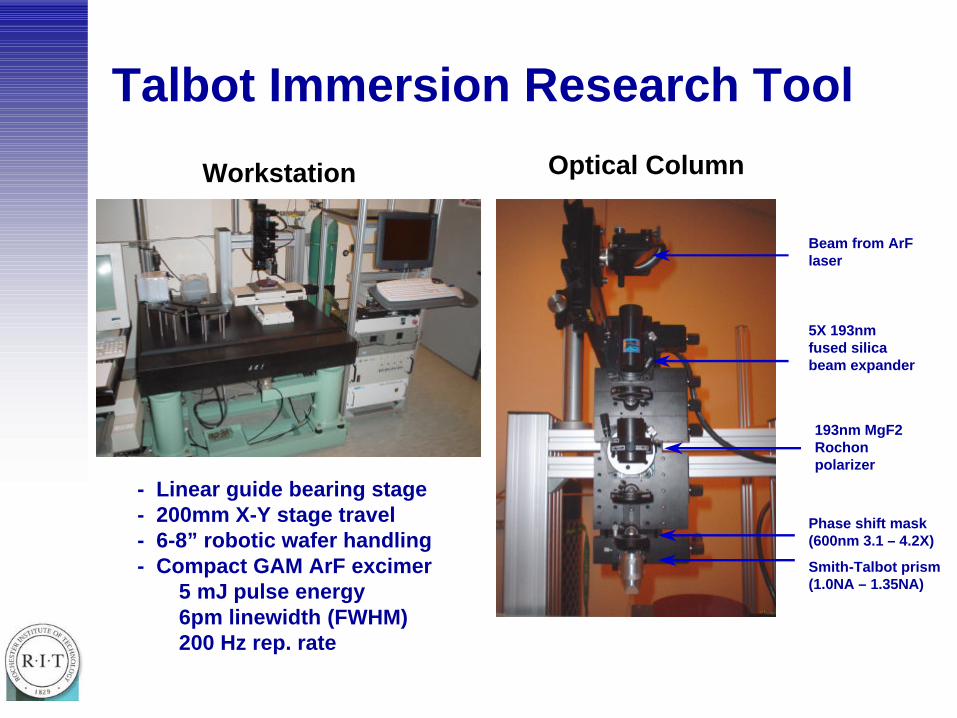
Talbot Immersion Research Tool
193nm MgF2 Rochonpolarizer
Smith-Talbot prism (1.0NA – 1.35NA)
Phase shift mask (600nm 3.1 – 4.2X)
5X 193nm fused silica beam expander
Beam from ArF laser
Optical ColumnWorkstation
- Linear guide bearing stage- 200mm X-Y stage travel- 6-8” robotic wafer handling- Compact GAM ArF excimer
5 mJ pulse energy6pm linewidth (FWHM)200 Hz rep. rate
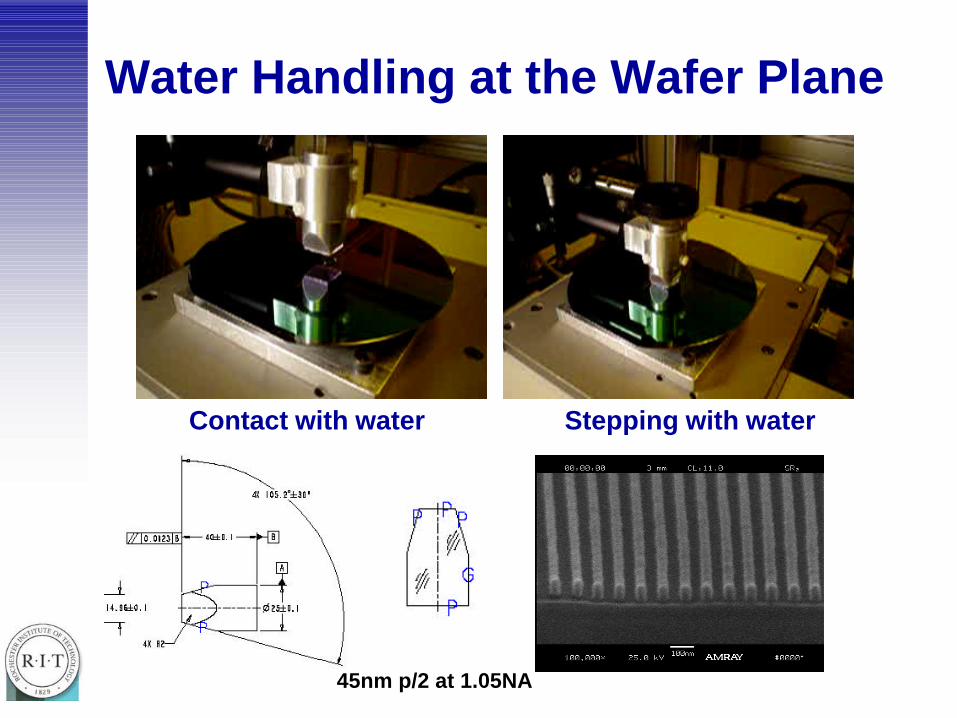
Water Handling at the Wafer Plane
Contact with water Stepping with water
45nm p/2 at 1.05NA
Interferometric Immersion vs. Projection Immersion Lithography
How well can 2-beam interference lithography predict projection
lithography?
0
0.1
0.2
0.3
0.4
0.5
0.6
0.7
0.8
0.9
Distance (nm)
Inte
nsity
in R
esis
t
0
0.1
0.2
0.3
0.4
0.5
0.6
0.7
0.8
Distance (nm)
Inte
nsity
in R
esis
t
0
0.1
0.2
0.3
0.4
0.5
0.6
0.7
0.8
Distance (nm)
Inte
nsity
in R
esis
t
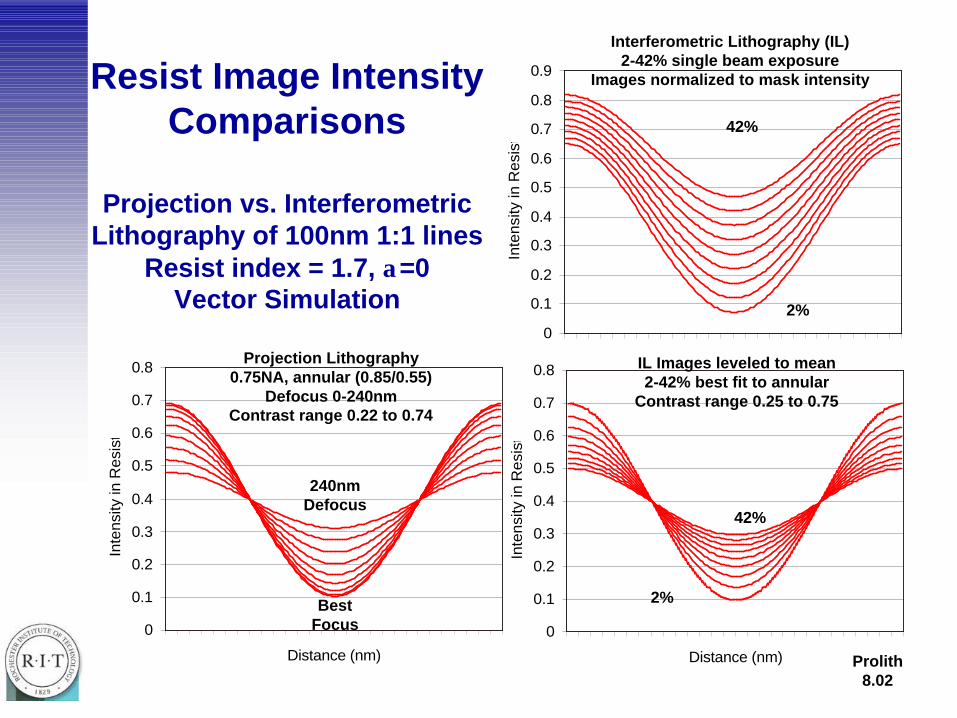
Interferometric Lithography (IL) 2-42% single beam exposure
Images normalized to mask intensityResist Image Intensity Comparisons
Projection vs. Interferometric Lithography of 100nm 1:1 lines
Resist index = 1.7, α=0Vector Simulation
IL Images leveled to mean2-42% best fit to annular
Contrast range 0.25 to 0.75
2%
42%
2%
42%
Projection Lithography0.75NA, annular (0.85/0.55)
Defocus 0-240nmContrast range 0.22 to 0.74
Best Focus
240nm Defocus
Prolith 8.02
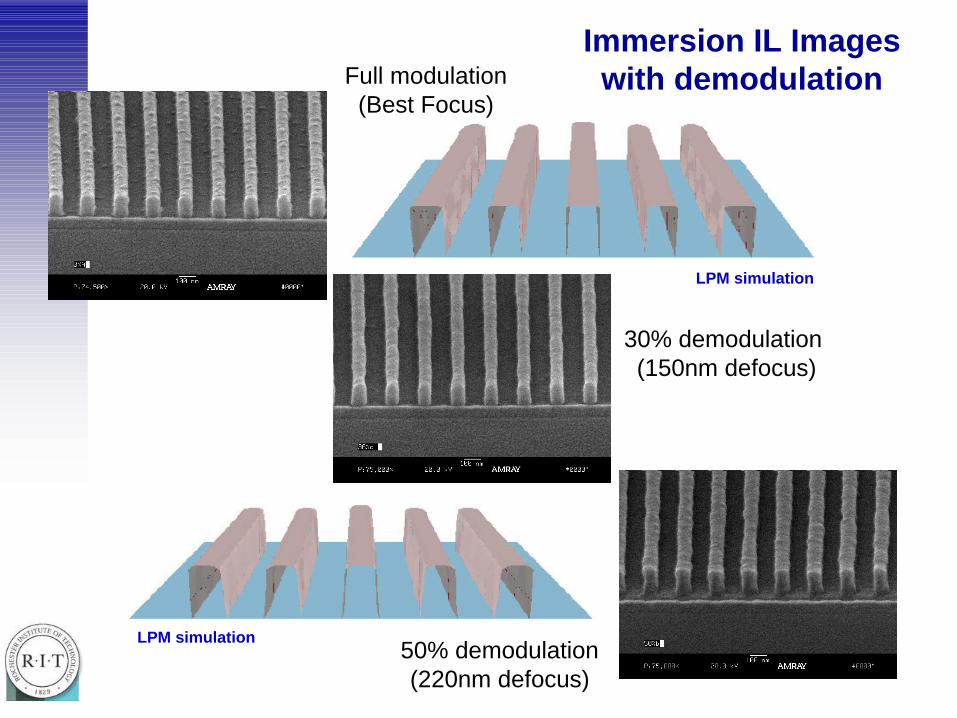
Full modulation(Best Focus)
30% demodulation (150nm defocus)
50% demodulation(220nm defocus)
LPM simulation
LPM simulation
Immersion IL Images with demodulation
0
0.1
0.2
0.3
0.4
0.5
0.6
0.7
0.8
0.9
1
Distance (nm)
Inte
nsity
in R
esis
t
0
0.2
0.4
0.6
0.8
1
1.2
Distance (nm)
Inte
nsity
in R
esis
t
0
0.2
0.4
0.6
0.8
1
1.2
Distance (nm)
Inte
nsity
in R
esis
t
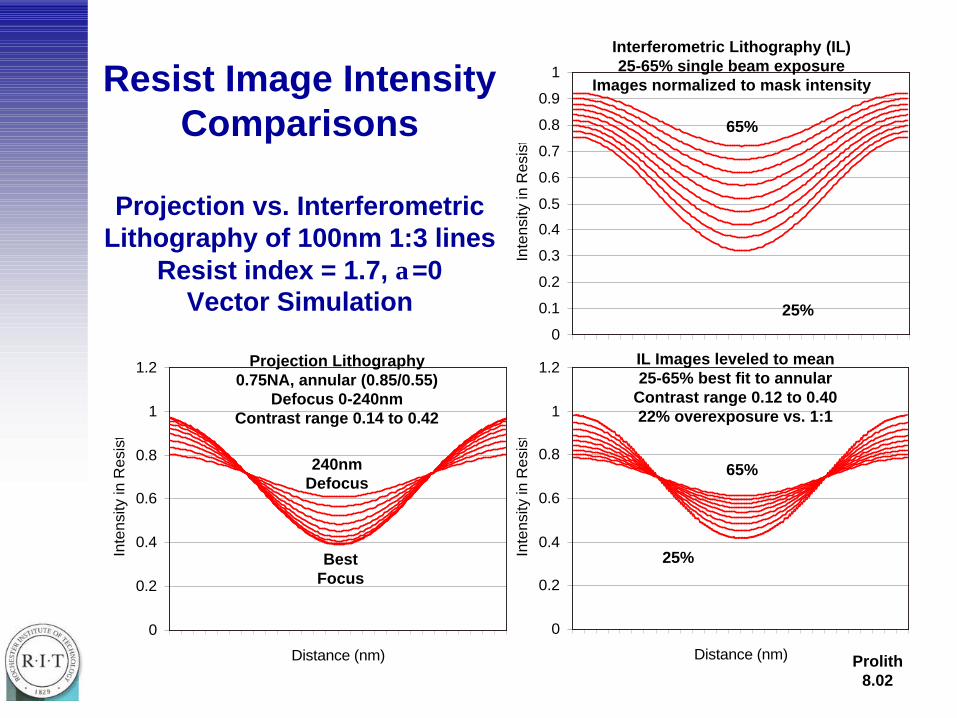
Interferometric Lithography (IL) 25-65% single beam exposure
Images normalized to mask intensityResist Image Intensity Comparisons
Projection vs. Interferometric Lithography of 100nm 1:3 lines
Resist index = 1.7, α=0Vector Simulation
IL Images leveled to mean25-65% best fit to annular
Contrast range 0.12 to 0.4022% overexposure vs. 1:1
25%
65%
25%
65%
Projection Lithography0.75NA, annular (0.85/0.55)
Defocus 0-240nmContrast range 0.14 to 0.42
Best Focus
240nm Defocus
Prolith 8.02
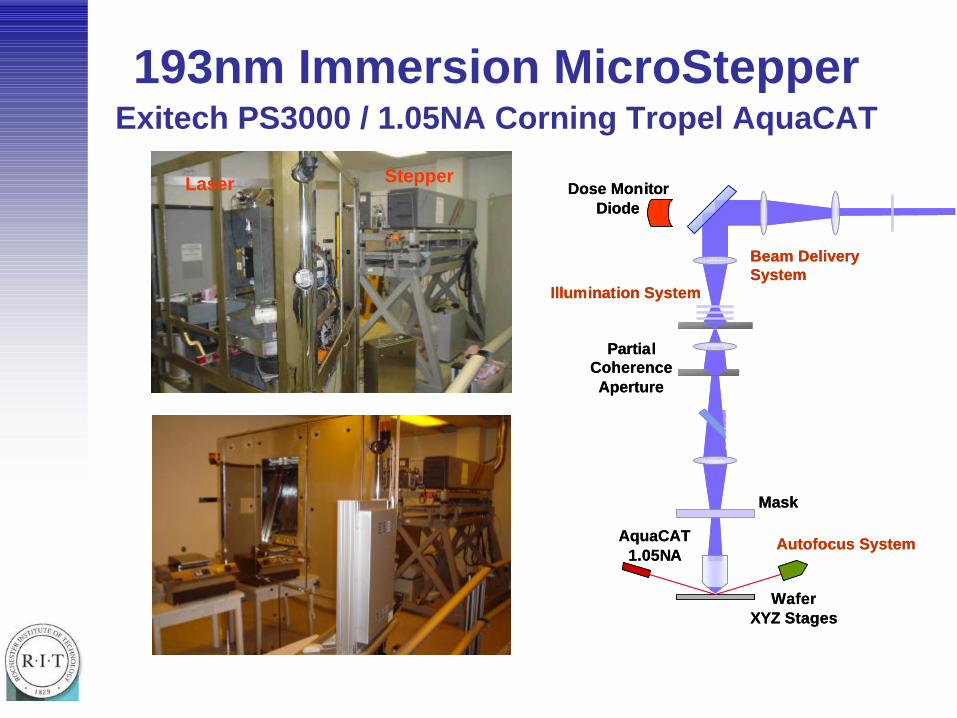
Illumination System
AquaCAT 1.05NA
WaferXYZ Stages
Mask
PartialCoherence Aperture
Switch-In Mirror
WaferXY Stages
Open FieldSystem
Beam Delivery System
Dose Monitor Diode
Autofocus System
Illumination System
AquaCAT 1.05NA
WaferXYZ Stages
Mask
PartialCoherence Aperture
Switch-In Mirror
WaferXY Stages
Open FieldSystem
Beam Delivery System
Dose Monitor Diode
Autofocus System
StepperLaser
193nm Immersion MicroStepperExitech PS3000 / 1.05NA Corning Tropel AquaCAT
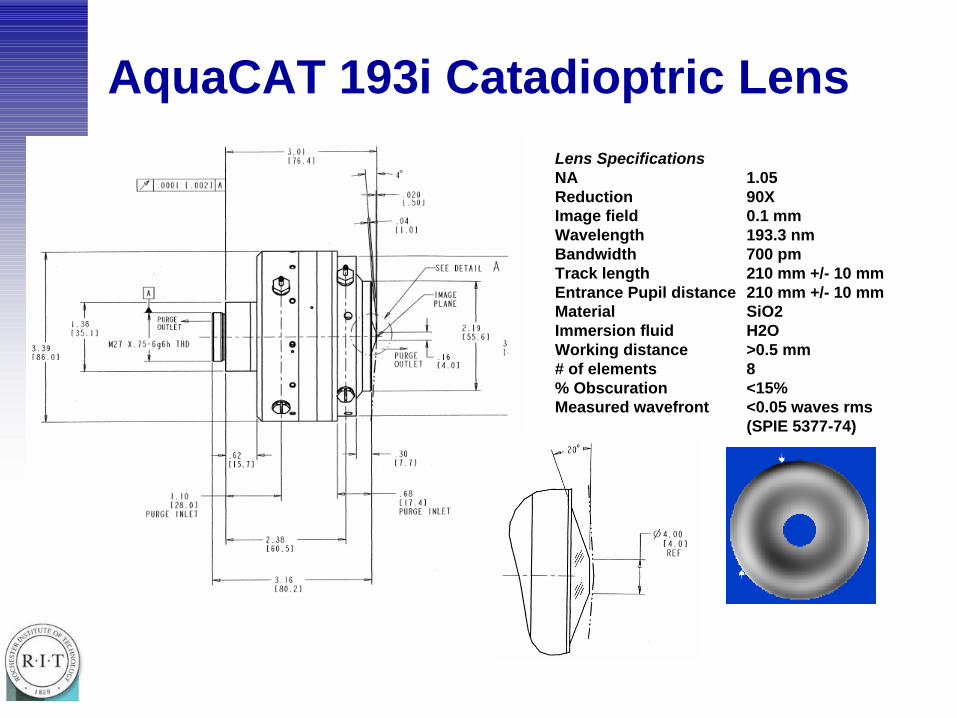
AquaCAT 193i Catadioptric LensLens SpecificationsNA 1.05 Reduction 90XImage field 0.1 mmWavelength 193.3 nmBandwidth 700 pmTrack length 210 mm +/- 10 mmEntrance Pupil distance 210 mm +/- 10 mmMaterial SiO2Immersion fluid H2OWorking distance >0.5 mm # of elements 8% Obscuration <15%Measured wavefront <0.05 waves rms
(SPIE 5377-74)
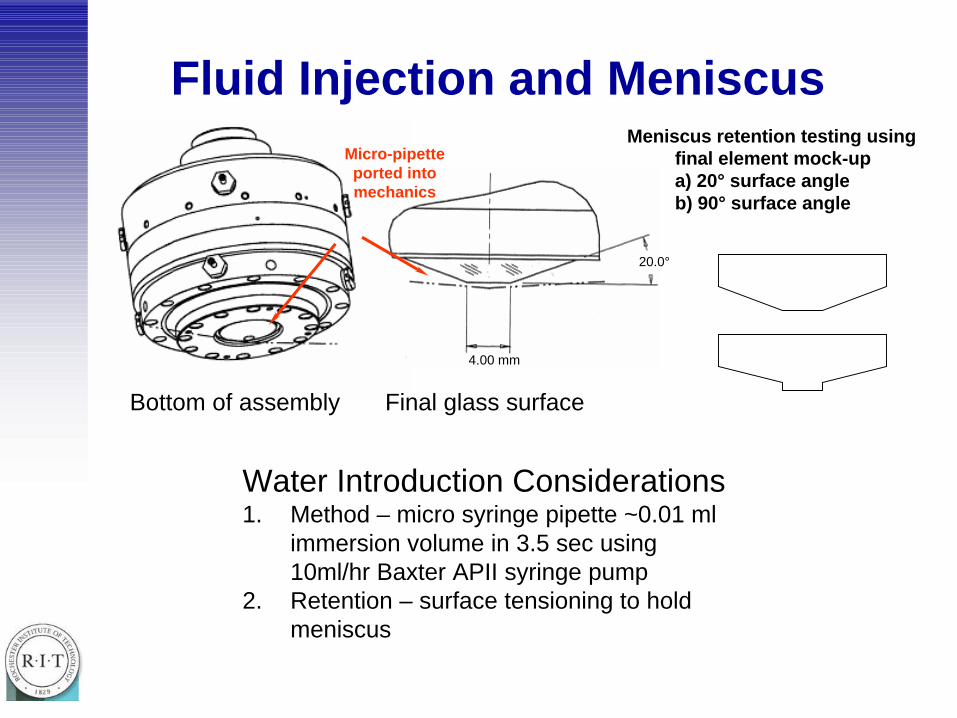
4.00 mm
20.0°
Final glass surfaceBottom of assembly
Water Introduction Considerations1. Method – micro syringe pipette ~0.01 ml
immersion volume in 3.5 sec using 10ml/hr Baxter APII syringe pump
2. Retention – surface tensioning to hold meniscus
Meniscus retention testing using final element mock-upa) 20° surface angleb) 90° surface angle
Micro-pipette ported into mechanics
Fluid Injection and Meniscus
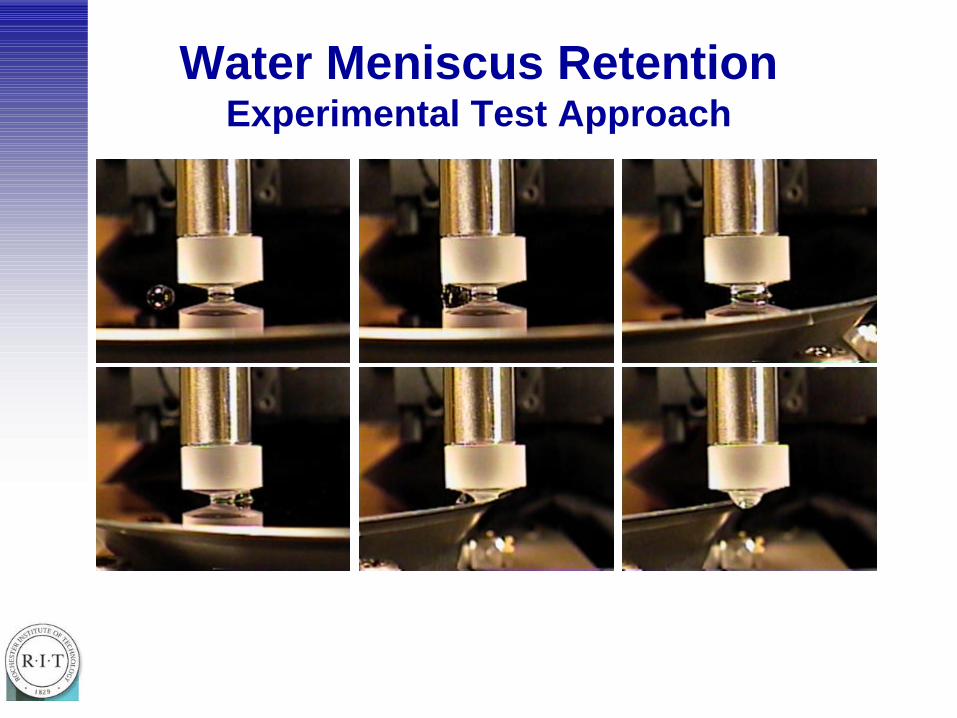
Water Meniscus RetentionExperimental Test Approach
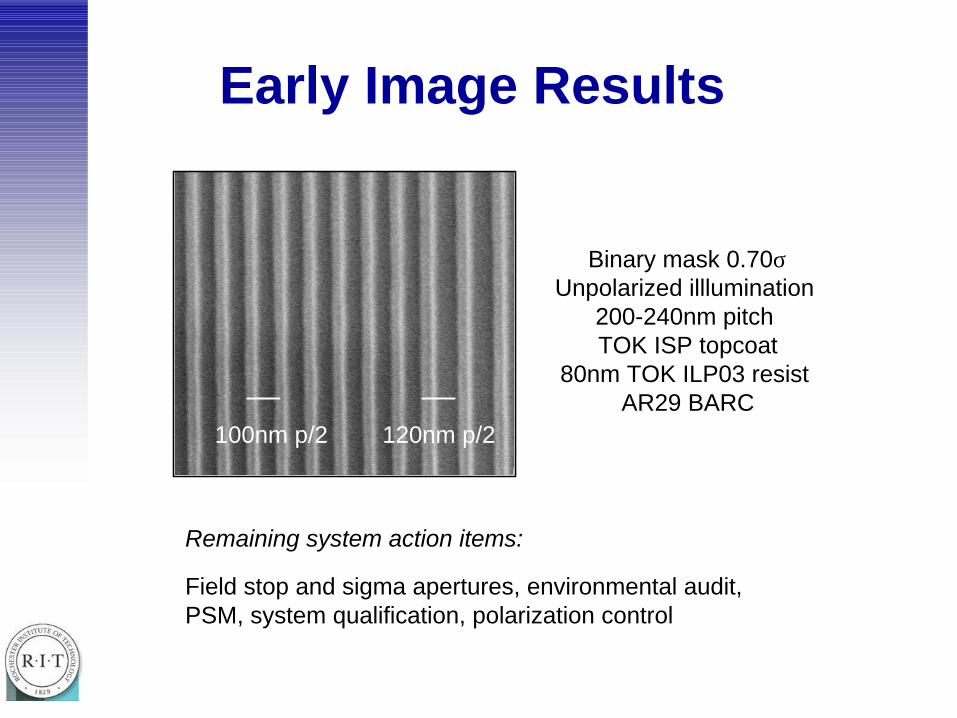
Early Image Results
Binary mask 0.70σUnpolarized illlumination
200-240nm pitch TOK ISP topcoat
80nm TOK ILP03 resist AR29 BARC
Remaining system action items:
Field stop and sigma apertures, environmental audit, PSM, system qualification, polarization control
100nm p/2 120nm p/2
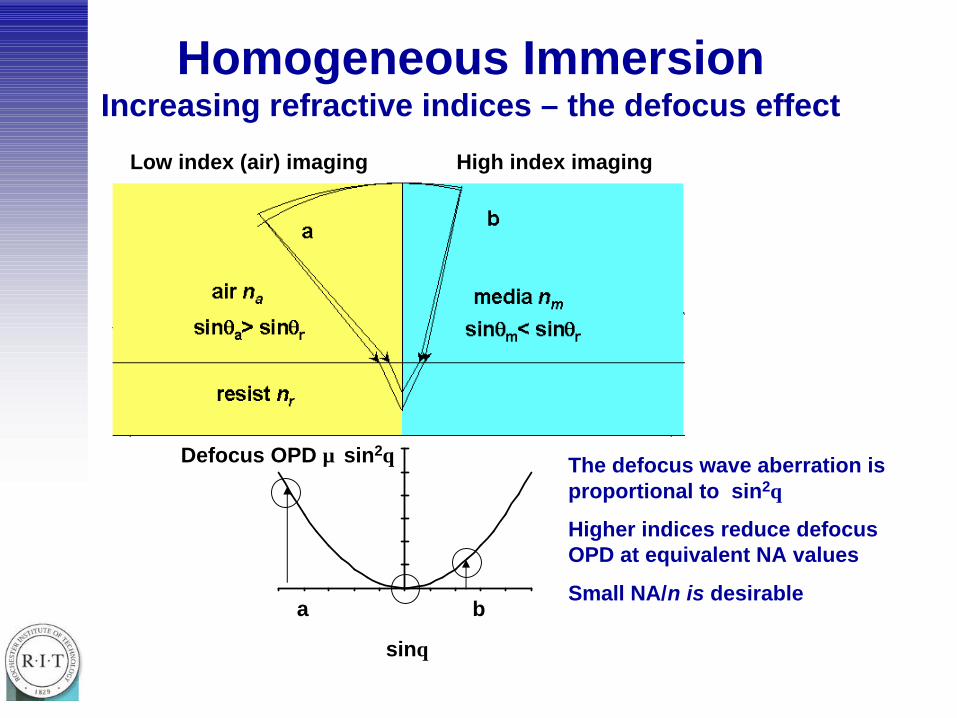
Homogeneous Immersion Increasing refractive indices – the defocus effect
Defocus OPD ∝ sin2θ
sinθ
ba
The defocus wave aberration is proportional to sin2θ
Higher indices reduce defocus OPD at equivalent NA values
Small NA/n is desirable
Low index (air) imaging High index imaging
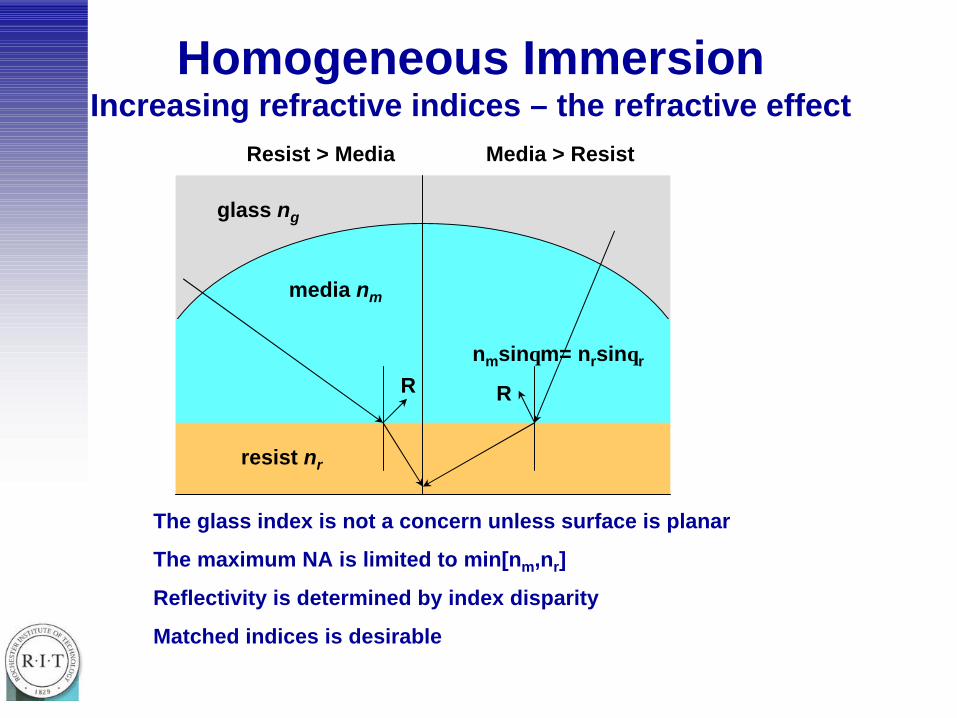
Homogeneous Immersion Increasing refractive indices – the refractive effect
Resist > Media Media > Resist
media nm
resist nr
glass ng
The glass index is not a concern unless surface is planar
The maximum NA is limited to min[nm,nr]
Reflectivity is determined by index disparity
Matched indices is desirable
nmsinθm= nrsinθr
RR
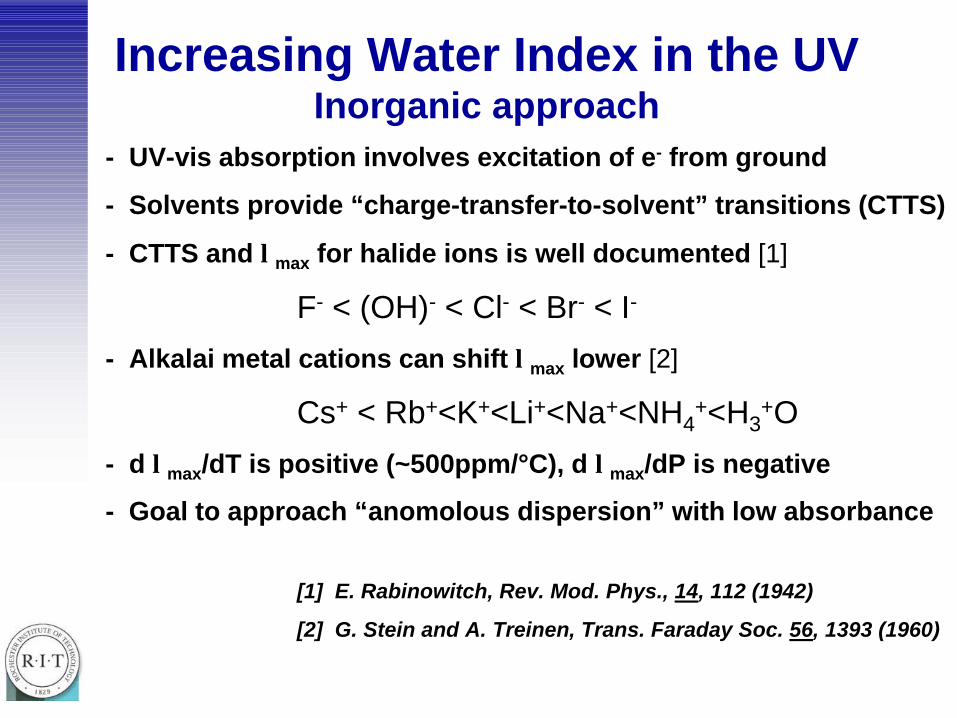
Increasing Water Index in the UVInorganic approach
- UV-vis absorption involves excitation of e- from ground
- Solvents provide “charge-transfer-to-solvent” transitions (CTTS)
- CTTS and λmax for halide ions is well documented [1]
F- < (OH)- < Cl- < Br- < I-
- Alkalai metal cations can shift λmax lower [2]
Cs+ < Rb+<K+<Li+<Na+<NH4+<H3
+O
- d λmax/dT is positive (~500ppm/°C), d λmax/dP is negative
- Goal to approach “anomolous dispersion” with low absorbance
[1] E. Rabinowitch, Rev. Mod. Phys., 14, 112 (1942)
[2] G. Stein and A. Treinen, Trans. Faraday Soc. 56, 1393 (1960)
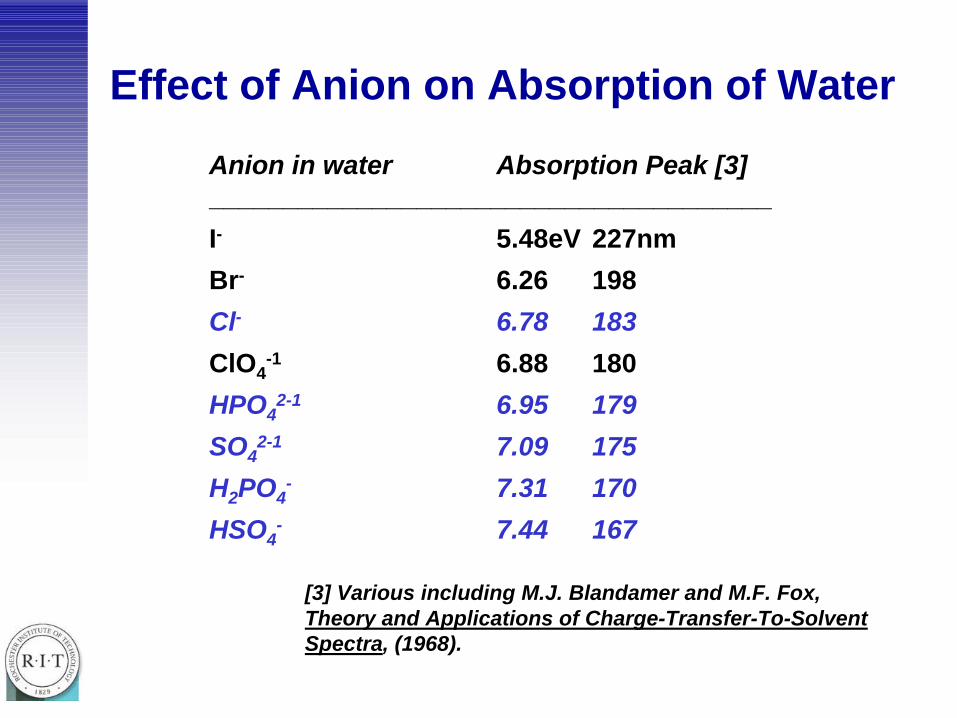
Effect of Anion on Absorption of Water
Anion in water Absorption Peak [3]______________________________________
I- 5.48eV 227nm
Br- 6.26 198
Cl- 6.78 183
ClO4-1 6.88 180
HPO42-1 6.95 179
SO42-1 7.09 175
H2PO4- 7.31 170
HSO4- 7.44 167
[3] Various including M.J. Blandamer and M.F. Fox, Theory and Applications of Charge-Transfer-To-Solvent Spectra, (1968).
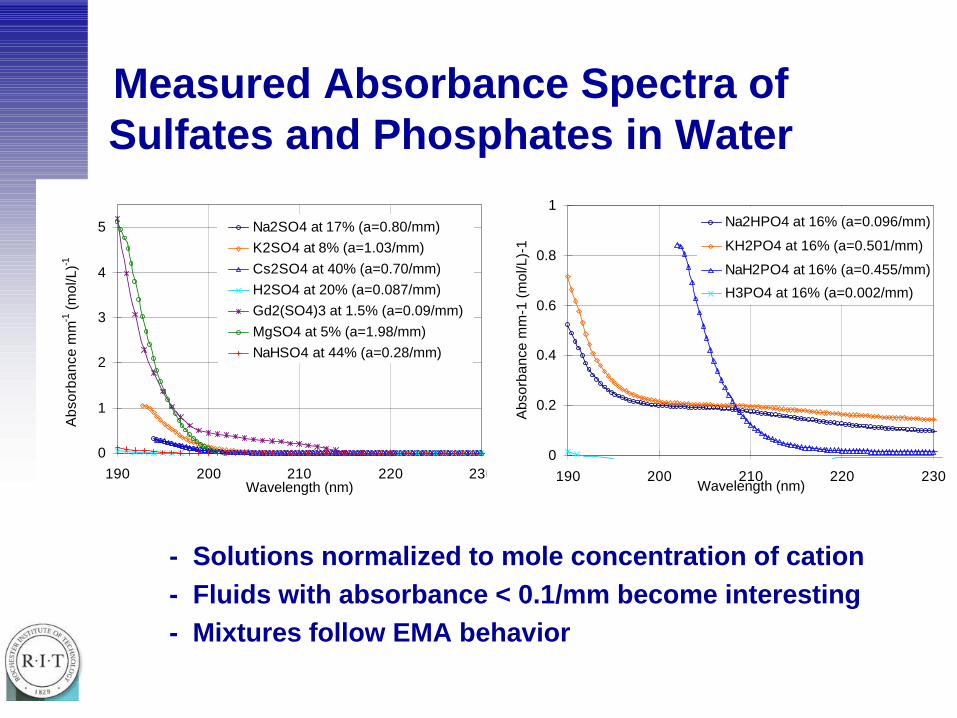
Measured Absorbance Spectra of Sulfates and Phosphates in Water
0
1
2
3
4
5
190 200 210 220 230Wavelength (nm)
Na2SO4 at 17% (a=0.80/mm)K2SO4 at 8% (a=1.03/mm)Cs2SO4 at 40% (a=0.70/mm)H2SO4 at 20% (a=0.087/mm)Gd2(SO4)3 at 1.5% (a=0.09/mm)MgSO4 at 5% (a=1.98/mm)NaHSO4 at 44% (a=0.28/mm)
Abs
orba
nce
mm
-1 (m
ol/L
)-1
0
0.2
0.4
0.6
0.8
1
190 200 210 220 230Wavelength (nm)
Abs
orba
nce
mm
-1 (m
ol/L
)-1
Na2HPO4 at 16% (a=0.096/mm)
KH2PO4 at 16% (a=0.501/mm)
NaH2PO4 at 16% (a=0.455/mm)
H3PO4 at 16% (a=0.002/mm)
- Solutions normalized to mole concentration of cation- Fluids with absorbance < 0.1/mm become interesting - Mixtures follow EMA behavior
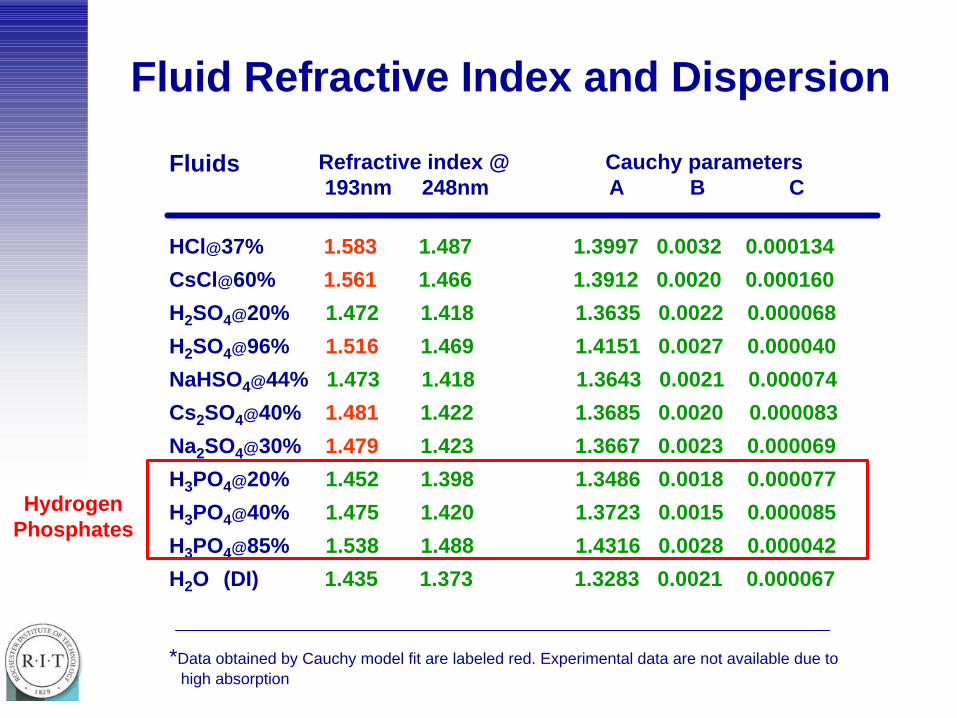
Fluid Refractive Index and Dispersion
Refractive index @ Cauchy parameters193nm 248nm A B C
HCl@37% 1.583 1.487 1.3997 0.0032 0.000134
CsCl@60% 1.561 1.466 1.3912 0.0020 0.000160
H2SO4@20% 1.472 1.418 1.3635 0.0022 0.000068
H2SO4@96% 1.516 1.469 1.4151 0.0027 0.000040
NaHSO4@44% 1.473 1.418 1.3643 0.0021 0.000074
Cs2SO4@40% 1.481 1.422 1.3685 0.0020 0.000083
Na2SO4@30% 1.479 1.423 1.3667 0.0023 0.000069
H3PO4@20% 1.452 1.398 1.3486 0.0018 0.000077
H3PO4@40% 1.475 1.420 1.3723 0.0015 0.000085
H3PO4@85% 1.538 1.488 1.4316 0.0028 0.000042
H2O (DI) 1.435 1.373 1.3283 0.0021 0.000067
Fluids
*Data obtained by Cauchy model fit are labeled red. Experimental data are not available due to high absorption
Hydrogen Phosphates
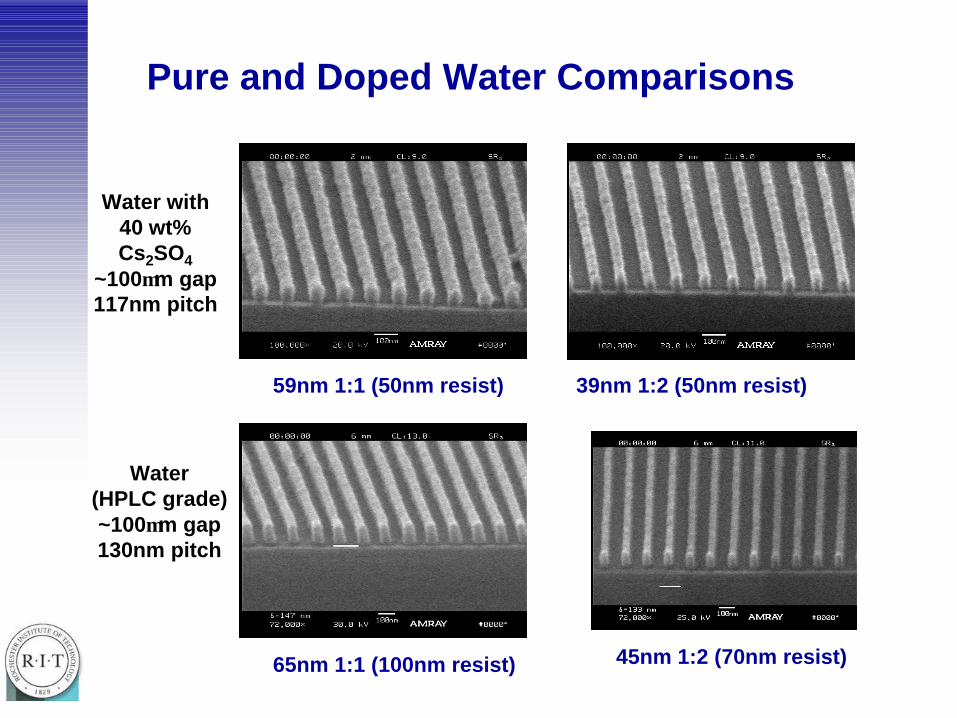
Pure and Doped Water Comparisons
59nm 1:1 (50nm resist) 39nm 1:2 (50nm resist)
65nm 1:1 (100nm resist) 45nm 1:2 (70nm resist)
Water (HPLC grade)~100µm gap130nm pitch
Water with40 wt% Cs2SO4
~100µm gap117nm pitch
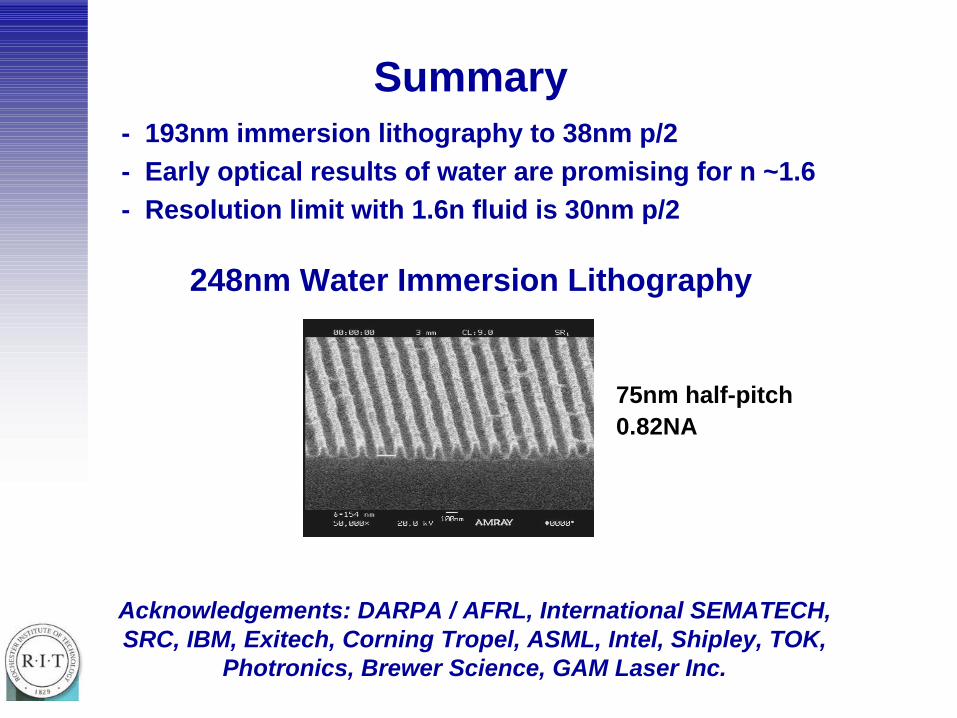
Summary- 193nm immersion lithography to 38nm p/2- Early optical results of water are promising for n ~1.6 - Resolution limit with 1.6n fluid is 30nm p/2
248nm Water Immersion Lithography
75nm half-pitch0.82NA
Acknowledgements: DARPA / AFRL, International SEMATECH, SRC, IBM, Exitech, Corning Tropel, ASML, Intel, Shipley, TOK,
Photronics, Brewer Science, GAM Laser Inc.