Embed Size (px)
Citation preview

Approaching Process Mining with Sequence Clustering:
Experiments and Findings
Diogo Ferreira1,3, Marielba Zacarias2,3, Miguel Malheiros3, Pedro Ferreira3
1 IST – Technical University of Lisbon, Taguspark, Portugal 2 Universidade do Algarve, ADEEC-FCT, Faro, Portugal
3 Organizational Engineering Center, INOV, Lisbon, Portugal
[email protected], [email protected], {miguel.malheiros, pedro.romeu}@gmail.com
Abstract. Sequence clustering is a technique of bioinformatics that is used to
discover the properties of sequences by grouping them into clusters and assigning
each sequence to one of those clusters. In business process mining, the goal is
also to extract sequence behaviour from an event log but the problem is often
simplified by assuming that each event is already known to belong to a given
process and process instance. In this paper, we describe two experiments where
this information is not available. One is based on a real-world case study of
observing a software development team for three weeks. The other is based on
simulation and shows that it is possible to recover the original behaviour in a
fully automated way. In both experiments, sequence clustering plays a central
role.
Keywords. Process Mining, Sequence Clustering, Task Identification, Process
Discovery, Workflow Logs
1 Introduction
In bioinformatics, sequence clustering algorithms have been used to automatically
group large protein datasets into different families [12,13], to search for protein
sequences that are homologous to a given sequence [17], and to map or align a given
DNA sequence to an entire genome [20], to cite only some of the most common
applications. In all of these applications, sequence clustering becomes a valuable tool
to gain insight into otherwise seemingly senseless sequences of data.
A similar kind of challenge arises in process mining, where the goal is to extract
meaningful task sequences from an event log, usually resorting to special-purpose
algorithms that can recover the original workflow that produced the log [1].
The idea of applying sequence clustering to process mining comes at a time when
process mining is still heavily dependent on the assumption that the event log contains
“sufficient” information [4], i.e., that each event in the log is clearly associated with a
specific activity and case (process instance) [1]. This comes as a major disadvantage
since (1) the classes of information systems that are able to generate such logs are
restricted to process-aware systems, and (2) it becomes impossible to apply and benefit
from process mining in scenarios where the log data is not available in that form.

2 Diogo Ferreira, Marielba Zacarias, Miguel Malheiros, Pedro Ferreira
A sequence clustering approach can alleviate these requirements by grouping similar
sequences and identifying typical ones without the need to provide any input
information about the business logic. Of course, the results will bear a degree of
uncertainty, whereas process mining approaches typically aim at finding exact models.
Still, sequence clustering can provide valuable insight into the kind of sequences that
are being executed.
The paper is structured as follows: section 2 provides an overview of process mining
approaches, and section 3 presents the sequence clustering algorithm. Then sections 4
and 5 describe two different experiments and report on the problems encountered and
the results obtained.
2 Process mining approaches
In general, all process mining approaches take an event log as input and as a starting
point for the discovery of underlying processes. The event log (also called process trace
or audit trail) is list of records resulting from the execution of some process. For the log
to be “minable”, each record usually contains information about the activity that was
executed, the process instance that it belongs to, and the time of execution. The
requirements on the log, i.e. the kind of information it should contain, varies according
to the process mining algorithm being used.
In fact, it is the choice of mining algorithms that often leads to different process
mining approaches. Some of the algorithms used for process mining include:
• the α-algorithm [4] – an algorithm that is able to re-create the Petri-net workflow
from the ordering relations found in the even log. For the algorithm to work, the log
must contain the process instance identifier (case id) and it must be rather complete
in the sense that all ordering relations should be present in the log.
• inference methods [8] – a set of three different algorithms used to infer a finite state
machine (FSM) from an event log, where the log is regarded as a simple sequence of
symbols. The three algorithms represent different levels of compromise between
accuracy and robustness to noise. The MARKOV algorithm, inspired by Markov
models, seems to be the most promising. The algorithm works by building up an
event graph as the result of considering Markov chains with increasing order. In the
last step, the graph is converted to a FSM, which represents the process that was
found.
• directed acyclic graphs [5] – an algorithm that is able to generate a dependency
graph from a workflow system log. The log must contain a relatively high number of
executions of the same process so that the dependency graph for that process can be
completely built. Originally, the algorithm was proposed to support the adoption of
workflow systems rather than actually pursuing process mining.
• inductive workflow acquisition [16] – an approach in which the goal is to find a
hidden markov model (HMM) that best represents the structure of the original
process. The HMM can be found by either top-down or bottom-up refinement of an
initial HMM structure; these are known as model splitting and model merging

Approaching Process Mining with Sequence Clustering: Experiments and Findings 3
algorithms, respectively. The initial HMM structure is built directly from the log,
which is regarded as a simple sequence of symbols. Reported results suggest that
model splitting is faster and more accurate than model merging.
• hierarchical clustering [14] – an algorithm that, given a large set of execution traces
of a single process, separates them into clusters and finds the dependency graph
separately for each cluster. The clusters of workflow traces are organized into a tree,
hence the concept of model hierarchy. After the workflow models for the different
clusters have been found, a bottom-up pass through the tree generalizes them into a
single one.
• genetic algorithm [2] – an algorithm in which several candidate solutions are
evaluated by a fitness function that determines how consistent each solution is with
the log. Every solution is represented by a causal matrix, i.e. a map of the input and
output dependencies for each activity. Candidate solutions are generated by
selection, crossover and mutation as in typical genetic algorithms. The search space
is the set of all possible solutions with different combinations of the activities that
appear in the event log. The log should contain a relatively high number of
execution traces.
• instance graphs [10] – an approach that aims at portraying graphical representations
of process execution, especially using Event-driven Process Chains (EPCs). For
each execution trace found in the log, an instance graph is obtained for that process
instance. In order to identify possible parallelism, each instance graph is constructed
using the dependencies found in the entire log. Several instance graphs can then be
aggregated in order to obtain the overall model for that log [11].
In general, as far as input data is concerned, all these algorithms require an event log
that contains several, if not a very large number, of execution traces of the same
process instance. (An exception is the RNET algorithm used in [8] which can receive a
single trace as training input, but the results can vary widely depending on that given
input sequence.) Because the log usually contains the traces of multiple instances, it is
also required to have labelling field – usually called the case id [1] – which specifies
the process instance for every recorded event.
Another requirement on the content of the event log is that, for algorithms such as
[4] and [10], which rely on finding causal relations in the log, task A can be considered
the cause of task B only if B follows A but A never follows B in the log. Exceptional
behaviour, errors or special conditions that would make A appear after B could ruin the
results. These conditions are referred to as noise; algorithms that are able to withstand
noise are said to be robust to noise [3]. Most algorithms can become robust to noise by
discarding causal relations with probability below a given threshold; this threshold is
usually one of the algorithm parameters.
The problem with these requirements is that they may be difficult to apply in many
potential scenarios for process mining. For example, in some applications the case id
may be unavailable if the log is just an unclassified stream of recorded events. In other
applications, it may be useful to clearly identify and distinguish normal behaviour from
exceptional one, without ruling out small variations simply as noise. These issues
suggest that other kind of algorithms could provide valuable insight into the original
behaviour that produced the log. If there is no case id available, and there is an

4 Diogo Ferreira, Marielba Zacarias, Miguel Malheiros, Pedro Ferreira
unpredictable amount of ad-hoc behaviour, then an algorithm that allows us to sort out
and understand that behaviour could be the first step before actually mining those
processes. Sequence clustering algorithms are a good candidate for this job.
3 Sequence clustering
Sequence clustering is a collection of methods that aim at partitioning a number of
sequences into meaningful clusters or groups of similar sequences. The development of
such methods has been an active field of research especially in connection with
challenges in bioinformatics [7]. Here we will present the basic principles by referring
to a simple sequence clustering algorithm based on first-order Markov chains [6].
In this algorithm, each cluster is associated with a first-order Markov chain, where
the current state depends only on the previous state. The probability that an observed
sequence belongs to a given cluster is in effect the probability that the observed
sequence was produced by the Markov chain associated with that cluster. For a
sequence x = {x0, x1, x2,…,xL-1} of length L this can be expressed simply as:
p (x | ck) = p (x0 , ck) . ∏1
1
−=
=
Li
i p (xi | xi-1 , ck) (1)
where p(x0 , ck) is the probability of x0 occurring as the first state in the Markov chain
associated with cluster ck and p(xi|xi-1 , ck) is the transition probability of state xi-1 to
state xi in that same Markov chain. Given the way to compute p(x|ck), the sequence
clustering algorithm can be implemented as an extension to the well-known
Expectation-Maximization (EM) algorithm [9]. The steps are:
1. Initialize the model parameters p(x0 , ck) and p(xi|xi-1 , ck) randomly, i.e. for each
cluster the state transition probabilities of the associated Markov chain are
initialized at random.
2. Using the current model parameters, assign each sequence to each cluster with a
probability given by equation (1).
3. Use the results of step 2 to re-estimate the model parameters, i.e. recalculate the
state transition probabilities of each Markov chain based on the sequences that
belong to that cluster.
4. Repeat steps 2 and 3 until the mixture model converges.
This sequence clustering algorithm has been implemented in Microsoft SQL Server
2005® [19] and is readily available for use either programmatically via an OLE DB for
Data Mining interface [18] or via a user-friendly interface in Microsoft Visual Studio
2005®.
In either case, the algorithm must be provided with two input tables: a case table and
a nested table. The case table contains one record for each sequence; it conveys the
number of sequences in the input data set together with some descriptive information
about each sequence. The nested table contains the steps for all sequences, where each
step is numbered and labelled. The number is the order of occurrence within the
sequence, and the label is a descriptive attribute that denotes the state in a Markov
chain. The case and nested tables share a one-to-many relationship: each sequence in
the case table is associated with several steps in the nested table. The connecting

Approaching Process Mining with Sequence Clustering: Experiments and Findings 5
attribute, which is application-specific, serves as key in the case table and as sequence
scope delimiter in the nested table.
For the sake of clarity, let us consider a simple example. Suppose the members of a
given family have different ways of zapping through TV channels according to their
own interests. Let us assume that each member always finds the TV switched off, and
after turning it on, goes through a set of channels before turning it off again. Every time
it is turned on, the TV generates a new session identifier (session id) and records both
session-related information as well as the sequence of channel changes. Figure 1 shows
the case and nested tables for this scenario. The session identifier is both the key to the
case table and the sequence scope delimiter for the nested table. The case table contains
descriptive, non-sequence attributes about each session, whereas the nested table
contains the steps for each sequence, both numbered and labelled.
(a) (b)
Fig. 1. Case (a) and nested (b) tables for the simple TV usage scenario
It can be seen from this simple example that the input data to be provided to the
sequence clustering algorithm already has a form of case id, which is the session
identifier. Pre-processing techniques will have to be used to assign this case id if it is
not available in the first place. We will look at this problem ahead in the context of two
different experiments. What is interesting to note here is the kind of results that the
sequence clustering algorithm is able to produce. Figure 2 shows four of the clusters
that the algorithm was able to identify from a given set of 24 sequences for the simple
TV usage scenario. Each cluster has a different Markov chain that is able to generate
the sequences assigned to that cluster. This effectively captures the dominant behaviour
of similar sequences.
Fig. 2. The Markov chains in four of the clusters obtained for the simple TV usage scenario.

6 Diogo Ferreira, Marielba Zacarias, Miguel Malheiros, Pedro Ferreira
The number of clusters to be found can be set manually or automatically by letting
the algorithm perform a heuristic to determine the number of clusters for the given
data. This is usually very useful to use as an initial guess before trying to run the
algorithm with different parameters.
To produce the results shown in figure 2 the algorithm performed a number of
iterations, where each iteration comprises two steps: the expectation step and the
maximization step. In the expectation step the algorithm assigns each sequence x to the
cluster ck that gives the highest membership probability p(x|ck) according to equation
(1). Once this step is complete, the algorithm has a provisional estimate of which
sequences belong to which cluster. In the maximization step the algorithm re-computes
the transition probabilities p(xi|xi-1,ck) for each cluster ck based on the sequences that
belong to that cluster. After the maximization step, the next expectation step will
produce different results from the previous iteration, since p(x|ck) will now be
computed with the updated values of p(xi|xi-1,ck). The algorithm converges when there
is no change in the values of these model parameters.
4 Experiment #1: Mining human activity observations
The first experiment is taken from a research project that aims at discovering recurrent
action patterns from action repositories [25]. This experiment was motivated by the
difficulties encountered in the manual extraction of action patterns for log sizes of a
few hundred actions. Thus, the aim was to test the ability of the sequence clustering
algorithm to support manual identification of recurrent action sequences from action
logs, where no information of the sequence associated with each individual action was
available. Rather than finding Markov chains, the goal here was to evaluate the
soundness of the sequence clusters provided by the algorithm.
The experimental data represents the actions of a software development team
comprising four software developers and a project leader [24]. The team develops web
applications and performs systems analysis, design, programming, test and
maintenance activities. The action log was collected within an observation period of
three weeks, during which the team members performed tasks on the following
applications: (1) Suppliers, (2) Claims, (3) Customer Correspondence (called Mail
application), (4) Evictions and (5) Marketing Campaigns. The team leader performed
both system development and project management tasks.
Team observation was carried out by its own members by registering their actions
and interactions in chronological order1. Both computer- and non-computer-supported
actions and interactions were registered, each by means of a summarizing sentence.
These sentences were first parsed using grammatical rules to separate the subject and
predicate (verb and its complements). Synonym verbs were replaced by a single verb to
avoid inconsistencies. Each action and interaction description was augmented with a
set of application, information and human resources involved. The results were further
1 For details on the modeling concepts of action, interaction and context please refer to [21].
Approaching Process Mining with Sequence Clustering: Experiments and Findings 7
structured as described in [23] into an event table as shown in figure 3. The data
collected over three weeks led to a table with 534 entries.
Fig. 3. Examples of structured actions and interactions collected during observation [22]
By identifying the action contexts of each actor [23] it was possible to group events
that belong to the same or to intimately related tasks. This grouping into contexts can
be done manually or, in case of large data sets, applying a clustering algorithm can
provide a good starting point [22]. For the team leader alone, 12 different action
contexts have been identified. Given the chronological order of events within each
personal context and the interactions that took place between actors, it was possible to
determine the sequences of events that took place across actors. This led to a number of
rather long sequences, which were then broken down into shorter, scope-delimited
tasks. About 140 tasks were found.
A brief analysis these task sequences revealed two issues. The first was that some of
these tasks were not actually sequences, but just arbitrary repetitions of the same
action. For example, all team members had at least one task in which they repeated the
action “program” from 2 to 20 times. Therefore, consecutive repeating steps within
each sequence were eliminated, and sequences ending up with just one single step were
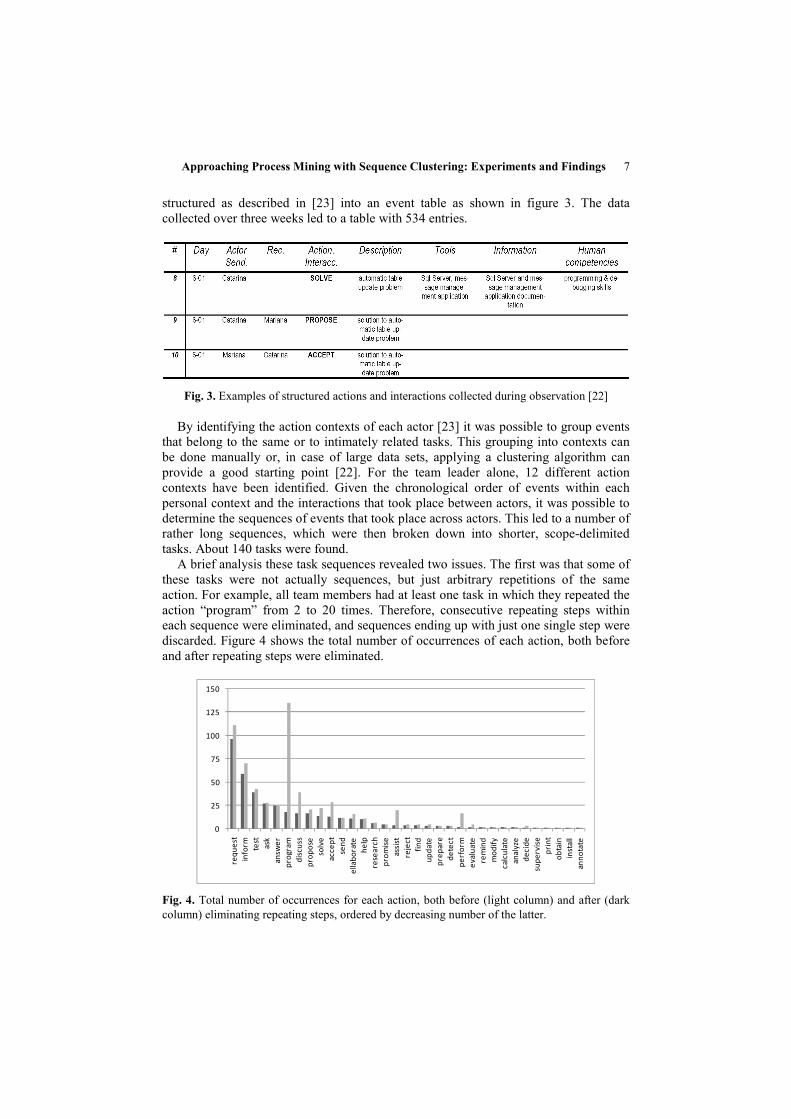
discarded. Figure 4 shows the total number of occurrences of each action, both before
and after repeating steps were eliminated.
0
25
50
75
100
125
150
request
inform test
ask
answ
er
program
discuss
propose
solve
accept
send
ellaborate
help
research
promise
assist
reject
find
update
prepare
detect
perform
evaluate
remind
modify
calculate
analyze
decide
supervise
obtain
install
annotate
Fig. 4. Total number of occurrences for each action, both before (light column) and after (dark
column) eliminating repeating steps, ordered by decreasing number of the latter.

8 Diogo Ferreira, Marielba Zacarias, Miguel Malheiros, Pedro Ferreira
The second issue was that the relatively high number of different actions led to a set
of very dissimilar sequences, despite the fact that most of them shared a limited set of
common actions. For example, most tasks involve some form of “request”, whereas the
action “annotate” happened only once in the entire study. This suggests that the
emphasis should be put on highly recurrent actions, which provide the skeleton for
most sequences. The least recurrent actions (in the tail of figure 4) represent ad-hoc
variations that provide no real insight into the structure of tasks. The last
pre-processing stage was therefore to decide on a threshold for the number of
occurrences; only actions above that threshold were allowed to remain in the
sequences.
Once these pre-processing stages were complete, it was straightforward to build the
case and nested tables for the sequence clustering algorithm. In order to present a
complete result set, here we will use a relatively high threshold of 20 minimum
occurrences. This means that only the first five actions in figure 4 will be allowed. As a
consequence, the sequences will also be rather short. Figure 5 shows the results of
applying the algorithm to the input sequences. The sequences have been grouped into
five clusters.
c1
c5
c2
c3
c4
Fig. 5. Results of applying the sequence clustering algorithm to a set of input sequences
restricted to five different actions only.
It is arguable whether some sequences should have ended up in a particular cluster.
Both cluster c1 and cluster c4 contain one sequence that would make as much sense if it
had shown up in another cluster. The key issue here is that similar sequences actually
ended up in the same cluster, and that each cluster has its own distinctive features.

Approaching Process Mining with Sequence Clustering: Experiments and Findings 9
Since the goal was to determine the effectiveness of the algorithm in obtaining
meaningful clusters, evaluating the clustering results in this case requires knowledge of
the problem domain. In terms of the particular business context, and despite the fact
that the set of actions is so limited, it is still possible to draw meaningful conclusions
from the results in figure 5:
• The sequences inform-test (cluster c1) and request-test (cluster c4) concern
software integration tests. Team members confirmed that integration tests are
performed either upon explicit request or when the project leader is informed of
the result of previous tests. Clusters c1 and c4 capture these two scenarios. The
sequence inform-test actually comprises the states analyze-inform-test, but the
action “analyze” was not recorded since it is usually performed by an individual
that was not observed in this study.
• The sequences request-inform-test-request (cluster c2) and request-inform–test-
inform (cluster c5) concern software publishing activities. These sequences have
an additional state – request-publish-inform-test-request and request-publish-
inform-test-inform – but the action “publish” is also performed by an unobserved
member. In all these cases, it is remarkable the algorithm was able to distinguish
these activities even though such a key action was missing.
• The sequence ask-answer (cluster c3) occurs in several kinds of tasks, but mostly
in connection with team members helping each other.
5 Experiment #2: Mining database system traces
In the previous experiment, the application of sequence clustering was just the final
phase after several weeks of collecting and pre-processing data. In this second
experiment, the goal was to devise a scenario in which all these steps would be as
automated as possible. Inspired by the bank experiment, we developed an application
to perform simple operations over a fictitious banking database. Examples of such
operations are: creating a checking account, creating a savings account, creating a loan,
paying a loan, etc. Each of these operations comprises several database queries that
insert, select, update or delete records in several tables. Operations requiring
transactional control were implemented inside stored procedures, so as not to clutter the
log.
Creating a checking account for a new customer involves the following steps: (1)
create a new customer, (2) create a new account at the branch, (3) save the account as a
checking account with a certain withdrawal limit, (4) associate the customer as a
depositor of the account, and (5) associate an employee as account manager for that
customer. In terms of SQL, this operation would look like:
INSERT INTO Customer VALUES (85045,'John Hayes','North Street','Southampton')
INSERT INTO Account VALUES (34220,705,'Downtown')
INSERT INTO Checking_Account VALUES (34220, 207)
INSERT INTO Depositor VALUES (85045,34220)
INSERT INTO Cust_Banker VALUES (85045,6,'account manager')
The steps may be performed in this or in a slight different order. In total, there are
four variations for this sequence.

10 Diogo Ferreira, Marielba Zacarias, Miguel Malheiros, Pedro Ferreira
Creating a savings account takes different steps: (1) choose a checking account
belonging to the customer, (2) create a new account at the branch, (3) save the account
as a savings account with a certain interest rate, (4) associate the customer as a
depositor of the account, and (5) transfer the initial funds from the checking account to
the newly created savings account. There are two variations for this sequence; the steps
in the order just described correspond to the following queries:
SELECT a.account_number, a.balance
FROM Depositor AS d, Account AS a, Checking_Account AS c
WHERE a.account_number = d.account_number
AND c.account_number = a.account_number AND d.customer_id = 17214
INSERT INTO Account VALUES (74652,0,'Downtown')
INSERT INTO Savings_Account VALUES (74652, 3.5)
INSERT INTO Depositor VALUES (17214,74652)
EXEC INTERNAL_ACCOUNT_TRANSFER 7583,74652,189
In this experiment, a simulator generates a large amount of these and other
operations. The queries from different operations are sent to the database system
randomly interleaved, in order to simulate the concurrent execution of both different
and similar operations. As the operations are being performed, they are captured as a
trace using the SQL Server Profiler, a tool for monitoring the SQL Server Database
Engine and capturing data about each event. Figure 6 illustrates how the data is
captured with the Profiler. There is no case id or any other information that explicitly
indicates that an event belongs to a certain sequence. As it stands, the trace is just an
unclassified stream of events.
Fig. 6. A database system trace as captured by the SQL Server Profiler. The data can be saved to
a file or to a database table as it is being captured.
The second stage of this experiment is supported by the SequenceBuilder module, a
software component that pre-processes the trace in order to create the case and nested
tables for sequence clustering. However, the algorithm requires a set of independent
sequences grouped by a case id and sorted by a sequential number (as shown earlier in
figure 1). This means that SequenceBuilder must figure out where each sequence
begins and ends, and find the events that belong to the sequence. The database trace
contains profile information – such as date, username, client application, connection
identifier, etc. – that could provide an indication of whether two events are related or
not. But this information is not enough to find an accurate set of sequences. In [15] the
authors make use of similar event logs, but the case id is given for each event. For the
log shown in figure 6 some kind of reliable method for sequence identification had to
be found.

Approaching Process Mining with Sequence Clustering: Experiments and Findings 11
The chosen method was to analyze the content of each query in order to determine
whether it used the same objects of other queries or not. By retrieving the parameter
values of each query, two queries that are close together in the log and use the same
customer id, for example, are very likely to belong to the same sequence. And even if
they do not share the same parameters, but a third query uses both of their parameter
values, then all the three queries are likely to belong to the same sequence. This led to
the idea of computing the graph of relations between queries in the trace: events
connected directly or indirectly through other nodes belong to the same sequence; the
islands in the graph correspond to different sequences. Figure 7 shows the connecting
graphs for the queries described earlier.
Fig. 7. Links between the queries in the bank operations described earlier. Each link has the
name of the parameter whose value is equal in the two queries. Separate sub-graphs correspond
to different sequences.
The whole graph can be computed at most in O(N2) by comparing every pair of
events in the log. The graph is saved into table form in the database, where each node
may have many connections to other nodes. A recursive query then retrieves the set of
nodes in each sub-graph, until there are no more nodes to retrieve. As the nodes are
being retrieved, they are sorted by the chronological order in which they originally
appeared in the trace. The incoming nodes are assigned a sequential number and saved
to a nested table, with a different case id for each sequence. The case table is then
generated by retrieving the set of all distinct case ids.
This simple method works well in all cases except one: when the same object – be it
the customer, account, loan, etc. – shows up in another instance of the same or different
sequence. This may happen because the same customer opens more than one savings
account, because the customer sends payment for a previously created loan, etc. The
problem is illustrated in figure 8, where there should be three sequences but there are
only two since a link is established to a later sequence that refers to the same object. If
these long, unintended sequences are left in the input data, they will ruin the sequence
clustering results since the algorithm will try to find some way to fit these sequences in
by generating Markov chains that are able to produce them.

12 Diogo Ferreira, Marielba Zacarias, Miguel Malheiros, Pedro Ferreira
Fig. 8. When running through the log, links may be established between events that actually
belong to different sequences.
Fortunately, this phenomenon can be detected using a simple heuristic based on the
average length of links between events. A link whose length is noticeably higher than
the average length of all links is likely to be a spurious connection rather than a
meaningful relationship between two events. Suppose, for example, that links with
length over two times the average are rejected. In the example shown in figure 8, the
average length is (18+ x)/11 where x is the length of the dashed link. We reject the
dashed link if x ≥ 2*(18+ x)/11 which gives x ≥ 4 which is obviously appropriate in this
example, where the maximum length of “true” links is 3. Of course, these decisions are
all but trivial, since the “false” links could actually provide insight into higher-level
patterns of behaviour, although this possibility in not being pursued at the time of
writing.
Figure 9 shows five of the eight clusters found for a database trace with about 100
sequences. The first three clusters – c2, c4 and c7 – are three of the four variations of
creating a checking account; clusters c5 and c6 represent the two variations of creating a
savings account. The remaining clusters had similar results for other kinds of
operations dealing with loans. The algorithm was able to clearly distinguish all
operations and their variations, and put each sequence in a separate cluster. As a result,
the Markov chains turned into deterministic graphs, since all transitions probabilities
equal 100%.
c2 c4 c7 c5 c6
Fig. 9. Markov chains associated with five of the eight clusters found in the bank example.

Approaching Process Mining with Sequence Clustering: Experiments and Findings 13
In terms of similarity between the sequences, the algorithm was able to find that
clusters c2, c4, and c7 are very similar, and the same happens with clusters c5 and c6.
Figure 10 shows the cluster diagram for the same results, where the shading of lines
that connect two clusters represents the strength of the similarity between those
clusters, and the shade of each cluster represents its population. From the diagram it
becomes apparent that there is a cluster c8 which is similar to clusters c2, c4, and c7.
Indeed, cluster c8 contains the fourth variation of creating a checking account. It
corresponds to the steps of cluster c4 being executed in the order (1) → (5) → (2) → (3)
→ (4).
Fig. 10. Cluster diagram for the results obtained in the bank example.
6 Conclusion
Sequence clustering is a powerful technique to sort out different behaviours and to
provide insight into the underlying structure of those behaviours. This insight is
especially useful when approaching new scenarios, that the business process analyst
may not be familiar with, or where the potential for process mining is yet uncertain. It
can actually become a valuable tool as a first approach to process mining, when the
event log is too large to be manually handled and the presence of ad-hoc behaviour
makes it impossible for automated processing by more deterministic algorithms.
However, in order to obtain meaningful results via sequence clustering, the input
data must be carefully prepared and pre-processed. The experiments described in this
paper show that the challenge is actually in identifying and compiling the set of input
sequences, rather than applying the algorithm, which is straightforward. In
experiment #1 the sequences were delimited manually and then streamlined by
discarding infrequent actions. In experiment #2 the sequences were delimited
automatically by means of a criterion that allowed links to be established between
events. In both cases, the case id was assigned based on application-specific heuristics.
These experiments confirm the ability of sequence clustering to identify different
tasks and to discover their composition in terms of elemental steps. In future work,
further sequence analysis over these clusters is expected to provide insight into
behaviour at the process level.

14 Diogo Ferreira, Marielba Zacarias, Miguel Malheiros, Pedro Ferreira
References
1. W. van der Aalst, “Workflow mining: A survey of issues and approaches”, Data &
Knowledge Engineering, 47, pp. 237–267, 2003
2. W. van der Aalst, A. Medeiros, A. Weijters, ”Genetic Process Mining”,
Applications and Theory of Petri Nets 2005, LNCS 3536, pp.48-69, Springer, 2005
3. W. van der Aalst, A. Weijters, “Process Mining: A Research Agenda”, Computers
in Industry, 53(3):231-244, 2004
4. W. van der Aalst, T. Weijters, L. Maruster, “Workflow Mining: Discovering
Process Models from Event Logs”, IEEE Transactions on Knowledge and Data
Engineering, 16(9):1128-1142, September 2004
5. R. Agrawal, D. Gunopulos, F. Leymann, “Mining Process Models from Workflow
Logs”, Proceedings of the 6th International Conference on Extending Database
Technology: Advances in Database Technology, LNCS 1377, pp.469-483,
Springer, 1998
6. I. Cadez, D. Heckerman, C. Meek, P. Smyth, S. White, “Model-Based Clustering
and Visualization of Navigation Patterns on a Web Site”, Data Mining and
Knowledge Discovery, 7(4): 399-424, October 2003
7. Y. Chen, K. Reilly, A. Sprague, Z. Guan, “SEQOPTICS: a protein sequence
clustering system”, BMC Bioinformatics, 7(Suppl 4):S10, 2006
8. J. Cook, A. Wolf, “Automating process discovery through event-data analysis”,
Proceedings of the 17th International Conference on Software Engineering, pp.73-
82, ACM Press, 1995
9. A. Dempster, N. Laird, D. Rubin, “Maximum Likelihood from Incomplete Data
via the EM Algorithm”, Journal of the Royal Statistical Society, Series B, 39(1):1-
38, 1977
10. B. van Dongen, W. van der Aalst, “Multi-Phase Process Mining: Building Instance
Graphs”, International Conference on Conceptual Modeling, LNCS 3288, pp.362-
376, Springer, 2004
11. B. van Dongen, W. van der Aalst, “Multi-Phase Mining: Aggregating Instances
Graphs into EPCs and Petri Nets”, Proceedings of the Second International
Workshop on Applications of Petri Nets to Coordination, Workflow and Business
Process Management, pp.35-58, 2005
12. A. Enright, S. van Dongen, C. Ouzounis, “An efficient algorithm for large-scale
detection of protein families”, Nucleic Acids Research, 30(7):1575-1584, 2002
13. A. Enright, C. Ouzounis “GeneRAGE: a robust algorithm for sequence clustering
and domain detection”, Bioinformatics, 16(5): 451-457, 2000
14. G. Greco, A. Guzzo, L. Pontieri, “Mining Hierarchies of Models: From Abstract
Views to Concrete Specifications”, Proceedings of the 3rd International
Conference on Business Process Management, BPM 2005, pp. 32-47, 2005
15. C. Günther, W. van der Aalst, “Mining Activity Clusters from Low-Level Event
Logs”, BETA Working Paper Series, WP 165, Eindhoven University of
Technology, Eindhoven, 2006
16. J. Herbst, D. Karagiannis, “Integrating Machine Learning and Workflow
Management to Support Acquisition and Adaptation of Workflow Models”,
Proceedings of the 9th International Workshop on Database and Expert Systems
Applications, pp.745-752, 1998

Approaching Process Mining with Sequence Clustering: Experiments and Findings 15
17. W. Li, L. Jaroszewski, A. Godzik, “Sequence clustering strategies improve remote
homology recognitions while reducing search times”, Protein Engineering, 15(8):
643-649, August 2002
18. Microsoft Corporation, “OLE DB for Data Mining Specification”, Version 1.0,
July 2000
19. Z. Tang, J. MacLennan, “Data Mining with SQL Server 2005”, Wiley, 2005
20. T. Wu, C. Watanabe, “GMAP: a genomic mapping and alignment program for
mRNA and EST sequences”, Bioinformatics, 21(9):1859-1875, 2005
21. M. Zacarias, A. Caetano, H. Pinto, J. Tribolet, “Modeling Contexts for Business
Process Oriented Knowledge Support”, Workshop on Knowledge Management for
Distributed Agile Processes: Models, Techniques, and Infrastructure, April 2005
22. M. Zacarias, R. Gomes, J. Coimbra, H. Pinto, J. Tribolet, “Discovering Personal
Action Contexts with SQL Server Integration and Analysis Services”, Proceedings
of the 2nd International Conference on Innovative Views of .NET Technologies,
October 2006
23. M. Zacarias, A. Marques, H. Pinto, J. Tribolet, “Enhancing Collaboration Services
with Business Context Models”, International Workshop on Cooperative Systems
and Context, 5th International and Interdisciplinary Conference on Modeling and
Using Context, July 2005
24. M. Zacarias, H. Pinto, J. Tribolet, “A Context-based Approach to Discover
Multitasking Behavior at Work”, Proceedings of the 5th International Workshop
on Task Models and Diagrams for User Interface Design, October 2006
25. M. Zacarias, H. Pinto, J. Tribolet, “Reverse-engineering of Personal and Inter-
personal Work Practices: A Context-Based Approach”, International Workshop on
Role of Contextualization in Human Tasks: Enriching Actors (CHUT-07) held in
conjunction with CONTEXT 07, Denmark, August 2007


![Distance Indexing and Seed Clustering in Sequence … › papers › Chang2020.pdfimplemented as part of vg, a variation graph toolkit [6]. 2 Background 2.1 Sequence Graph Structure](https://img.pdfslide.us/doc/110x75/5f197f8e33e94d0eec642b57/distance-indexing-and-seed-clustering-in-sequence-a-papers-a-chang2020pdf-implemented.jpg)