Embed Size (px)
Citation preview
WORLD AGROFORESTRY CENTRE
Meine van Noordwijk
APPROACHES TO ENVIRONMENTAL SERVICES RESEARCH IN THE CGIAR

Approaches to environmental services
research in the CGIAR
Meine van Noordwijk
World Agroforestry Centre (ICRAF)
Bogor, Indonesia

Citation
van Noordwijk M. 2015. Approaches to environmental services research in the CGIAR.
World Agroforestry Centre (ICRAF) Southeast Asia Regional Program. Bogor, Indonesia.
64 pp
Disclaimer and copyright
The World Agroforestry Centre (ICRAF) holds the copyright to its publications and web
pages but encourages duplication, without alteration, of these materials for non-
commercial purposes. Proper citation is required in all instances. Information owned
by others that requires permission is marked as such. The information provided by the
Centre is, to the best of our knowledge, accurate although we do not guarantee the
information nor are we liable for any damages arising from use of the information.
Website links provided by our site will have their own policies that must be honoured.
The Centre maintains a database of users although this information is not distributed
and is used only to measure the usefulness of our information. Without restriction,
please add a link to our website www.worldagroforestry.org on your website or
publication.
ISBN 978-979-3198-75-0
World Agroforestry Centre (ICRAF)
Southeast Asia Regional Program
Jl. CIFOR, Situ Gede, Sindang Barang, Bogor 16115
[PO Box 161 Bogor 16001] Indonesia
Tel: +(62) 251 8625 415
Fax: +(62) 251 8625416
Email: [email protected]
www.worldagroforestry.org/regions/southeast_asia
Cover Image
Intact upper watershed of the Konaweha river in SE Sulawesi with a complex political
history, and recent re-settlement of villages soon to be flooded if plans for a reservoir
come through (Meine van Noordwijk) and crossing a river in Buol district where the
bridge has been repeatedly washed out by floods (Sacha Amaruzaman)
Design and layout
Riky Mulya Hilmansyah and Tikah Atikah

iii
Acknowledgements
This document benefitted from discussions with, and inputs from, Beria Leimona,
Peter Minang, Sara Namirembe, Betha Lusiana, Sonya Dewi, Edmundo Barrios, Fabrice
DeClerck (Bioversity), Ravi Prabhu, Henry Neufeldt, Rob Finlayson, Ujjwal Pradhan,
Grace Villamor, Quinn Bernier (IFPRI), Ruth Meinzen-Dick (IFPRI), Ken Giller
(Wageningen). I further acknowledge the helpful and critical discussions with many
colleagues that have over the years shaped these ideas, mainly in the four nested
networks that I have the pleasure to be part of:
However, final responsibility for this selection of ideas and remaining (potentially
supra-optimal) confusion rests with me.

iv
Summary
As an introduction to a discussion by the International Science and Partnership Council
(ISPC) of the CGIAR, basic concepts of ecosystem and environmental services are here
related to the current Sustainable Development Goals debate, the positioning of the
CGIAR in that debate and ongoing efforts by CGIAR research programs. The argument
is developed in ten steps:
1. The Sustainable Development Goals try to reconcile the unfinished business of the
human development deficit at the bottom of the pyramid, with the realization of
planetary boundaries and the need for substantial gains in the efficiency of
enhancing human wellbeing per unit resource use. Agriculture, still over a third of
global employment, will need to transform towards greater productivity per unit
land and labour but will also need to minimize direct negative external environ-
mental effects. These issues involve five scales of economics (giga-, macro-, meso-,
micro- and pico-) and the three temporal scales of efficiency, persistence and
sustainagility. The SDGs can be understood to cater for all layers of a ‘human well-
being’ pyramid that relates physical security and shelter as fundament and issues
of identity and self-realization as top.
2. A better understanding, appreciation and management of ecosystem services, the
human well-being derived from ‘natural capital’, is key to SDG attainment.
Unfortunately, negative impacts on these services have historically been an
externality of decisions about land-use intensification. The externality argument
applies especially to the ‘environmental services’ subset ecosystem services.
Regulating, supporting and cultural services tend to be treated as externalities
while ‘provisioning’ services generally do have markets that allow them to be
directly valued, even if current use stays outside of the formal economy. A basic
scheme of how effects on (agro)ecosystem structure and function leads to loss of
environmental services, which can affect both the lower and upper strata of a
human well-being pyramid, suggests that there are multiple potential feedback
loops that can internalize the externalities of land-use decisions. However, the
cross-scale relations involved in, for example, the water cycle, need to be better
understood. The recently recognized ‘rainbow water’ (40% of rainfall derives from
terrestrial recycling, with large variation between positions on the globe) is a
missing piece of the puzzle with 'water policy' currently dominated by blue, grey
and green water issues.
3. In the revised Strategic Results Framework of the CGIAR, environmental services
issues are part of the third ‘pillar’. Compared with the more holistic SDG
framework, the CGIAR still identifies primarily with increases in productivity and
rural income but the need for better management of the trade-offs at the macro-

v
to- giga-scale—by protecting and restoring forests—have been included in the
agenda. The primary challenge remains to find the appropriate scales for
combining the concepts of multifunctionality of land (‘sharing’) with the ‘necessary
but not sufficient’ condition of productivity increase (‘sparing’) and addressing the
lack of valuation and recognition (‘caring’). Within that discussion, agroforestry
and forests have historically played complementary roles.
4. Current science-based theories of change in this domain usually refer to socio-
ecological systems with multiple feedbacks contributing to complexity and
emergent behaviour. Theories of place complement the generic theories of change
in clarifying the strength of pressures, the current condition and trends, and the
political agency that can influence drivers. Combining theories of place and
change, context-specific theories of agency for change can be constructed. Current
development parlance describes the derived planned agency as ‘theories of
change’ but is often lacking in credibility as well as legitimacy.
5. Recent recognition of parts of the globe that are primary sources and sinks for
terrestrial recycling of rainfall may help understand why previous generalizations
in the forest-water debate failed. The relative importance of environmental
services’ impacts on land use and land-use change vary along a ‘forest transition
curve’. This framework provides a further ‘theory of place’ that can be applied at
national to subnational scales as a basis of typologies but the recently recognized
prominence of trees outside forests (43% of agricultural land with at least 10%
tree cover) shows significant variation between regions. Further, theories of place
include more information on the forest-agriculture relationship in terms of spatial
pattern and institutional constellation.
6. The various ‘theories of place’ and associated typologies can be combined with the
‘issue cycle’ concept to understand the emergence of multiple governance
responses (‘carrots, sticks and sermons’) that aim at internalizing externalities. The
past decade of discussion and learning on ‘payment for environmental services’
(PES) can be seen in this light, with the emerging need to combine (perceived)
fairness and results-based efficiency.
7. New insights in socio-ecological systems at local ‘learning landscape’ scale have
emerged from various efforts to enhance and create incentives for environmental
service-friendly land use. Multiple roles for researchers are needed in boundary
work between three complementary and often competing knowledge domains:
local, public/policy and scientific (modellers’) knowledge. The emerging theories of
boundary objects point to the importance of legitimacy, next to salience and
credibility, as a quality criterion in this type of work, often at landscape scale.
8. Globally, many institutions have picked up on the interdisciplinary challenges of
‘green’ accounting, valuation of ecosystem services, and the assessment of global

vi
and regional patterns of change. Various CGIAR scientists and parts of CRPs are
currently connected to global leaders in these fields
9. A closer look at current CGIAR involvement with the ecosystem/environmental
services cutting edge shows that a more coherent representation and
communication of this part of the CG agenda may be possible and desirable.
10. A number of specific suggestions are presented as a contribution to the debate on
how to take this forward as part of ‘theories of agency for change’ for place-based
integrative work, as well as at thematic level, across centres and CRPs:
o Position the CGIAR to address the trade-offs and intersection of ‘agricultural
production’ with the wider set of SDGs
o Contribute to, and interact with, global system thinking that explores the
wider interactions of various pathways towards ‘agricultural intensification’
o Ensure that the negative consequences of agriculture and its intensification
are recognized in early stages of technology development
o Connect with the primary international movers on the ‘ecosystem services’
and ‘environmental governance’ agenda, through a globally representative
network of sentinel and learning landscapes (with the sentinel function
focused on ‘monitoring’, the learning on action research to find solutions)
o Ensure that environmental service ‘boundary work’ is done in all types of
landscapes and land use with which the CGIAR engages, and that it is
connected in a global community of practice, linked with academic and
governance circles
o Focus on the interface of rights-based approaches (clarification of state vs
community rights, community vs household, household vs individual), spatial
planning, macro-economic policy and the use of performance-based
economic instruments (‘PES’), to better understand the type of governance
response that can best facilitate sustainable development at local, national
and global scales.
vii
Contents
1. Why? What’s the giga-issue in terms of Sustainable Development Goals? .......................... 1
Box 1. Externalities in giga-, macro-, meso-, micro- and pico-economics; sustainagility .......... 3
Intermezzo: build-up of a complex socio-ecological system in schematic form .................... 5
2. Ecosystem and environmental services: externalities of land-use intensification? ............ 12
Box 2A. The full hydrological cycle as basis of various ecosystem services............................. 14
Box 2B. Intensification effects on landscape-level ES ............................................................. 15
3. Where are environmental services in the CGIAR Strategic Results Framework? ................ 16
Box 3. Borlaug hypothesis, land (sh)(p)(c)aring and segregation vs integration ..................... 18
4. Theory of place * theory of change .................................................................................. 19
Box 4. Six questions for understanding landscapes as socio-ecological systems .................... 21
5. Typology of issues*place ................................................................................................. 22
Box 5. Gender, tenure and environmental services ................................................................ 26
6. Interventions in coupled socio-ecological systems ........................................................... 27
Box 6. Definitions of PES and its relatives ............................................................................... 29
7. Issues * place * interventions .......................................................................................... 30
Box 7. Options for place-based integration of ecological intensification efforts .................... 33
8. Who’s doing what globally............................................................................................... 34
Box 8. Green Accounting and Green Growth at national scale ............................................... 36
9. Who’s doing what within CGIAR, interacting globally? ..................................................... 37
9.1 Segregating rather than integrating ES concerns? ....................................................... 37
9.2 Questions to be addressed ......................................................................................... 38
9.3 Current effort ............................................................................................................ 40
Box 9. ES governance, democracy, transparency, FPIC and CBDR .......................................... 42
10. Outcome/impact perspectives on further CGIAR involvement with ES ............................. 43
10.1 Vision of agenda ...................................................................................................... 43
10.2 Suggested way forward for the CGIAR ...................................................................... 45
References ............................................................................................................................ 45
Attachment 1. Sustainable Development Goals ...................................................................... 52
Attachment 2. Typology of environmental services ................................................................ 53
Attachment 3. Key messages derived from PIM/WLE/FTA workshop, November 2014 ............ 54

1
1. Why? What’s the giga-issue in terms of Sustainable
Development Goals?
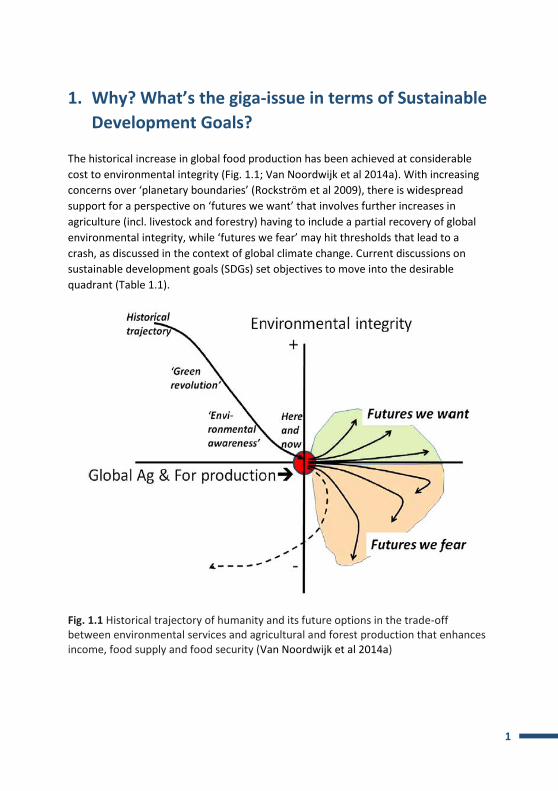
The historical increase in global food production has been achieved at considerable
cost to environmental integrity (Fig. 1.1; Van Noordwijk et al 2014a). With increasing
concerns over ‘planetary boundaries’ (Rockström et al 2009), there is widespread
support for a perspective on ‘futures we want’ that involves further increases in
agriculture (incl. livestock and forestry) having to include a partial recovery of global
environmental integrity, while ‘futures we fear’ may hit thresholds that lead to a
crash, as discussed in the context of global climate change. Current discussions on
sustainable development goals (SDGs) set objectives to move into the desirable
quadrant (Table 1.1).
Fig. 1.1 Historical trajectory of humanity and its future options in the trade-off between environmental services and agricultural and forest production that enhances income, food supply and food security (Van Noordwijk et al 2014a)
2
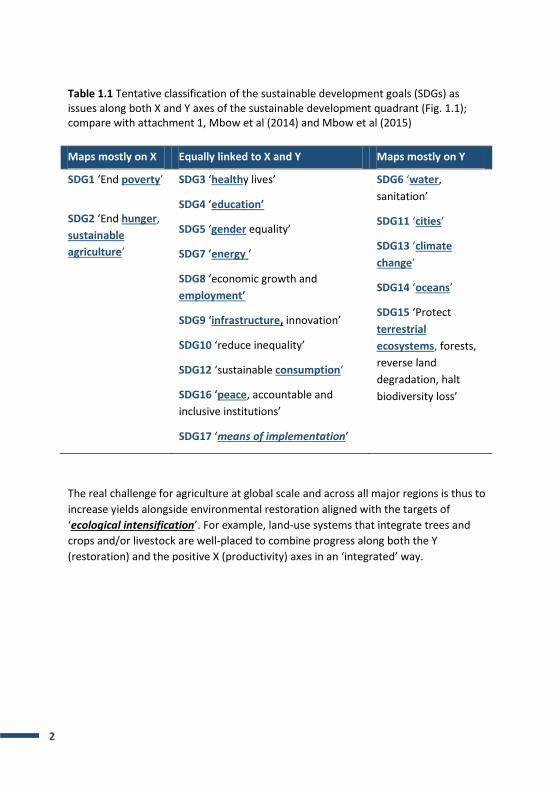
Table 1.1 Tentative classification of the sustainable development goals (SDGs) as issues along both X and Y axes of the sustainable development quadrant (Fig. 1.1); compare with attachment 1, Mbow et al (2014) and Mbow et al (2015)
Maps mostly on X Equally linked to X and Y Maps mostly on Y
SDG1 ‘End poverty’
SDG2 ‘End hunger,
sustainable
agriculture’
SDG3 ‘healthy lives’
SDG4 ‘education’
SDG5 ‘gender equality’
SDG7 ‘energy ‘
SDG8 ‘economic growth and
employment’
SDG9 ‘infrastructure, innovation’
SDG10 ‘reduce inequality’
SDG12 ‘sustainable consumption’
SDG16 ‘peace, accountable and
inclusive institutions’
SDG17 ‘means of implementation’
SDG6 ‘water,
sanitation’
SDG11 ‘cities’
SDG13 ‘climate
change’
SDG14 ‘oceans’
SDG15 ‘Protect
terrestrial
ecosystems, forests,
reverse land
degradation, halt
biodiversity loss’
The real challenge for agriculture at global scale and across all major regions is thus to
increase yields alongside environmental restoration aligned with the targets of
‘ecological intensification’. For example, land-use systems that integrate trees and
crops and/or livestock are well-placed to combine progress along both the Y
(restoration) and the positive X (productivity) axes in an ‘integrated’ way.
3
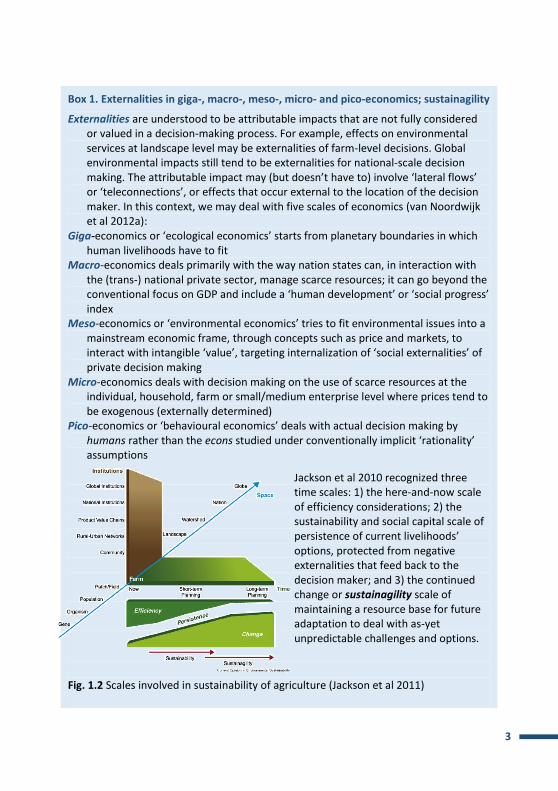
Box 1. Externalities in giga-, macro-, meso-, micro- and pico-economics; sustainagility
Externalities are understood to be attributable impacts that are not fully considered or valued in a decision-making process. For example, effects on environmental services at landscape level may be externalities of farm-level decisions. Global environmental impacts still tend to be externalities for national-scale decision making. The attributable impact may (but doesn’t have to) involve ‘lateral flows’ or ‘teleconnections’, or effects that occur external to the location of the decision maker. In this context, we may deal with five scales of economics (van Noordwijk et al 2012a):
Giga-economics or ‘ecological economics’ starts from planetary boundaries in which human livelihoods have to fit
Macro-economics deals primarily with the way nation states can, in interaction with the (trans-) national private sector, manage scarce resources; it can go beyond the conventional focus on GDP and include a ‘human development’ or ‘social progress’ index
Meso-economics or ‘environmental economics’ tries to fit environmental issues into a mainstream economic frame, through concepts such as price and markets, to interact with intangible ‘value’, targeting internalization of ‘social externalities’ of private decision making
Micro-economics deals with decision making on the use of scarce resources at the individual, household, farm or small/medium enterprise level where prices tend to be exogenous (externally determined)
Pico-economics or ‘behavioural economics’ deals with actual decision making by humans rather than the econs studied under conventionally implicit ‘rationality’ assumptions
Jackson et al 2010 recognized three time scales: 1) the here-and-now scale of efficiency considerations; 2) the sustainability and social capital scale of persistence of current livelihoods’ options, protected from negative externalities that feed back to the decision maker; and 3) the continued change or sustainagility scale of maintaining a resource base for future adaptation to deal with as-yet unpredictable challenges and options.
Fig. 1.2 Scales involved in sustainability of agriculture (Jackson et al 2011)

4
Fig. 1.3 Portrayal of SDGs as the intertwining canopy of a knowledge tree,
rooted in local wisdom and science (inspired by IIED colleagues)
The SDGs can be represented as fruits borne on a tree with intertwined branches,
which is borne on a stem of negotiated solutions and managed trade-offs at nested
scales, rooted in knowledge that is salient, credible and legitimate, combining globally
consistent science and locally attuned knowledge systems.
Following the tradition to represent the ‘human well-being’ concept as a modified
Maslow pyramid (Costanza et al 2007; van Noordwijk et al 2014c) we can see SDGs
address a broad scale of needs (Fig. 1.4).
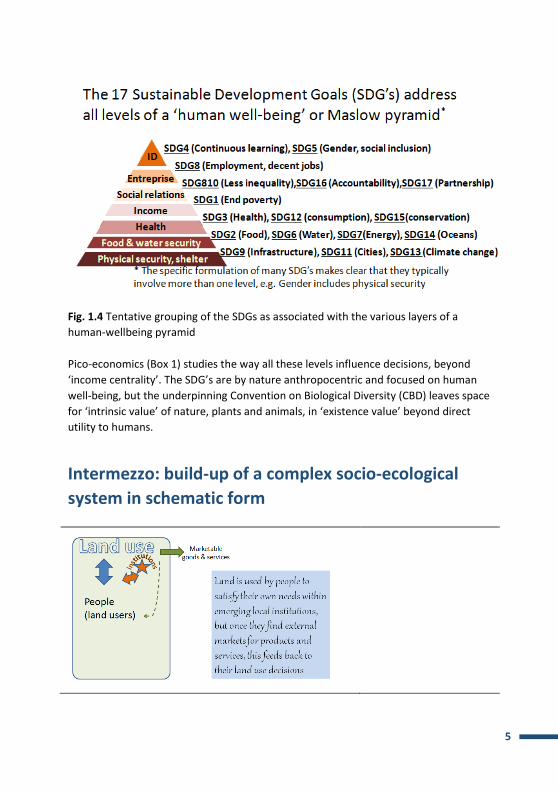
5
Fig. 1.4 Tentative grouping of the SDGs as associated with the various layers of a
human-wellbeing pyramid
Pico-economics (Box 1) studies the way all these levels influence decisions, beyond
‘income centrality’. The SDG’s are by nature anthropocentric and focused on human
well-being, but the underpinning Convention on Biological Diversity (CBD) leaves space
for ‘intrinsic value’ of nature, plants and animals, in ‘existence value’ beyond direct
utility to humans.
Intermezzo: build-up of a complex socio-ecological
system in schematic form
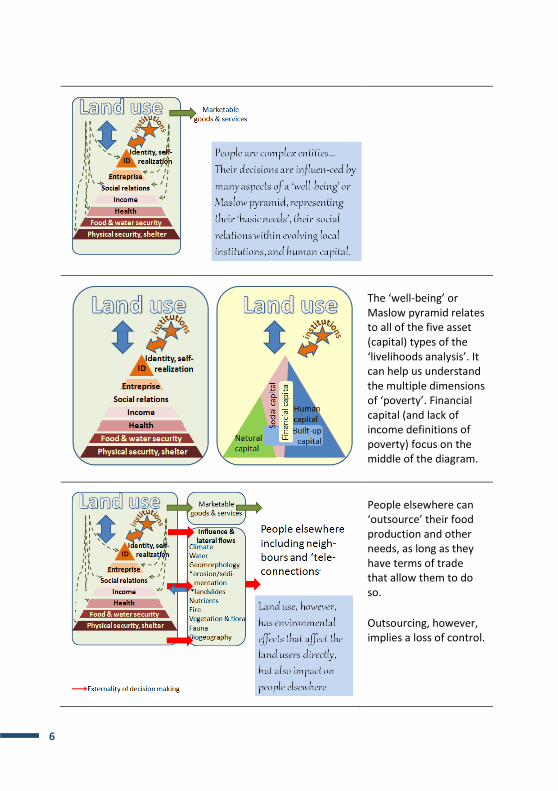
6
The ‘well-being’ or Maslow pyramid relates to all of the five asset (capital) types of the ‘livelihoods analysis’. It can help us understand the multiple dimensions of ‘poverty’. Financial capital (and lack of income definitions of poverty) focus on the middle of the diagram.
People elsewhere can ‘outsource’ their food production and other needs, as long as they have terms of trade that allow them to do so.
Outsourcing, however, implies a loss of control.

7
Markets have replaced primary Land Use as the proximate provider of (nearly) all goods and services for a majority of the human population, even though ultimately these still depend on land use elsewhere.
People are potentially
affected at all levels of
the well-being pyramid
by the impacts of land
use, whether in their
neighbourhood or
globally.
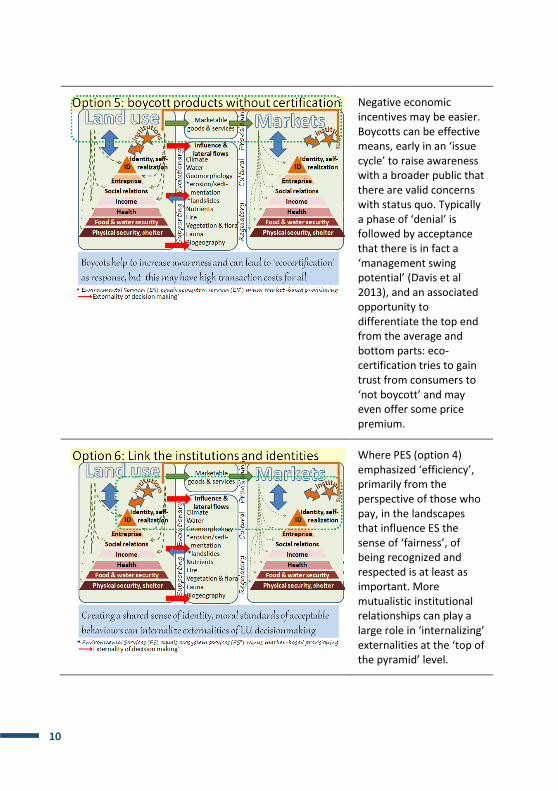
Where a lack of environmental services (ES) becomes an issue, people have a choice between:
1. Moving on, starting afresh elsewhere 2. Trying to control those who damage the ES 3. Use engineering of the landscape (e.g. reservoirs in rivers) 4. Use economic incentives to change their behaviour 5. Boycott uncertified products 6. Try to convince those who damage the ES to change their behaviour

8

9
PES can be micro-economically rational for the ‘sellers’ of ES if it provides benefits in excess of the real (and legal) opportunity costs of ES-friendly land uses.
ES (option 4) can be micro-economically rational for the ‘buyers’ of ES if the costs are lower than what engineering (option 3) would cost, and if it can synergize with options 2 and 5 and 6. It may be ‘efficient’ for both ‘buyers’ and ‘sellers’…
However, the PES reality is more complex, and only part of what the ‘PES buyers’ pay will actually end up in the ‘PES sellers’ pockets. Transaction costs of various categories are substantial. Who has the right to receive, and who has the power to enforce, payments? Who monitors compliance and has the right to do so? As collective action is needed on both sides, what does ‘voluntary’ mean?
10
Negative economic incentives may be easier. Boycotts can be effective means, early in an ‘issue cycle’ to raise awareness with a broader public that there are valid concerns with status quo. Typically a phase of ‘denial’ is followed by acceptance that there is in fact a ‘management swing potential’ (Davis et al 2013), and an associated opportunity to differentiate the top end from the average and bottom parts: eco-certification tries to gain trust from consumers to ‘not boycott’ and may even offer some price premium.
Where PES (option 4) emphasized ‘efficiency’, primarily from the perspective of those who pay, in the landscapes that influence ES the sense of ‘fairness’, of being recognized and respected is at least as important. More mutualistic institutional relationships can play a large role in ‘internalizing’ externalities at the ‘top of the pyramid’ level.

11
The ‘simple’ PES concept of option 4 has been broadened to include elements of the other options. We now recognize three ‘paradigms’ as part of the broader ‘economic incentives’ family of ES-enhancing instruments.
12
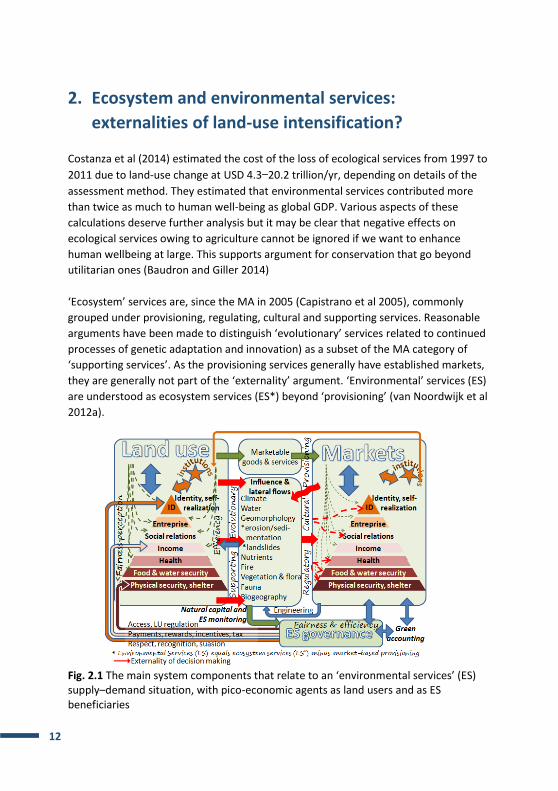
2. Ecosystem and environmental services:
externalities of land-use intensification?
Costanza et al (2014) estimated the cost of the loss of ecological services from 1997 to
2011 due to land-use change at USD 4.3—20.2 trillion/yr, depending on details of the
assessment method. They estimated that environmental services contributed more
than twice as much to human well-being as global GDP. Various aspects of these
calculations deserve further analysis but it may be clear that negative effects on
ecological services owing to agriculture cannot be ignored if we want to enhance
human wellbeing at large. This supports argument for conservation that go beyond
utilitarian ones (Baudron and Giller 2014)
‘Ecosystem’ services are, since the MA in 2005 (Capistrano et al 2005), commonly
grouped under provisioning, regulating, cultural and supporting services. Reasonable
arguments have been made to distinguish ‘evolutionary’ services related to continued
processes of genetic adaptation and innovation) as a subset of the MA category of
‘supporting services’. As the provisioning services generally have established markets,
they are generally not part of the ‘externality’ argument. ‘Environmental’ services (ES)
are understood as ecosystem services (ES*) beyond ‘provisioning’ (van Noordwijk et al
2012a).
Fig. 2.1 The main system components that relate to an ‘environmental services’ (ES) supply–demand situation, with pico-economic agents as land users and as ES beneficiaries

13
ES can be further understood on the basis of the climate (macro-, meso- and micro-)
and associated global cycles of water, nitrogen, carbon, phosphorus and other
nutrients that they interact with, as well as the active surface of the land
(geomorphology) that is shaped by erosion, landslides, sedimentation and soil
formation, and the dynamics of vegetation, fire, flora and fauna.
Fig. 2.2 Environmental services as a subset of ecosystem services (van Noordwijk et al
2012a)
A more radical perspective applies the ‘segregate vs integrate’ framing to the way
urban, agricultural and natural circles interact, with the rural poor squeezed in
between (Fig. 2.3)
Fig. 2.3 Social segregation in perceived value and attractiveness of the natural,
agricultural and urban parts of the landscape (modified from Garcia-Barrios et al 2009)
14
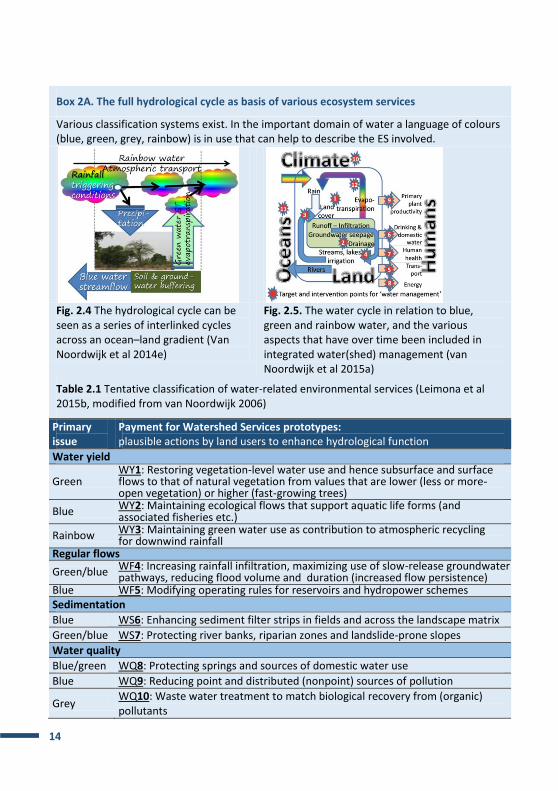
Box 2A. The full hydrological cycle as basis of various ecosystem services
Various classification systems exist. In the important domain of water a language of colours (blue, green, grey, rainbow) is in use that can help to describe the ES involved.
Fig. 2.4 The hydrological cycle can be seen as a series of interlinked cycles across an ocean–land gradient (Van Noordwijk et al 2014e)
Fig. 2.5. The water cycle in relation to blue, green and rainbow water, and the various aspects that have over time been included in integrated water(shed) management (van Noordwijk et al 2015a)
Table 2.1 Tentative classification of water-related environmental services (Leimona et al 2015b, modified from van Noordwijk 2006)
Primary issue
Payment for Watershed Services prototypes: plausible actions by land users to enhance hydrological function
Water yield
Green WY1: Restoring vegetation-level water use and hence subsurface and surface flows to that of natural vegetation from values that are lower (less or more-open vegetation) or higher (fast-growing trees)
Blue WY2: Maintaining ecological flows that support aquatic life forms (and associated fisheries etc.)
Rainbow WY3: Maintaining green water use as contribution to atmospheric recycling for downwind rainfall
Regular flows
Green/blue WF4: Increasing rainfall infiltration, maximizing use of slow-release groundwater pathways, reducing flood volume and duration (increased flow persistence)
Blue WF5: Modifying operating rules for reservoirs and hydropower schemes Sedimentation
Blue WS6: Enhancing sediment filter strips in fields and across the landscape matrix
Green/blue WS7: Protecting river banks, riparian zones and landslide-prone slopes
Water quality
Blue/green WQ8: Protecting springs and sources of domestic water use
Blue WQ9: Reducing point and distributed (nonpoint) sources of pollution
Grey WQ10: Waste water treatment to match biological recovery from (organic) pollutants

15
Box 2B. Intensification effects on landscape-level ES
In practice, intensification applies to landscapes as a whole rather than to agriculture and forests as separate components, with lateral flows of various types as the primary connection between ecosystem structure and function.
Fig. 2.6 Schematic of four stages of landscape intensification (1…4) across four parts (A…D) of a toposequence, connected by surface and subsurface water flows, as well as human livelihoods’ strategies, all influencing (perceptions of) environmental services (van Noordwijk et al 2015c)
Intensification of land use is often based on replacing existing lateral resource flows by external inputs, with tradeoffs between productivity and conservation (Klapwijk et al., 2014), and negative spillover to adjacent areas (van Noordwijk et al. 2004; Baudron and Giller 2014). The financial cost of external inputs provide some rational to maintain financially acceptable resource use efficiencies, but the ‘efficiency gap’ will generally widen in last steps to close the ‘yield gap’ (van Noordwijk and Brussaard 2014). Input price policy for fertilizer and pesticides is a coarse policy instrument, where fine control is needed.
16
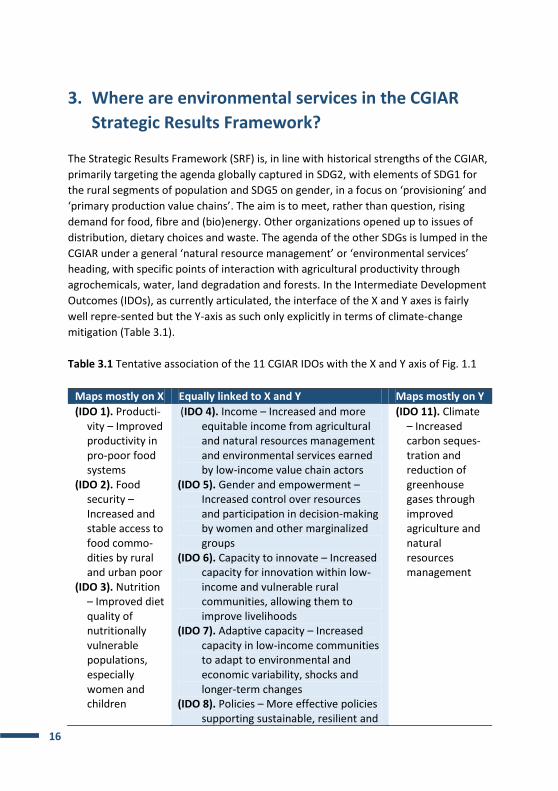
3. Where are environmental services in the CGIAR
Strategic Results Framework?
The Strategic Results Framework (SRF) is, in line with historical strengths of the CGIAR,
primarily targeting the agenda globally captured in SDG2, with elements of SDG1 for
the rural segments of population and SDG5 on gender, in a focus on ‘provisioning’ and
‘primary production value chains’. The aim is to meet, rather than question, rising
demand for food, fibre and (bio)energy. Other organizations opened up to issues of
distribution, dietary choices and waste. The agenda of the other SDGs is lumped in the
CGIAR under a general ‘natural resource management’ or ‘environmental services’
heading, with specific points of interaction with agricultural productivity through
agrochemicals, water, land degradation and forests. In the Intermediate Development
Outcomes (IDOs), as currently articulated, the interface of the X and Y axes is fairly
well repre-sented but the Y-axis as such only explicitly in terms of climate-change
mitigation (Table 3.1).
Table 3.1 Tentative association of the 11 CGIAR IDOs with the X and Y axis of Fig. 1.1
Maps mostly on X Equally linked to X and Y Maps mostly on Y
(IDO 1). Producti-vity – Improved productivity in pro-poor food systems
(IDO 2). Food security – Increased and stable access to food commo-dities by rural and urban poor
(IDO 3). Nutrition – Improved diet quality of nutritionally vulnerable populations, especially women and children
(IDO 4). Income – Increased and more equitable income from agricultural and natural resources management and environmental services earned by low-income value chain actors
(IDO 5). Gender and empowerment – Increased control over resources and participation in decision-making by women and other marginalized groups
(IDO 6). Capacity to innovate – Increased capacity for innovation within low-income and vulnerable rural communities, allowing them to improve livelihoods
(IDO 7). Adaptive capacity – Increased capacity in low-income communities to adapt to environmental and economic variability, shocks and longer-term changes
(IDO 8). Policies – More effective policies supporting sustainable, resilient and
(IDO 11). Climate – Increased carbon seques-tration and reduction of greenhouse gases through improved agriculture and natural resources management

17
Maps mostly on X Equally linked to X and Y Maps mostly on Y
equitable agricultural and natural resources management developed and adopted by agricultural, conservation and development organizations, national governments and international bodies
(IDO 9). Environment – Minimized adverse environmental effects of increased production intensification
(IDO 10). Future options – Greater resilience of agricul-tural/forest/water-based/ mixed-crop, livestock and aquatic systems for enhanced ecosystem services
In the first generation of CRPs, a number dealt directly with aspects of the
environmental services’ agenda, while in others it was more diffuse or focussed on a
small part of the broader agenda (Table 3.2).
Table 3.2 ES aspects as part of first generation CRPs
CRP ES aspects Visibility of ES agenda
WLE Water, wetlands, land health, agrobiodiversity
++
FTA Forests and trees, management, land-use change drivers and (institutional) response options
++
CCAFS Mitigation and adaptation of ag and food systems
(+)
PIM Institutional aspects (+)
AN4H Interest in landscape-based nutrition and health
0
System-level CRPs
Little explicit articulation of ES aspects in initial work, importance varies with local context
0
Commodity-focussed CRPs
Interactions with pest, disease and weed control, pollination for pulses; some concerns on avoiding pollution with agrochemicals; efficient fertilization
0
Genebanks In situ and peri situ conservation 0

18
Box 3. Borlaug hypothesis, land (sh)(p)(c)aring and segregation vs integration
As discussed elsewhere, the primary comfort zone for the CGIAR is the Borlaug hypothesis that intensifying agriculture supports conservation through ‘land sparing’. Empirical results of ASB research in the early 1990s challenged this ‘segregation’ hypothesis and framed an ‘integration’ hypothesis of ‘land sharing’ as alternative (van Noordwijk et al 2012b). The middle ground implies that ‘land caring’ is needed for either idea to work (Baudron and Giller 2014).
A new perspective on both views considers the wider class of ‘efficiency gaps’, in which area-based ‘yield gaps’ are only one of several relevant performance criteria (van Noordwijk and Brussaard 2014).
Over time, agroforestry concepts have evolved (van Noordwijk 2014) from
1. specific technologies dealing with tree-soil-crop-livestock interactions; to 2. landscape-level attention on all trees-on-farms (major part of all trees outside
forests) and farmers in the forests as agriculture/forestry interface; to 3. the agro
+forestry policy domain that manages a gradient rather than discrete
entities.

19
4. Theory of place * theory of change
Current use of the words ‘theory of change’ can mean either or both of two things:
A) A theory of how things tend to change in systems of interest
B) A theory of how desirable change can be brought about through planned
agency
Scientists prefer the first (Costanza 2014), development agencies the second
(http://www.theoryofchange.org/what-is-theory-of-change/#4 ) but may agree that
the first is needed, if only as counterfactual for impact studies of the interventions
funded.
Generic ‘theories of change’ of the first type, their means of implementation (tending
towards the second) and the positive and negative lessons learned in the application
of the second type have long since been recognized as International Public Goods
(IPGs) )(Clark et al 2011; Sayer et al 2013). Place-based work, in all those locations
where generic theories of change do not appear to easily apply has long been seen as
only local in relevance, even if that relevance exceeded the local value of non-generic
IPGs. We now recognize the need for explicit ‘theories of place’ to interact with
‘theories of change’, as a basis for empirically grounded extrapolation and domains for
exchanging experience.
Fig. 4.1A Theory of place perspective: why is the current landscape SES what it is, within its possibility domain?
Fig. 4.1B Theory of change perspective: what will it take in terms of motivation, rights and incentives to modify the SES?
(Minang et al 2015a)

20
Table 4.1 Ten INRM principles from Sayer et al (2013)
As exemplified by efforts to reduce emissions from tropical peatlands (van Noordwijk
et al 2014d), we deal with three interactive knowledge-to-action chains:
A. from basic understanding and measurement to accepted accountability systems
for ES;
B. from denial to ‘willingness’ to act and ‘ability to act’ in governance; and
C. identification of locally appropriate alternative land uses that are acceptable from
ES perspective.
Fig. 4.2 Polycentric governance: scale-dependent
morphs, same principles (Minang et al 2015b)

21
Box 4. Six questions for understanding landscapes as socio-ecological systems
Toolbox:
Concepts:
Van Noordwijk et al 2013 Van Noordwijk et al 2011b

22
5. Typology of issues*place
Building on lessons learned with the forest (tree-cover) transition hypothesis, a
number of different ‘typologies’ are currently in development and are tested in
‘environmental services’ context:
1) Precipitationsheds (all areas of land and ocean that contribute to precipitation over
a specified area, just as watersheds are all the land area that contributes blue water to
a river) have started to become recognized as the basis of teleconnections for specific
types of hydrological functions.
The relative contributions of terrestrial evapotranspiration to ‘downwind’ rainfall
depend strongly on location, as does the percentage of rainfall derived from
evapotranspiration elsewhere (the ‘rainbow water service provisioning’ as ES), around
the global average of 40%.
Fig. 5.1 Climatic teleconnections related to ‘rainbow water’ (Van der Ent et al 2010)
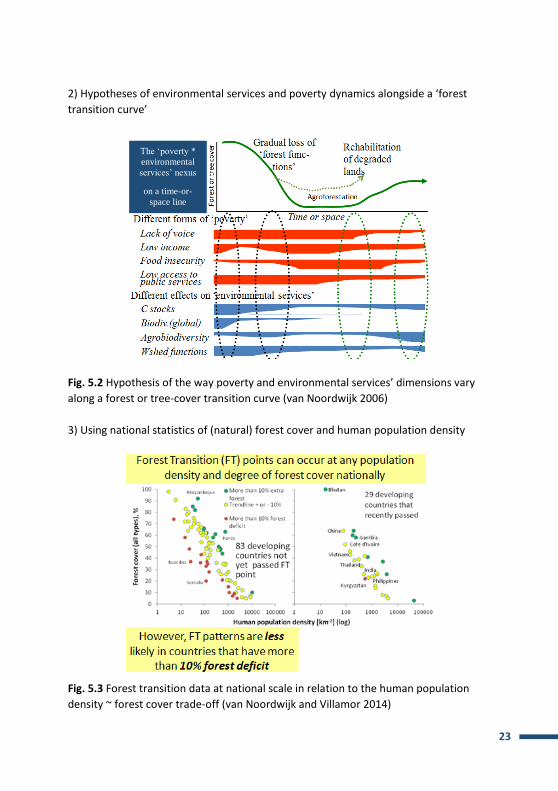
23
2) Hypotheses of environmental services and poverty dynamics alongside a ‘forest
transition curve’
Fig. 5.2 Hypothesis of the way poverty and environmental services’ dimensions vary
along a forest or tree-cover transition curve (van Noordwijk 2006)
3) Using national statistics of (natural) forest cover and human population density
Fig. 5.3 Forest transition data at national scale in relation to the human population
density ~ forest cover trade-off (van Noordwijk and Villamor 2014)
The ‘poverty *
environmental
services’ nexus
on a time-or-
space line

24
4) Empirical multi-criteria clusters of districts
Within Indonesia, both the prominence of natural forests (relative to national average)
and poverty rate are strongly correlated with HDI (and with each other): ‘rich forests
and poor people’ still correlate with consequences for environmental services, the
way they are perceived and can be managed.
5) ToF = Trees outside Forest = Trees on Farm: Tree canopy cover in agricultural areas:
Fig. 5.5 Tree canopy cover in agri-
cultural lands (Zomer et al 2014)
Globally more than 43% of
agricultural land (with 30% of
global rural population) has at
least 10% tree cover but the
fraction varies with climate and
between regions.
Fig. 5.4 Subnational
landscape types based
on forest and land
use/cover, climate
regime, HDI and
population density
(example for Indonesia
in Dewi et al. in prep.)
25
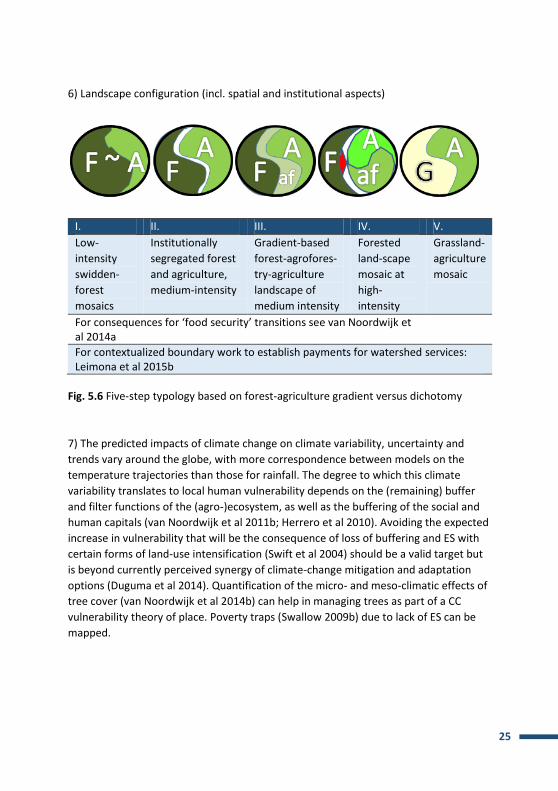
6) Landscape configuration (incl. spatial and institutional aspects)
I. II. III. IV. V.
Low-
intensity
swidden-
forest
mosaics
Institutionally
segregated forest
and agriculture,
medium-intensity
Gradient-based
forest-agrofores-
try-agriculture
landscape of
medium intensity
Forested
land-scape
mosaic at
high-
intensity
Grassland-
agriculture
mosaic
For consequences for ‘food security’ transitions see van Noordwijk et al 2014a
For contextualized boundary work to establish payments for watershed services: Leimona et al 2015b
Fig. 5.6 Five-step typology based on forest-agriculture gradient versus dichotomy
7) The predicted impacts of climate change on climate variability, uncertainty and
trends vary around the globe, with more correspondence between models on the
temperature trajectories than those for rainfall. The degree to which this climate
variability translates to local human vulnerability depends on the (remaining) buffer
and filter functions of the (agro-)ecosystem, as well as the buffering of the social and
human capitals (van Noordwijk et al 2011b; Herrero et al 2010). Avoiding the expected
increase in vulnerability that will be the consequence of loss of buffering and ES with
certain forms of land-use intensification (Swift et al 2004) should be a valid target but
is beyond currently perceived synergy of climate-change mitigation and adaptation
options (Duguma et al 2014). Quantification of the micro- and meso-climatic effects of
tree cover (van Noordwijk et al 2014b) can help in managing trees as part of a CC
vulnerability theory of place. Poverty traps (Swallow 2009b) due to lack of ES can be
mapped.

26
Box 5. Gender, tenure and environmental services The appreciation of changes in tree cover depends in part on the specific roles in productive and reproductive functions that culture, religion and tradition have assigned to men and women. If responsibility for domestic water provisioning as well as firewood for cooking is in the hands of women, as it is in many situations, impacts of landscape and policy change on water and fuelwood availability are primarily felt by women, for example. Empirical work to explore perceptions of space, in gradients from the homestead or village outwards towards ‘forest’ or ‘wildlands’ shows that the degree of gender-based difference in perceptions and preferences varies with cultural (often ethnically defined) context. Gender-based norms in the Jambi sentinel landscape are shifting on multiple axes of Fig. 5.7 (Villamor et al 2015b; Suyanto et al in prep.).
Current work tests hypotheses that gendered rules for land tenure and inheritance (with variation, gradients and transitions between ‘matrilineal’ and ‘patrilineal’ extremes) relate to environmental services’ perceptions and to the likelihood of engaging with external agents who propose options to ‘develop’. One of the tools used in current research, the RUPES Role Play Game, was first developed for a training course in 2003. It describes a set of villages positioned in a landscape with rubber agroforests, a few rice-fields along the river and forests, some intensified rubber patches and remaining forest. Villagers make their livings from these resources but are approached by four types of agents who offer them money for logging the forest, conversion contracts to oil palm, government watershed protection funding or money for voluntary conservation through a ‘save the tiger’ foundation. Key to the game is that PES and other transactions are not regulated or constrained and negotiations and cheating are only limited by the time available. The game proved to be usable, with some simplifications, in the village setting itself, with separate rounds played by men, mixed gender groups and women. As some of the empirical results (Villamor et al 2014a) contradict, or at least challenge, widespread views, this is a fertile area for further applied research.
Fig. 5.7 Diagrammatic
representation of
gender differentiation
of land uses based on
four characteristics

27
6. Interventions in coupled socio-ecological systems
For much of our human history, the easiest way (option 1) to deal with negative
environmental effects was to move on but now there is no place left that is not
affected by human activity. The next most attractive way for those affected by loss of
environmental services due to the activities of land users elsewhere is to try to stop
(option 2) the actors involved or, even better, have others enforce regulations that
forbid such activities. If that is not feasible in the given political context and power
relations, technical interventions to alleviate the negative effects on environmental
services (option 3), such as engineering of river systems to reduce flooding risks, may
cost money but can be economically justified. Where such costs are high, however, it
may become attractive to offer economic incentives to the land users (option 4) who
have the ‘right to pollute’ to get them to forgo their opportunities to negatively affect
environmental services. Such relations became known as ‘payments for environmental
services’, with the Catskills watershed supplying drinking water to New York City as a
prime example. Payments to farmers were less than the engineering costs the
company would otherwise face within the existing legal framework. From the land-
users’ side, this may be a way to micro-economically ‘internalize externalities’ and
make it more attractive to not pollute, even where land users have the right to do so.
Option 5 is to apply negative incentives by boycotting products that have been
produced in ES-unfriendly ways, with (eco-) certification emerging as a prerequisite for
market acceptability and an industry of intermediaries controlling the certification
process. A sixth option is to try and shift the value system and associated pico-
economic decision making of the land users towards more ES-friendly land uses.
These six options to (try and) deal with ES-unfriendly land uses will interact where, as
is often the case, they are tried in conjunction. The regulatory and suasion-based
approaches are not easily combined, as the perceived fairness (or lack thereof) of
regulation undermines the credibility of the ‘suasion’.
The emergence of these options, which can be grouped under the ‘carrots, sticks and
sermons’ of policy instruments, in response to situations where concerns over loss of
environmental services becomes an ‘issue’ in public debate, typically follow a
sequence of events as shown schematically in Fig. 6.1 (Tomich et al 2004a). For
multistakeholder environments, ‘negotiation support’ replaced the concept of
‘decision support’ (van Noordwijk et al 2003), while ‘sustainability’ is increasingly
determined through social relations (Bernard et al 2014).

28
Fig. 6.1 Schematic stages of an ‘issue cycle’ in public debate, triggering a negotiated
response
Fig. 6.2 Response options based on rights, economic incentives and suasion at driver
and actor levels (modified from van Noordwijk et al 2011a)
29
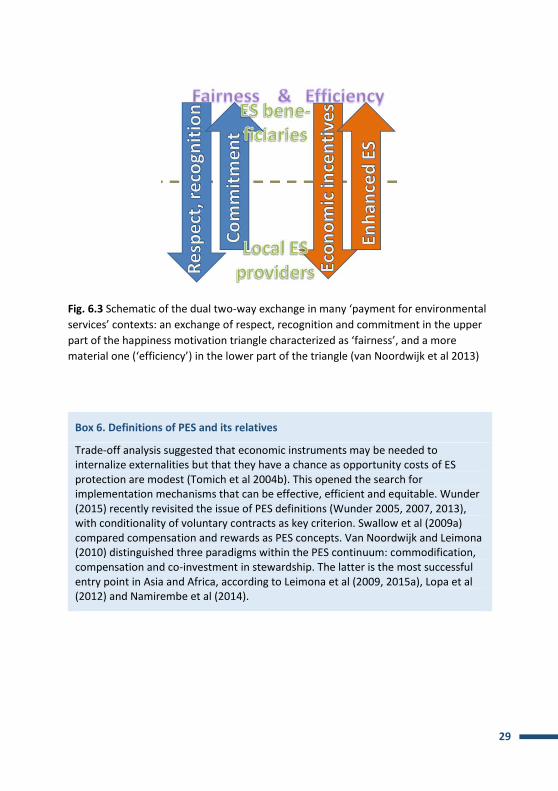
Fig. 6.3 Schematic of the dual two-way exchange in many ‘payment for environmental
services’ contexts: an exchange of respect, recognition and commitment in the upper
part of the happiness motivation triangle characterized as ‘fairness’, and a more
material one (‘efficiency’) in the lower part of the triangle (van Noordwijk et al 2013)
Box 6. Definitions of PES and its relatives
Trade-off analysis suggested that economic instruments may be needed to internalize externalities but that they have a chance as opportunity costs of ES protection are modest (Tomich et al 2004b). This opened the search for implementation mechanisms that can be effective, efficient and equitable. Wunder (2015) recently revisited the issue of PES definitions (Wunder 2005, 2007, 2013), with conditionality of voluntary contracts as key criterion. Swallow et al (2009a) compared compensation and rewards as PES concepts. Van Noordwijk and Leimona (2010) distinguished three paradigms within the PES continuum: commodification, compensation and co-investment in stewardship. The latter is the most successful entry point in Asia and Africa, according to Leimona et al (2009, 2015a), Lopa et al (2012) and Namirembe et al (2014).

30
7. Issues * place * interventions
Combining the insights on the type of environmental services’ issues that are most
likely to be affected by intensifying land use, depending on context, with the institu-
tional context and proven effectiveness of policy instruments is the holy grail of this
field of research (Swallow and Swallow, 2015). Meaningful progress has been made in
the past decade but much remains to be done. Table 2.1 provides a tentative
classification of how interventions and institutions might relate to specific watershed
services in spatial context but a broader systematic review of experience is needed.
Yet, we understand that local settings are linked to national and global scales through
at least three pathways: natural capital, human and social capital and the financial
plus infrastructural capitals (Fig. 7.3). REDD+ has shown some of the many feedbacks
involved and the implications for ‘readiness’ and applications at scale (Minang et al
2014).
Fig. 7.1 Integrating the perspectives of
theories of place and change of fig. 4.1
(van Noordwijk et al 2015b)
Fig. 7.2 Effective change may depend on synergy in six roles of scientists and boundary work (van Noordwijk et al 2015b)
31
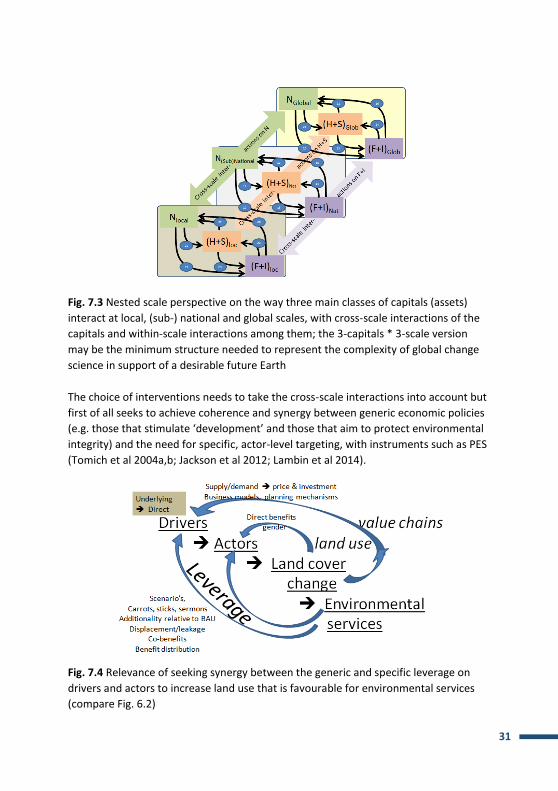
Fig. 7.3 Nested scale perspective on the way three main classes of capitals (assets)
interact at local, (sub-) national and global scales, with cross-scale interactions of the
capitals and within-scale interactions among them; the 3-capitals * 3-scale version
may be the minimum structure needed to represent the complexity of global change
science in support of a desirable future Earth
The choice of interventions needs to take the cross-scale interactions into account but
first of all seeks to achieve coherence and synergy between generic economic policies
(e.g. those that stimulate ‘development’ and those that aim to protect environmental
integrity) and the need for specific, actor-level targeting, with instruments such as PES
(Tomich et al 2004a,b; Jackson et al 2012; Lambin et al 2014).
Fig. 7.4 Relevance of seeking synergy between the generic and specific leverage on
drivers and actors to increase land use that is favourable for environmental services
(compare Fig. 6.2)

32
Progress is being made on our understanding of auctions as mechanisms to a) deal with information asymmetry and derive local opportunity cost estimates; b) provide socially legitimate targeting of contracts to farmers most likely to implement; and c) as pico-economic learning opportunities that lead to commitments, beyond micro-economically agreed prices, that influence chances of implementation (Jack et al 2009; Leimona and Carrasco 2015). At the local government level, spatial planning processes are key to reducing conflicts between functions, even though they at first may make trade-offs and conflicts more clear and apparent. New tools, such as LUMENS (Dewi et al 2014) try to reconcile the various types of spatial information with the ways multiple goals can best be achieved according to various stakeholders: supporting a local negotiation process (Fig. 7.5). These tools become ‘boundary objects’ for a learning-by-doing exploration in the context of local negotiation platforms, rather than sources of ‘expert advice’.
Fig. 7.5 Analytical frame for the ‘Land use for multiple environmental services’ (LUMENS) scenario evaluation tool (Dewi et al 2014)
Drivers
Planning Unit
Function
Rights
LUCT0
LUCT1
Biophysical characteristics
Ecosystem functions
Environmental services
Scenarios
Provisioning services
LUCT = Land Use Change Trajectory
33
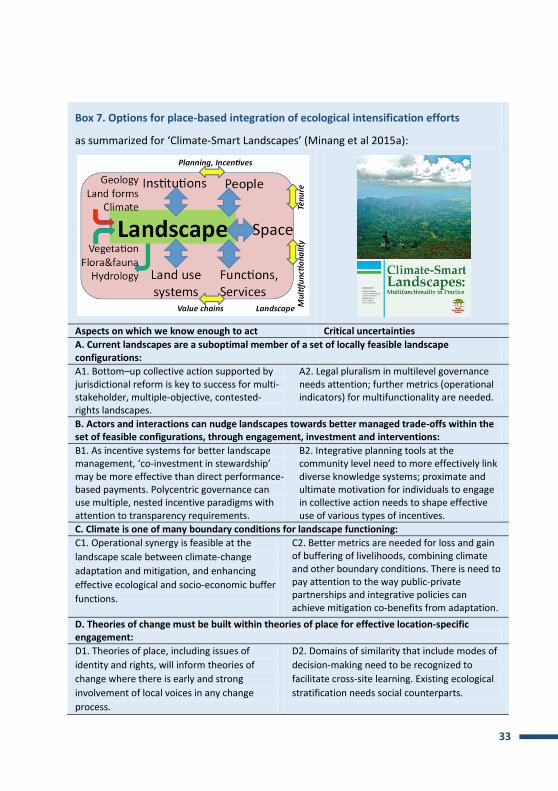
Box 7. Options for place-based integration of ecological intensification efforts
as summarized for ‘Climate-Smart Landscapes’ (Minang et al 2015a):
Aspects on which we know enough to act Critical uncertainties
A. Current landscapes are a suboptimal member of a set of locally feasible landscape configurations:
A1. Bottom–up collective action supported by jurisdictional reform is key to success for multi-stakeholder, multiple-objective, contested-rights landscapes.
A2. Legal pluralism in multilevel governance needs attention; further metrics (operational indicators) for multifunctionality are needed.
B. Actors and interactions can nudge landscapes towards better managed trade-offs within the set of feasible configurations, through engagement, investment and interventions:
B1. As incentive systems for better landscape management, ‘co-investment in stewardship’ may be more effective than direct performance-based payments. Polycentric governance can use multiple, nested incentive paradigms with attention to transparency requirements.
B2. Integrative planning tools at the community level need to more effectively link diverse knowledge systems; proximate and ultimate motivation for individuals to engage in collective action needs to shape effective use of various types of incentives.
C. Climate is one of many boundary conditions for landscape functioning:
C1. Operational synergy is feasible at the
landscape scale between climate-change
adaptation and mitigation, and enhancing
effective ecological and socio-economic buffer
functions.
C2. Better metrics are needed for loss and gain of buffering of livelihoods, combining climate and other boundary conditions. There is need to pay attention to the way public-private partnerships and integrative policies can achieve mitigation co-benefits from adaptation.
D. Theories of change must be built within theories of place for effective location-specific engagement:
D1. Theories of place, including issues of
identity and rights, will inform theories of
change where there is early and strong
involvement of local voices in any change
process.
D2. Domains of similarity that include modes of
decision-making need to be recognized to
facilitate cross-site learning. Existing ecological
stratification needs social counterparts.

34
8. Who’s doing what globally
Internationally a number of institutions, communities of practice and networks are actively engaged in the research and development agenda for environmental services, including relations with agricultural intensification and forest conversion. Key ones among these are:
Ecosystem Services Partnership (ESP): a community of practice of (applied) scientists, combining ecologists, economists, policy and social scientists.
Landscapes for People, Food and Nature (LPFN): Learning network where agriculture, development and conservation organizations, big and small, share experience and research with a network of local landscape initiatives.
Global Land Project (GLP): geographers and land-use scientists from many disciplinary starting points share interest in drivers, patterns and consequences of land-use change.
Future Earth: a new 10-year international research initiative of the International Council of Scientific Unions (ICSU) that brings together thousands of the world's leading researchers to develop the knowledge for responding effectively to the risks and opportunities of global change.
The Economics of Ecosystems and Biodiversity (TEEB): a United Nations Environment Programme-related effort to systematically assign economic value to ecosystem services at global and sub-global scales.
Wealth Accounting and the Valuation of Ecosystem Services (WAVES), a global partnership that aims to promote sustainable development by ensuring that natural resources are mainstreamed in development planning and national economic accounts.
System of Environmental Economic Accounting (SEEA): contains the internationally agreed standard concepts, definitions, classifications, accounting rules and tables for producing internationally comparable statistics on the environment and its relationship with the economy.
Intergovernmental Panel on Biodiversity and Ecosystem Services (IPBES): established in April 2012 as an independent intergovernmental body open to all member countries of the United Nations. The members are committed to building IPBES as the leading body for assessing the state of the planet's biodiversity, its ecosystems and the essential services they provide to society.
United Nations Sustainable Development Solutions Network (UN-SDSN): indicators and a monitoring framework for the SDGs: launching a data revolution for the SDGs in its February 2015 agreement on 100 indicators for global monitoring.
Rights and Resources Institute (RRI): boundary work on policies for tenure reform, transitions of forest and agrarian institutional regimes.

35
Fig. 8.1 Tentative institutional map of major international players involved in subsets
or the totality of the agenda of the way land use influences both the X and the Y axis
of Fig. 1.1 and the way feedback loops that try to protect public interests influence the
drivers, agents/actors and consequences of land use. The red subdomain indicates
proposed direct responsibility of CGIAR on the environmental services’ agenda, in
partnership with institutions mentioned and similar others

36
Box 8. Green Accounting and Green Growth at national scale
One of the two first Noble Prize winners in economics (1969: Jan Tinbergen, ‘for having developed and applied dynamic models for the analysis of economic processes’) was keen to extend macro-economic models to a better inclusion of human development and environmental protection agendas. Some of his students pioneered in operationalizing ‘green accounting’, starting in the 1970s.
De Groot et al (2012) and Costanza et al (2014) recently summarized current estimates of economic value derived from natural capital. The accounting methods, however, are not yet watertight.
Currently, SEEA builds on efforts to broaden the systems that were set up to capture the dynamics, properties and size of the ‘domestic product’ and relate it more explicitly to human well-being and to the ecosystem services that underpin the human economy, based on natural capital. SEEA-conform accounting at national scale can give insights into the part of GDP growth that has been achieved at the direct cost of natural capital destruction. Taking SEEA to subnational scales introduces many challenges on how to deal with the increasing complexity of lateral flows.
On further analysis, however, there are remaining inconsistencies between a ‘flow-’ (such as ES) and ‘stock-’ (or asset, capitals) based accounting. Although these concepts can conceptually be reconciled, implications for accounting systems still deserve further work.
It was widely acknowledged that Millennium Development Goal 7 that was supposed to cover sustainability was the weakest in terms of measurable indicators, based on the state of knowledge around 2000. Yet the broadening to 17 Sustainable Development Goals has not been matched by a fully satisfactory set of statistics that can be monitored for progress. The current lists need further attention.
Fig. 8.2 Schematic
representation of
interactions between
three capital types at
any given scale
(compare Fig. 7.3 for
the cross-scale version),
with direct and indirect
ecosystem services, in
the sense of human
benefits derived from
existence of natural
capital
37
9. Who’s doing what within CGIAR, interacting
globally?
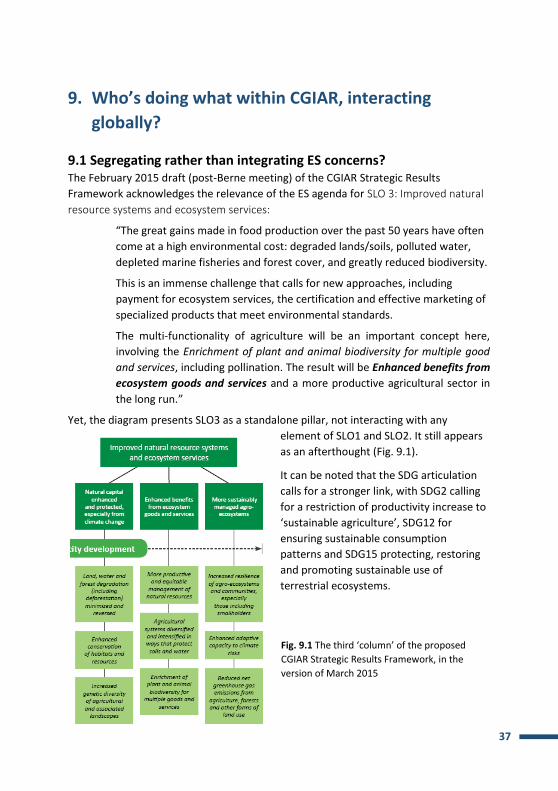
9.1 Segregating rather than integrating ES concerns? The February 2015 draft (post-Berne meeting) of the CGIAR Strategic Results
Framework acknowledges the relevance of the ES agenda for SLO 3: Improved natural
resource systems and ecosystem services:
“The great gains made in food production over the past 50 years have often
come at a high environmental cost: degraded lands/soils, polluted water,
depleted marine fisheries and forest cover, and greatly reduced biodiversity.
This is an immense challenge that calls for new approaches, including
payment for ecosystem services, the certification and effective marketing of
specialized products that meet environmental standards.
The multi-functionality of agriculture will be an important concept here,
involving the Enrichment of plant and animal biodiversity for multiple good
and services, including pollination. The result will be Enhanced benefits from
ecosystem goods and services and a more productive agricultural sector in
the long run.”
Yet, the diagram presents SLO3 as a standalone pillar, not interacting with any
element of SLO1 and SLO2. It still appears
as an afterthought (Fig. 9.1).
It can be noted that the SDG articulation
calls for a stronger link, with SDG2 calling
for a restriction of productivity increase to
‘sustainable agriculture’, SDG12 for
ensuring sustainable consumption
patterns and SDG15 protecting, restoring
and promoting sustainable use of
terrestrial ecosystems.
Fig. 9.1 The third ‘column’ of the proposed
CGIAR Strategic Results Framework, in the
version of March 2015

38
The ‘Sub-IDOs’ are defined mostly as biophysical outcomes, rather than as
strengthened capacities to recognize, evaluate and address ES issues that emerge in
parallel with the agricultural intensification efforts described under IDOs 1 and 2. In all
this the question of metrics and monitoring drives the selection of questions that can
be addressed and targets that can be set (ISPC, 2014).
9.2 Questions to be addressed
Specific to the CGIAR portfolio, the following questions may need to be considered
and/or answered for
a. all place-based integration (climate-smart, humid tropics/dryland, benchmark,
pilot, action, learning or sentinel sites and landscapes);
b. national-scale monitoring of SDG baselines and achievement of targets; and
c. international negotiations (incl. UNFCCC, CBD, UNCCD, WTO, SDGs).
Key questions can be grouped as:
A. Theory of place:
1. a. How are current agricultural systems, given their landscape positions,
interacting with (depending on and influencing) local environmental quality
and the provisioning, regulating, cultural and supportive services related to
that through their interactions with water flows and cycling, nutrient flows
and cycling, biotic interactions (incl. ecosystem engineers, symbionts, pest and
disease organisms and their control agents, pollinators and seed dispersal
agents), micro- and meso-climatic effects of vegetation, risk of initiation and
spread of fire, integrity of aquatic systems, local ecological knowledge systems
and cultural/religious appreciation of landscape elements and overall
integrity?
b. How does the local system interact with natural capital and ES at national
and global scales, incl. national water balance, global climate and
national/international biodiversity agendas?
2. How are current trends in agricultural intensification interacting with the
issues of question 1?
3. What options for ES-friendly ecological intensification emerge when local
ecological knowledge and scientists/modellers knowledge are combined?
A, B, C. Theory of change:
4. What are the drivers of the current patterns of land use, and what are the
trends in drivers and actor responses?
39
5. Who cares about the ES impacts of current and projected land-use change,
and what pathways do they have to influence decisions at generic driver or
specific actor levels?
6. How do ES-friendly ecological intensification options (see question 3) relate to
public/policy knowledge, existing national legal frameworks and development
planning, and how could a political platform for change, if required, be
reached?
7. How can international negotiations and the new institutions that emerge from
them remove institutional bottlenecks identified and support changes towards
ecological intensification?
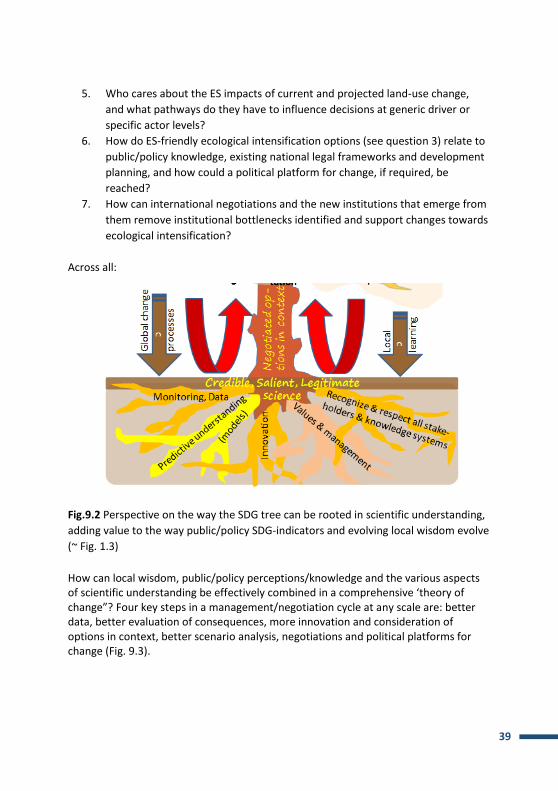
Across all:
Fig.9.2 Perspective on the way the SDG tree can be rooted in scientific understanding,
adding value to the way public/policy SDG-indicators and evolving local wisdom evolve
(~ Fig. 1.3)
How can local wisdom, public/policy perceptions/knowledge and the various aspects of scientific understanding be effectively combined in a comprehensive ‘theory of change”? Four key steps in a management/negotiation cycle at any scale are: better data, better evaluation of consequences, more innovation and consideration of options in context, better scenario analysis, negotiations and political platforms for change (Fig. 9.3).

40
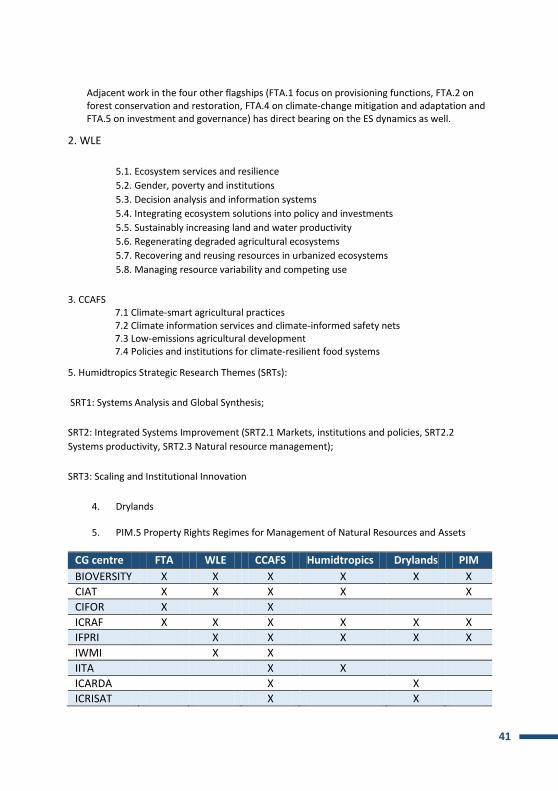
9.3 Current effort
Explicit work on ‘ecosystem services’ has emerged in a number of CRPs and can be
related to the seven types of question in 9.2.
Question FTA1
WLE2
CCAFS3 Humid
Tropics4
Dryland Systems
5 PIM6
1a FTA.3.1 7.1, 7.2 SRT2 **
1b FTA.3.2 (7.1) SRT1,SRT2
2 FTA.3.2/4 7.1 SRT2
3 FTA.1, FTA.2 7.1 SRT2 PIM.5
4 FTA.5 7.1-4 SRT1, SRT2 PIM.5
5 FTA.3.2 7.1-4 SRT2, SRT3 PIM.5
6 FTA.3.3/4 7.3, 7.4 SRT1,SRT2,SRT3 PIM.5
7 FTA.4 7.3, 7.4 SRT1, SRT3
1. The ES research in FTA is organized as one of the five ‘flagships’, with four clusters of activities:
FTA.3.1 Patterns and drivers of tree-cover change, incl. baseline characterization of ‘sentinel landscapes’ (see e.g. van Noordwijk and Villamor 2014; Lusiana et al 2014)
FTA.3.2 ES metrics, perceptions, preferences and consequences of tree-cover change (quantity, quality, pattern) for direct and indirect human well-being, along with governance options and use of economic instruments (see e.g. Ordonez et al 2014; van Noordwijk and Sunderland 2014; Reed et al 2015; Minang et al 2015)
FTA.3.3 Learning landscapes, with specific attention to experiments at scale of use of economic instruments (see e.g. Leimona et al 2015)
FTA.3.4 Specific attention to food security, nutritional diversity and human health in relation to changing forest and tree cover (see e.g. Ickowitz et al 2014)
Fig. 9.3 Possible cross-scale
synergy in polycentric
governance, sharing aspects
of decision/negotiation
cycles that operate at any
scale: data, models,
experiments, arguments for
change and capacity to
negotiate and communicate
41
Adjacent work in the four other flagships (FTA.1 focus on provisioning functions, FTA.2 on forest conservation and restoration, FTA.4 on climate-change mitigation and adaptation and FTA.5 on investment and governance) has direct bearing on the ES dynamics as well.
2. WLE
5.1. Ecosystem services and resilience
5.2. Gender, poverty and institutions
5.3. Decision analysis and information systems
5.4. Integrating ecosystem solutions into policy and investments
5.5. Sustainably increasing land and water productivity
5.6. Regenerating degraded agricultural ecosystems
5.7. Recovering and reusing resources in urbanized ecosystems
5.8. Managing resource variability and competing use
3. CCAFS 7.1 Climate-smart agricultural practices 7.2 Climate information services and climate-informed safety nets 7.3 Low-emissions agricultural development 7.4 Policies and institutions for climate-resilient food systems
5. Humidtropics Strategic Research Themes (SRTs):
SRT1: Systems Analysis and Global Synthesis;
SRT2: Integrated Systems Improvement (SRT2.1 Markets, institutions and policies, SRT2.2
Systems productivity, SRT2.3 Natural resource management);
SRT3: Scaling and Institutional Innovation
4. Drylands
5. PIM.5 Property Rights Regimes for Management of Natural Resources and Assets
CG centre FTA WLE CCAFS Humidtropics Drylands PIM
BIOVERSITY X X X X X X
CIAT X X X X X
CIFOR X X
ICRAF X X X X X X
IFPRI X X X X X
IWMI X X
IITA X X
ICARDA X X
ICRISAT X X

42
Box 9. ES governance, democracy, transparency, FPIC and CBDR
Comparative studies reveal large differences between the ways different countries have so far approached issues of ES governance, with opportunities for learning from neighbours and (distant) cousins that go beyond the way knowledge travels in its academic abstraction. The first country to explicitly use the PES concept, and repackage its forest subsidy program in innovative language, was Costa Rica. Mexico may well be the largest current implementer of similar schemes, with various degrees of targeting, conditionality and voluntariness in the way decentralized implementation bodies are evolving. China has operated by far the largest investment scheme to restore ES through its Sloping Land Conversion Program (SLCP; also called ‘grain to green’), inspired by the disastrous Yang Tse floods of the early 1990s. Top–down in nature, space for local adjustments proved to exist, which lead to regional differences in mode of implementation and opportunities to learn by comparison between these. As part of existing cooperation with the academic world, new insights on ES governance are emerging from this SLCP program (Sikor et al 2014; Jun and Sikor 2015). They relate to the fairness vs efficiency debates in PES (Leimona et al 2009, 2015a) and landscape democracy (Minang et al 2015a) concepts that emerge from work in ‘learning landscapes’. Landscapes with complex migration histories (Galudra et al 2014) offer a further challenge.
Globally, the REDD+ ‘theory of change’ has sparked considerable learning of the nested challenges involved in linking local action to global benefits, with only partial success so far (Matthews et al 2014). An aspect that may not have received enough attention (Minang and van Noordwijk 2014) is the opportunity to combine the three main PES paradigms, by relying on ‘commoditization’ (of C credits) at the international borders of a country, compensation at subnational scale and co-investment at local scales.
Two concepts that have emerged in the context of the climate change and specific REDD+ discussions are: Free and Prior Informed Consent, and Common But Differentiated Responsibilities. The first translates to a desire, from the international level, to have social safeguards in the design and implementation of programs that otherwise might be top–down or favouring specific non-local interests. The second is mostly used by negotiators for developing countries as a plea for increased resource flow in return for expressions of moral commitment.

43
10. Outcome/impact perspectives on further CGIAR
involvement with ES
10.1 Vision of agenda
Combining elements of all preceding tables and diagrams, an ambitious agenda might
focus on ten types of ‘boundary objects’, which can be co-developed with
stakeholders at local, national and global scales (Table 10.1.). The list has some
similarity with the 12 types of interventions that Meadows (1999) listed as entry
points of systemic change.
Table 10.1 Potential elements of a Theory of Agency for Change (ToA4C) for CGIAR
involvement in the environmental services arena
Local National Global
Wat
er
Lan
d h
eal
th
(Agr
o-)
bio
div
ers
ity
Nu
trie
nts
, C, G
HG
Me
so-c
limat
e
Lan
dsc
ape
be
auty
& s
pir
itu
alit
y
Hig
h b
iod
ive
rsit
y va
lue
lan
d
Wat
er
Lan
d h
eal
th
(Agr
o-)
bio
div
ers
ity
C, G
HG
, n
utr
ien
t cy
clin
g
Me
so-/
mac
ro-c
limat
e
Bio
div
ers
ity
con
serv
atio
n
SDG
1
SDG
2
SDG
5
SDG
6
SDG
7
SDG
13
SDG
13
Bo
un
dar
y w
ork
10. Data, observa-tion methods for M&E of change
Sentinel sites,
benchmarks, target
areas
(sub)national SDG indicators, bias corrections
9. Recognition of consequences for ES and all SDGs of busi-ness-as-usual land-use change from multi-stakeholder perspectives
Comparing,
contrasting and
synergizing local,
public/policy and
science-based
knowledge systems;
diagnostic stage of
negotiation support
Contribute to
‘green account-
ting’ methods,
their use and
scrutiny to
make assump-
tions explicit
8. ES-friendly land-use alternati-
Perennial/annual/livestock combina-
Operationalize
Climate-smart-

44
Local National Global
ves: technolo-gies, new value chains, outsour-cing staples
tions, integrated pest, nutrient, wa-ter management; market integration
agriculture and
similar
frameworks
7. Scenarios for land-use change in local context, valuation
LUMENS or similar
spatially explicit
tradeoff tools
Green economy
and related
(sub)national
planning tools
6. Negotiation platforms to form coalitions for desirable change
LUMENS as process tool in ‘learning landscapes’
Policy analysis, civil society networks, com-munication channels
NAMA, INDC; LPFN; CSA-alliance
Eco
no
mic
in
stru
me
nts
5. Co-investment in environmen-tal stewardship
Spatial planning, co-management con-tracts; local REDD+ implementation;
Removing perverse subsidies & policies; clarifying land tenure
4. Compensation for legal ES-un-friendly options foregone
Auction of ES
stewardship
contracts
REDD+ and green economy at subnational scale
3. Commodifica-tion of ES through eco-certification of products
Voluntary
standards,
public rules of
the game
Good Agricultural
Practice (GAP) in
WTO as minimum,
avoid subsidy from
natural capital
2. Commodifica-tion of ES as such
Requires strong
regulation of all
rights involved
REDD+ at international scale
Inte
grat
ion
1. Dynamic poly-centric gover-nance for in-tegral SDG achievement
The ultimate target, approachable by stepwise strengthening
of all relevant feedback loops

45
10.2 Suggested way forward for the CGIAR
1. Position the CGIAR to address the trade-offs and intersection of ‘agricultural
production’ with the wider set of SDGs
2. Contribute to, and interact with, global system thinking that explores the wider
interactions of various pathways towards ‘agricultural intensification’
3. Ensure that the negative consequences of agriculture and its intensification are
recognized in early stages of technology development
4. Connect with the primary international movers on the ‘ecosystem services’ and
‘environmental governance’ agenda, through a globally representative network
of sentinel and learning landscapes (with the sentinel function focused on
‘monitoring’, the learning on action research to find solutions)
5. Ensure that environmental service ‘boundary work’ is done in all types of
landscapes and land use with which the CGIAR engages, and that it is connected
in a global community of practice, linked with academic and governance circles.
6. Focus on the interface of rights-based approaches (clarification of state vs
community rights, community vs household, household vs individual), spatial
planning, macro-economic policy and the use of performance-based economic
instruments (‘PES’), to better understand the type of governance response that
can best facilitate sustainable development at local, national and global scales.
References 1
Baudron F, Giller KE, 2014. Agriculture and nature: Trouble and strife? Biological Conservation 170, 232–245
Bernard F, van Noordwijk M, Luedeling E, Villamor GB, Sileshi GW, Namirembe S. 2014. Social actors and unsustainability of agriculture. Current Opinion in Environmental Sustainability 6: 155-161. Cited by 7
Capistrano D, Samper C, Lee MJ, Raudsepp-Hearne C. 2005. Ecosystems and human well-being: multiscale assessments: findings of the Sub-global Assessments Working Group of the Millennium Ecosystem Assessment. Washington DC, USA. Island Press. Cited by 43
Clark WC, Tomich TP, van Noordwijk M, Guston D, Catacutan D, Dickson NM, McNie E. 2011. Boundary work for sustainable development: natural resource management at the Consultative Group on International Agricultural Research (CGIAR). Proceedings of the National Academy of Sciences of the United States of America (PNAS). doi:10.1073/pnas.0900231108. Cited by 99
Costanza R. 2014. A theory of socio-ecological system change. Journal of Bioeconomics 16(1): 39-44.
1 citation scores according to Scholar.Google, per March 1st 2014
46
Costanza R, Fisher B, Ali S, Beer C, Bond L, Boumans R, Snapp R. 2007. Quality of life: An approach integrating opportunities, human needs, and subjective well-being. Ecological economics 61(2): 267-276.
Costanza R, Alperovitz G, Daly H, Farley J, Franco C, Jackson T, Victor P. 2013. Building a sustainable and desirable economy-in-society-in-nature. Center for Resource Economics. Island Press. pp. 126-142.
Costanza R, de Groot R, Sutton P, van der Ploeg S, Anderson SJ, Kubiszewski I, Turner RK. 2014. Changes in the global value of ecosystem services. Global Environmental Change 26: 152-158.
Costanza R, Hart, M , Talberth, J , Posner, S. 2009. Beyond GDP: The need for new measures of progress. Pardee Paper No. 4. Boston, USA. Pardee Center for the Study of the Longer-Range Future.
Davis SC, Boddey RM, Alves BJR, Cowie A, Davies C, George B, Ogle SM, Smith P, van Noordwijk M, van Wijk M. 2013. Management swing potential for bioenergy crops. Global Change Biology Bioenergy 5: 623–638.
de Groot R, Brader L, van der Ploeg S, Costanza R, Bernard F, Braat L, Christie M, Crossman N, Ghermandi A, Hein L, Hussain S, Kumar P, McVittie A, Portela R, Rodriguez LC, ten Brink P, van Beukering P . 2012. Global estimates of the value of ecosystems and their services in monetary units. Ecosystem Services 1: 50–61.
de Royer S, et al. 2015. Self-identification of indigenous people in Indonesia: a historical analysis in the context of REDD+. International Forestry Review (accepted).
Dewi S, Ekadinata A, Indiarto D, Nugraha A, van Noordwijk M. 2015. Empowering local stakeholders for planning, Indonesia. ETFRN News 56: 51-57.
Duguma LA, Minang PA, van Noordwijk M. 2014. Climate change mitigation and adaptation in the land use sector: from complementarity to synergy. Environmental management 54(3): 420-432. Cited by 9
Galudra G, van Noordwijk M, Agung P, Suyanto S, Pradhan U. 2014. Migrants, land markets and carbon emissions in Jambi, Indonesia: land tenure change and the prospect of emission reduction. Mitigation and Adaptation Strategies for Global Change 19(6): 715-731. Cited by 9
García-Barrios L, Galván-Miyoshi YM, Valsieso-Pérez IA, Masera OR, Bocco G, Vandermeer J. 2009. Neotropical forest conservation, agricultural intensification, and rural out-migration: the Mexican experience. Bioscience 59(10): 863-873.
He J, Sikor T. 2015. Notions of justice in payments for ecosystem services: Insights from China’s Sloping Land Conversion Program in Yunnan Province. Land Use Policy 43: 207–216.
Herrero M, Thornton PK, Notenbaert AM, Wood S, Msangi S, Freeman HA, Rosegrant M. 2010. Smart investments in sustainable food production: revisiting mixed crop-livestock systems. Cited by 256
Ickowitz A, Powell B, Salim MA, Sunderland TCH. 2014. Dietary quality and tree cover in Africa. Global Environmental Change. http://dx.doi.org/10.1016/j.gloenvcha.2013.12.001

47
ISPC. 2014. Data, metrics and monitoring in CGIAR – a strategic study. Rome, Italy, CGIAR Independent Science and Partnership Council (ISPC). 88 pp.
Jack BK, Leimona B, Ferraro PJ. 2009. A revealed preference approach to estimating supply curves for ecosystem services: use of auctions to set payments for soil erosion control in Indonesia. Conservation Biology 23(2): 359-367. Cited by 86
Jackson L, van Noordwijk M, Bengtsson J, Foster W, Lipper L, Pulleman M, Vodouhe R. 2010. Biodiversity and agricultural sustainagility: from assessment to adaptive management. Current Opinion in Environmental Sustainability 2(1): 80-87. Cited by 67
Jackson LE, Pulleman MM, Brussaard L, Bawa KS, Brown GG, Cardoso IM, Van Noordwijk M. 2012. Social-ecological and regional adaptation of agrobiodiversity management across a global set of research regions. Global environmental change 22(3): 623-639. Cited by 26
Klapwijk CJ, van Wijk MT, Rosenstock TS, van Asten PJA, Thornton PK, Giller KE, 2014. Analysis of trade-offs in agricultural systems: current status and way forward. Current Opinion in Environmental Sustainability 2014, 6:110–115
Lambin EF, Meyfroidt P, Rueda X, Blackman A, Börner J, Cerutti PO, Wunder S. 2014. Effectiveness and synergies of policy instruments for land use governance in tropical regions. Global Environmental Change 28: 129-140.
Leimona B, Carrasco R. 2015. Auction analysis. In review with Land Use Policy
Leimona B, Joshi L, van Noordwijk M. 2009. Can rewards for environmental services benefit the poor? Lessons from Asia. International Journal of the Commons 3(1): 82-107. Cited by 57
Leimona B, van Noordwijk M, de Groot R, Leemans R. 2015a. Fairly efficient, efficiently fair: Lessons from designing and testing payment schemes for ecosystem services in Asia. Ecosystem Services 12: 16-28.
Leimona B, Lusiana B, van Noordwijk M, Ekadinata A, Mulyoutami E, Amaruzaman S. 2015b. Boundary work: knowledge co-production for negotiating payment for watershed services in Indonesia. Ecosystem Services (accepted)
Leimona B, Amaruzaman S, Arifin B, Yasmin F, Hasan F, Sprang P, Agusta H, Jaffee, Frias J. 2015c. Indonesia’s ’Green Agriculture’ Strategies and Policies: Closing the gap between aspirations and application. Occasional Paper 23. Nairobi, Kenya. World Agroforestry Centre.
Lopa D, Mwanyoka I, Jambiya G, Massoud T, Harrison P, Ellis-Jones M, Burgess ND. 2012. Towards operational payments for water ecosystem services in Tanzania: a case study from the Uluguru Mountains. Oryx 46(01): 34-44. Cited by 18
Lusiana B, van Noordwijk M, Johana F, Galudra G, Suyanto S, Cadisch G. 2014. Implications of uncertainty and scale in carbon emission estimates on locally appropriate designs to reduce emissions from deforestation and degradation (REDD+). Mitigation and Adaptation Strategies for Global Change 19(6): 757-772. Cited by 7
Matthews RB and van Noordwijk M. 2014. From euphoria to reality on efforts to reduce emissions from deforestation and forest degradation (REDD+). Mitigation and Adaptation Strategies for Global Change 19: 615–620.
48
Matthews RB, van Noordwijk M, Lambin EF, Meyfroidt P, Gupta J, Verchot LV, Hergoualc'h K and Veldkamp E. 2014. Implementing REDD+ (Reducing Emissions from Deforestation and Degradation): evidence on governance, evaluation and impacts from the REDD-ALERT project. Mitigation and Adaptation Strategies for Global Change 19(6): 907-925.
Mbow C, van Noordwijk M, Prabhu R, Simons T. 2014. Knowledge gaps and research needs concerning agroforestry's contribution to sustainable development goals in Africa. Current Opinion in Environmental Sustainability 6: 162-170. Cited by 6
Mbow C, Neely C, Dobie P. 2015. How can an integrated landscape approach contribute to the implementation of the Sustainable Development Goals (SDGs) and advance climate-smart objectives? pp 103- 117. In: Minang PA, van Noordwijk M, Freeman OE, Mbow C, de Leeuw J, Catacutan D (Eds.). Climate-Smart Landscapes: Multifunctionality In Practice. Nairobi, Kenya. World Agroforestry Centre (ICRAF).
MEA. 2005. Ecosystems and human well-being: synthesis. Millennium Ecosystem Assessment. Washington DC, USA. Island Press.
Meadows D. 1999. Leverage points: places to intervene in a system. Hartland, VT: The Sustainability Institute.
Minang PA, van Noordwijk M, Freeman OE, Mbow C, de Leeuw J and Catacutan D (eds). 2015a. Climate-Smart Landscapes: Multi-functionality in Practice. Nairobi, Kenya. World Agroforestry Centre (ICRAF). 405p.
Minang PA, Duguma LA, Alemagi D, van Noordwijk M. 2015b. Scale considerations in landscape approaches. pp 121-133. In: Minang PA, van Noordwijk M, Freeman OE, Mbow C, de Leeuw J, Catacutan D. (Eds.) Climate-Smart Landscapes: Multifunctionality In Practice. Nairobi, Kenya. World Agroforestry Centre (ICRAF).
Namirembe S, Leimona B, van Noordwijk M, Bernard F, Bacwayo KE. 2014. Co-investment paradigms as alternatives to payments for tree-based ecosystem services in Africa. Current Opinion in Environmental Sustainability 6: 89-97. Cited by 13
Ordonez JC, Luedeling E, Kindt R, Tata HL, Harja D, Jamnadass R, van Noordwijk M. 2014. Constraints and opportunities for tree diversity management along the forest transition curve to achieve multifunctional agriculture. Current Opinion in Environmental Sustainability 6: 54-60. Cited by 7
Reed J, Deakin L, Sunderland TC. 2015. What are ‘Integrated Landscape Approaches’ and how effectively have they been implemented in the tropics: a systematic map protocol. Environmental Evidence 2015, 4:2
Rockström J, Steffen W, Noone K, Persson Å, Chapin FS, Lambin EF, Lenton TM, Scheffer M, Folke C, Schellnhuber HJ. 2009. A safe operating space for humanity. Nature 461: 472–475. Cited by 2630
Sayer J, Sunderland T, Ghazoul J, Pfund JL, Sheil D, Meijaard E, Buck LE. 2013. Ten principles for a landscape approach to reconciling agriculture, conservation, and other competing land uses. Proceedings of the National Academy of Sciences 110(21): 8349-8356.
Sikor T, Martin A, Fisher J, He J. 2014. Toward an Empirical Analysis of Justice in Ecosystem Governance Conservation Letters 7(6): 524–532.

49
Swallow BM, Kallesoe MF, Iftikhar UA, van Noordwijk M, Bracer C, Scherr SJ, Rumley R. 2009a. Compensation and rewards for environmental services in the developing world: framing pan-tropical analysis and comparison. Ecology and Society 14(2): 26.
Swallow BM, Sang JK, Nyabenge M, Bundotich DK, Duraiappah AK, Yatich TB. 2009b. Tradeoffs, synergies and traps among ecosystem services in the Lake Victoria basin of East Africa. Environmental science policy 12(4): 504-519. Cited by 75
Swift MJ, Izac AM, van Noordwijk M. 2004. Biodiversity and ecosystem services in agricultural landscapes—are we asking the right questions? Agriculture, Ecosystems Environment 104(1): 113-134. Cited by 430
Tomich TP, Thomas DE, Van Noordwijk M. 2004a. Environmental services and land use change in Southeast Asia: from recognition to regulation or reward? Agriculture, Ecosystems Environment 104(1): 229-244. Cited by 106
Tomich TP, Chomitz K, Francisco H, Izac AMN, Murdiyarso D, Ratner BD, van Noordwijk M. 2004b. Policy analysis and environmental problems at different scales: asking the right questions. Agriculture, ecosystems environment 104(1): 5-18.
van der Ent RJ, Savenije HH, Schaefli B, Steele‐Dunne SC. 2010. Origin and fate of atmospheric moisture over continents. Water Resources Research 46(9). DOI: 10.1029/2010WR009127
van Noordwijk M. 2006. RUPES typology of environmental service worthy of reward, RUPES Working Paper. Bogor, Indonesia. World Agroforestry Centre (ICRAF). 53p.
van Noordwijk M. 2014. Agroforestry as plant production system in a multifunctional landscape. Inaugural lecture upon taking up the special professorship in Agroforestry at Wageningen University 16 October 2014. Wageningen, Netherlands. Wageningen University. 24 p.
van Noordwijk M, Brussaard L. 2014. Minimizing the ecological footprint of food: closing yield and efficiency gaps simultaneously? Current Opinion in Environmental Sustainability 8: 62-70.
van Noordwijk M, Villamor GB. 2014. Tree cover transitions in tropical landscapes: hypotheses and cross-continental synthesis. In: Minang PA, van Noordwijk M and Kahurani E (eds). Partnership in the Tropical Forest Margins: a 20-Year Journey in Search of Alternatives to Slash-and-Burn. Nairobi, Kenya. ASB Partnership for the Tropical Forest Margins. P.17-22.
van Noordwijk M and Sunderland TC. 2014. Productive landscapes: what role for forests, trees and agroforestry? In: Chavez-Tafur J and Zagt RJ (eds). Towards Productive Landscapes. Wageningen, the Netherlands. Tropenbos International. P. 9-16.
van Noordwijk M, Tomich TP, Verbist B. 2003. Negotiation support models for integrated natural resource management in tropical forest margins. Integrated Natural Resource Management: Linking Productivity, the Environment, and Development. P. 87-108. Cambridge, MA, USA. CABI Publishing. Cited by 117
van Noordwijk M, Leimona B. 2010. Principles for fairness and efficiency in enhancing environmental services in Asia: payments, compensation, or co-investment. Ecology and Society 15(4), 17. Cited by 64
50
van Noordwijk M, Lusiana B, Villamor GB, Purnomo H, Dewi S. 2011a. Feedback loops added to four conceptual models linking land change with driving forces and actors. Ecology and Society 16(1). http://www.ecologyandsociety.org/vol16/iss1/resp1/
van Noordwijk M, Hoang MH, Neufeldt H, Öborn I, Yatich T (eds). 2011b. How trees and people can co-adapt to climate change: reducing vulnerability through multifunctional agroforestry landscapes. Nairobi, Kenya. World Agroforestry Centre (ICRAF). 134 pp
van Noordwijk M, Leimona B, Jindal R, Villamor GB, Vardhan M, Namirembe S, Tomich TP. 2012a. Payments for environmental services: evolution toward efficient and fair incentives for multifunctional landscapes. Annual Review of Environment and Resources 37: 389-420. Cited by 38
van Noordwijk M, Tata HL, Xu J, Dewi S, Minang PA. 2012b. Segregate or integrate for multifunctionality and sustained change through rubber-based agroforestry in Indonesia and China. In Agroforestry-The Future of Global Land Use. Springer, Netherlands. pp. 69-104. Cited by 27
van Noordwijk M, Lusiana B, Leimona B, Dewi S, Wulandari D (eds). 2013. Negotiation-support toolkit for learning landscapes. Bogor, Indonesia. World Agroforestry Centre (ICRAF).
van Noordwijk M, Bizard V, Wangpakapattanawong P, Tata HL, Villamor GB, Leimona B. 2014a. Tree cover transitions and food security in Southeast Asia. Global Food Security 3(3): 200-208. Cited by 5
van Noordwijk M, Bayala J, Hairiah K, Lusiana B, Muthuri C, Khasanah N, Mulia R. 2014b. Agroforestry solutions for buffering climate variability and adapting to change. Climate Change Impact and Adaptation in Agricultural Systems. CAB-International. Wallingford, UK. P.216-232. Cited by 6
van Noordwijk M, Agus F, Dewi S, Purnomo H. 2014c. Reducing emissions from land use in Indonesia: motivation, policy instruments and expected funding streams. Mitigation and Adaptation Strategies for Global Change 19(6): 677-692. Cited by 16
van Noordwijk M, Matthews R, Agus F, Farmer J, Verchot L, Hergoualc’h K, Dewi S. 2014d. Mud, muddle and models in the knowledge value-chain to action on tropical peatland conservation. Mitigation and Adaptation Strategies for Global Change 19(6): 887-905. Cited by 4
van Noordwijk M , Namirembe S, Catacutan D, Williamson D, Gebrekirstos A. 2014e. Pricing rainbow, green, blue and grey water: tree cover and geopolitics of climatic teleconnections. Current Opinion in Environmental Sustainability 6: 41-47. Cited by 12
van Noordwijk M, Leimona B, Ma X, Tanika L, Namirembe S and Suprayogo D. 2015a. Water-focused landscape management. In: Minang PA, van Noordwijk M, Freeman OE, Mbow C, de Leeuw J and Catacutan D (eds). Climate-Smart Landscapes: Multifunctionality In Practice. Nairobi, Kenya. World Agroforestry Centre (ICRAF). P. 179-193
van Noordwijk M, Minang PA, Freeman OE, Mbow C and de Leeuw J. 2015b. The future of landscape approaches: interacting theories of place and change. In: Minang PA, van Noordwijk M, Freeman OE, Mbow C, de Leeuw J and Catacutan D (eds). Climate-Smart Landscapes: Multifunctionality In Practice. Nairobi, Kenya. World Agroforestry Centre (ICRAF). P. 375-387

51
van Noordwijk M, Minang PA, Hairiah K. 2015c. Swidden transitions, in an era of climate change. pp 261-280. In: Cairns MF (Ed.) Shifting Cultivation and Environmental Change: Indigenous People, Agriculture and Forest Conservation. Earthscan. Oxon, UK.
Villamor GB, Desrianti F, Akiefnawati R, Amaruzaman S, van Noordwijk M. 2014a. Gender influences decisions to change land use practices in the tropical forest margins of Jambi, Indonesia. Mitigation and Adaptation Strategies for Global Change 19(6): 733-755. Cited by 7
Villamor GB, Le QB, Djanibekov U, van Noordwijk M, Vlek PL. 2014b. Biodiversity in rubber agroforests, carbon emissions, and rural livelihoods: An agent-based model of land-use dynamics in lowland Sumatra. Environmental Modelling Software 61: 151-165. Cited by 13
Villamor GB, van Noordwijk M, Djanibekov U, Chiong-Javier ME, Catacutan D. 2014c. Gender differences in land-use decisions: shaping multifunctional landscapes?. Current Opinion in Environmental Sustainability 6: 128-133. Cited by 9
Villamor GB, Dah-gbeto PA, Bell A, Pradhan U, van Noordwijk M. 2015a. Gender-specific spatial perspectives and scenario building approaches for understanding gender equity and sustainability in climate-smart landscapes. In: Minang PA, van Noordwijk M, Freeman OE, Mbow C, de Leeuw J, Catacutan D (Eds.) Climate-Smart Landscapes: Multifunctionality In Practice. Nairobi, Kenya. World Agroforestry Centre (ICRAF). P. 211-224.
Villamor GB, Akiefnawati R, Van Noordwijk M, Desrianti F, Pradhan U. 2015b. Land use change and shifts in gender roles in central Sumatra, Indonesia. International Forestry Review, 17(1), **-**.
Wunder S. 2005. Payments for environmental services: some nuts and bolts. Jakarta, Indonesia. CIFOR. Cited by 1170
Wunder S. 2007. The efficiency of payments for environmental services in tropical conservation. Conservation biology 21(1): 48-58. Cited by 571
Wunder S. 2013. When payments for environmental services will work for conservation. Conservation Letters 6(4): 230-237. Cited by 31
Wunder S. 2015. Revisiting the concept of payments for environmental services. Ecological Economics. Cited by 1
Zomer RJ, Trabucco A, Coe R, Place F, van Noordwijk M, Xu J. 2014. Trees on farms: an update and reanalysis of agroforestry’s global extent and socio-ecological characteristics. Working Paper. Bogor, Indonesia. World Agroforestry Centre (ICRAF). Cited by 4

52
Attachment 1. Sustainable Development Goals
The SDG’s can be classified by relation with X and Y axis in Fig. 1.1:
Mostly related to X-axis
Equally linked to X and Y Mostly related to Y-axis
SDG1 “End poverty in all its forms everywhere”
SDG2 “End hunger, achieve food security and improved nutrition and promote sustain-able agriculture”
SDG3 “Ensure healthy lives and promote well-being for all at all ages”
SDG4 “Ensure inclusive and equitable quality education and promote life-long learning opportunities for all”
SDG5 “Achieve gender equality and empower all women and girls ”
SDG7 “Ensure access to affordable, reliable, sustainable and modern energy for all”
SDG8 “Promote sustained, inclusive and sustainable economic growth, full and productive employment and decent work for all”
SDG9 “Build resilient infrastructure, promote inclusive and sustainable industrialization and foster innovation”
SDG10 “Reduce inequality within and among countries”
SDG12 “Ensure sustainable consumption and production patterns”
SDG16 “Promote peaceful and inclusive societies for sustainable development, provide access to justice for all and build effective, accountable and inclusive institutions at all levels”
SDG17 “Strengthen the means of implementation and revitalize the global partnership for sustainable development”
SDG6 “Ensure availability and sustainable management of water and sanitation for all”
SDG13 “Take urgent action to combat climate change and its impacts”
SDG15 “Protect, restore and promote sustainable use of terrestrial ecosystems, sustainably manage forests, combat desertification, and halt and reverse land degradation and halt biodiversity loss”
SDG11 “Make cities and human settlements inclusive, safe, resilient and sustainable”
SDG14 “Conserve and sustainably use the oceans, seas and marine resources for sustainable development”

53
Attachment 2. Typology of environmental services
Van Noordwijk (2006) provided a typology; for updated watershed services see Table
2 .1
Biodiversity-related
B1. Protecting the integrity of conservation areas by preventing loss of habitat
and threats at population level in the areas directly around core protection
areas,
B2. Providing habitat for a sub-set of the original fauna and flora inside agri-
culturally used landscapes (this increases in relevance with the increasing loss
of more natural habitat; it will only allow the conservation of part of the
original species pool – with losers among the organisms that few people wants
to have in their backyard (tigers, elephants) or as direct neighbours, and those
that cannot tolerate people as neighbours from their side),
B3. Maintaining connectivity between protected areas via corridors,
B4. Creating opportunities for local-level ‘restoration’, in landscapes where
connectivity is still maintained,
B5. Various forms of ex situ conservation,
L1. Landscape beauty as basis for ecotourism.
Carbon stocks, greenhouse gasses and air pollutants
C1. Protecting forest area
C2. Protecting above- and/or belowground carbon stocks in areas used for
forestry and/or agriculture
C3. Restoration, increase in tree cover (in a ‘sustainable harvest’ regime the
time-averaged C stock does not depend on the growth rate, but on maximum
stock at time of harvest)
C4. Accumulating wood and other products derived from recent plant
production in, for example, the form of houses, furniture, paper, organic waste
dumps.
C5. Reducing emissions of non-CO2 greenhouse gasses (CH4, N2O)
C5. Clean air, absence of haze

54
Attachment 3. Key messages derived from
PIM/WLE/FTA workshop, November 2014
Research Questions
Measurement and valuation of ES themselves o What difference does an ES approach make? o Multi- versus single (Systems Approaches) o Including tools for negotiating trade-offs and synergies
Across space, time (generations), and society Strong meso-scale work linking ES to Value -> weak above and below.
o Questions of equity – whose values? o Lack of research in the livelihood values of ES (food security, risk
reduction, resource sharing) o Does landscape (biophysical, socio-ecological, institution) provide a
common language for ES management.
Role of institutions in delivering those benefits o What is the responsibility of institutions recognizing/verbalizing indirect
values? o Critical role of institutions in negotiation of trade-offs (strong equity
element here) o What is the range of modalities?
PES, Markets, extension, rules
55
o Under what conditions are these modalities effective (Latin America: strong state; Africa: weak state). Contextualising institutional arrangements.
o Benefits to institutional actors? o What are the implications for how institutions operate and interact? o Strong emphasis on co-production/trust -> how does this translate to
national scales and up? o Is the role of (P)ES service delivery, or creating an institutional space?
(ecology vs. society). o Can you deliver on an ES agenda where institutions are weak or does this
necessitate a resilience approach.
How do we intervene. o Need for systems thinking within institutions. o Action research, monitoring of process, awareness of the role of research
(Mode 2: Engaged research) o Awareness raising -> risk management, livelihood improvements? o Engaging with policy, politics and power? o Identifying policy windows and opportunities.


The Sustainable Development Goals try to reconcile the unfinished business of the human development deficit at the bottom of the pyramid, with the realization of planetary boundaries and the need for substantial gains in the efficiency of enhancing human wellbeing per unit resource use. Agriculture, still over a third of global employment, will need to transform towards greater productivity per unit land and labour but will also need to minimize direct negative external environmental effects. The transformative change needed cannot be achieved by following sectoral approaches and the institutional landscape that have brought us to where we are. Beyond building on past strengths of crop genetic improvement and associated technology for intensifying agriculture, the international agricultural research of the CGIAR has picked up the challenge of contributing to the more integral perspectives of sustainable development goals. As contribution to the wider debate this booklet introduces and reviews underlying concepts of environmental services, takes stock of ongoing work in a number of CGIAR research programs, suggesting ways forward that will combine place-based analysis and support for ‘learning landscapes’, with national policy reform and emergence of international institutions that link beneficiaries and providers of such services, combining fairness and efficiency.