Embed Size (px)
Citation preview
Approaches to Dietary Pattern Analyses: Potential to Inform Guidance
Susan M Krebs-Smith, PhD, MPH January 13, 2014

n
n
n
n
n
n
n
n
n
n
n
Acknowledgements
L Beth Dixon Suzen M Moeller Patricia M Guenther PK Newby Kurt Hoffman Jill Reedy Angela Liese Mathias Schulze Amy E Millen Katherine L Tucker Paige Miller
n
n
n
n
n
Outline
What do we mean by dietary patterns, and why are we interested? What are the primary methods for studying dietary patterns, and what questions do they address? How do methodological considerations affect results? What questions, if answered, could inform guidance? Challenges ahead
Introduction, definitions
*
n
Definition of dietary patterns
The quantities, proportions, variety or combination of different foods, drinks, and nutrients in diets, and the frequency with which they are habitually consumed*
Nutrition Evidence Library, Technical Expert Collaborative on Study of Dietary Patterns
Definition of dietary patterns
n The quantities, proportions, variety or combination of different foods, drinks, and nutrients in diets, and the frequency with which they are habitually consumed*
* Nutrition Evidence Library, Technical Expert Collaborative on Study of Dietary Patterns
Definition of dietary patterns
n The quantities, proportions, variety or combination of different foods, drinks, and nutrients in diets, and the frequency with which they are habitually consumed*
* Nutrition Evidence Library, Technical Expert Collaborative on Study of Dietary Patterns
Definition of dietary patterns
n The quantities, proportions, variety or combination of different foods, drinks, and nutrients in diets, and the frequency with which they are habitually consumed*
* Nutrition Evidence Library, Technical Expert Collaborative on Study of Dietary Patterns
Why study dietary patterns?
n Complexity of diet n Correlation among dietary constituents n Evidence for positive health outcomes with
changes in “total diet” n Relevance for policy and guidance
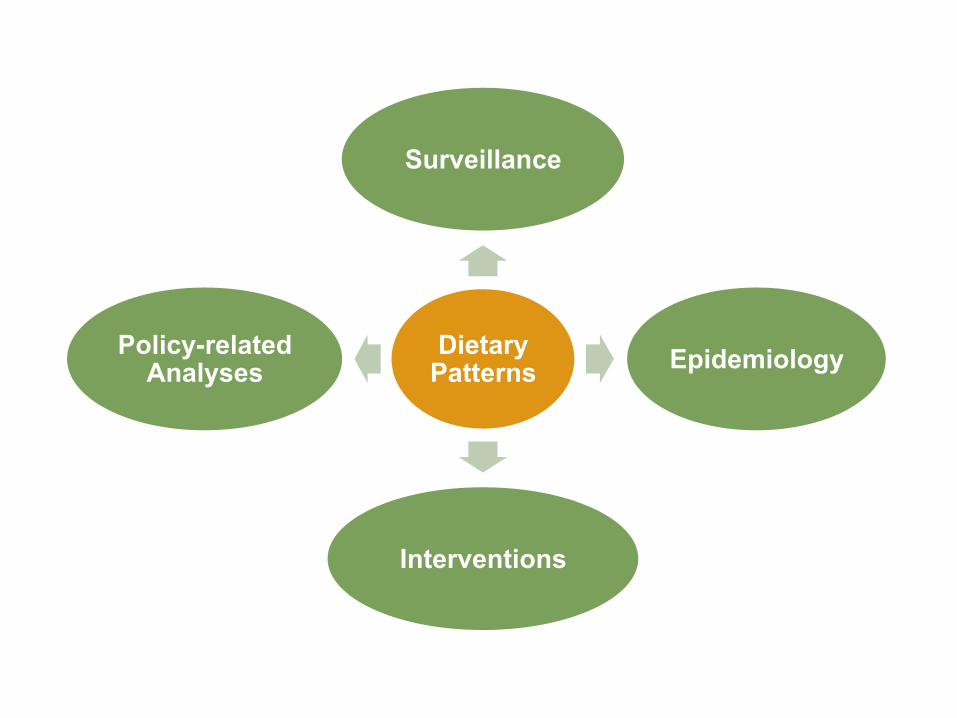
Dietary Patterns
Surveillance
Epidemiology
Interventions
Policy-related Analyses
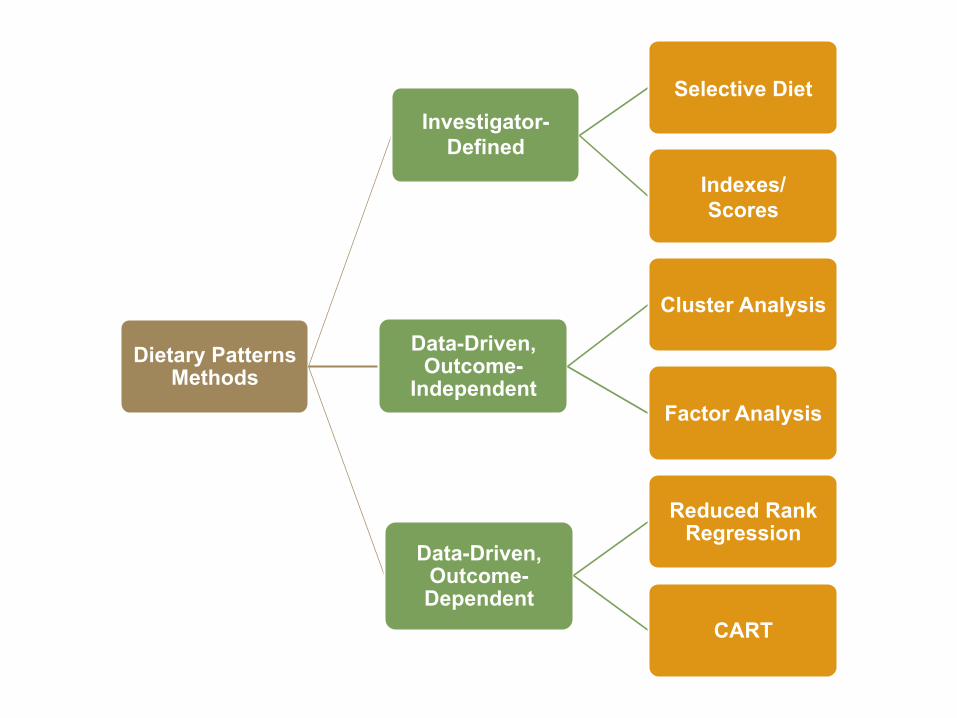
Methods for studying dietary patterns
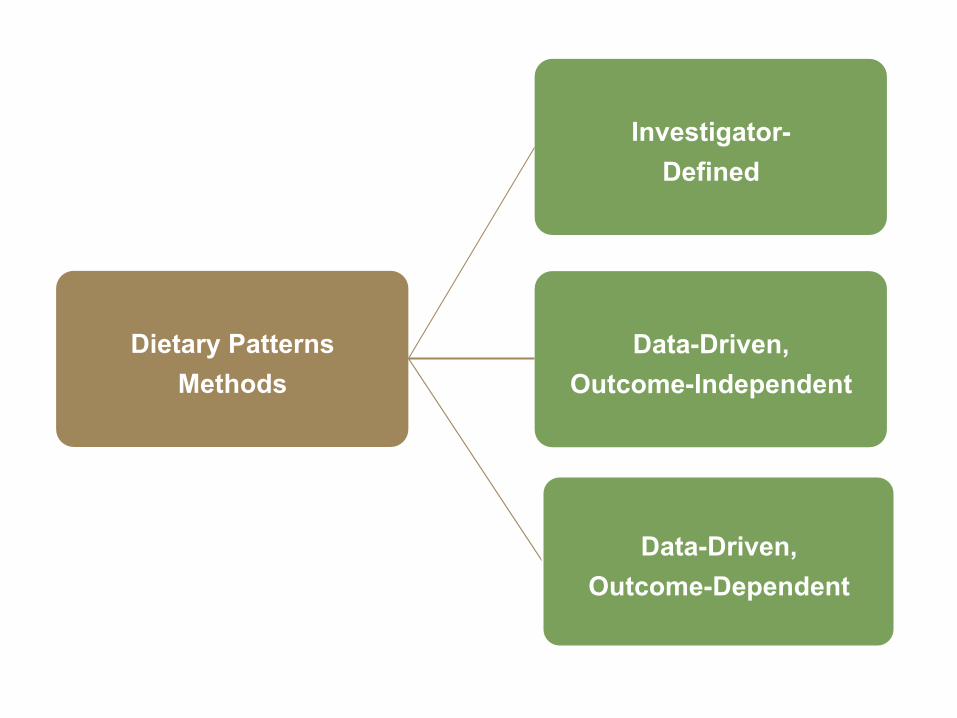
Dietary Patterns Methods
Investigator- Defined
Data-Driven, Outcome-Independent
Data-Driven, Outcome-Dependent
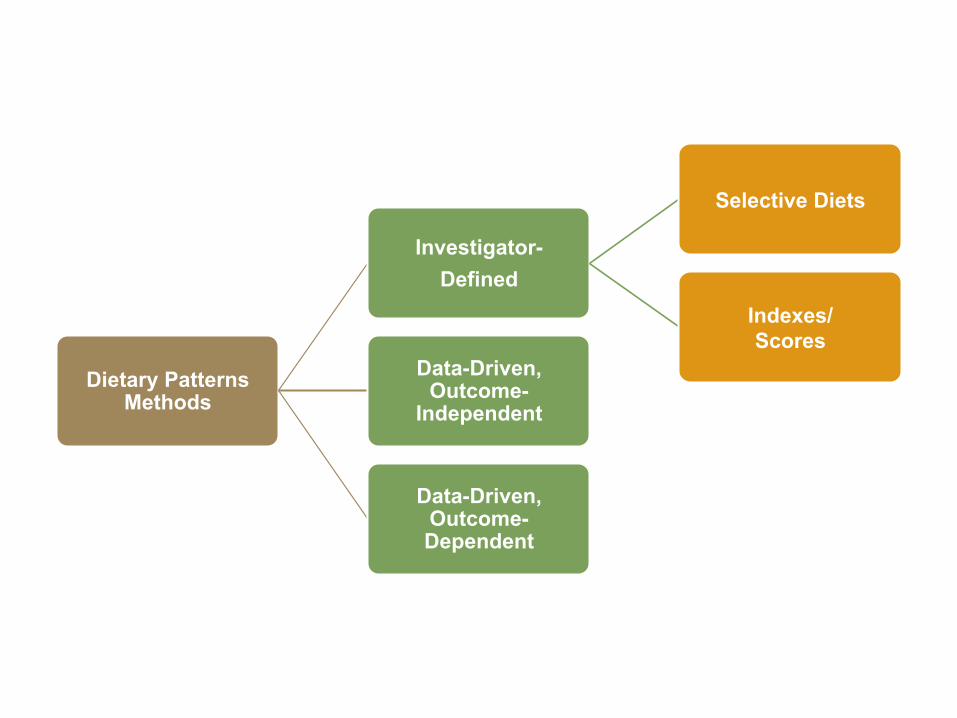
Dietary PatternsMethods
Investigator- Defined
Selective Diets
Indexes/ Scores
Data-Driven, Outcome-
Independent
Data-Driven, Outcome- Dependent
Selective Diets (e.g., Vegetarian)
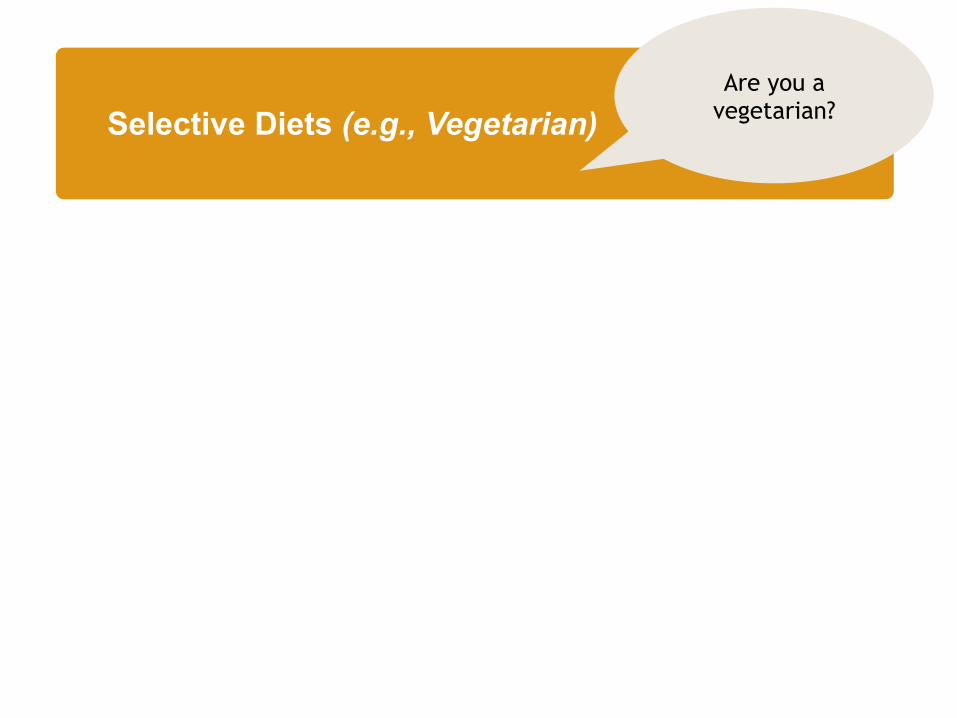
Selective Diets (e.g., Vegetarian) Are you a
vegetarian?
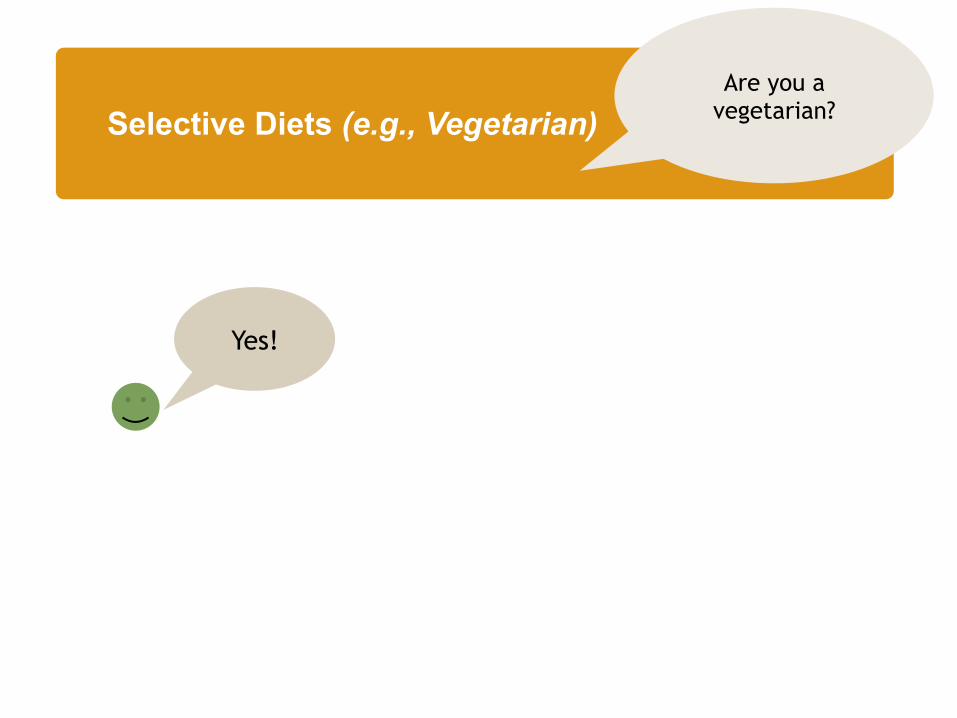
Selective Diets (e.g., Vegetarian) Are you a
vegetarian?
Yes!
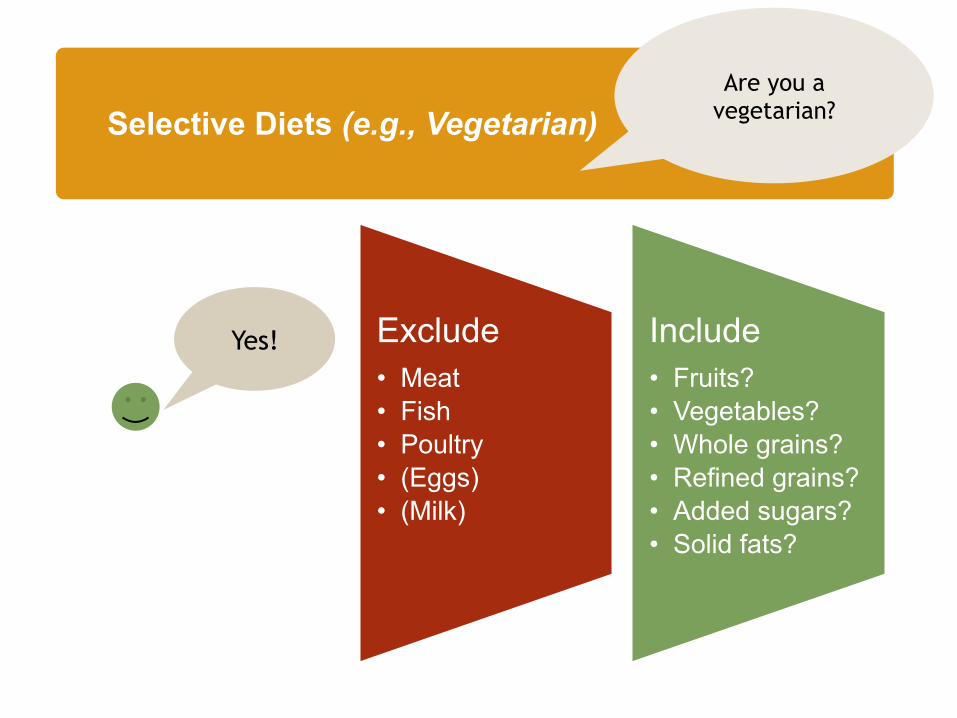
Selective Diets (e.g., Vegetarian) Are you a
vegetarian?
Yes! Exclude • Meat • Fish • Poultry • (Eggs) • (Milk)
Include • Fruits? • Vegetables? • Whole grains? • Refined grains? • Added sugars? • Solid fats?

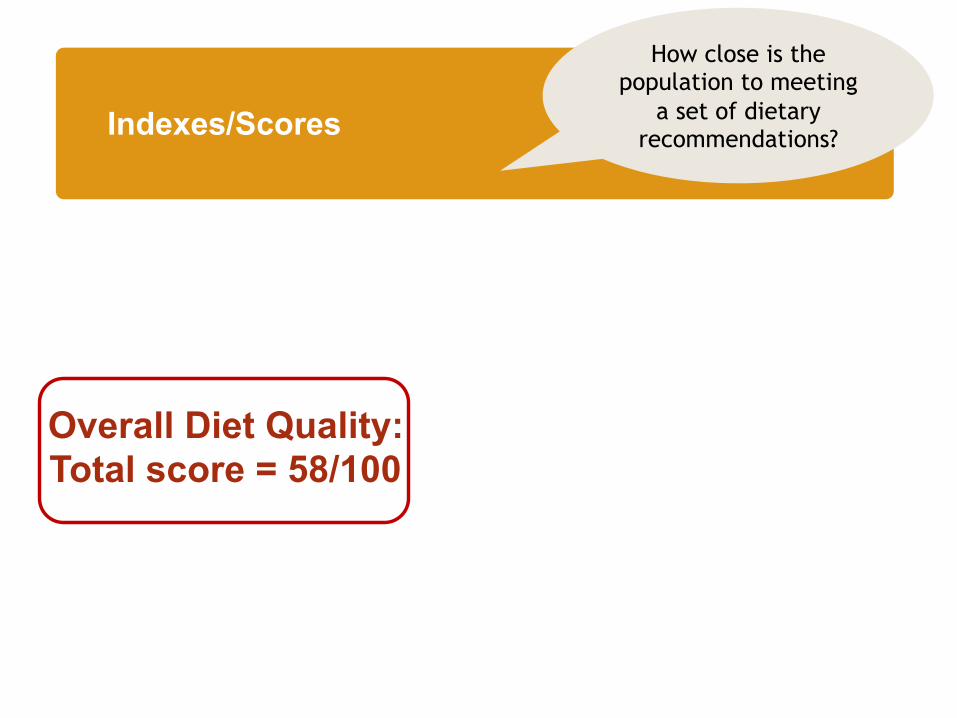
Indexes/Scores

Indexes/Scores
How close is the population to meeting
a set of dietary recommendations?
Indexes/Scores
How close is the population to meeting
a set of dietary recommendations?
Overall Diet Quality: Total score = 58/100
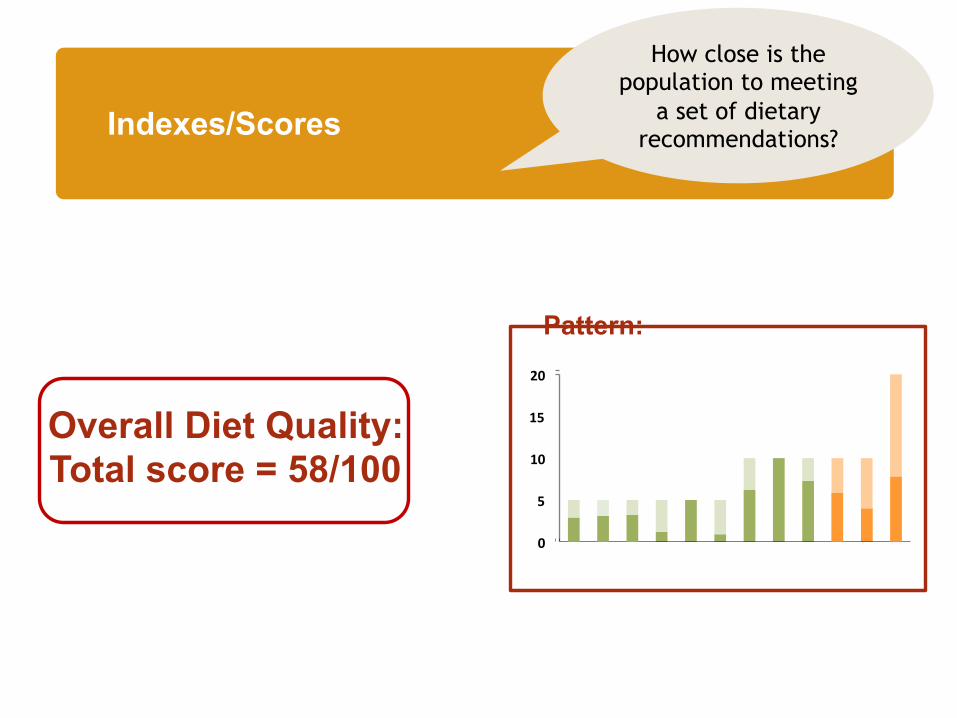
Overall Diet Quality: Total score = 58/100
Indexes/Scores
How close is the population to meeting
a set of dietary recommendations?
Pattern: 20
15
10
5
0
n
n
n
n
n
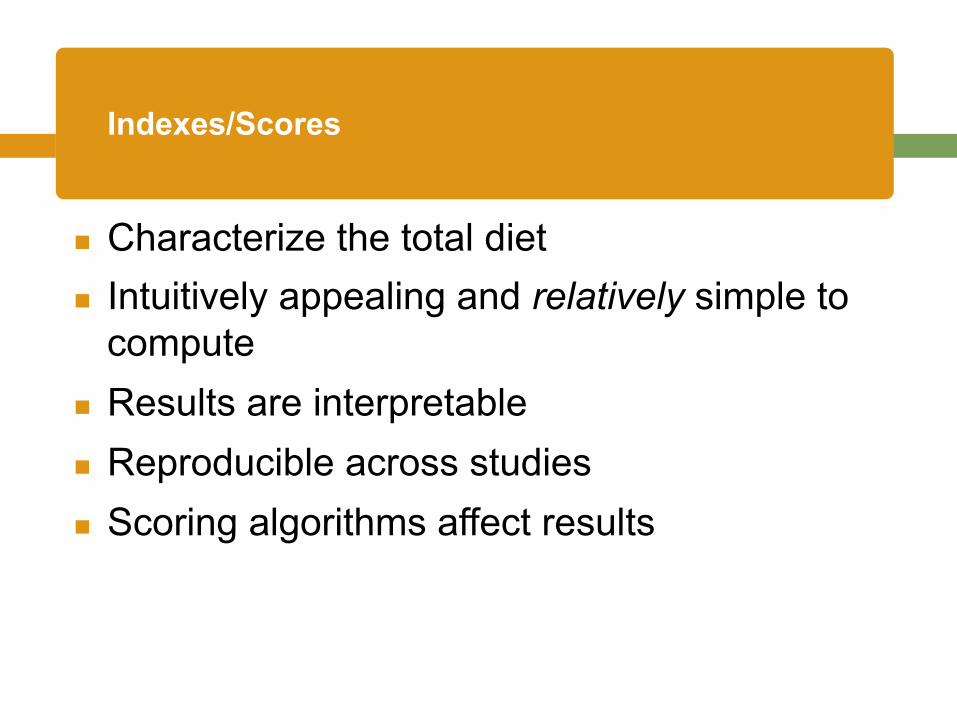
Indexes/Scores
Characterize the total diet Intuitively appealing and relatively simple to compute Results are interpretable Reproducible across studies Scoring algorithms af fect results
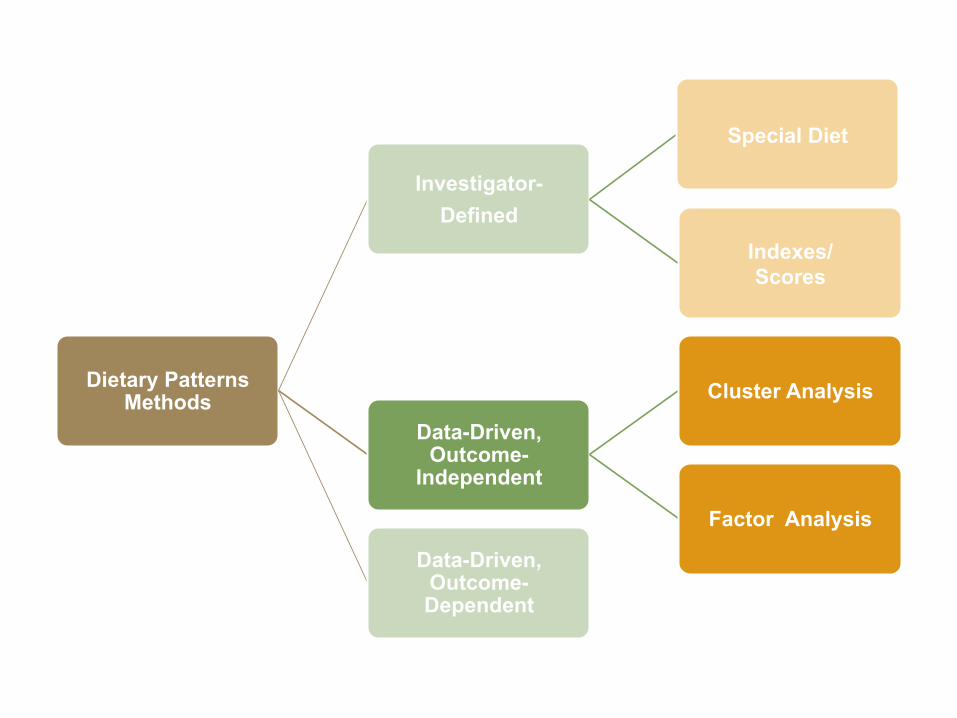
Dietary PatternsMethods
Investigator- Defined
Special Diet
Indexes/ Scores
Data-Driven, Outcome-
Independent
Cluster Analysis
Factor Analysis
Data-Driven, Outcome- Dependent
Cluster Analysis

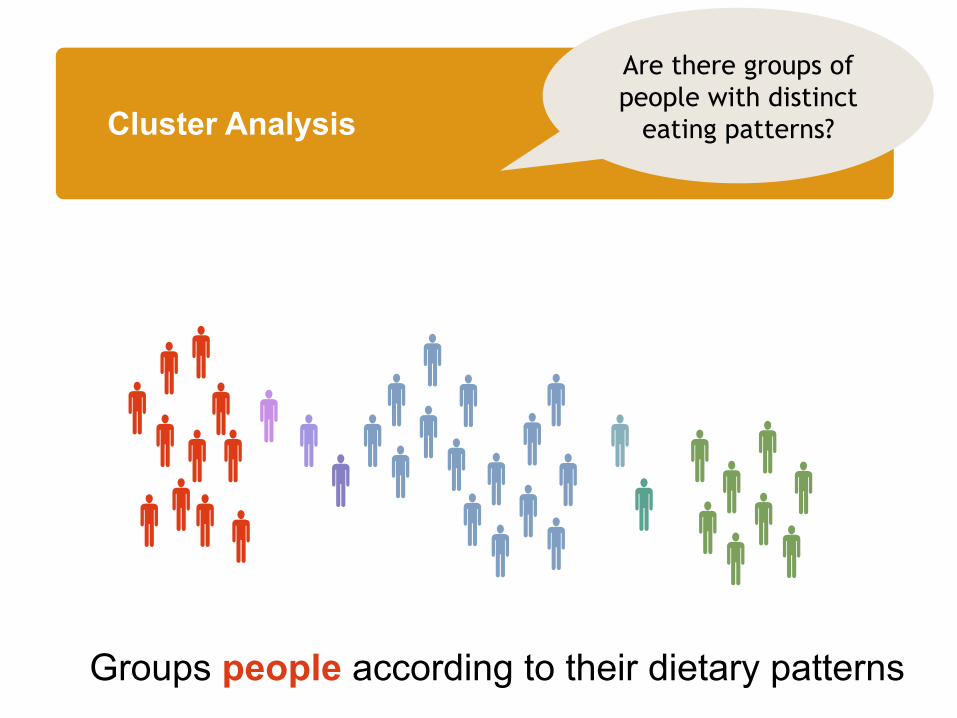
Cluster Analysis
Are there groups of people with distinct
eating patterns?
Cluster Analysis
Are there groups of people with distinct
eating patterns?
Groups people according to their dietary patterns
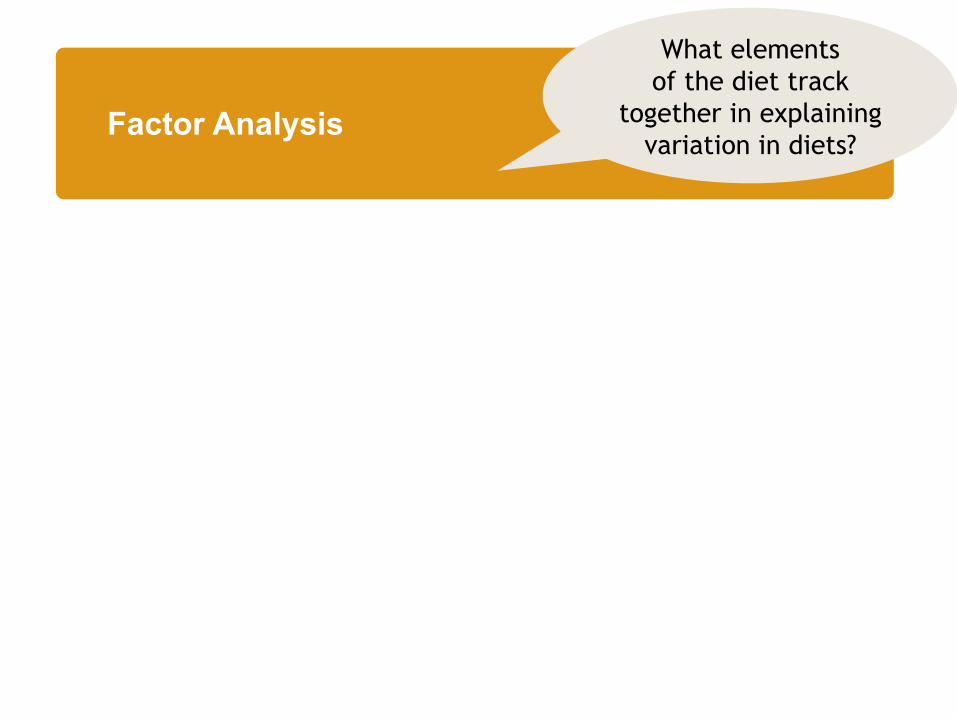
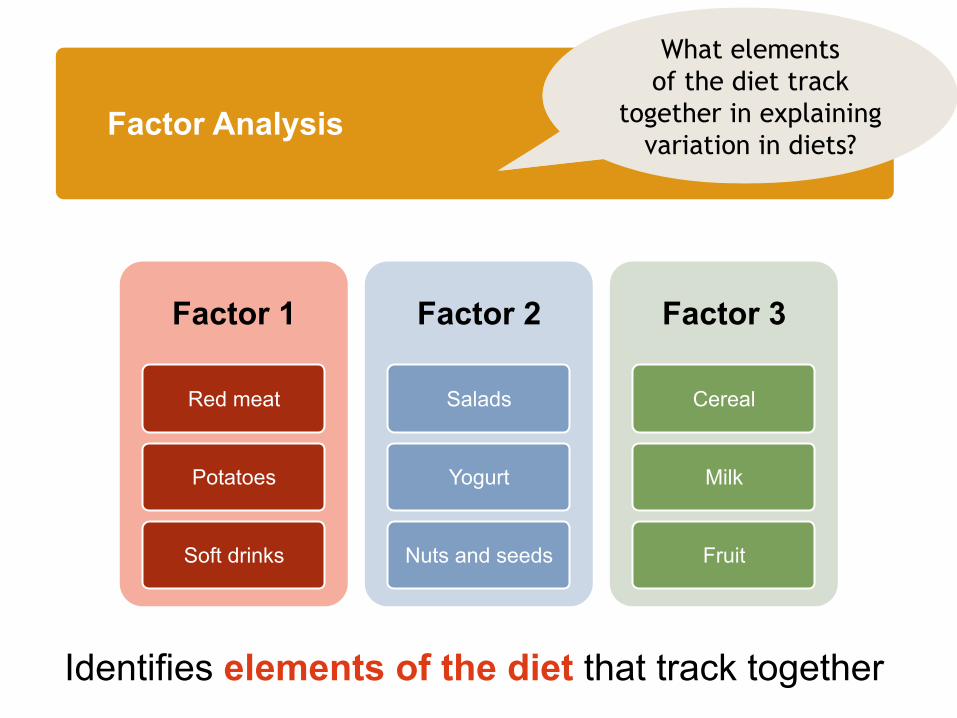
Factor Analysis
Factor Analysis
What elements of the diet track
together in explaining variation in diets?
What are the dietary patterns in this
population?
Factor Analysis
Factor 1
Red meat
Potatoes
Soft drinks
Factor 2
Salads
Yogurt
Nuts and seeds
Factor 3
Cereal
Milk
Fruit
What elements of the diet track
together in explaining variation in diets?
Identifies elements of the diet that track together
n
n
n
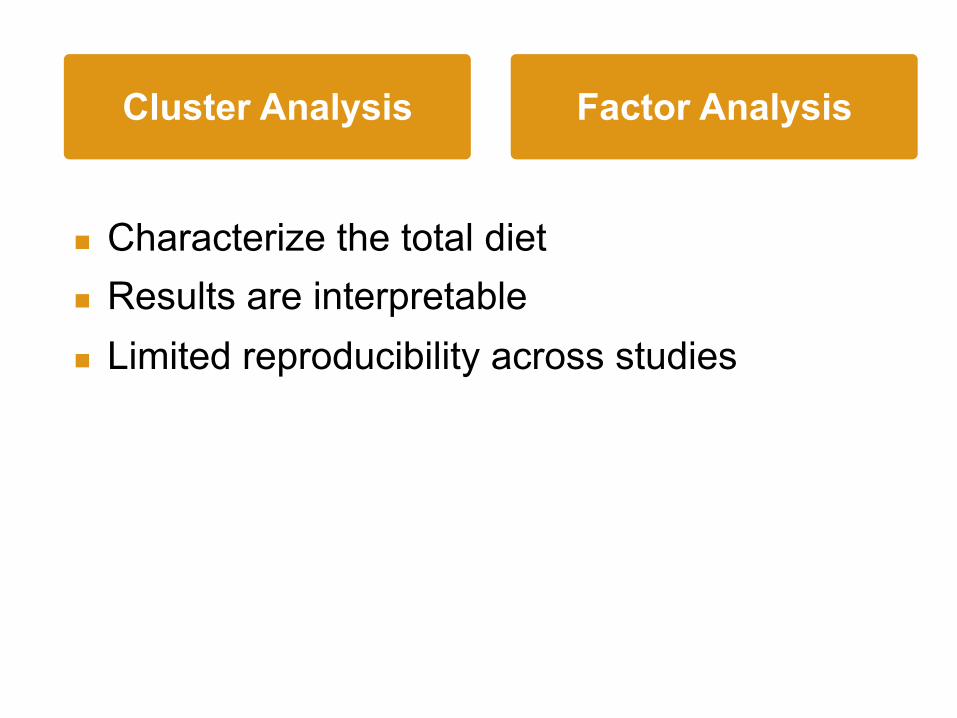
Cluster Analysis Factor Analysis
Characterize the total diet Results are interpretable Limited reproducibility across studies
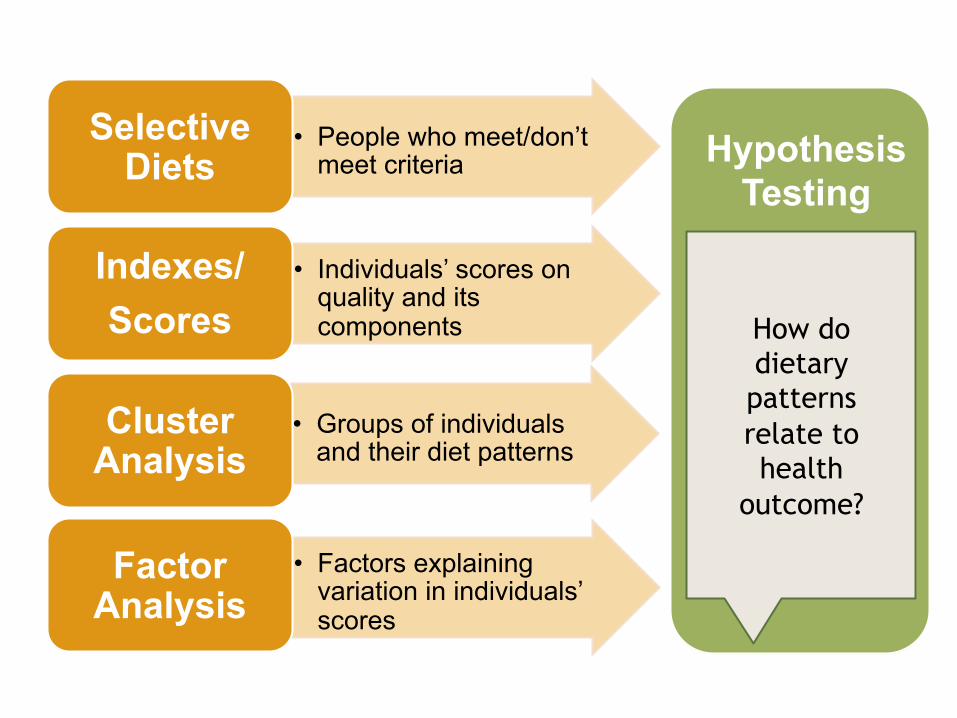
Hypothesis Testing
• People who meet/don’t meet criteria
Selective Diets
• Individuals’ scores on quality and its components
Indexes/ Scores
• Groups of individuals and their diet patterns
Cluster Analysis
• Factors explaining variation in individuals’ scores
Factor Analysis
How do dietary patterns relate to health
outcome?
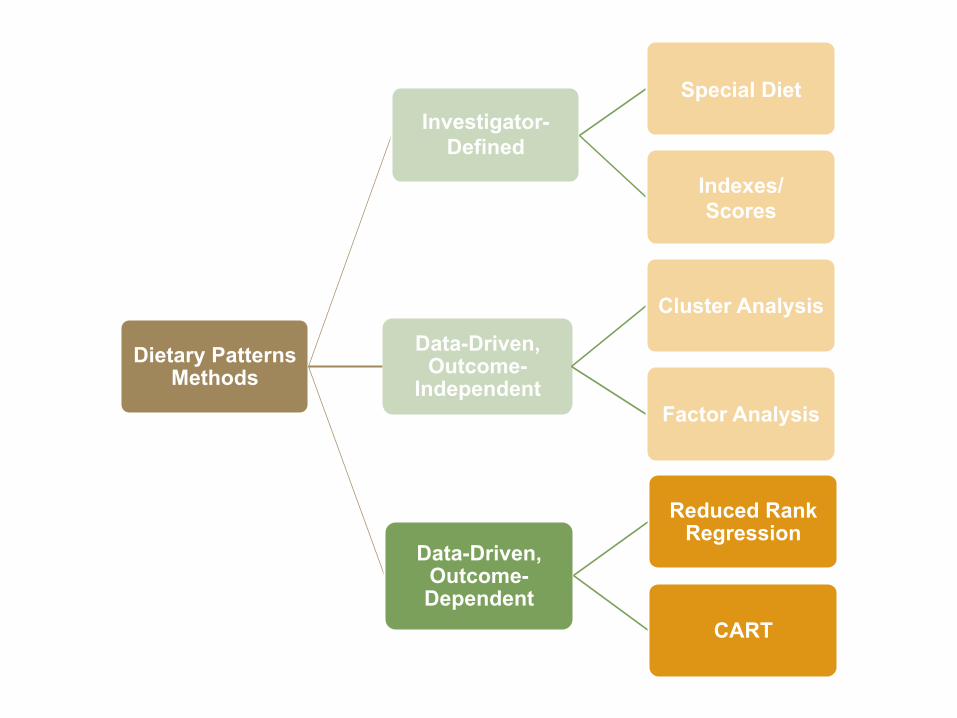
Dietary Patterns Methods
Investigator-
Defined
Special Diet
Indexes/ Scores
Data-Driven, Outcome-
Independent
Cluster Analysis
Factor Analysis
Data-Driven, Outcome-Dependent
Reduced Rank Regression
CART
Reduced Rank Regression

Reduced Rank Regression
What combination of foods explains the most
variation in a set of intermediate health
markers?
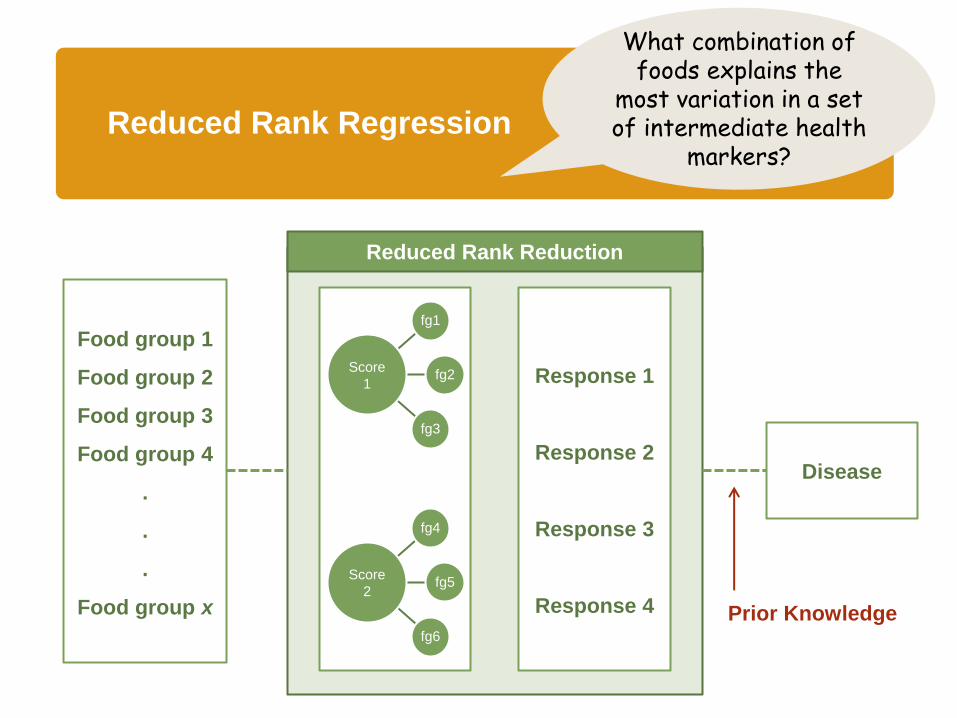
Reduced Rank Regression
What combination of foods explains the
most variation in a set of intermediate health
markers?
Food group 1
Food group 2
Food group 3
Food group 4
.
.
.
Food group x
Response 1
Response 2
Response 3
Response 4
Disease
fg1
fg2
fg3
fg4
fg5
fg6
Score
1
Score
2
Reduced Rank Reduction
Prior Knowledge

CART
CART
What dietary components explain the
most variation in a health outcome?
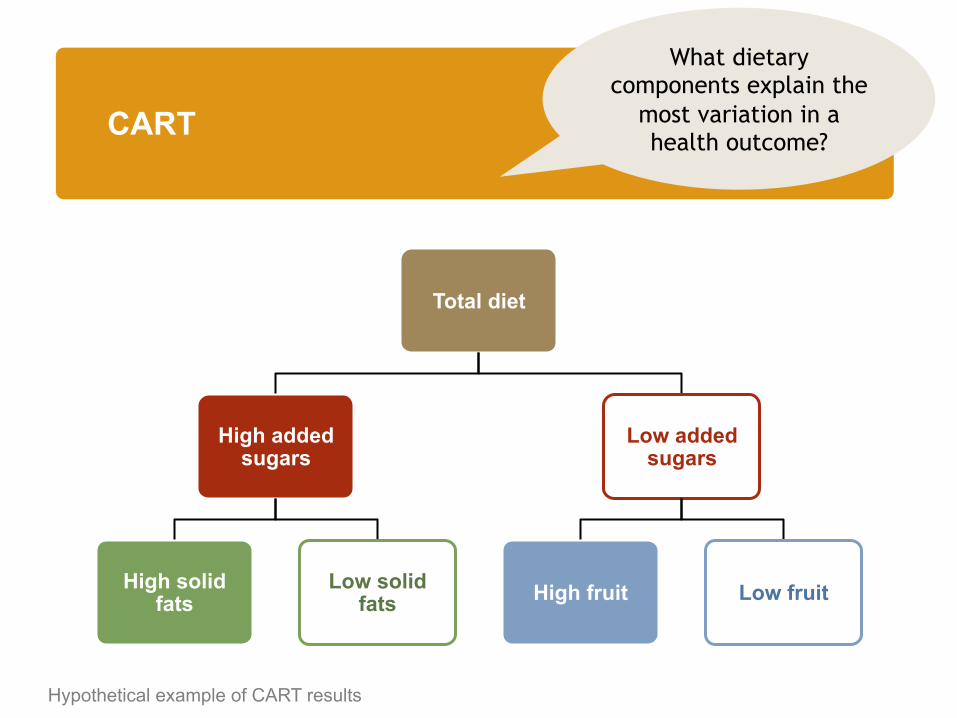
CART
What dietary components explain the
most variation in a health outcome?
Total diet
High added sugars
High solid fats
Low solid fats
Low added sugars
High fruit Low fruit
Hypothetical example of CART results
Dietary Patterns Methods
Investigator-
Defined
Selective Diet
Indexes/ Scores
Data-Driven, Outcome-
Independent
Cluster Analysis
Factor Analysis
Data-Driven, Outcome-Dependent
Reduced Rank Regression
CART
Methodological considerations
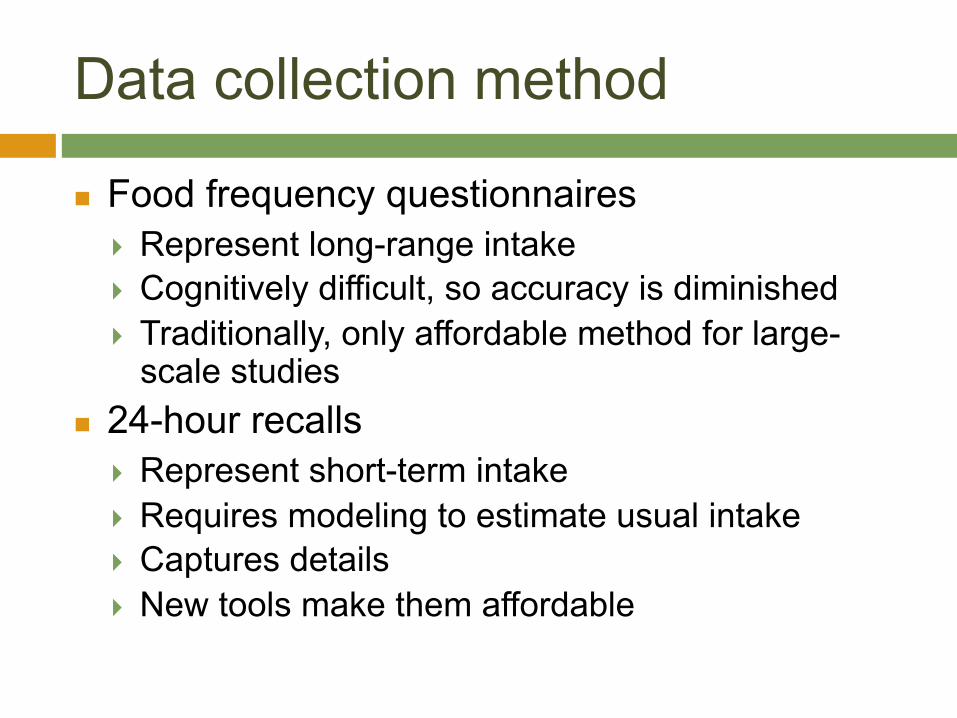
Data collection method
n Food frequency questionnaires } Represent long-range intake } Cognitively difficult, so accuracy is diminished } Traditionally, only affordable method for large-
scale studies n 24-hour recalls
} Represent short-term intake } Requires modeling to estimate usual intake } Captures details } New tools make them affordable
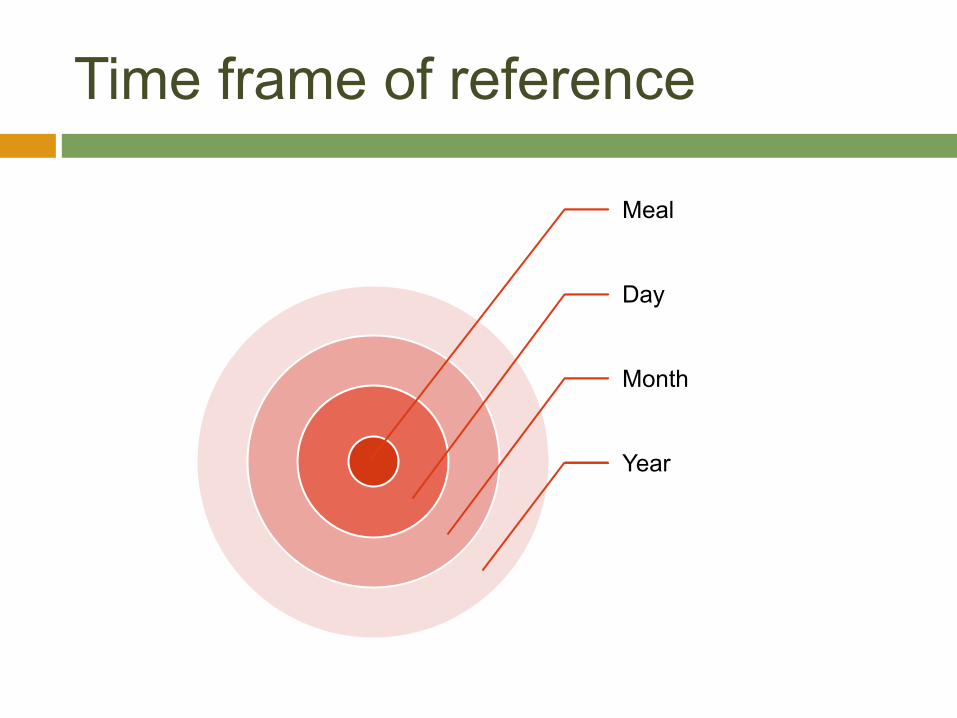
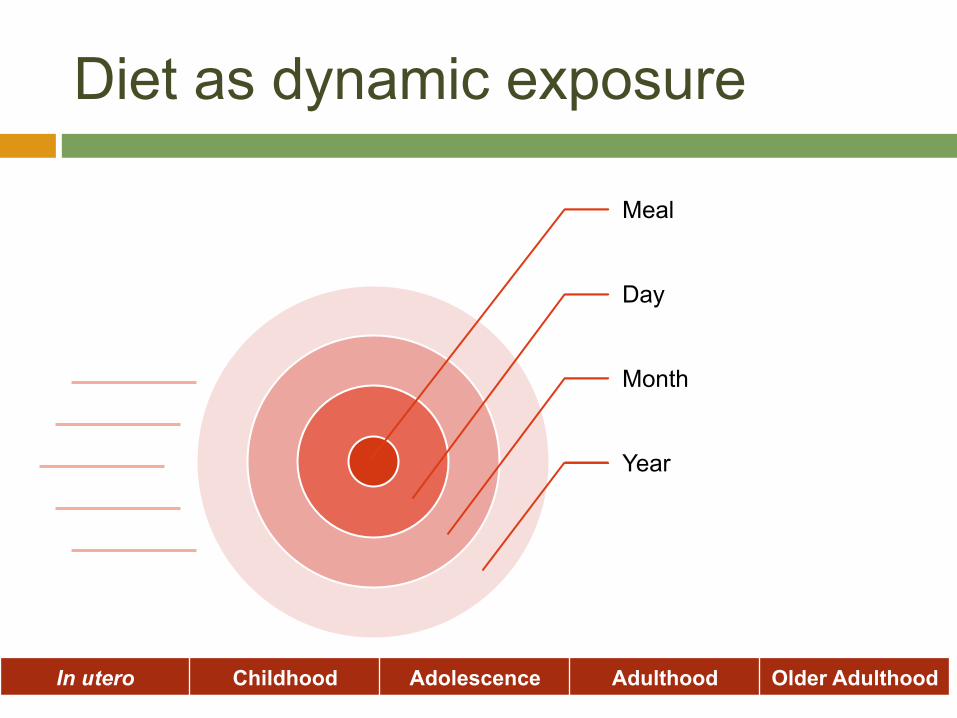
Time frame of reference
Meal
Day
Month
Year
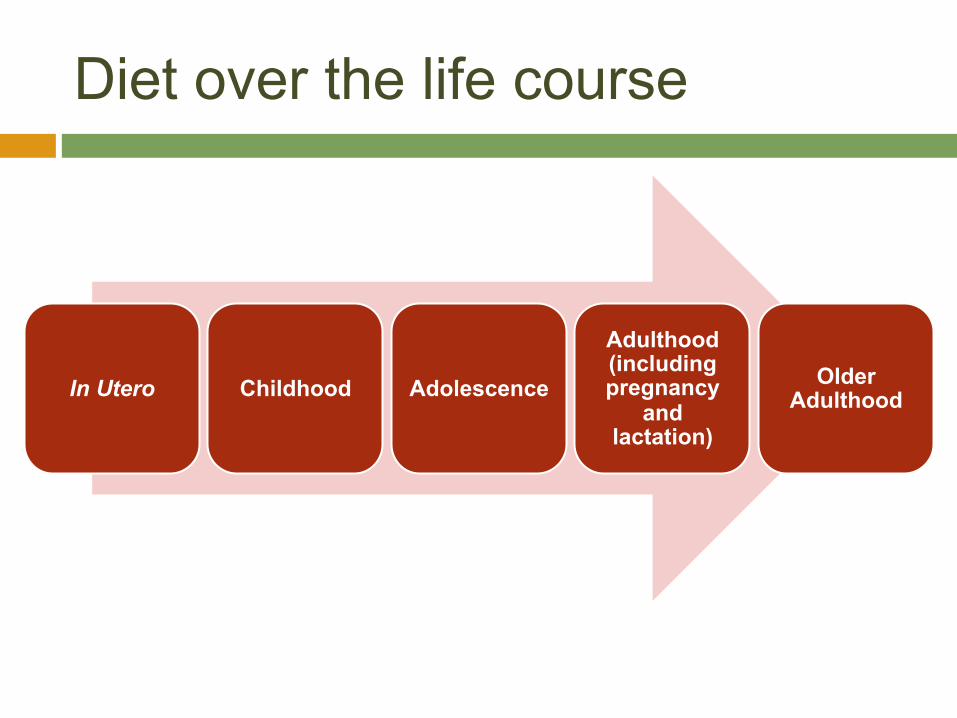
Diet over the life course
In Utero Childhood Adolescence
Adulthood (including pregnancy
and lactation)
Older Adulthood
In utero Childhood Adolescence Adulthood Older Adulthood
Diet as dynamic exposure
Meal
Day
Month
Year

New technologies
Offer capability to capture streams of data
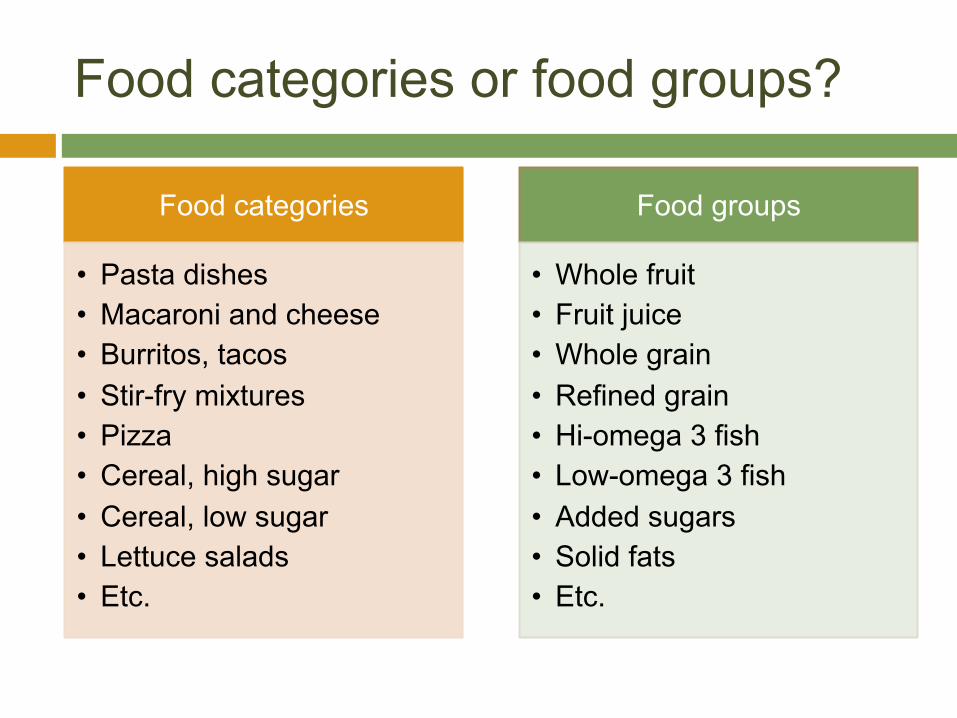
Food categories or food groups?
Food categories
• Pasta dishes • Macaroni and cheese • Burritos, tacos • Stir-fry mixtures • Pizza • Cereal, high sugar • Cereal, low sugar • Lettuce salads • Etc.
Food groups
• Whole fruit • Fruit juice • Whole grain • Refined grain • Hi-omega 3 fish • Low-omega 3 fish • Added sugars • Solid fats • Etc.
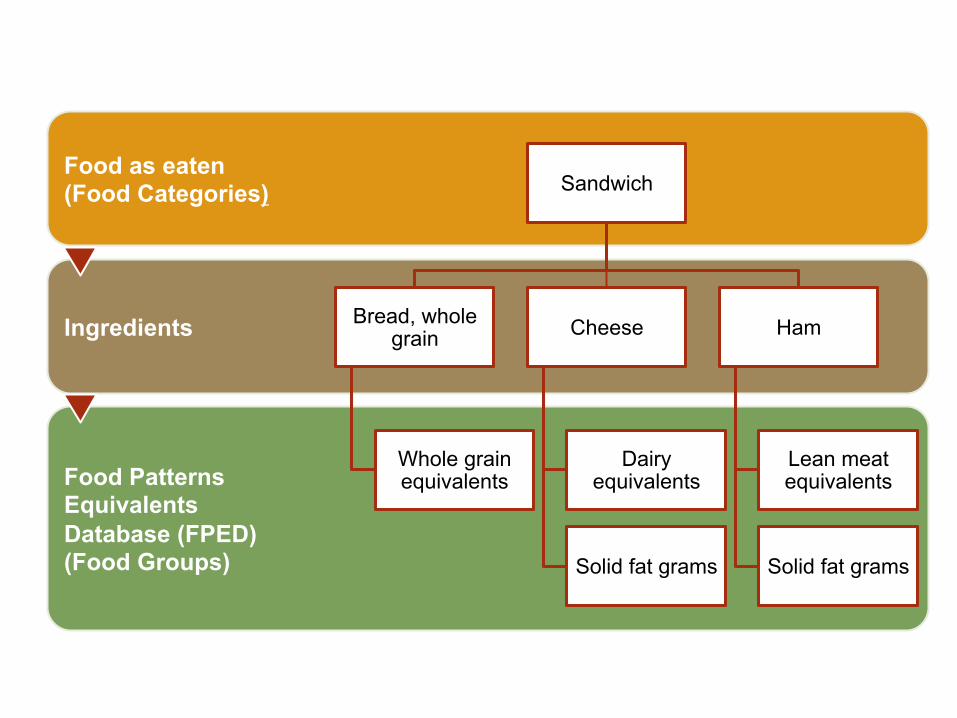
Food as eaten (Food Categories)
Ingredients
Food Patterns Equivalents Database (FPED) (Food Groups)
Sandwich
Bread, whole grain
Whole grain equivalents
Cheese
Dairy equivalents
Solid fat grams
Ham
Lean meat equivalents
Solid fat grams
Subjectivity
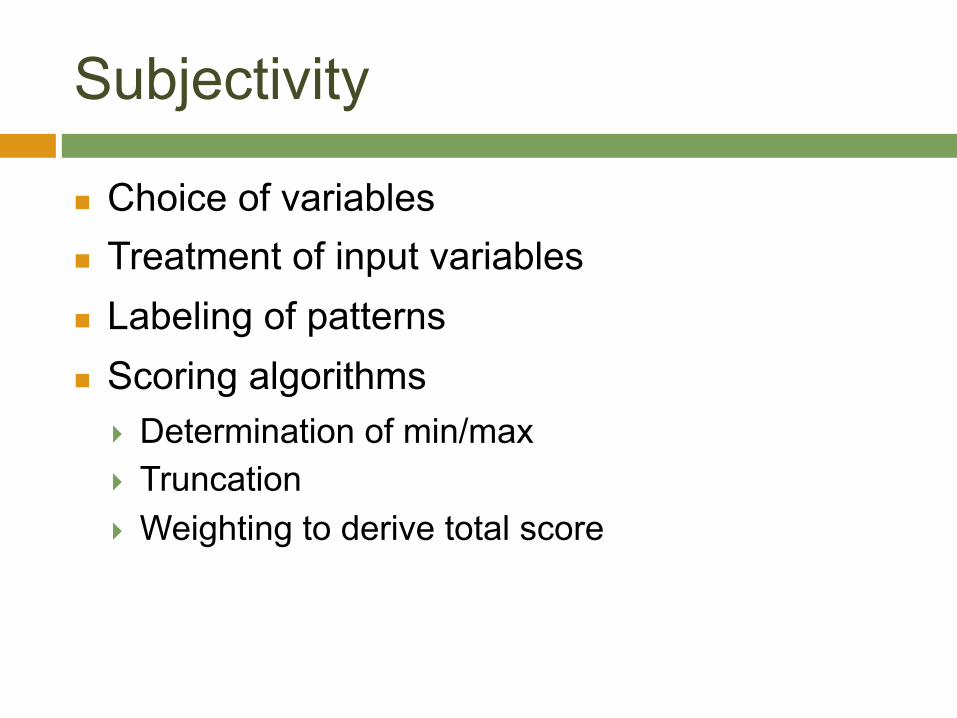
n Choice of variables n Treatment of input variables n Labeling of patterns n Scoring algorithms
} Determination of min/max } Truncation } Weighting to derive total score
Population being examined
n
n
n
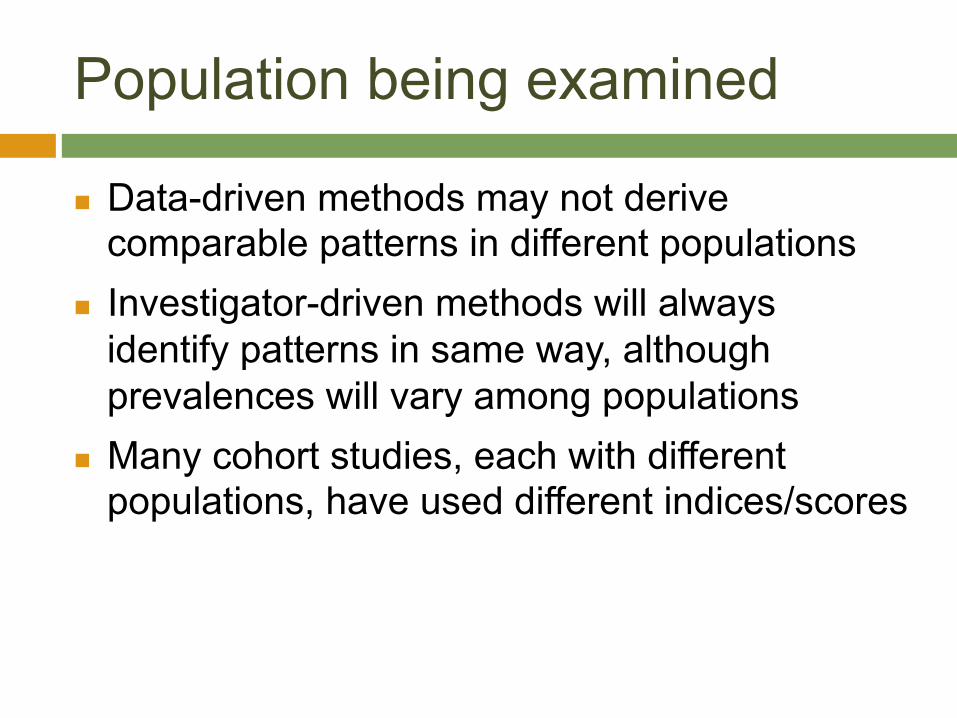
Data-driven methods may not derive comparable patterns in different populations Investigator-driven methods will always identify patterns in same way, although prevalences will vary among populations Many cohort studies, each with different populations, have used different indices/scores
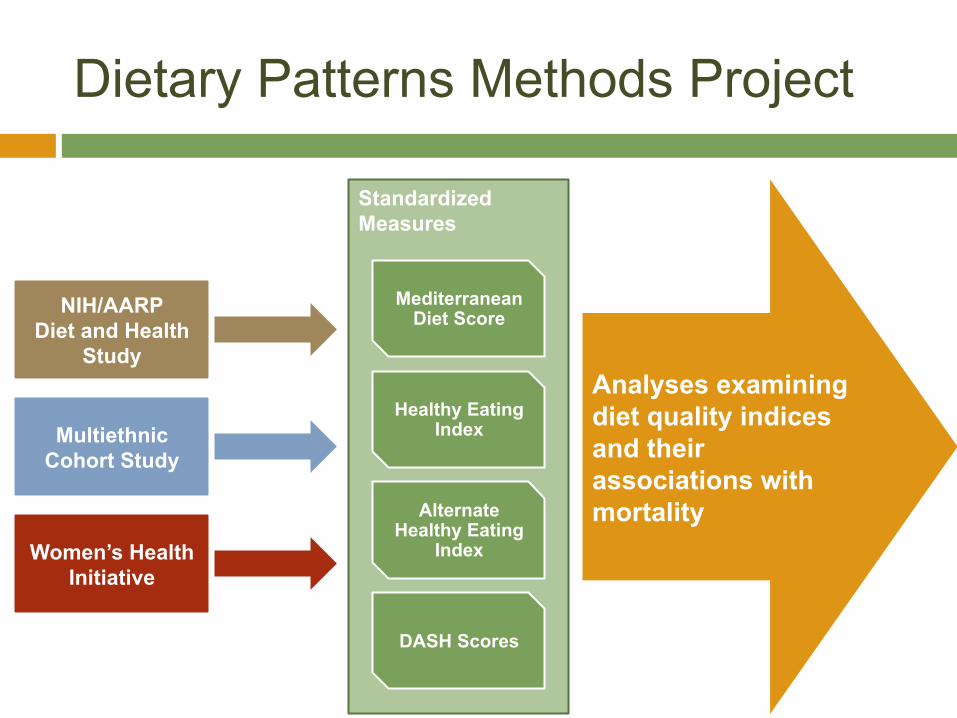
Dietary Patterns Methods Project
Standardized Measures
Mediterranean Diet Score
Healthy Eating Index
Alternate Healthy Eating
Index
DASH Scores
NIH/AARP Diet and Health
Study
Multiethnic Cohort Study
Women’s Health Initiative
Analyses examining diet quality indices and their associations with mortality

Questions to inform guidance
Questions posed by major methods
n
n
n
}
n
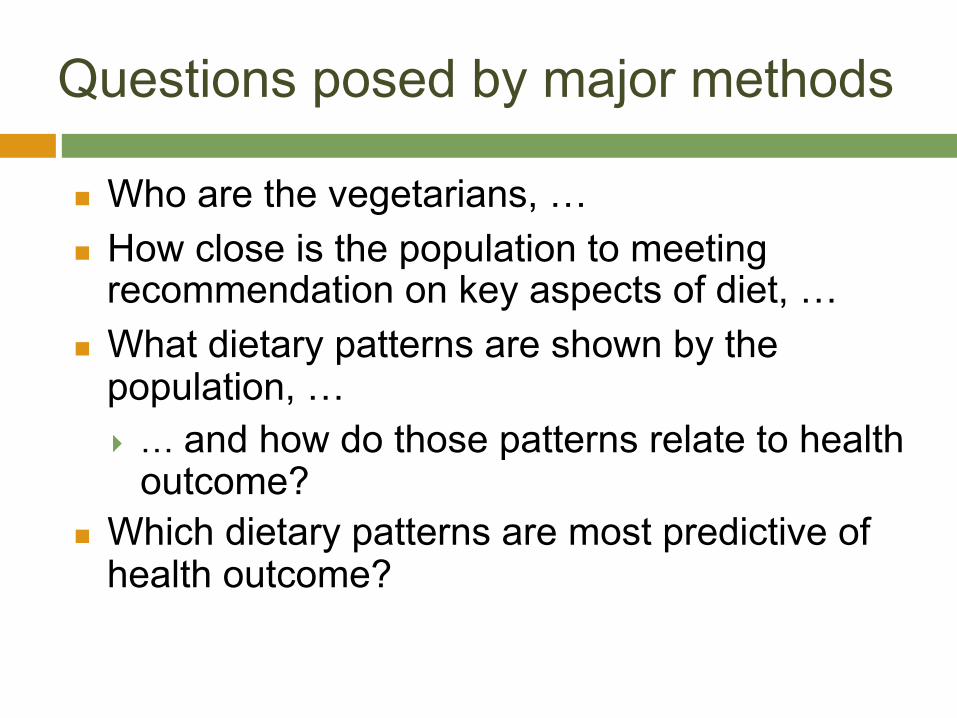
Who are the vegetarians, … How close is the population to meeting recommendation on key aspects of diet, … What dietary patterns are shown by the population, … … and how do those patterns relate to health outcome?
Which dietary patterns are most predictive of health outcome?
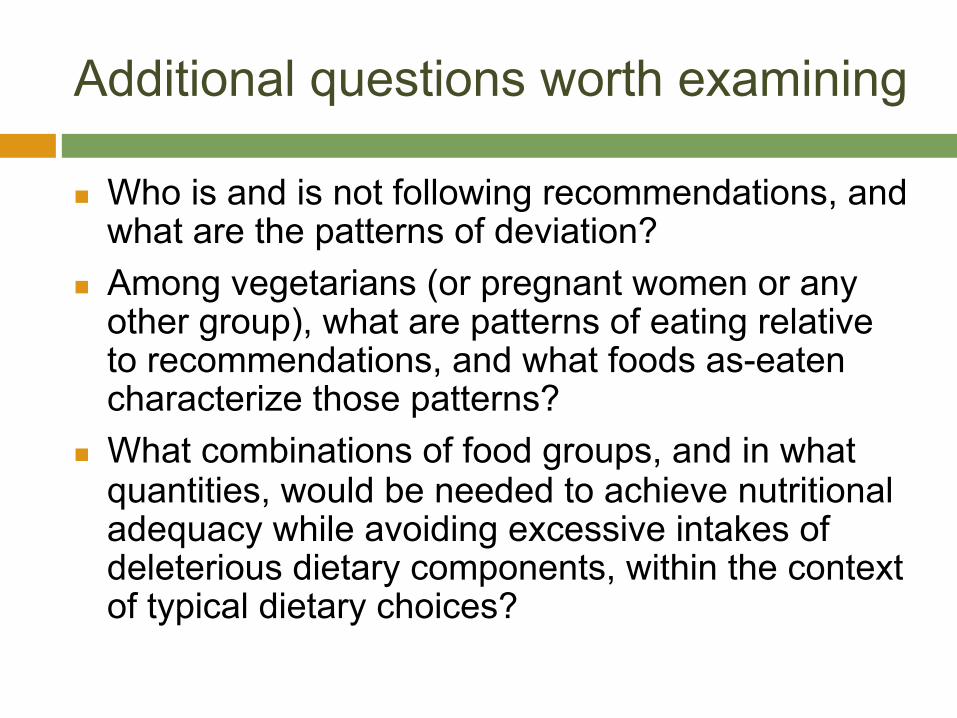
Additional questions worth examining
n
n
n
Who is and is not following recommendations, and what are the patterns of deviation? Among vegetarians (or pregnant women or any other group), what are patterns of eating relative to recommendations, and what foods as-eaten characterize those patterns? What combinations of food groups, and in what quantities, would be needed to achieve nutritional adequacy while avoiding excessive intakes of deleterious dietary components, within the context of typical dietary choices?
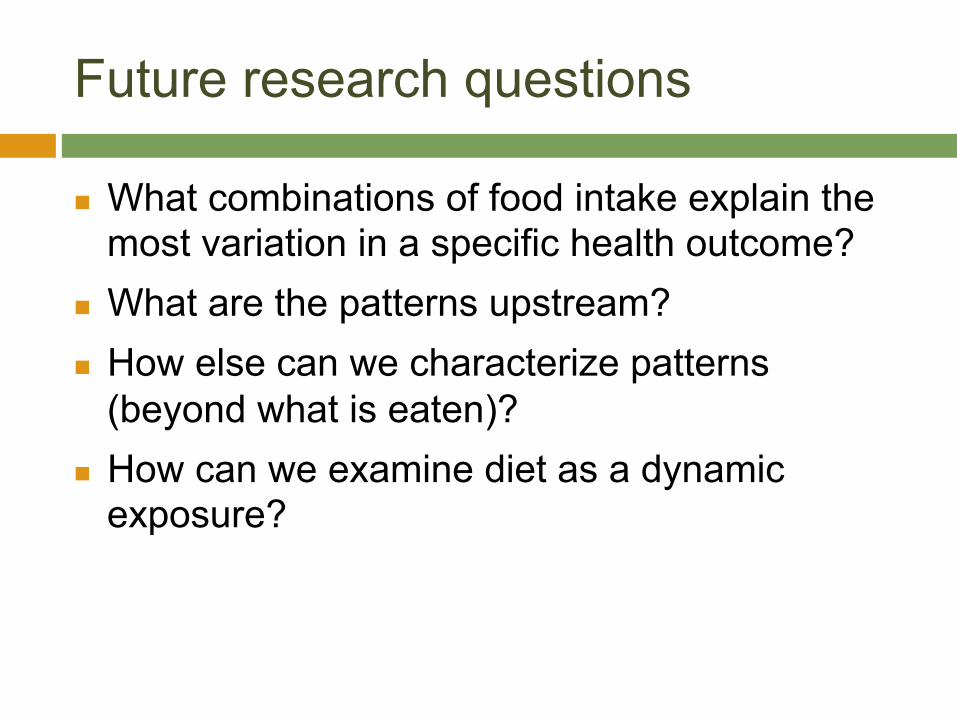
Future research questions
n
n
n
n
What combinations of food intake explain the most variation in a specific health outcome? What are the patterns upstream? How else can we characterize patterns (beyond what is eaten)? How can we examine diet as a dynamic exposure?
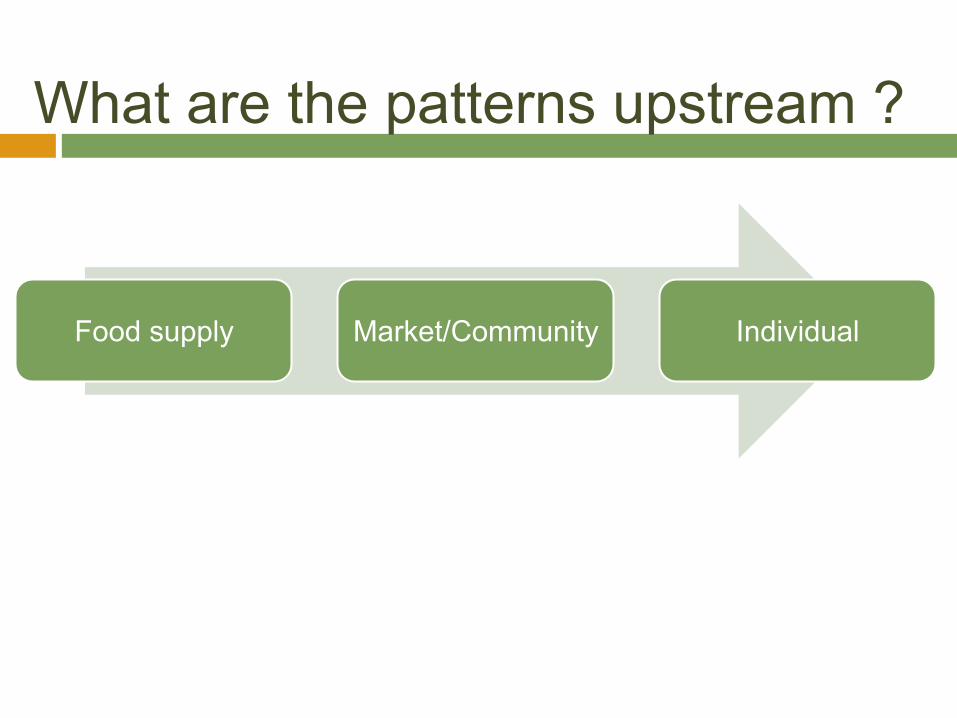
Food supply Market/Community Individual
What are the patterns upstream ?
Market Individual
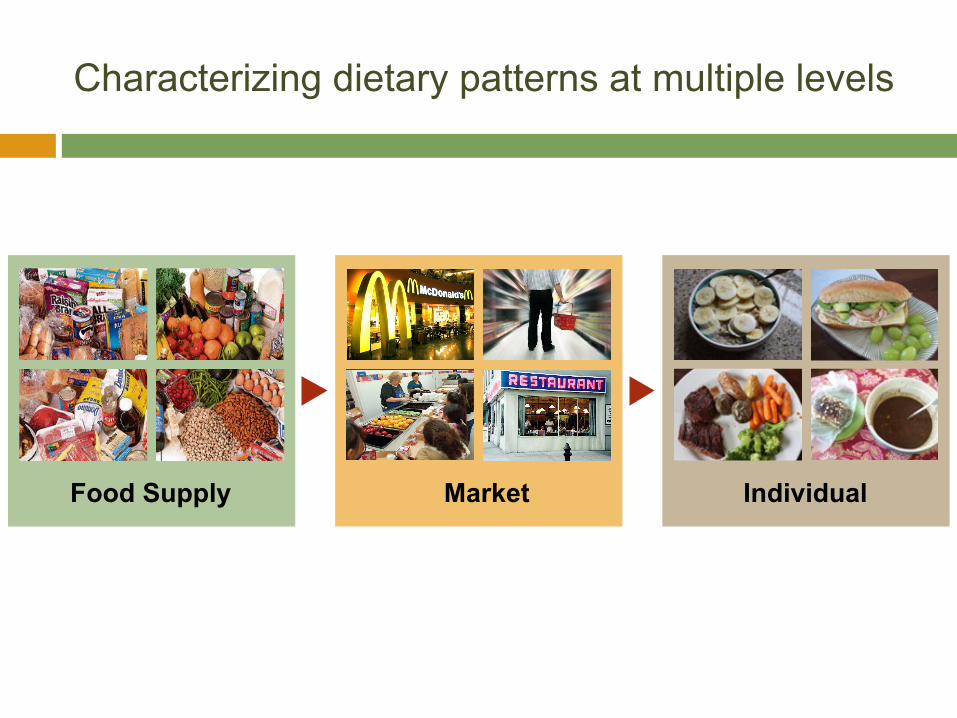
Characterizing dietary patterns at multiple levels
Food Supply
Individual
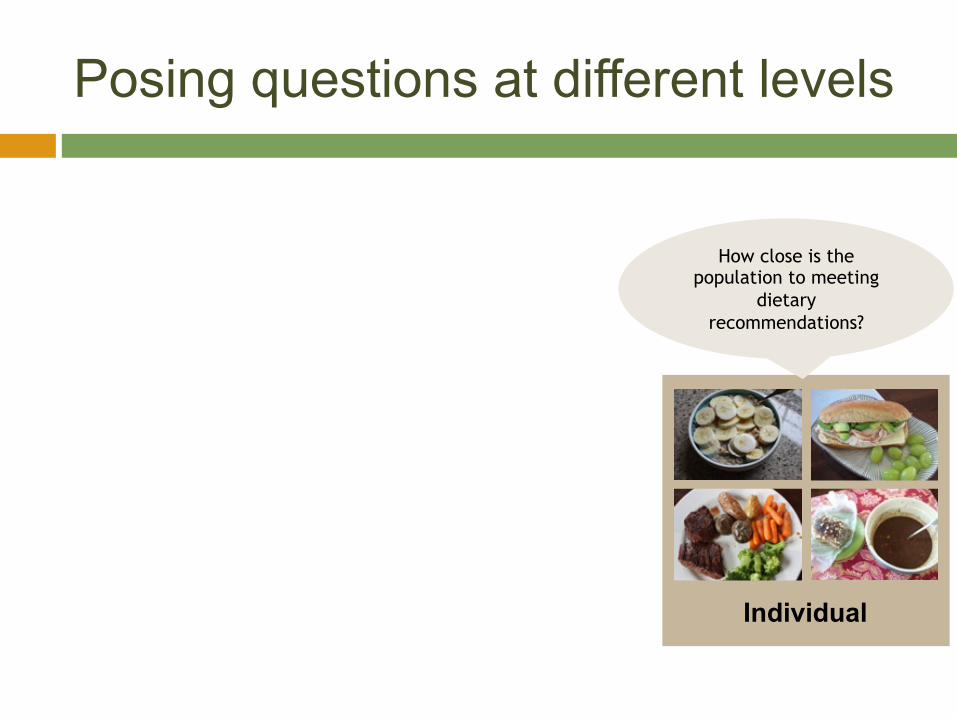
Posing questions at different levels
How close is the population to meeting
dietary recommendations?
Market Individual
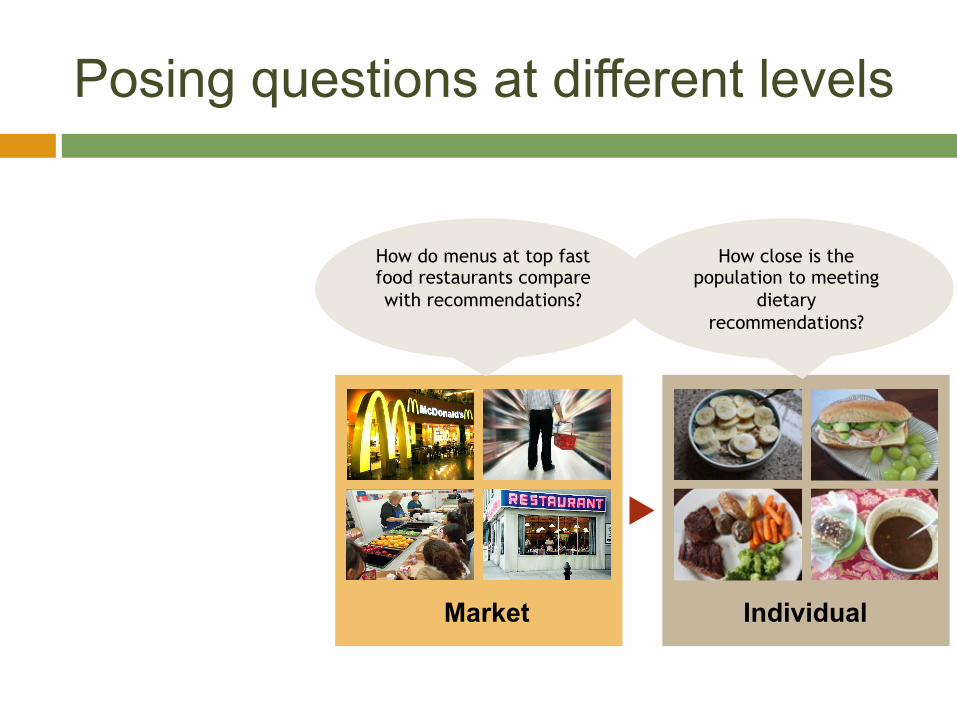
Posing questions at different levels
How close is the population to meeting
dietary recommendations?
How do menus at top fast food restaurants compare with recommendations?
Market Individual Food Supply
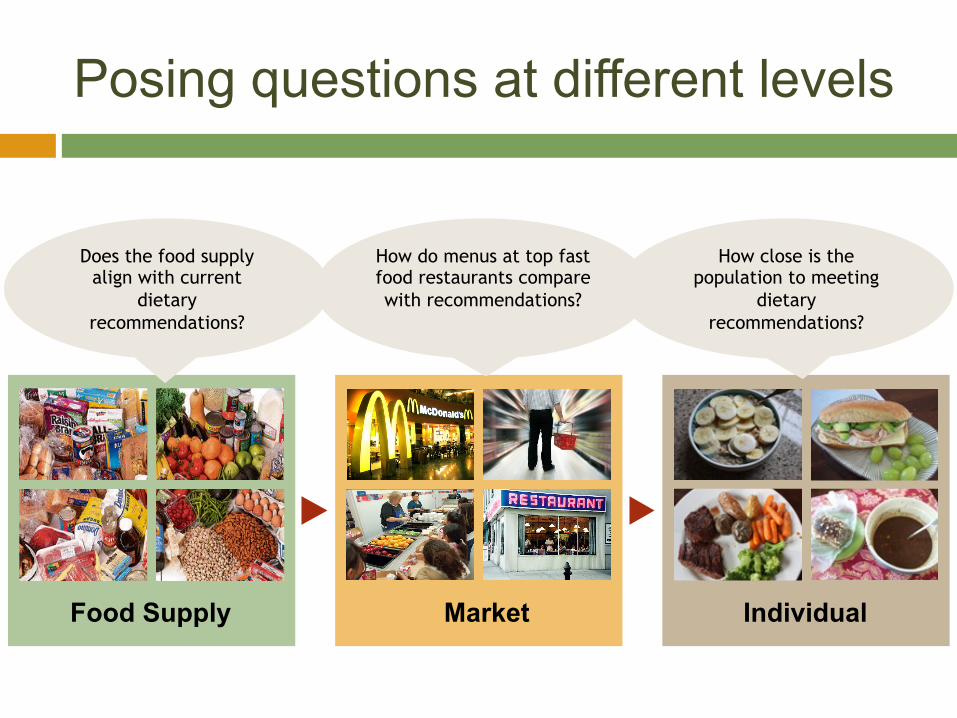
Posing questions at different levels
How close is the population to meeting
dietary recommendations?
Does the food supply align with current
dietary recommendations?
How do menus at top fast food restaurants compare with recommendations?
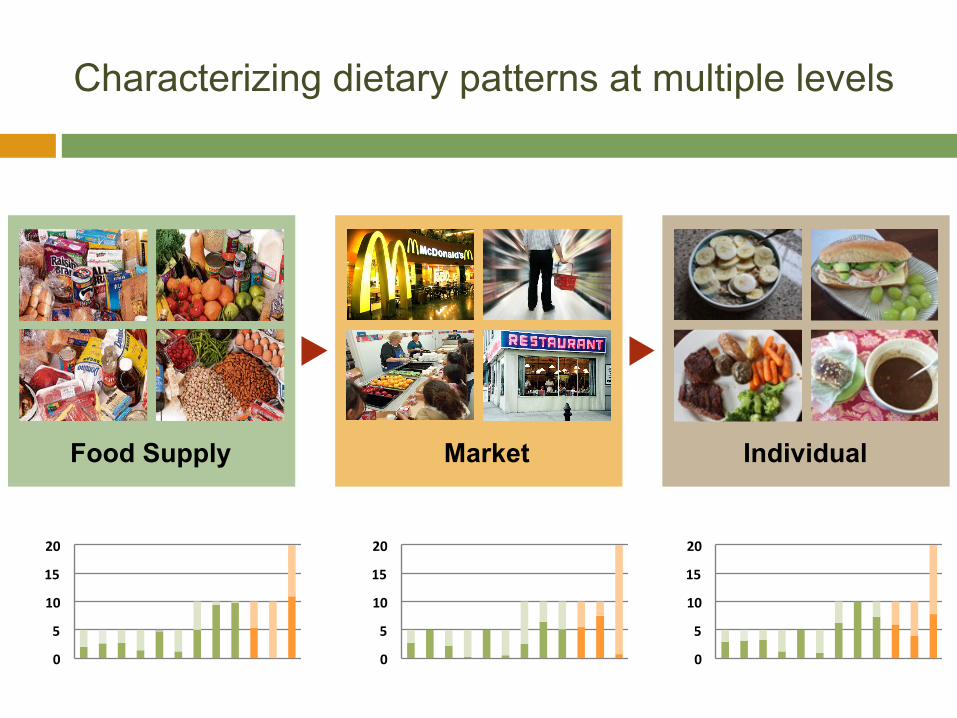
Characterizing dietary patterns at multiple levels
0
5
10
15
20
0
5
10
15
20
0
5
10
15
20
Market Individual Food Supply
Expanding the definition
n The qualities, quantities, proportions, variety or combination of different foods, drinks, and nutrients in diets, and the timing, location and frequency with which they are habitually consumed
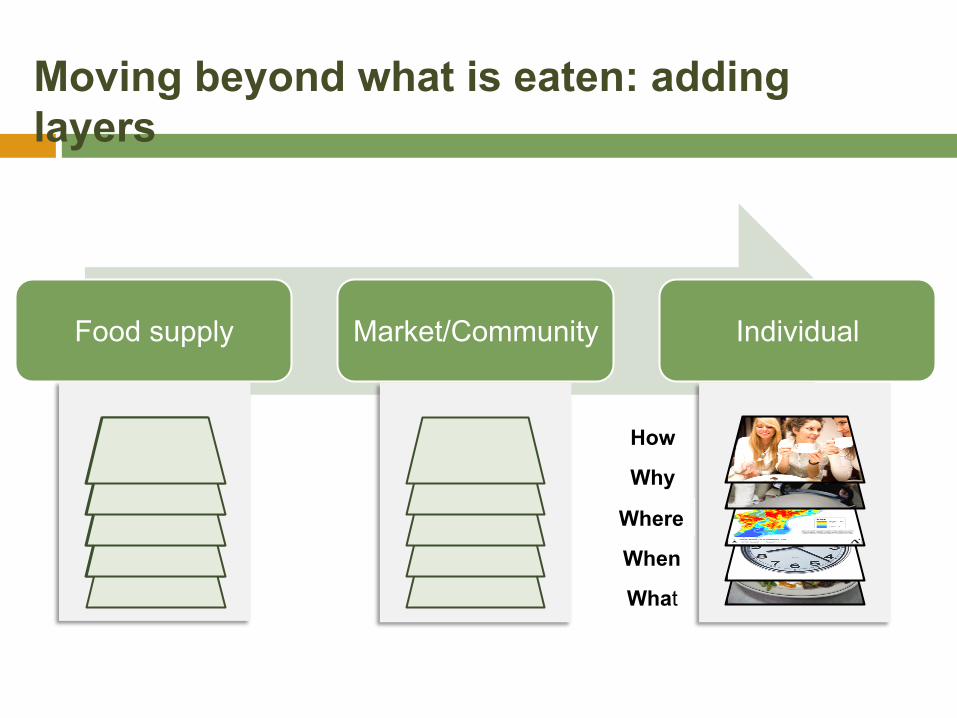
Food supply Market/Community Individual
How
Why
Where
When
What
Moving beyond what is eaten: adding layers
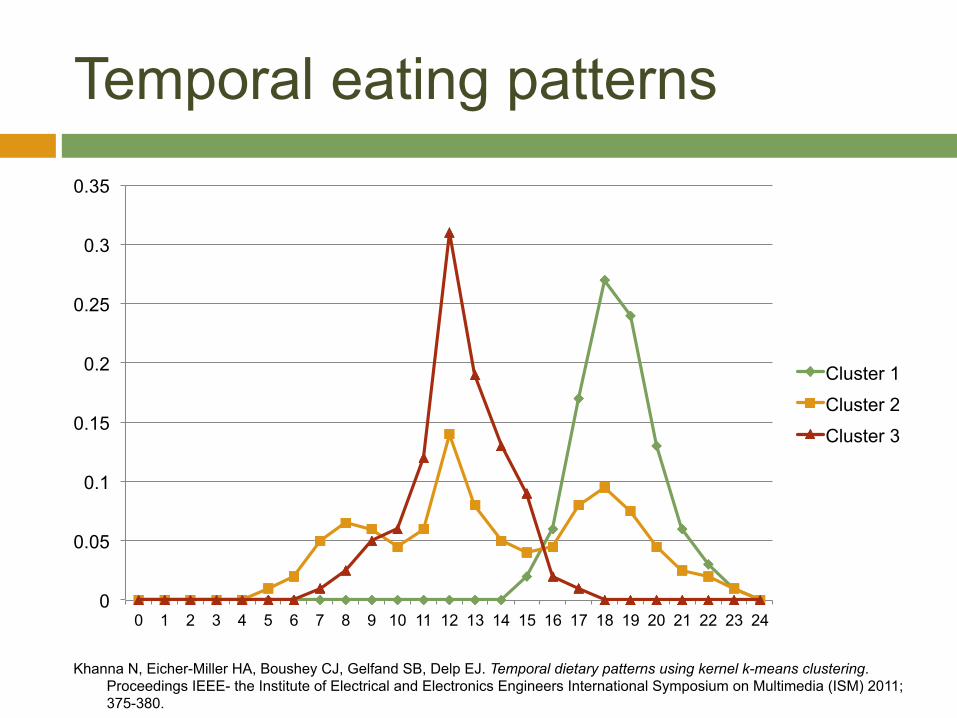
Temporal eating patterns
0
0.05
0.1
0.15
0.2
0.25
0.3
0.35
0 1 2 3 4 5 6 7 8 9 10 11 12 13 14 15 16 17 18 19 20 21 22 23 24
Cluster 1
Cluster 2
Cluster 3
Khanna N, Eicher-Miller HA, Boushey CJ, Gelfand SB, Delp EJ. Temporal dietary patterns using kernel k-means clustering. Proceedings IEEE- the Institute of Electrical and Electronics Engineers International Symposium on Multimedia (ISM) 2011; 375-380.
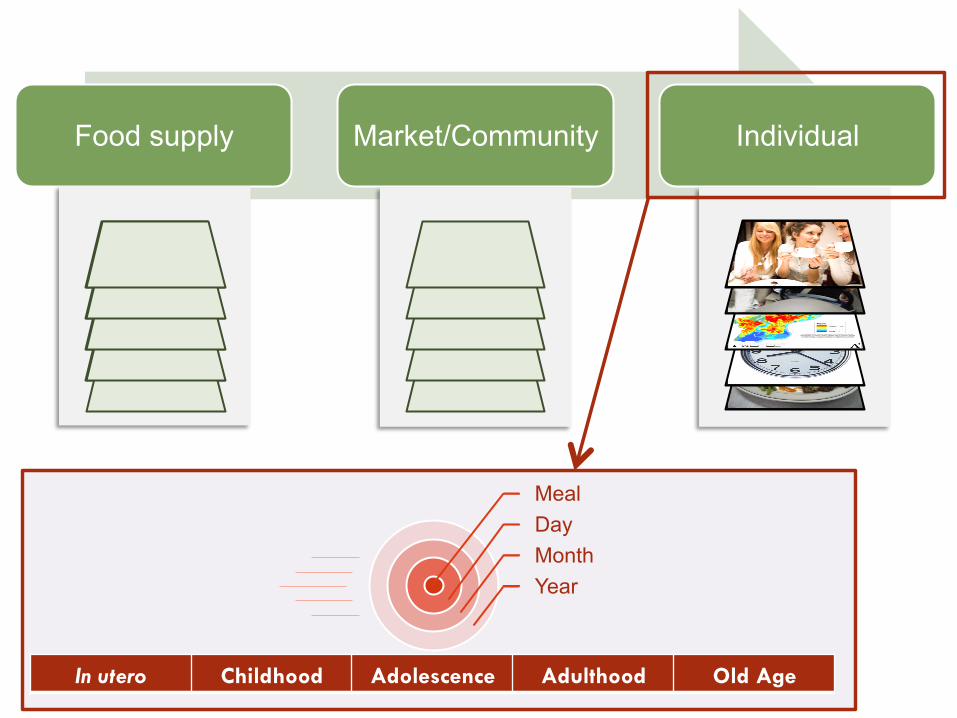
Food supply Market/Community Individual
Meal Day Month Year
In utero Childhood Adolescence Adulthood Old Age

Final thoughts
Future challenges
n Methods of data capture and analysis to handle streams of data
n Continued refinement of indices n Standardization of input variables and
algorithms, harmonization of methods n Learning from other disciplines to address
additional questions
Bottom line
What are your questions?
n Match methods and measures to questions of interest