Embed Size (px)
Citation preview

Appraising the Second Report of the
Ninth Finance Commission:
Some Central Issues
Amaresh Bagchi*
The terms of reference of the Ninth Finance
Commission (NFC) had given rise to controversies never wit
nessed before. The publication of the First Report of the
Commission had also generated considerable heat. The reac
tions to the Second Report - which is the final one - have been, in
contrast, quite muted. Acceptance of its recommendations
without reservation by the Centre even after a change of
Government must have been a pleasant surprise even to the
members of the Commission. What does it signify? Has the
Commission succeeded in meeting its much criticised terms
of reference and making every one better off and none worse
off? Or has it performed a balancing act by applying methods
which are far too technical for anyone not familiar with the
intricacies of the tools of quantitative economics? Or is it
because the affected parties are resigned to acceptance of
the recommendations as a fait accompli? Since the Finance
Commission's awards constitute the bedrock of federal fiscal
relations in India and thereby of the federal polity, it is
necessary that the approach and methodology evolved by the
Ninth Finance Commission are spelled out and their implica
tions analysed in terms which are intelligible to all. This note
seeks to highlight the innovations or departures from the past
made by the Ninth Finance Commission in their approach and
methodology and focus attention on some of the central issues.
* The author zvishis to thank M . G. Rao for helpful discussion and
D. Maityfor statistical assitance.
317

The Backdrop
The main points of departure in the terms of reference
(TOR) of the Ninth Finance Commission from those of the past
Commissions, it may be recalled, were:
enjoining a normative assessment of the receipts
and expenditures on the aggregate revenue ac
count of the States and the Centre (both Plan and
non-Plan, unlike in the past);
explicit attention to the need for providing
adequate incentives for better resource
mobilisation and financing discipline - as well as
closer linking of expenditure and revenue-raising
decisions and for speed and efficiency in the gov
ernment's expenditure programmes;
stipulating the aim of generating surpluses in the
budgets of the Centre and the States for
investment, and not merely balancing the revenue
budget; and
calling upon the Finance Commission (FC) to as
sess the debt position of the States and suggesting
corrective measures and exploring the feasibility of
a new way of providing disaster relief.
Understandably, the emphasis on a normative
approach and fiscal discipline combined with the need for
providing incentives for better resource raising and use
stemmed rrSrtr-the anxiety to correct the imbalances that had
surfaced on the fiscal scene in India in recent years with a
growing deficit on the revenue account of the Centre and also
of the States. The "gap-filling" approach which had dominated
the Finance Commission's perception of their task in the past
had come in for criticism from almost all quarters as it tended
to undermine the incentives for efficient fiscal management.
The awards of the past FCs had also been criticised for their
failure to correct the vertical and horizontal fiscal imbalances in
the economy and thereby to arrest the aggravation of disparities
318

in the levels of income among the States, in other words, for
failing to allocate revenues between the Centre and the States
adequately on the onehand, and ensure their equitable distribu
tion among the States on the other. Taking due note of their
TOR, the Ninth Finance Commission stipulated the following
objectives as basic to their approach:
"(a) phasing out the revenue deficit of the Centre and
the States in such a manner that the deficit is
reduced to zero or a relatively small figure by
March 31,1995;
(b) equity in the distribution of fiscal resources both
vertically and horizontally; and
(c) promotion of fiscal discipline and efficiency in the
utilisation of resources."
Implementation of these principles called for a norma
tive assessment of the fiscal needs and capacities of the respec
tive governments. This in many ways constitutes the keystone
of the Ninth Finance Commission's Second Report. Indeed,
adoption of the normative approach, it is stated by the
Commission itself, constitutes "the first basic departure this
Commission made from the practice of the previous
Commissions". The second basic departure has been the
inclusion of the Plan component in its consideration of the
revenue budget. This was in keeping with the intention of the
TOR and felt necessary for moving towards restoration of
balance in the revenue budgets of the Centre and the States.
The Commission has relied upon econometric
techniques as also its own judgement in evolving a normative
basis for assessing the revenue needs and capacity of the
government at the Centre and the States. Unquestionably,
these mark a major advance towards application of scientific
techniques in policy making in the country in a very sensitive
area. The important question is, do the recommendations
flowing from these approaches and principles help achieve the
objectives in view? The question can be dealt with in three parts,
319

VIZ.,
(a) Do the recommendations take care of the vertical
imbalances adequately?
(b) Will theyalsohelptophaseouttherevenuedeficits
in reality?, and
(c) Do they help to reduce the horizontal imbalances
and redress the regional disparities?
There are several other issues arising from the Commis
sion's Report (such as assessment of the debt position and
formulating a disaster relief scheme). However, the central
issues are the manner in which the Ninth Finance Commission
has addressed the task of redressing the vertical and horizontal
imbalances and restoring the fiscal health of the economy. This
note focusses mainly on the three questions posed above.
Central Issues
Correction of Vertical Imbalance
A persistent criticism of the federal fiscal system in
India has been that the unitary elements which are already
embedded in the Indian Constitution have gained further
strength over the years with concentration of fiscal powers
in the Centre and growing dependenceofthe States on transfers
from the Centre. The institutions contemplated in the
Constitution to safeguard the fiscal autonomy of the States, it
is widely felt, have not helped to correct this imbalance.
Acknowledgedly, in the distribution of
responsibilities and powers delineated in the Indian Constitution,
there is a chronic imbalance with concentration of fiscal powers
in the Centre. This is not uncommon in federal constitutions.
It was precisely in recognition of this imbalance that the
Constitution makers provided for the setting up of a Finance
Commission periodically to oversee the transfer of federal funds
320

to the States in a manner which will find acceptance by allconcerned. It is generally recognised that the institution in theshape of FCs has provided a mechanism for transfer ofresourcesfrom the Centre to redress the vertical imbalance inherent in the
Constitution. Despite limitations, the mechanism has been agreat help in preserving the federal structure by ensuring the
flow of funds required by the States to meet their fiscal gaps.
However, with the emergence of the Planning Commission andthe practice on the part of the Centre of making discretionary
transfers, a large part of the federal transfers started flowing
under the umbrella of the Plans or at the Centre's behest.Although application of the Gadgil formula brought in a
measure of objectivity in the Plan transfers, the fact that thePlanning Commission was a creature of the Centre and nota statutory body continued to be a point of discord. Besides,about one-fifth of the total transfers takes place at the discretion
of the Centre. Questions were also raised about the legalpropriety of allowing sizeable amounts to be transferred by theCentre under Article 282 of the Constitution which alone
provided for such a channel since that Article, it wascontended, permitted only transfers under exceptional circum
stances for a public purpose, being put under a headingdescribed as "Miscellaneous Financial Provisions".
Whether the practice of channelling large amounts offederal funds to the States under the cover of Article 282 has
been legitimate under the Constitutional provisions andtherefore whether all federal transfers should have been brought
under the purview of the Finance Commission are questions
on which opinions sharply differ. One view, stronglyespoused by a member of the Ninth Finance Commission has
been that under the Constitution the Finance Commission hadthe jurisdiction to examine the entire gamut of federal transfers
and not merely the revenue gaps.
Questions of constitutionality apart, such a task, many
would agree, would obviously require creating an institution ofthe dimension of the Planning Commission which is alreadythere. With the NDC to endorse the basic approaches of the
321

Planning Commission, it is generally felt that the FinanceCommission's task is better focussed on consideration of therevenue side of the budgets. In any case, the inclusion of
revenue component of the Plan in the Ninth Finance Commis
sion's TOR removes a lacuna which had restricted the scope ofFinance Commission's assessment since the Fourth Commission. With Plan revenue expenditure coming under the consideration of the Ninth Finance Commission, it may be expectedthat the proportion of transfers ordained by the FinanceCommission - called "statutory transfers" - would have goneup. To that extent the Ninth Finance Commission's award
would help to correct an anomaly that had crept into the systembecause of a dichotomy in the revenue budget between the Planand non-Plan components. The more substantive questionpertaining to correction of vertical imbalance is, will the recommendations of the Ninth Finance Commission lead to a fair
distribution of the aggregate government revenue between theCentre and the States, keeping in view their respectiveresponsibilities and functions under the Constitution? Andwill their dispensation reduce the dependence of the States onthe Centre? None of these questions admits of astraightforward answer and will no doubt engage the attentionof scholars of federal finance in India. A few observationshowever might be in order.
On the face of it, the Ninth Finance Commission'srecommendations do not seem to disturb the existing positionsignificantly in as much as the proportion of aggregatetransfers to the States envisaged by them in the total revenue
receipts of the Centre remain virtually the same (22.74 per centas against 22.65 per cent in 1985-90). However, in judging the
vertical equity ofdevolution decided bya Finance Commission,one may also like to look at the respective shares of the Centreand the States in the aggregate revenue and expenditures of thegovernment (Centre and States taken together) and see whetherthey match.
Figures of aggregate revenue receipts of the Centre andthe States, the States' own source revenue and the revenue
322

accrual to the States (after devolution) since the mid-70s are
given in Table 1 along with computations for 1990-5 based
on the Ninth Finance Commission's estimates and recommen
dations. It will be seen that while the States' own sources
contribute roughly one-third (33 to 35 per cent) of the total
government revenues, with the devolution of funds from the
Centre the revenue accruing to the States goes up to 55 to 60 per
cent of the total. As against this, around 55 per cent of the totalrevenue expenditure of the government takes place under the
aegis of the States and Union Territories (Table 2). Thus the
federal transfers can be said to be more than adequate to meet
the revenue gaps of the States. Whether and, if so, to what
extent this trend is likely to be maintained or undergo a change
is difficult to figure out in the absence of estimates of the
transfers which are going to be made finally by the Centre
through all the available channels. On the expenditure side, data
for 1990-5 which would be comparable with those of earlier
years are not available. However, rough calculations indicate
that the revenue accrual to the States under the Ninth Finance
Commission's dispensation is likely to decline significantly
(from around 60-62 per cent of the total in the preceding ten
years) to about 55 per cent. There would in all probability be
a decline in the States' share of the total revenue expenditure
also, leaving an overall surplus with the States (though the
exact proportions are difficult to specify in the absence of
comprehensive estimates of revenue and expenditures). In a
way the Ninth Finance Commission's award thus seems to
restore the respective shares of the Centre and the States in the
overall revenue and expenditure of the Government (after
devolution) to the position obtaining before the sharp rise that
took place in the States' share in the wake of the Seventh
Finance Commission's award and seeks to correct the imbal
ance which resulted in large revenue deficits at the Centre. If,
however, as anticipated by the Ninth Finance Commission,
the States are to have an overall revenue surplus, their share
in the aggregate revenue expenditure also has to decline. This
is probably going to happen. (These observations should be
taken as tentative as the Ninth Finance Commission has not
given any estimate of the likely share of the States in the
323

aggregate revenues and revenue expenditure at any one place
and it is difficult to say for certain how the picture will look aftertaking all the relevant figures into account.)
This does not imply any reduction in the share of the
States in the Centre's (gross) revenues which, as noted earlier,
remains at about 23 per cent. Nor does it necessarily imply a
discriminatory ceiling on the States' expenditure growth. The
main factor which seems to contract the States' share in the
overall revenue is that the Ninth Finance Commission has
assumed a lower revenue growth for the States than that for the
Centre. For tax revenue of the States, the Ninth Finance
Commission has assumed a growth of 11.5 per cent per annumwhile for the Centre a growth of 12.8 per cent has been
assumed. Non-tax revenue of the Centre is also assumed to
grow at a higher rate. Non-Plan revenue expenditures of the
Centre are also assumed to grow at a rate of 9.75 per cent whilethat of the States seems to be assumed at a little over 8 per cent.
This by itself does not warrant any conclusion that the
Ninth Finance Commission's dispensation has been tilted towardsthe Centre rather than to the States. For apparently, the
estimates ofthe revenue needs of both the Centre and the Stateshave been arrived at on a "normative basis", keeping in viewtheir Constitutional responsibilities and revenue raisingcapacities. If the dispensation is to be faulted, one has to
question the norms. Appraisal of the methodology used in
deriving the norms is beyond the scope of this paper but a fewpoints are noted here.
Briefly, in the case ofthe States in essence the normshavebeen derived on the basis of averages. For taxrevenue thenormis "what a particular State would be able to raise by way of tax
revenue, had it exploited its tax bases to an average extent".
For non-tax revenue the actuals have been used for certain items
(fees and user charges) while for some (dividends and interestto be received) normative rates of return have been used. Simi
larly, for a good part of non-Plan revenue expenditures, the
average behaviour has been taken as the norm and the attempt
324

has been to estimate expenditure needs to arrive at justifiablecosts of providing an average standard of service (in the caseof general services) or the existing level of services (in the caseof social and economic services). Allowance has been made forcost disability factors.
For the Centre, the Ninth Finance Commission's
approach has been to assess what the Centre can be expected
to raise by way of revenue, given the levels of taxation, etc.,
while expenditures have been projected on the budgetestimates for 1989-90, but going mainly by the actuals and
assuminga higher growth rate of revenue and lower growth ofrevenue expenditure than projected by the Ministry of Finance.
In moderating the growth rate of the Centre's revenue expenditure and assuming a higher growth of revenue than theprojections of the Finance Ministry, the Ninth Finance Commis
sion apparently had in mind the need to phase out the revenuedeficits.
If the Ninth Finance Commission's projections of theCentre's revenue and expenditures materialise and the growthrate ofGDP and prices (11 per cent per annum) do not exceed the
underlying assumption, the transfers of the Central revenues
ordained by the Ninth Finance Commission may not perhapsbe regarded as unfair. Objections can be raised on grounds ofaccentuating the trend towards centralisation. But this proba
bly is what would be consistent with the aim of graduallyeliminating the deficits.
Vertical equity of the Ninth Finance Commission's
transfers would obviously depend crucially on whether the
fiscal scenario unfolds in the manner envisaged by the Commis
sion. Indeed if the Ninth Finance Commission's projectionsmaterialise, the Centre's revenue deficit for the entire period1990-5 should not exceed Rs 30,600 crore or so and the overall
deficit should not go beyond Rs 11,000 crore. While questions
may be raised about the vertical equity of the recommendationsin which the Centre is permitted to finance a part of its revenueexpenditure with borrowing (only in the case of a few States
325

is such a privilege allowed), on the whole, it may be argued, thisis the best that could be done if the revenue deficits are to be
phased out. But what are the chances that the outcome will
be as envisaged by the Ninth Finance Commission?
Deficit Phasing Out
The fact that in the very first year (1990-1), the Centre's
budget is showing a much larger revenue deficit than was
assumed by the Ninth Finance Commission casts doubt about
the realism ofthe Ninth Finance Commission's projections and
assumptions. Vertical equity however carefully respected by
a Finance Commission is thrown overboard if the Centre can
expand its resource base (whether for capital or revenue
expenditure) by borrowing unless a compensating or commen
surate increase is also provided for in the transfers to the States.
For all the improvements and sophistication in the methodol
ogy, the devolution scheme in the Ninth Finance
Commission's recommendations does not take account of the
dynamic context in which the Centre continues with large
deficits, most of which represent borrowings from Reserve
Bank resulting in pressure on prices and disarray in the
budgets of both the States and the Centre. Despite the
moderation made by the Ninth Finance Commission in its
projections it is unlikely that the deficit/surplus levels of the
Centre or the States will follow the envisaged pattern. In the case
of the States one may overlook what a State does in reality.
After all, the Ninth Finance Commission has laid down certain
norms, it is for the States to accept or reject them - only those
who do better will be rewarded in that their surpluses will be
at their disposal while those who fail to come up to the norm
will suffer. But if the Centre does not go by the norms, the entire
scenario changes.
Given the compulsions of the Centre, it is difficult to
see how the Finance Commission (or for that matter any
authority other than the Parliament) can bind the Centre to a
given revenue deficit. Whether there should be any such
binding rate on the Centre is another matter. So long as the
326

Centre has access to such borrowing what does one make of
tqUitl °f !he FCS' aWards? Similar1^ ^estionsranw a tqUitl °f !he FCS aWards? Similar1^ ^estionscan be (and have been) asked about the relevance ofthe FinanceCommission's exercises unless sharing of the aggregate budgetary (and some would say, non-budgetary) resources of thepublic sector is considered in their totality.
This is not to belittle the value ofthe exercises doneby thepast Finance Commissions or the most recent. They do servea very useful purpose in providing a basis for the allocationof government revenue in a fair and efficient manner. Nevertheless, it is necessary to draw attention to the limitations of theFinance Commissions' awards in ensuring vertical equityansingfromthestaticassumptionswhichaffectonly the States'share and do not provide for alternative scenarios. Obviouslysome more thinking is needed to take account of contingenciesinstead of leaving it entirely to the Centre to decide how muchor the aggregate resources of the government to commandaway with the States left to face the consequences.
Horizontal Equity
Results achieved by the Ninth Finance Commission'sformulae for distribution of the transfers of the Centre's revenueamong the States are unquestionably of great significanceDespite limitations especially of data, the methodology usedfor assessing the revenue and expenditure of the States seemsto provide a way ofbringing about a more equitable allocationof the devolution than in the past. This is evidenced by the factthat the differencesinthepercapitanon-Planrevenuesurplusesofthe non-special category States are much less sharp underthe Ninth Finance Commission's dispensations than in thepast The maximum surplus accruing to a State after thetransfers works out to about 11 times of the minimum goingto any State. Under the Eighth Commission's award theproportion was 31, while under those of the Seventh and the
Sixth the proportions were 18 and 69 respectively (vide Table3).
327

That the allocation of the transfers among the States has
been more equitable than that under the Eighth Commission's
awards can be seen also by comparing the dispersion of the
per capita devolution of taxes and grants. Figures of per capita
share of taxes and grants and the total devolution from the
Fifth Finance Commission onward are given in Table 4. Theaverages, standard deviation and coefficient of variation of the
per capita transfers are also given in the table. It will be seen that
as compared with the Eighth Commission's award, the coeffi
cient ofvariation (CV) of per capita transfers (tax devolution and
grants taken together) is higher under the Ninth Finance
Commission's recommendations (0.25 as against 0.20). The CV
would probably have gone up further had the Plan grants not
been subjected to the limits set by the Ninth Finance Commis
sion. It is worth noting that the CV in the tax devolution is lower
in the Ninth Finance Commission's recommendations than
under that of the Eighth Finance Commission. Even so the
CV of the aggregate devolution is larger mainly because of the
favourable assessment of the fiscal needs of poorer States and
high weightage for grants in the devolution.
Given that the CV in the per capita SDP of the States is
about 0.30, one would expect that an equitable system of
transfers would have at least a similar dispersion along with
a significant negative correlation with per capita SDP. A major
deficiency in the statutory transfers in the past was that their
distribution among the States has not been as equitable as would
seem to be necessary to redress the disparities in their
development for which per capita SDP is perhaps the best single
index. While the grants-in-aid have been more dispersed, the
devolution of tax revenues is not marked by a matching spread.
Since in the past the proportion of tax devolution in the total
transfers has been much higher than that of grants, the overall
impact of the statutory transfers has been less equilibrating
than was needed to compensate for the disparities in
development.
Surprisingly, under the Ninth Finance Commission's
award, theCV of the grants component turns out to be smaller
328

than that under the Eighth Commission's formulae although the
CV in the total transfers, that is taking devolution of both taxes
and grants-in-aid together, is appreciably higher. This may be
partly because of the increase in the CV of tax transfers and a
decline in the share of the tax devolution component in the
total devolution (vide Table 5) and also because of the
introduction of a"deficit" criterion in the formula for allocation
of Union excise duties. One possible reason for the relatively
low CV of the Ninth Finance Commission's grants could be that
this component of the statutory transfers now includes grants
for the revenue part of the Plan too and the Plan revenue grants
by the Ninth Finance Commission have been bound by upper
and lower limits. The fact that the per capita non-Plan revenue
surplus is eleven times higher for one State than for another
even with all the innovations brought in by the Ninth Finance
Commission is to be regretted since it is this surplus that
provides the base on which the development plans of the States
are built. However, it must be acknowledged that it is a vast
improvement from the disparities marking these surpluses in
the past. The Ninth Finance Commission has obviously made
a valiant effort in breaking away from the past to achieve
greater horizontal equity but a lot more remains to be done.
Treatment of special category States also has been ad hoc and
needs to be brought on rational lines.
Concluding Comments
In sum, devolution of revenues from the Centre to the
States recommended by the Ninth Finance Commission seems
to provide an equitable and efficient basis for revenue sharing
between the Centre and the States on the one hand and among
the States on the other. The key to equity and efficiency in the
recommendations lies in the adoption of an explicitly articu
lated normative approach. Even though in the end result the
share of the States in the aggregate revenue receipts and
current expenditures of the government seems to have gone
down, the recommendations cannot be faulted on grounds of
vertical inequity unless one finds serious flaws in the norms.
320

The value of the Ninth Finance Commission's exercises to
achieve vertical equity is, however, considerably undermined
by the absence of any formula or arrangement to face situations
in which the Centre commands away a larger proportion of
real resources through borrowing and deficit financing and the
calculations of the FCs are thrown overboard. This is a lacuna
in the fiscal federalism in India which will need more serious
attention in the future than it has received so far. Alternatively,
there must be a national consensus in adhering to the levels of
the fiscal gaps projected by the Finance Commission, once these
are debated and found acceptable. Otherwise the fiscal situ
ation in the country, already quite perilous, cannot possibly
be saved from disaster. In the matter of horizontal equity the
Ninth Finance Commission's recommendations mark a
definite improvement over the past and apprehensions raised
by the First Report have been greatly allayed. However, there
is need for moving further in the directions set by the Ninth
Finance Commission in this regard. There is a great need to put
in serious effort well ahead of the setting up of the next Commis
sion for improving the methodology and, no less important, the
required data base.
NOTE
1 The figures given in Tables 3 and 4 are not comparable
with those computed for the article by the author on the
First Report of the Ninth Finance Commission because
of differing coverage of the grants component of the
transfers (vide EPW, December 3, 1988). In the earlier
computation, disaster relief and upgradation grants
were not included.
330

Table 1
Revenue Accraals of the Union Government and
the State governments
Year Revenue
Receipts
Of Centre
And States
Rs. Crore
(1)
1974-75
1975-76
1976-77
1977-78
1978-79
6th Finance
(2)
11048
13687
15258
16435
18775
Commission
(Avg)
1974-75 to
1978-79
1979-80
1980-81
337
1981-82
1982-83
1983-84
15041
21211
23835
28881
33086
36959
7th Finance Commission
(Avg)
1979-80 to
1983-84
1984-85
1985-86
1986-87
1987-88
1988-89(RE)
28794
42933
51011
58434
66838
76962
5th Finance Commission
(Avg)
1984-85 to
1988-89
1989-90(BE)
1990-95*
Note:#
59236
89678
685273
Own
Revenue
Of States
Rs. Crore
(3)
3716
4591
5387
5688
6487
5174-
7452
8491
10407
12026
13609
10397
15313
18091
20581
23797
26851
20927
30429
218771
Revenue
Accruals
Of States
Rs. Crore
(4)
6004
7475
8652
9401
11008
8508
13060
15036
17504
20243
22908
17750
26220
31906
35981
42167
47589
36773
52625
378634
Revenue
Accruals
Of Centre
Rs. Crore
P)
5044
6212
6606
7034
7767
6533
8151
8799
11377
12843
14051
11044
16713
19105
22453
24671
29374
22463
37053
306639
Revenue
Accruals
To States
(Col. 4 as
%of col 2)
(6)
54.34
54.61
56.70
57.20
58.63
56.30
61.57
63.08
60.61
61.18
61.98
61.69
61.07
62.55
61.58
63.09
61.83
62.02
58.68
55.25
Revenue
Accruals
To Centre
(Col. 5 as
%of col 2
(7)
45.66
45.39
43.30
42.80
41.37
43.70
38.43
36.92
39.39
38.82
38.02
38.31
38.93
37.45
38.42
36.91
38.17
37.98
41.32
44.75
As per NFC's estimates and recomendations. The computation is as follows :
Revenue Receipts (Rs. Crore):
Centre (gross)
less Finance Commission transfers
Plan transfers
Centre (net)
States:
Own Revenue
Add Finance Commission transfers
Plan transfers
States(net)
States Own
Revenue as
% of Total
Revenue %
(Col. 3 as %
of Col. 2)
(8)
33.64
33.54
35.31
34.61
34.55
34.33
35.13
35.62
36.03
36.35
36.82
35.99
35.67
35.46
35.22
35.60
34.89
35.37
31.92
466502
106062
53801
306639
218771
106062
53801
378634
331

Table 1
Share of Centre and the States in Total Revenue
Expenditure of the Government
1974-75
1975-76
1976-77
1977-78
1978-79
6th Finance Commission
(Avg)
1974-75 to
1978-79
1979-80
1980-81
1981-82
1982-83
1983-84
7th Finance Commission
(Avg)
1979-80 to
1983-84
1984-85
1985-86
1986-87
1987-88
1988-89(RE)
8th Finance Commission
(Avg)
1984-85 to
1988-89
1989-90(BE)
Combined
Centre,
States &
UTs
(Rs. Crore)
9882
11847
13863
14986
17348
13585
20356
23711
27864
33451
39139
28904
47329
56031
66189
77014
90077
67328
100504
States
&UTs
(Rs. Crore)
5602
6522
7555
8381
9872
7587
11512
14136
16193
19354
22691
16777
27118
31362
35960
43205
49674
37464
56439
Share of
States
&UTs
in Total
(percent)
56.69
55.05
54.50
55.93
56.91
55.81
56.55
59.62
58.12
57.86
57.98
58.02
57.30
55.97
54.33
56.10
55.15
55.77
56.16
Share of
Centre
(Percent)
43.31
44.95
45.50
44.07
43.09
44.19
43.45
40.38
41.88
42.14
42.02
41.98
42.70
44.03
45.67
43.90
44.85
44.23
43.84
332

Table 3
Per Capita Non-Plan Revenue Surplus of the States According
to the Recomendations of the Finance Commissions
(Rs.)
Sixth Seventh Eighth Ninth
Finance Finance Finance Finance
Commission Commission Commission Commission
Non-Special Category States :
Andhra Pradesh 15.21
Bihar
Gujarat
Haryana
Karnataka
Kerala
Madhya Pradesh
Maharashtra
Orissa
Punjab
Rajasthan
Tamil Nadu
Uttar Pradesh
West Bengal
Average
Proportion of
Maximum/Minimum
29.89
120.32
217.84
80.47
3.41
37.61
135.74
30.89
234.71
26.01
42.67
30.02
21.17
55.48
68.76
178.03
159.96
331.66
509.69
263.40
94.41
218.85
465.53
27.91
473.58
77.57
140.43
183.50
143.13
21558
18.26
333.82
132.48
629.89
920.12
478.84
228.35
356.05
885.37
47.18
927.41
97.33
601.53
309.88
29.66
380.80
31.27
576.96
442.67
947.48
1489.36
1008.09
135.30
345.48
1501.73
172.54
723.56
208.25
756.85
204.72
383.13
578.73
11.10
333

Table 4
Average and Dispersion of Per Capita Transfers#
under the Finance Commissions' Awards
(Rs.)
Share of
Taxes
Share of
Grants Total Taxes
Non-Special Category States
5th Finance Commission
Avg
S.D
C.V
16.82
1.00
0.06
6th Finance Commission
Avg
S.D
C.V
23.61
0.98
0.04
7th Finance Commission
Avg
S.D
C.V
Cor.Coeff.
with SDP
t-Values
57.06
4.20
0.07
-0.68*
-3.23
8th Finance Commission
Avg
S.D
C.V
Cor.Coeff.
with SDP
t-Values
83.83
13.42
0.16
-0.86*
-5.73
9th Finance Commission
Avg
S.D
C.V
Cor.Coeff.
with SDP
t-Values
173.19
32.43
0.19
-0.75*
-3.90
1.91
2.67
1.40
6.09
8.07
1.32
1.68
3.24
1.93
-0.41
-1.58
5.89
6.91
1.17
-0.28
-1.02
28.03
22.86
0.82
-0.60**
-263
18.73
2.75
0.15
29.70
7.91
0.27
58.74
6.40
0.11
-0.66*
-3.03
89.72
18.02
0.20
-0.75*
-3.87
201.22
50.34
0.25
-0.76*
-4.00
Avg
S.D
C.V
Avg
S.D
C.V
Avg
S.D
C.V
Cor. Coeff.
with SDP
t-values
Avg
S.D
C.V
Cor. Coeff.
with SDP
t-values
Avg
S.D
C.V
Cor. Coeff.
with SDP
t-values
Grants Total
Special Category States
12.56
4.16
0.33
22.40
0.23
0.01
47.22
16.98
0.36
0.16
0.40
310.13
152.87
0.49
0.04
0.11
716.88
363.45
0.51
-0.15
-0.45
65.28
95.12
1.46
95.90
52.17
0.54
189.82
167.61
0.88
-0.14
-0.34
175.65
105.15
0.60
0.05
0.12
393.77
237.21
0.60
-0.13
-0.38
77.85
95.50
1.23
118.29
52.18
0.44
237.04
164.99
0.70
-0.12
-0.31
485.78
257.73
0.53
0.05
0.11
1110.66
600.13
0.54
-0.14
-0.42
Note : # Percapita annual averages.
For the absolute figures vide Appendix Tables A to E.
* Significant at 1% level of significance.
** Significant at 5% level of significance.
334
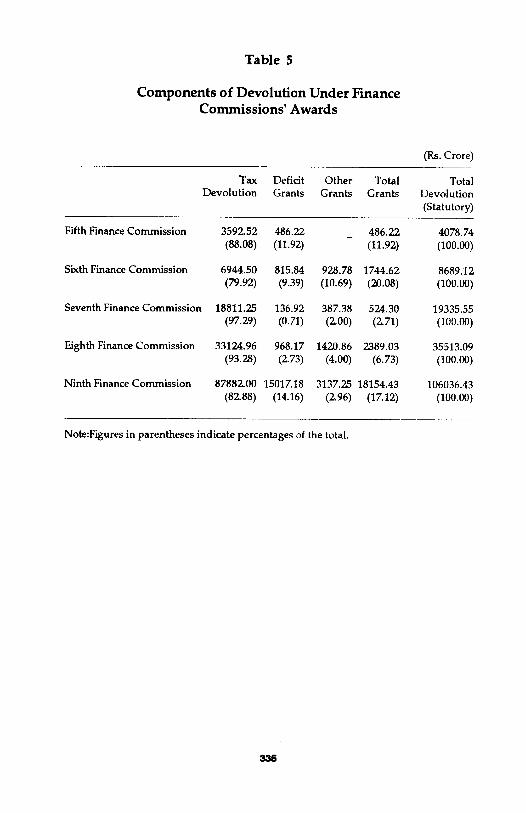
Table 5
Components of Devolution Under Finance
Commissions' Awards
(Rs. Crore)
Fifth Finance Commission
Sixth Finance Commission
Seventh Finance Commission
Eighth Finance Commission
Ninth Finance Commission
Tax
Devolution
3592.52
(88.08)
6944.50
(79.92)
18811.25
(97.29)
33124.96
(93.28)
87882.00
(82.88)
Deficit
Grants
486.22
(11.92)
815.84
(9.39)
136.92
(0.71)
968.17
(2.73)
15017.18
(14.16)
Other
Grants
-
928.78
(10.69)
387.38
(2.00)
1420.86
(4.00)
3137.25
(2.96)
Total
Grants
486.22
(11.92)
1744.62
(20.08)
524.30
(2.71)
2389.03
(6.73)
18154.43
(17.12)
Total
Devolution
(Statutory)
4078.74
(100.00)
8689.12
(100.00)
19335.55
(100.00)
35513.09
(100.00)
106036.43
(100.00)
Note:Figures in parentheses indicate percentages of the total.
335

APPENDIX TABLES
Table A
Fifth Finance Commission's Award
(1969-70 to 1973-74)
Per Capita Annual
Rs.
Table B
Sixth Finance Commission's Award
(1974-75 to 1978-79)
Per Capita Annual
Rs.
Share of
States Taxes Grant Total
Share of
States Taxes Grants Total
APR
BHR
GUJ
HAR
KAR
KER
MPR
MAH
ORS
PUN
RAJ
TND
UPR
WBN
Avg
S.D
C.V
N O N
15.90
17.94
17.26
14.99
15.55
17.25
16.48
19.31
16.70
16.60
16.41
16.95
17.13
17.00
16.82
1.00
0.06
-SPEC
2.97
0.00
0.00
0.00
1.22
4.68
0.00
0.00
9.57
0.00
3.96
1.11
0.00
3.28
1.91
2.67
1.40
I A L
18.87
17.94
17.26
14.99
16.77
21.93
16.48
19.31
26.26
16.60
20.36
18.06
17.13
20.28
18.73
2.75
0.15
C A T E G
APR
BHR
GUJ
HAR
KAR
KER
MPR
MAH
ORS
PUN
RAJ
TND
UPR
WBN
Avg
S.D
C.V
0 R Y S T
23.93
23.84
24.81
21.52
23.60
23.51
23.65
25.64
22.92
22.70
22.84
24.36
22.93
24.23
23.61
0.98
0.04
A T E S
8.64
3.43
0.00
0.00
0.00
18.12
0.00
0.00
25.62
0.00
15.79
0.00
3.96
9.67
6.09
8.07
1.32
32.57
27.28
24.81
21.52
23.60
41.63
23.65
25.64
48.55
22.70
38.63
24.36
26.89
33.90
29.70
7.91
0.27
SPECIAL CATEGORY STATES
ASM
HPR
J&K
MNP
MEG
NAG
TRP
Avg
S.D
C.V
14.74
14.15
17.97
6.20
14.58
13.95
6.36
12.56
4.16
0.33
11.29
17.38
31.78
42.26
21.56
297.00
35.73
65.28
95.12
1.46
26.04
31.53
49.75
48.46
36.13
310.95
42.09
77.85
95.50
1.23
ASM
HPR
J&K
MNP
MEG
NAG
TRP
Avg
S.D
C.V
22.11
22.69
22.72
22.21
22.48
22.14
22.41
22.40
0.23
0.01
30.41
84.75
67.06
188.73
130.65
41.63
128.05
95.90
52.17
0.54
52.52
107.44
89.78
210.95
! 53.13
63.77
150.46
118.29
52.18
0.44
336

Table C
Seventh Finance Commission's Award
(1979-80 to 1983-84)
Per Capita Annual
Rs.
Table D
Eighth Finance Commission's Award
(1984-85 to 1988-89)
Per Capita Annual
Rs.
States
APR
BHR
GUJ
HAR
KAR
KER
MPR
MAH
ORS
PUN
RAJ
TND
UPR
WBN
Avg
SD
C.V
Cor. Coeff
withSDP
ASM
HPR
J&K
MNP
MEG
NAG
SKM
TRP
Avg
S.D
C.V
Share of
Taxes <
N O N
57.00
62.49
57.58
48.64
55.08
61.00
59.78
55.50
62.69
50.78
52.64
61.75
55.40
58.52
57.06
4.20
0.07
-0.68
S
51.06
52.33
54.15
54.23
56.02
47.52
3.12
59.30
47.22
16.98
0.36
Cor. Coeff.
withSDP 0.16
Grants
- S P
0.74
1.83
0.00
0.00
0.00
0.33
2.48
0.00
13.01
0.00
1.15
1.14
1.94
0.91
1.68
3.24
1.93
-0.41
PEC
2.23
101.95
74.16
224.45
148.87
590.87
236.71
139.32
189.82
167.61
0.88
-0.14
Total
E C 1
57.75
64.32
57.58
48.64
55.08
61.34
62.26
55.50
75.70
50.78
53.79
62.89
57.34
59.44
58.74
640
0.11
-0.66
I A L
53.29
154.28
128.31
278.68
204.89
638.40
239.83
198.62
237.04
164.99
0.70
-0.12
SDP
(1973-76)
A L C A
928
645
1134
1399
1045
948
776
1349
793
1586
853
942
715
1033
1010.43
264.18
0.26
C A T E
791
1068
811
870
850
820
820
830
857.50
82.67
0.10
Sates
TEG
APR
BHR
GUJ
HAR
KAR
KER
MPR
MAH
ORS
PUN
RAJ
TND
UPR
WBN
Avg
S.D
C.V
Share of
Taxes Grants
O R Y
91.24
101.16
72.19
57.22
80.43
89.36
93.81
73.44
106.51
64.32
76.13
91.96
84.72
91.04
83.83
13.42
0.16
Cor. Coeff.
with SDP -0.86
G O R
ASM
HPR
J&K
MNP
MEG
NAG
SKM
TRP
Avg
S.D
C.V
Y S T
105.26
219.22
212.17
357.87
309.58
663.14
317.06
296.77
310.13
152.87
0.49
Cor. Coeff.
with SDP 0.04
S T
4.69
5.42
3.66
1.50
0.70
2.08
5.71
0.51
23.74
3.68
6.83
0.82
2.71
20.44
5.89
6.91
1.17
-0.28
A T
29.92
100.66
109.64
203.19
177.14
411.47
204.30
168.86
175.65
105.15
0.60
0.05
SDP
Total (1976-79)
ATE:
95.94
106.58
75.85
58.73
81.14
91.44
99.52
73.95
130.26
68.01
82.96
92.78
87.43
111.48
89.72
18.02
0.20
-0.75
E S
135.18
319.87
321.81
561.06
486.72
1074.61
521.36
465.63
485.78
257.73
0.53
0.05
S
1006
755
1590
1895
1202
1162
895
1670
918
2250
1127
1165
870
1247
1268.00
415.86
0.33
960
1230
1100
859
1046
1100
1100
1082
1059.63
102.94
0.10\
337

Table E
Ninth Finance Commission's Award
(1989-90 to 1994-95)
Per Capita Annual
Rs.
Share of SDP
States Taxes Grants Total (1982-85)
Non-Special Category States
APR
BHR
GUJ
HAR
KAR
KER
MPR
MAH
ORS
PUN
RAJ
TND
UPR
WBN
Avg
S.D
C.V
Cor. Coeff.
with SDP
185.43
206.66
143.10
124.33
154.83
180.83
184.67
142.90
252.30
135.10
183.07
199.65
158.70
173.07
173.19
32.43
0.19
-0.75
18.72
32.17
13.44
7.01
3.96
32.76
36.99
3.91
74.51
14.17
75.86
6.32
40.86
31.75
28.03
22.86
0.82
-0.60
Special Category SUtes
ARP
ASM
GOA
HPR
J&K
MNP
MEG
MIZ
NAG
SKM
TRP
Avg
S.D
C.V
Cor. Coeff.
with SDP
1104.92
196.67
488.32
444.68
521.05
683.12
573.65
1504.32
1161.11
567.61
640.27
716.88
363.45
0.51
-0.15
653.55
65.35
245.69
206.89
268.22
361.15
270.97
905.09
686.70
348.48
319.42
393.77
237.21
0.60
-0.13
204.15
238.83
156.54
131.34
158.79
213.59
221.66
146.81
326.81
149.27
258.93
205.97
199.56
204.82
201.22
50.34
0.25
-0.76
1758.47
262.02
734.01
651.57
789.27
1044.28
844.63
2409.40
1847.81
916.09
959.69
1110.66
600.13
0.54
-0.14
2053
1323
2919
3043
2461
2144
1860
3384
1728
4013
1820
2142
1713
2230
2345.21
717.51
0.31
2746
1863
4437
2103
2380
2205
1960
1778
2268
2570
1784
2372.18
718.70
0.30
336