Embed Size (px)
Citation preview

Applying the Climate Lens Resilience Assessment in a BC Context
FBC PresentationDirk Nyland, P.Eng., IRP,Chief Engineer, BCMoTI
December 4, 2018

There has been a substantial increase in the intensity of heavy-precipitation events over large parts of the Northern Hemisphere due to greenhouse gases.
(Storms with over 100 millimetres of precipitation in 24 hours.)
Source: Zwiers, Nature, 2011
Holberg Road (Vancouver Island, Sept 2010) Hagensborg (Bella Coola, Sept 2010)
2

Goal is to reduce damage from extreme weather events and climate changes by adapting engineering design and practices for resilient, reliable, efficient and effective transportation infrastructure
Design Construction Maintenance
COST OF INFRASTRUCTURE
(resilience = lower maintenance)3

BCMoTI involved developing PIEVC tool to assess infrastructure vulnerability to projected extreme weather and climate change. Using multi-disciplinary/stakeholder and local knowledge/experience inputs
4
Commotion Creek Hwy 97 2016 Peace Region Flooding 2016

BC Assessment Sites
• 2010 Coquihalla Highway
• 2011 Yellowhead Highway
• 2013 Bella Coola, Stewart, Pine Pass
• Sites have different geographic and climatic conditions
5Yellowhead Coquihalla

Highways are generally resilient to climate change except for extreme precipitation events; further research is required for events such as rain on snow, fog and wind, avalanche, landslides, sea level rise, etc.
6
Bitter Creek Bridge, Stewart, Sept 2011Yellowhead Hwy

• Develop awareness of climate change/extreme weather and implications (primarily water related events)
• Include climate adaptation in organizational practice
• Use multidisciplinary teams for projects
• Use qualified professionals with local knowledge (climate, meteorological, hydrotechnical)
• Adaptation education for professionals, consultants, staff and students
7
Lessons Learned to Date
Batnuni Bridge 2018
Narcosli Bridge 2018

• Monitor data used in current codes and standards and develop climate resilience specific codes
• Use data and/or professional judgement
• Apply sensitivity analysis
• Understand risks and uncertainties
• Review association guidance
8
Best Practices
Bella Coola, Sept 2010
• Use information from ensemble of climate models
• Determine best models and data to use

In 2014-15, ACECBC consultants, EGBC, PCIC and BCMOTI partnered in developing a technical circular considering climate adapted design for highway reliability
Grand Forks, May 20189

Technical Circular Requirements
• Design for climate change and extreme weather event from model projections
• Vulnerability screening analysis for the design life of structures and components including data sources
• Development of practical and affordable design criteria
• Design Criteria Sheet to summarize climate parameter changes
10

Design SheetExample
1111

EGBC Practice Guidelines
12
Request for Proposal (2.2.1.1)
Define Highway Infrastructure project (3.2)
Conduct screening-level, climate change risk assessment (3.3)
Identify and incorporate climate adaptation options (3.4)
Documents (3.5)- Climate change risk assessment- Hwy resilient design report- Assurance statement- BCMoTI Design Criteria Sheet

• The Concessionaire shall comply with Technical Circular T-06/15
• Consider at a minimum, temperature, rain, snow, ice, fog, hail, frost, humidity, ice accretion, wind, floods, extreme temperatures and precipitation, and storms of various intensities
• Rely on current climatological modelling analysis relevant to Greater Vancouver area of BC
• Assess how vulnerability risks are anticipated to change over the Design Life
• Assess potential impacts and identify proposed actions
George Massey & Pattullo BridgesProject Agreements – Climate change Section
13

14
Vulnerability Screening - PIEVC

Types of Data for Vulnerability Assessment
• Infrastructure Components
• Infrastructure Age
• Availability of Infrastructure Data
• Geotechnical Indicators
• Variety of Terrain
• Traffic Volumes
• Strategic Importance of Route
• Occurrence of Extreme Environmental Events
• Historic Weather Data Available
• Current Weather Data Available
• Expected Climatic Change – Temperature
• Expected Climatic Change – Precipitation
• Climatic Regions
• Sea Level Rise
15

Infrastructure Components
16
• Surface asphalt• Bridges• Ditches
• Catch basins• Culverts• Third-party utilities
Salmon Arm 2018Kootenay Pass 2018

Climate Projections – Design for Extremes
• Extreme rainfall in one or more days (e.g. >76 mm/24 hrs)
• Atmospheric River-Pineapple Express (e.g. >150 mm/24 hrs)
• High Temperature (e.g. number of days over 30°C)
• Temperature variability (e.g. freeze-thaw)
• Sea level rise
Hwy 97 June 2016
17
Cariboo 2018

Design implications for higher temperature and precipitation over lifecycle of components, i.e. pavement (15-20 years), culverts (75 years), bridges (50-100 years)
18
Nazko 2018 Revelstoke Hwy 23N 2018

Bridges and Structures
Hydrotechnical Design – Scour
Current
Standards
Maximum instantaneous discharge (Q200)
Clearance between design water surface and bridge soffit (ie.
1.5 m)
Climatic Inputs• Historic streamflow from hydrometric gauges
• Historic precipitation from weather stations
Climate Change
Risk Issues
• Changes in streamflow (Q200)
• Changes at watershed scale (land use & vegetation)
• Changes in channel scale (stability, sediment transport)
Potential
Adaptation
Measurer
• Estimate and use future streamflow (Q200)
• Structure clearance, size, clear span
• Construction quality (riprap)
• Debris control
• Maintenance for debris and sediment
19

Bridges and Structures
Thermal Movement
Current
StandardsCanadian Highway Bridge Design Code
Climatic
Inputs
Temperature allowance in excess of max and min mean
daily temperature
Risk Issues
• Increase in temperature
• Temperature extremes
• (Note: for general bridge design – risk may be low.
Temperature changes may be small relative to
accuracy of bridge code values)
Adaptation
Values
NRC incorporate projected future temperature maps in
code
20

Geotechnical
Slope Stability
Current
StandardsSafety factor 1.5
Climatic
InputsCurrent conditions and moisture changes
Risk Issues
• Increased precipitation
• Groundwater changes
• Changes in land use and vegetation
• Higher flow volumes and velocities
Adaptation
Values
Compare recent conditions and future climate
projections
21

Geotechnical
Pavement Grade - Asphalt Cement Mix
Current
StandardsStandard Specification 952
Climatic Inputs Pavement Grade values based on historic temperature and use
Risk Issues Increased temperatures
Adaptation
ValuesModify PG rating based on future temperature and use
22

Change in Projected Flows(Model Averages)
Model Output Location
Average Change Relative to Historic
2040-2069
200-year Hourly Peak Flow (m3/s)
(% change to historic)
Bitter Creek (Stewart) 34
Medby Creek (Bella Coola) 35
Fisher Creek (Pine Pass) 39
23

Adapted Bridge Designs - Flow
Region Return periods from sheets vary
% ↑ Design Value for Climate Change
Climate Data
NR 100-200yr +9% to +30% -MoTI practices-EGBC recommendations*-PCIC regional reports-IDFCC-Consultant Reports
SIR 100-200yr +10% to +20% -MoTI practices-EGBC recommendations*-PCIC-Consultant Reports
SCR 200yr +11% to +15% -MoE coastal guidelines-EGBC recommendations*-Consultant Reports
24

Adapted Culvert Designs - Flow
25
Region
Return periods from sheets vary
% ↑ Design Value for
Climate Change Climate Data
NR 50-200yr +10% to +25% - IDFCC- Consultant reports
SIR 25-200yr +10% - MoTI- EGBC recommendations*- Consultant Reports
SCR 5-200yr +3.6% to +25% - EGBC recommendations*- PCIC- IDFCC- Consultant Reports
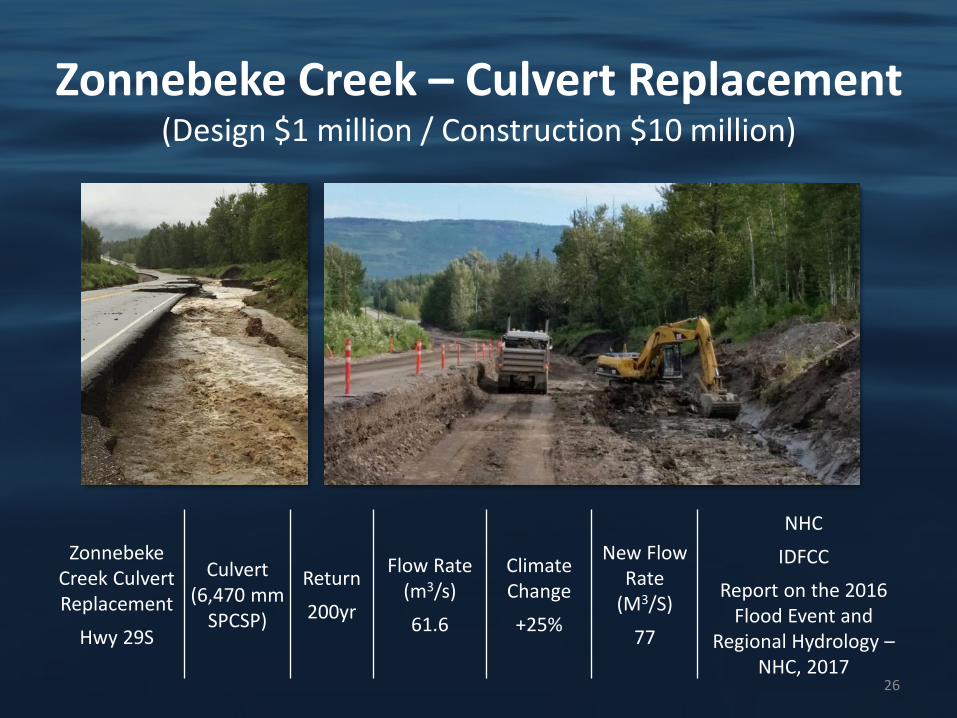
Zonnebeke Creek – Culvert Replacement(Design $1 million / Construction $10 million)
26
ZonnebekeCreek Culvert Replacement
Hwy 29S
Culvert (6,470 mm
SPCSP)
Return
200yr
Flow Rate (m3/s)
61.6
Climate Change
+25%
New Flow Rate
(M3/S)
77
NHC
IDFCC
Report on the 2016 Flood Event and
Regional Hydrology –NHC, 2017

27McKenzie Interchange
(Critical Sewer Segment 2 of 10)
Admirals-McKenzie
Interchange
Hwy 1
Critical Sewer
Segment #2
200yr
Flow Rate (l/s)
711
Climate Change +18.4%
Flow Rate (l/s)
842
Urban Systems
Future IDF curves

28
Mountain Hwy Interchange
Hwy 1
Major Drainage systems
Keith Creek
Culverts
100yr
(75yr DL)
Flow Rate (m3/s)
18.1
ClimateChange
+20%
Flow Rate (M3/S)
21.7
Associated Engineering
PCIC (Plan2Adapt 90th% 17.5%↑)
APEGBC (10%, 20%↑)
IDFCC (18-23%↑)
Mtn HwyInterchange

BCMoTI Continuing Work
• NRCan Project – interdependencies and adaptation economic analysis
• PCIC Climate Explorer
29

Climate Resources
PCIC Climate data portal and support
• Plan2Adapt
• Downscaled climate data - projections
• Hydrologic model output – projections
• Engineering specific tool – projections (in development)
• Support from climate scientists
30

31

32
PCIC Climate Explorer

BCMoTI Adaptation Site
BCMoTI Adaptation site: https://www2.gov.bc.ca/gov/content/transportation/transportation-environment/climate-action/adaptation
33
Old Kamloops Rd Hwy 5A 2018Sportsman Bowl Rd 2018

Adapt highway infrastructure for resilience to extreme events and climate change using vulnerability assessment and climate projection tools
Recap
34

Thank you. Questions?
35
Grizzly Creek CulvertTrash Rack – Flying V (2013)