Embed Size (px)
Citation preview

Applying system dynamics to value chain analysis
Kanar Dizyee
Derek Baker
Karl M. Rich
Euan Fleming
Heather Burrow
Presentation to the AARES 2016: 60TH ANNUAL CONFERENCE OF THE AUSTRALIAN AGRICULTURAL AND RESOURCE ECONOMICS SOCIETY, Feb 2nd-5th 2016, Canberra-
Australia
1

Outline
• Motivation
• Role of systems thinking approaches to enhance VCs
• Conceptual framework
• Examples
• Next steps
2

Motivation
• Significant research has been conducted on agricultural/agribusiness value chains in the past 15-20 years
• And while we have lots of analyses, new definitions, and created a lot of confusion over terminology (supply chain vs value chain vs netchains vs value networks e.g.), we haven’t moved much methodologically.
• Current value chain methods are:– Largely qualitative
– Largely descriptive
– Reaching their limits in terms of analytical power
3

Motivation
• A big gap: limited use of quantitative techniques to look at dynamics of value chains, their actors, and interventions that affect the system (priorities, impacts, etc.).
– The $20 million question…
• But are current analytical methods good enough in a value chain context – are we missing anything? Can we identify other, more appropriate methods?
4

Motivation
• Our aims:
1. To review the applicability of standard economic models in value chain settings;
2. To argue for the use of systems perspectives in value chain analyses
3. To establish a conceptual framework for operationalizing systems approaches
4. To highlight a few case studies that illustrate this approach
5

Current methods
6
• We can identify a number of quantitative methods that can be used in a policy analysis/impact assessment setting:
– Cost-benefit/partial budget models (used in a few value chain studies e.g. Tchale & Keyser 2010)
– Partial equilibrium models (single-sector, multi-sector)
– General equilibrium models (including social accounting matrices and input-output models)
• How applicable are these in a value chain, particular given the complex interactions that exist between actors from production through consumption?

Partial equilibrium models vs value chains
7
Maize production
Maize collection
Maize wholesaling
Maize processing
Processed maize trade
Breakfast cereal production
Maize production Breakfast cereal production
S S
D
D
???
Intervention
S’
D’
Chain impacts
Nodal impacts – direct and feedback effects, often with delays (market, institutional, strategic choice)
System impacts – contextual, environmental

What is system dynamics?
8
“System dynamics is a computer-aided approach to policy analysis and design. It applies to dynamic problems arising in complex social, managerial, economic, or ecological systems —literally any dynamic systems characterized by interdependence, mutual interaction, information feedback, and circular causality.” (Source: System Dynamics Society)
Central concepts of SD
• Stocks (accumulation)
• Flows (change overtime – rate/time unit)
• Feedback loops (circular causality)

What does SD provide us in value chain analysis?
9
• Analysis at a finer resolution (from sector to level of chain actors)
• Ability to endogenize the role that governance and institutions play in value chains
• System context – incorporating the role of environmental and biophysical factors directly in the model
• A bridge to qualitative value chain analysis: SD can serve as an additional overlay to existing value chain maps and description

Applications of system dynamics
10
• A limited number of SD applications have been applied within value chain work (Rich et al. 2011; Hamza et al. 2014; Naziri et al. 2015)
• Other related research exists in the supply chain management literature (Georgiadis et al. 2005; Minegishi & Thiel 2000; Fila 2005; Cloutier & Sonka1999; Mowat et al. 1997)
• However, the focus of these models has mainly been on processes of the flow of goods and services within in the value chain, looking narrowly at firm-level strategies or simple technical/policy interventions that influences these flows.
• Contextual factors (environment, institutions, governance) missing

Conceptual framework
11

Case Studies (project partner)
12
1- Botswana beef value chain (ILRI)
2- Tanzania (Kilosa district) dairy value chain (ILRI)
3- Amaranth value chain in East Africa (CSIRO and World Vegetable Center)
Reasons for selecting different value chains:
1- To maintain case studies diversity.2- Better validate the conceptual framework.3- Partner availability.
We have red meat, dairy, and crop value chains

13
Paper 1: Applying system dynamics to value chain
analysis
Purpose:
1- Literature review to identify research gaps that our
research attempts to fill.
2- Motivating the use of SD in value chain analysis
3- Describing the conceptual framework.
4- Brief overview of case studies
m
Environment Module• Pasture
• Disease
• Management
• Seasonality
Production Module• Continuous production
and trading
• Extensive production
system
Market &
Economic Module
• BMC monopsony
• Transboundary
diseases
• Market disruption
Performance
Module
• Chain actors profit
(cumulative & over
time)
• Whole chain profit
Institution Module• Market power
• Disease management
Policy Module• Better disease control
• Partial ease of BMC
monopsony
Paper 2:
Botswana: beef value chainm
Environment Module• Land/pasture
• Disease
• Management
• Seasonality
Production Module• Milk production
• Extensive production
system
Market &
Economic Module
• Limited market
access (rural to
rural)
• Low profitability
• Idle Processing
capacity
Performance
Module
• Milk production
• Profit
• Milk consumption
• Improved breed
• Chilling and
processing plants
Institution Module• Factors affecting adoption
• Market-hub organization
• Producers organization
Policy Module• AI
• Dairy market hub
Paper 3:
Kilosa: dairy value chainm
Environment Module• Irrigation
• Land
• Pest/fertiliser
• Management
Production Module• Crop
• Two batches of
production per year
• Two distinct products
Market &
Economic Module
• Low demand (low
consumer
awareness)
• Low profitability
Performance
Module
• Producers profit
Institution Module• Factors affecting adoption
• Land allocation
• Learning and awareness
Policy Module• Improved seed variety
• Marketing
Paper 4:
East Africa: amaranth value chain

Next steps
• So far, the baseline models constructed for each case studies are process driven.
• Model outcomes for each case study are not (yet) affected by institutional and behavioural (such as learning and awareness) aspects.
• Next steps will be to include institutional and behaviouralaspects to case studies as appropriate.
14

Ex-ante impact assessment in improving the dairy value chain in Tanzania: a system dynamics
approach
Kanar Dizyee (UNE)
Derek Baker (UNE)
Karl M. Rich (UNE & Licoln University)
Hikuepi Katjiuongua (ILRI)
Amos Omore (ILRI)
Presentation to the AARES 2016: 60TH ANNUAL CONFERENCE OF THE AUSTRALIAN AGRICULTURAL AND RESOURCE ECONOMICS SOCIETY, Feb 2nd-5th
2016, Canberra-Australia
16

Smallholder cattle producers in Tanzania
• Tanzania has one of the largest, about 21.3 million heads, cattle populations in Africa.
• Cattle make significant contribution to the economy of Tanzania, particularly rural economy.
• Majority (97%) of cattle herds in Tanzania consist of non-dairy low productive, in respect of milk production, indigenous East African short horn zebu.
Baseline report (2014) 17

Production systems
• Dairy cattle production system in Tanzania is characterized by intensive and extensive systems.
• Intensive production system is characterized by the use of more productive cross breed cattle.
• Extensive production system is characterized by less productive local breed cattle.
Baseline report (2014)18

Purpose
In this study we attempt to analyze the dairy value chain in Kilosa district (study site: 106 households; about 5,000 heads of cattle) in Tanzania to improve challenges encountered by producers in an extensive dairy system of Kilosa.
Kilosa district is characterized by extensive dairy production system (majority local breed cows) with key challenges:
1. Low productive cows and low milk production.
2. Limited market access (only rural market).
Baseline report (2014) 19

Research questions
• Are there transition mechanisms for extensive pre-commercial dairy farmers to become intensive and more commercial?
• Is there a “dairy market hub” solution to Tanzania dairy extensive pre-commercial systems?
20

Method
“System dynamics (SD) is a computer-aided approach to policy analysis and design. It applies to dynamic problems arising in complex social, managerial, economic, or ecological systems —literally any dynamic systems characterized by interdependence, mutual interaction, information feedback, and circular causality.”
System dynamics society 21
22
m
22
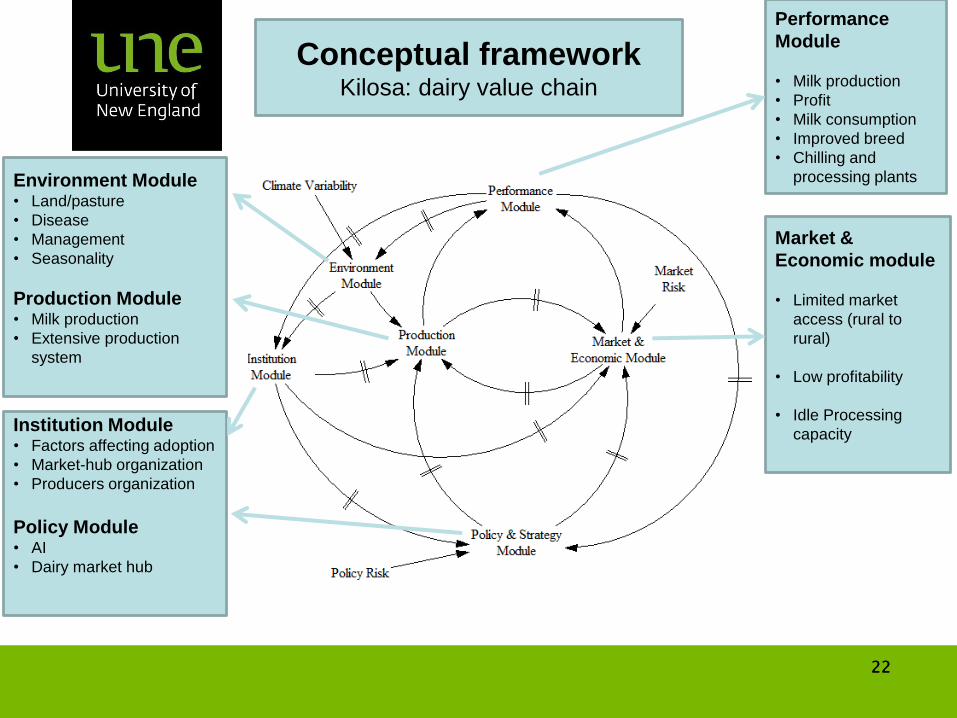
Environment Module• Land/pasture
• Disease
• Management
• Seasonality
Production Module• Milk production
• Extensive production
system
Market &
Economic module
• Limited market
access (rural to
rural)
• Low profitability
• Idle Processing
capacity
Performance
Module
• Milk production
• Profit
• Milk consumption
• Improved breed
• Chilling and
processing plants
Institution Module• Factors affecting adoption
• Market-hub organization
• Producers organization
Policy Module• AI
• Dairy market hub
Conceptual frameworkKilosa: dairy value chain

Problem
articulation
Hypothesis
Model
formulation
Model
validation
Policy design
and analysis
Low incomefrom dairyactivities
Low milkconsumption athousehold level
Low cattleproductivity
Extensiveproduction system
Use of quantitativemodels to conductex-ante analysis
Test modelstructure and
results
Artificialinsemination
Dairy markethub
Limited marketaccess
Modelling process: dairy value chain in Kilosa district
23

Portrayal of our the dairy value chain in Kilosa
24
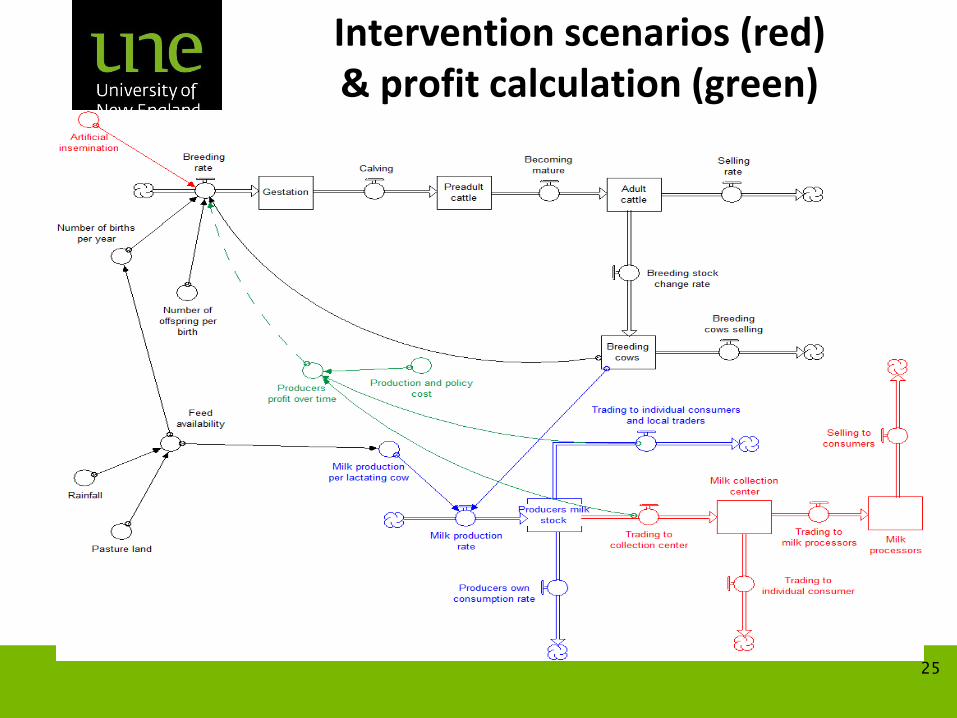
Intervention scenarios (red)& profit calculation (green)
25

Baseline and simulation scenarios
• Scenario 1 (baseline): We run the model based on baseline data to provide a benchmark to compare performance of intervention scenarios. Market share: 62% of produced milk is consumed at producer’s home, 15% is sold to local traders, and 23% is sold to local consumers (mostly neighbors).
• Scenario 2: We assume that producers implement artificial insemination (AI) to improve cattle breeds to increase milk productivity. We assume that producers inseminate 50% of their breeding cows with AI per year starting from 2016 (week 52). The cost of AI per service is 18 USD. The success rate of AI is 60%.
• Scenario 3: This scenario is the same as scenario 2 except we assume producers establish a milk market hub to collect surplus milk and transport milk to processors and urban traders.
26

Simulation results (1: baseline; 2:Scenario 2; 3: Scenario 3)
0
6000
12000
18000
24000
30000
Lit
er/
week
Year
Milk production
1:Milk production overtime
2: Milk production overtime
3:Milk production overtime
AI intervention begins to change milk production
Artificial insemination start time
27

Simulation results
-1000
0
1000
2000
3000
4000
5000
US
D/w
eek
Year
Profit over time (USD/week)
1:Producers Profit OverTime
2:Producers Profit OverTime
3:Producers Profit OverTime
Artificial insemination start time
AI intervention begins to positively change profit
Milk market hub increases market access and profit
28

Cumulative changes of producer's profit and other key variables
Percentage change in cumulative (by the end of simulation,
2025)
ScenariosMilk
production
Cumulative
profit
Milk
consumption
Improved cross
breed (%total
population)
milk traded to
milk market
hub (liter)
Milk traded to
processors
(liter)
2 vs.1 18% -10% 13% 42% NA NA
3 vs.1 18% 14% 13% 42% 197,404 157,903
Indicates that AI without improvedmarket access does not pay off
Indicates in 2025, 42% of total cattle population becameImproved cross breed
Indicates in scenarios 2 & 3 producers consumed 13% more milk relative to baseline
Indicate total volumemilk traded through milk market hub and processors
29

Conclusion
• This paper presented a dairy value chain model representing the Kilosa region of Tanzania.
• Our model results highlight the importance of artificial insemination (AI) to increase production and milk market hub to improve dairy producer’s access to the market and milk consumption at producer’s household.
• Bundling AI use and hub for collective bulking and marketing could greatly help the transition from extensive pre-commercial production to more commercial intensive semi-commercial dairying in Kilosa district of Tanzania
30

Next steps and further research
(1) How can AI be made more accessible and affordable to smallholder producers?
(2) Evaluate supplementary feed and animal health service needs to evaluate the possibility of a sustainable transition to intensive dairy value chains.
(3) Assess and incorporate the costs to developing and maintaining milk market hubs.
(4) Evaluate value-adding mechanisms: e.g. processed products such as fermented milk or ‘Mtindi’, yogurt, butter, and cheese.
31

Thank you ….
For any questions , please email
Kanar Dizyee
32