Embed Size (px)
Citation preview

2011
Applying performance funding to
Essential Skills: State of knowledge review
Boris Palameta | Karen Myers | Natalie Conte

The Social Research and Demonstration
Corporation (SRDC) is a non-profit research
organization, created specifically to develop, field
test, and rigorously evaluate new programs. SRDC's
two-part mission is to help policy-makers and
practitioners identify policies and programs that
improve the well-being of all Canadians, with a
special concern for the effects on the disadvantaged,
and to raise the standards of evidence that are used
in assessing these policies.
Since its establishment in December 1991, SRDC has
completed over 150 projects and studies for various
federal and provincial departments, municipalities, as
well as other public and non-profit organizations.
SRDC has offices located in Ottawa, Toronto, and
Vancouver.
For information on SRDC publications, contact
Social Research and Demonstration Corporation
55 Murray Street, Suite 400
Ottawa, Ontario K1N 5M3
613-237-4311 | 1-866-896-7732
[email protected] | www.srdc.org
Published in 2013 by the Social Research and
Demonstration Corporation
Workplace Education Manitoba (WEM) is a non-
profit workplace literacy and Essential Skills
development and delivery organization. WEM has
excelled since 1991 at raising ES levels for the
purpose of work. www.wem.mb.ca

Applying performance funding to Essential Skills:
State of knowledge review
Social Research and Demonstration Corporation i
Table of contents
Acknowledgements 1
1. Introduction 2
1.1 Report purpose and project objectives 2
1.2 Context and rationale 2
1.3 Methodology 3
2. Understanding performance-based funding models 5
2.1 Why performance-based funding? 5
2.2 Key components of PBF systems 6
2.3 PBF in employment and training programs 10
3. Does PBF improve programs? 23
3.1 Effects of PBF on provider behaviour 23
3.2 Does PBF add value? 28
3.3 Do performance indicators accurately reflect long-term program impacts? 29
4. Guiding principles for designing a PBF system that works 31
4.1 Key lessons learned 31
4.2 Guiding principles for designing a PBF system that works 32
4.3 A promising PBF model for Essential Skills programs 39
5. Conclusion 41
References 43

Applying performance funding to Essential Skills:
State of knowledge review
Social Research and Demonstration Corporation 1
Acknowledgements
This report was prepared as part of the Pay for Performance Project, a six-month initiative lead by
Workplace Education Manitoba in partnership with the Social Research and Demonstration
Corporation. The initiative was funded by Human Resources and Skills Development Canada’s (HRSDC)
Office of Literacy and Essential Skills (OLES).
The project team would like to thank the Labour Market Skills Division of Manitoba Entrepreneurship,
Training and Trade (ETT) for its ongoing support both financial and in-kind to increasing the skills of
Manitobans. Of particular note is the focus provided for programming in Essential Skills and the
mandate to ensure adequate Essential Skills levels for all Manitobans.
We also would like to thank the Nova Scotia Department of Labour and Advanced Education for its
participation in the Pay for Performance project reference group and for coordinating focus group
participation in Nova Scotia. The Nova Scotia government is also acknowledged for its commitments to
increasing the Essential Skills levels of job seekers and existing workers.
Finally, we would like to thank focus group participants in Manitoba and Nova Scotia, as well as subject
matter experts from across North America in the areas of performance-based funding and Essential
Skills for their time and input.

Applying performance funding to Essential Skills:
State of knowledge review
Social Research and Demonstration Corporation 2
1. Introduction
1.1 Report purpose and project objectives
This State of Knowledge Review was prepared as part of the Pay for Performance Project, a six-month
initiative funded by Human Resources and Skills Development Canada’s (HRSDC) Office of Literacy and
Essential Skills (OLES). The purpose of this project is to explore ideas for experimenting with various
approaches to rewarding Essential Skills service delivery providers for their performance; or in other
words, paying for success.
Specifically, the project has three broad objectives:
First, to investigate the current state of knowledge on what works with performance-based funding
(PBF), identify key lessons learned, and highlight promising approaches;
Second, to consult with key stakeholders to determine whether and how these promising
approaches could be applied to an Essential Skills training context;
Finally, building on these consultations and wider lessons learned, develop a performance-based
funding model for Essential Skills training delivery that can be pilot tested and evaluated in Canada.
In this report, we assess the state of knowledge in terms of what we know about what works and what
does not work with performance based funding system in the context of employment and training
programs. The report is organized into five sections:
Section 1 presents the project goals and outlines our research methodology;
Section 2 presents a conceptual framework for understanding PBF models and then draws on this
conceptual framework to describe various PBF models as they have been applied to selected
employment and training and programs in Canada, the US, UK, and Australia;
Section 3 analyzes the research literature to determine what know about the effectiveness of
various PBF models in terms of changing provider behavior and improving outcomes for clients;
Section 4 draws on the findings from our literature review as well as the results of our
consultations to present lessons learned and promising directions for PBF models;
Section 5 concludes the report by summarizing the key findings of this State of Knowledge Review.
1.2 Context and rationale
In the context of growing concern over skills mismatches and an increasing need for skilled workers,
there is continued concern over the literacy and essential skills of working age adults. Though surveys
since the mid-nineties have shown that approximately two in five Canadian adults score below IALS
level 3 proficiency in various skill domains, little progress has been made in raising skills levels.
Although the pool of Canadians needing to retrain or upgrade their skills continues to grow, relatively
few adults participate in literacy programs. Among those who participate, even fewer persist long
enough to benefit. Only a small proportion of literacy learners make the transition to further education
Applying performance funding to Essential Skills:
State of knowledge review
Social Research and Demonstration Corporation 3
and training as part of a pathway to decent paying jobs. While the reasons for lack of persistence are
multiple and complex, there is a growing consensus that existing adult learning programs are not
optimized to meet the needs of working age adults.
One reason for this may be that few programs are specifically designed to be part of a career pathway
for low-skilled workers or job-seekers. Provincial employment systems typically have multiple
program streams for job-seekers but programs in these streams are often designed as self-contained
programs rather than as components of an integrated pathway. Similarly, adult education systems tend
to include a hodgepodge of disconnected programs such as literacy and basic skills training, high school
equivalency programs, publicly sponsored employment programs, and dislocated worker re-
employment programs (Giloth, 2009; Myers & De Broucker, 2006; Prince & Jenkins, 2005).
As a result, a non-trivial percentage of individuals with lower skills end up cycling in and out of
employment. Individuals who do enroll in upgrading programs often drop out before they reach the
‘tipping point’ of better earnings and improved labour market prospects. Consultations with
practitioners, policy makers and other experts reaffirmed the importance of these challenges, especially
in light of increasing public policy concern with increasing the labour force participation of under-
represented groups.
While our consultations suggested widespread agreement on the need to better integrate various
components of career development-learning pathways, they also identified that current funding
formulas rarely give providers incentive to innovate in these areas. Stakeholders are increasingly
concerned that delivery of various kinds of skills training in Canada is locked into “traditional” funding
structures and methodologies that create program silos and impede innovative approaches to foster
workplace readiness and advancement.
Therefore, while there is growing consensus on the need to improve effectiveness/efficiency and
stimulate innovation in order to achieve desired outcomes, there is concern that existing arrangements
may impede efforts in this direction. In response, some jurisdictions have implemented a strategy
known as performance-based funding (PBF). Typically, in a PBF model incentives are set in place to
reward achievement of measurable, clearly defined performance indicators. The assumption is that
rewarding success will give service providers both the incentives and the means to innovate and
improve client outcomes. This report investigates what we know about how well PBF delivers on this
promise.
1.3 Methodology
The study used a number of information-gathering techniques and sources, including an environmental
scan, literature review, and practitioner and expert consultations.
Environmental scan
We started with a broad environmental scan to gain a better understanding of how PBF models are
being used across relevant jurisdictions in a wide range of social programs including employment and
training programs. In this scan, we aimed to identify the major components of PBF systems and to
understand how they differ across models.

Applying performance funding to Essential Skills:
State of knowledge review
Social Research and Demonstration Corporation 4
Literature review
Next, we conducted a focused review of the existing research literature to ensure a state of the art
understanding of what works and does not work with PBF models in the specific context of
employment and training programs. We examined evaluations, lessons learned and outcomes for
programs in Canada, the United States, Australia, and the United Kingdom.
Consultations
Finally, we consulted with academics, policy researchers and practitioners. The objectives of the
consultations were twofold. First, we aimed to further illuminate the results of the literature review
and environmental scan. Second, we solicited feedback on potential program model options that could
be pilot tested in Canada. A list of experts was developed based on the results of the environmental
scan as well as on referrals from leaders in the field. Efforts were made to ensure experts represented a
broad range of theoretical and practical perspectives. Interviews were semi-structured and guided both
by an interview protocol, as well as by issues identified by the participants. The researchers produced
memos for all interviews and analyzed data according to categories and themes. The next step was to
identify patterns and relationships within and across categories and to draw out implications or
findings. Findings from the interviews were compared with findings from the environmental scan and
literature review. Further consultations were conducted with practitioners and other key stakeholders
in two Canadian provinces: Manitoba and Nova Scotia.

Applying performance funding to Essential Skills:
State of knowledge review
Social Research and Demonstration Corporation 5
2. Understanding performance-based funding models
2.1 Why performance-based funding?
While our consultations suggested widespread agreement on the need to better integrate various
components of career development-learning pathways, current funding formulas rarely give providers
incentive to innovate in these areas. Generally speaking, governments tend to hold providers
accountable for how programs are delivered instead of whether they produce results. To this end,
governments typically set narrow rules under which providers must operate that specify in great detail
how services should be delivered. There is growing evidence, however, that this kind of approach is
often a poor solution to the inherent complexity of service delivery (Heckman, Heinrich, & Smith,
2011a). When the rules are too constrained, they can stifle innovation. The consequence is, as Buery
(2012) points out:
Instead of 100 nonprofits trying to build a better mouse trap, you have 100 nonprofits following a
government-designed schematic for how to build a mouse trap. Even when the government's design is
strong, we lose a central benefit: the ability to try new things and respond to local conditions
Moreover, within existing funding arrangements and accountability frameworks, there is often no way
to channel funds to promising practices that have a better chance of addressing complex problems.
Governments and services providers alike are increasingly interested in alternative approaches.
Performance-based funding (PFB) is one potential alternative. In a PBF system, funder goals and policy
objectives are defined according to a series of performance measures, and a degree of risk is
transferred to service providers by making at least a portion of their funding dependent on measured
performance.
In adopting PBF models, policymakers are generally motivated by a range of goals related to improving
program outcomes:
1. Innovation: stimulating innovation and a shift away from a compliance based focus to a more
flexible, results-oriented focus.
2. Program improvement: motivating service providers to improve upon their existing programs
and general performance.
3. Efficiency: channeling resources to the most effective service providers, thereby maximizing the
return on public investment.
4. Equity: serving clients based on need defined according to transparent criteria.
5. Accountability: holding program administrators and service providers responsible for their
performance, and ensuring nationally-defined government priorities and objectives are achieved.
Applying performance funding to Essential Skills:
State of knowledge review
Social Research and Demonstration Corporation 6
2.2 Key components of PBF systems
Despite recent increased interest in ‘pay for success’ schemes, performance-based funding has in fact,
been used by governments for several decades and has been applied to several policy areas, including
workforce employment and training and adult education in Canada, the US, the UK, and Australia. The
United States was the first to introduce explicit performance and outcome standards in its employment
and skills system and to connect these with financial incentives and penalties. PBF has also been used
widely in US adult education policy. In 1998, Australia introduced outcome-based funding incentives
over three Job Network contracting cycles (1997, 1999, and 2003). By the early 2000s, Australia had
become the only OECD country to fully privatize its employment assistance system, making a major
part of provider income dependent on securing job outcomes (Finn, 2011). In Section 2.3, we provide a
more detailed description of PBF models in adult education and training programs in British Columbia,
the US, UK, and Australia.
PBF schemes have also been implemented in other policy domains, including K-12 education, post-
secondary education, health and criminal justice. Since the 1990s, performance measures have played
an increasingly large role in primary and secondary educational systems in both the UK and the US
(Muriel & Smith, 2001). Similarly, since the 1980s use of performance indicators in post-secondary
education has multiplied across OECD nations, including Canada, the US, UK, Australia, Denmark, and
the Netherlands (Atkinson-Grosjean, Grosjean, Fisher, & Rubenson, 1999; Jongbloed & Vossensteyn,
2001; Klein, 2005; NTEU, 2004; OCUFA, 2006). Many OECD countries use PBF in healthcare for funding
primary care physicians, specialists, and hospitals (OECD, 2010). A more recent trend is the application
of PBF to criminal justice programs that aim to reduce re-offending. For example, a number of US states
have adopted PBF in an effort to reduce recidivism (Pew Center on the States, 2011). In the UK, one
example is the Peterborough Prison Pilot. In the pilot, private investors assume financial risk for
reducing re-offending through the purchase of “Social Impacts Bonds” (SIBs). The capital raised from
the sale of SIBs is used to finance the PBF scheme. Providers are paid for achieving performance targets
related to the main outcome target of reducing recidivism by at least 7.5 per cent. If this target is
achieved, the government pays investors their principal plus a return (Dicker, 2011).
Our scan of the various PBF models described above suggests that all PBF systems have three broad
components. The first component, system goals, includes a number of subcomponents that relate to the
program’s overall design such as: policy objectives; target populations; and outcomes and performance
indicators. The second component relates more specifically to the performance based incentive design
and includes a number of more technical subcomponents such as scale of risk, performance targets and
the extent to which targets may be adjusted to compensate for factors outside of the provider’s control.
The third component relates to the procurement model.
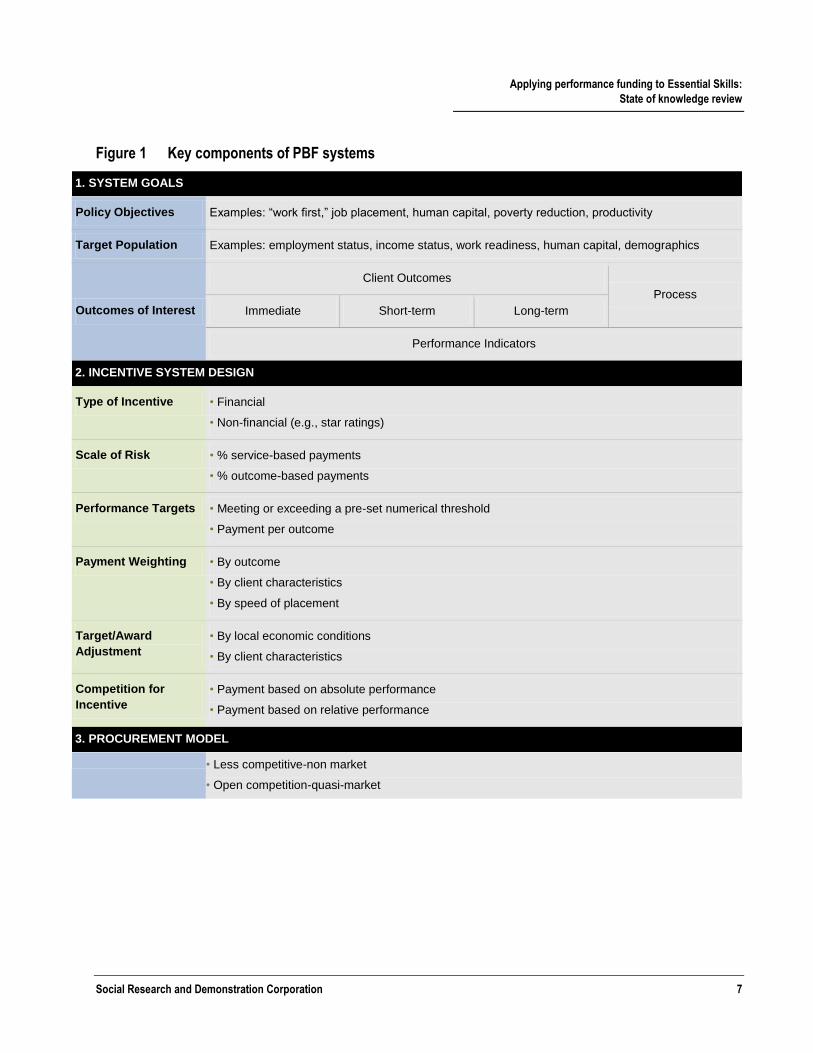
PBF conceptual map – Box 1 provides a brief description of these three components. Figure 1
illustrates how these components fit together in a PBF model. Together these two pieces provide a
high level conceptual map of components of a typical PBF model.
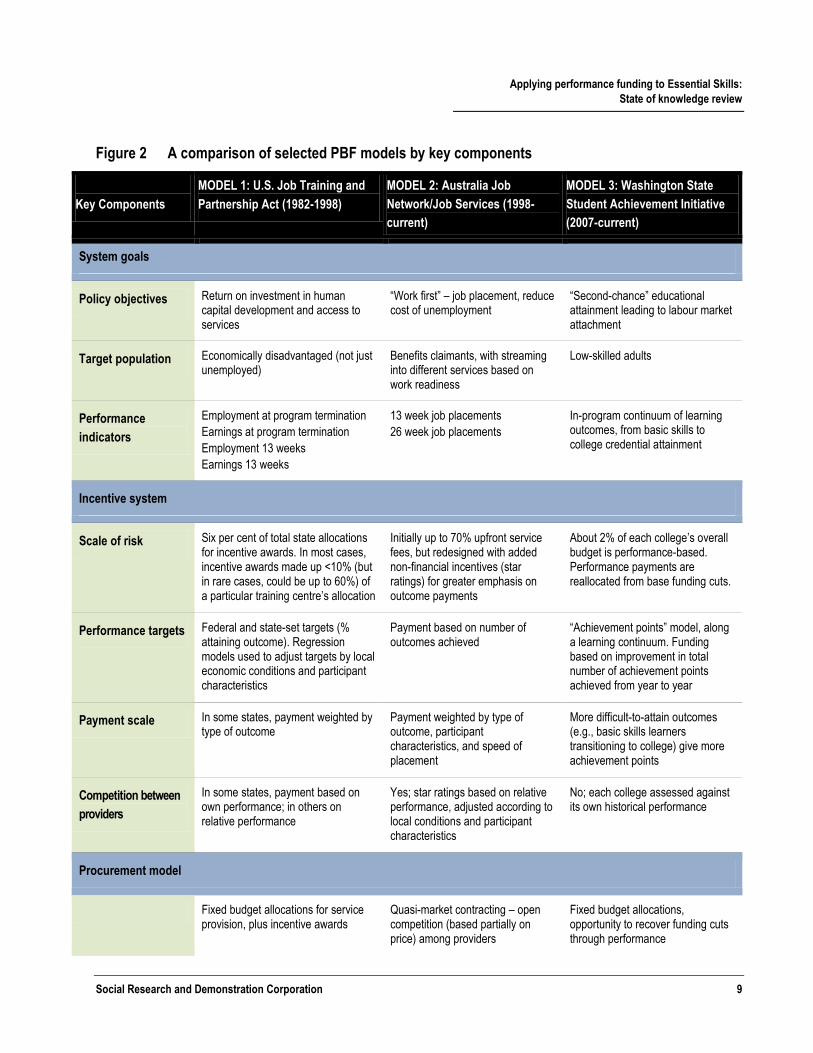
Comparison of actual PBF systems – Figure 2 compares three actual employment and training
programs that use performance based funding, according to the components outlined in Box 1 and
Figure 1.
Applying performance funding to Essential Skills:
State of knowledge review
Social Research and Demonstration Corporation 7
Figure 1 Key components of PBF systems
1. SYSTEM GOALS
Policy Objectives Examples: “work first,” job placement, human capital, poverty reduction, productivity
Target Population Examples: employment status, income status, work readiness, human capital, demographics
Outcomes of Interest
Client Outcomes
Process
Immediate Short-term Long-term
Performance Indicators
2. INCENTIVE SYSTEM DESIGN
Type of Incentive • Financial
• Non-financial (e.g., star ratings)
Scale of Risk • % service-based payments
• % outcome-based payments
Performance Targets • Meeting or exceeding a pre-set numerical threshold
• Payment per outcome
Payment Weighting • By outcome
• By client characteristics
• By speed of placement
Target/Award
Adjustment
• By local economic conditions
• By client characteristics
Competition for
Incentive
• Payment based on absolute performance
• Payment based on relative performance
3. PROCUREMENT MODEL
• Less competitive-non market
• Open competition-quasi-market

Applying performance funding to Essential Skills:
State of knowledge review
Social Research and Demonstration Corporation 8
Box 1 Description of PBF key components
System goals
Policy objectives refer to what the policy or program in question aims to achieve. Examples of various types of policy
objectives for workforce training include “work first” (rapid transition to employment), human capital development,
poverty reduction, and enhancing productivity. It should be noted that even PBF systems that address the same policy
issue may differ significantly in terms of objectives. For instance, in the US the original policy objective of performance-
funded employment and training programs was to develop human capital, while in Australia the objective was to
encourage “work first” and reduce the public costs of unemployment. These differences may have substantial impact
on the design of the system.
Target population refers to who the policy or program is intended to serve. Again note that even PBF systems that
address the same policy issue may differ significantly in terms of target population. For example, employment and
training programs in the US have targeted the economically disadvantaged regardless of employment status, while in
Australia the target population has been benefits claimants.
Outcomes are desired changes that are expected to result from the program outputs. Performance indicators are
usually proxy measures for desired outcomes. For instance, in the US, employment status and earnings measured at
program termination and again at 13 weeks after termination have been used as performance indicators to represent
the labour market attachment of program participants.
Design of incentive system
Incentive systems can use financial and/or non-financial incentives. Though monetary payments are typically used,
in some cases incentives may be non-financial such as public recognition, the use of star ratings, or other indicators of
program quality that may affect the reputation of the organization.
Scale of risk refers to the proportion of funding that is based on performance or outcomes attained rather than services
provided.
Performance targets refer to the targets that agencies aim to reach. Payment may be awarded for meeting
thresholds (e.g., at least 70% of participants attain employment) and/or for each client outcome achieved (e.g., $X for
each client that attains employment).
Payment scales may be applied to prioritize certain types of outcomes. For instance, a funder may offer higher
payments for outcomes achieved with harder-to-serve clients. In some cases, payments may be made for meeting
targets; in others, payments may vary depending on the degree to which a particular performance target is exceeded.
Adjustments may be applied to targets and/or awards to account for conditions over which the provider has no
control – e.g., regional unemployment rate, poverty rate, or characteristics of clients served.
Level of competition among providers may also vary across models. For example, incentive payments and/or non-
financial awards/ratings may be based on an agency’s own performance, or on relative performance.
Procurement model
The procurement model refers to the way in which provider services are contracted. For example, some
procurement processes may be highly competitive, based on price and quality of a bid. Others may focus on
allocating fixed budgets to designated local providers, with the possibility of bonus payments.
Applying performance funding to Essential Skills:
State of knowledge review
Social Research and Demonstration Corporation 9
Figure 2 A comparison of selected PBF models by key components
Key Components
MODEL 1: U.S. Job Training and
Partnership Act (1982-1998)
MODEL 2: Australia Job
Network/Job Services (1998-
current)
MODEL 3: Washington State
Student Achievement Initiative
(2007-current)
System goals
Policy objectives Return on investment in human capital development and access to services
“Work first” – job placement, reduce cost of unemployment
“Second-chance” educational attainment leading to labour market attachment
Target population Economically disadvantaged (not just unemployed)
Benefits claimants, with streaming into different services based on work readiness
Low-skilled adults
Performance
indicators
Employment at program termination
Earnings at program termination
Employment 13 weeks
Earnings 13 weeks
13 week job placements
26 week job placements
In-program continuum of learning outcomes, from basic skills to college credential attainment
Incentive system
Scale of risk Six per cent of total state allocations for incentive awards. In most cases, incentive awards made up <10% (but in rare cases, could be up to 60%) of a particular training centre’s allocation
Initially up to 70% upfront service fees, but redesigned with added non-financial incentives (star ratings) for greater emphasis on outcome payments
About 2% of each college’s overall budget is performance-based. Performance payments are reallocated from base funding cuts.
Performance targets Federal and state-set targets (% attaining outcome). Regression models used to adjust targets by local economic conditions and participant characteristics
Payment based on number of outcomes achieved
“Achievement points” model, along a learning continuum. Funding based on improvement in total number of achievement points achieved from year to year
Payment scale In some states, payment weighted by type of outcome
Payment weighted by type of outcome, participant characteristics, and speed of placement
More difficult-to-attain outcomes (e.g., basic skills learners transitioning to college) give more achievement points
Competition between
providers
In some states, payment based on own performance; in others on relative performance
Yes; star ratings based on relative performance, adjusted according to local conditions and participant characteristics
No; each college assessed against its own historical performance
Procurement model
Fixed budget allocations for service provision, plus incentive awards
Quasi-market contracting – open competition (based partially on price) among providers
Fixed budget allocations, opportunity to recover funding cuts through performance

Applying performance funding to Essential Skills:
State of knowledge review
Social Research and Demonstration Corporation 10
2.3 PBF in employment and training programs
In this section, we take a closer look at PBF models that have been used in employment and training
programs in BC, the United States, Australia, and the United Kingdom.
Employment Program of British Columbia
In April 2012, BC’s Ministry of Social Development launched the new Employment Program of British
Columbia (EPBC). This program rolls ten existing provincially and federally funded employment
programs into one integrated service model. EPBC services will be delivered through Employment
Services Centres located in 73 geographic catchment areas spanning the province. The Ministry of
Social Development has procured a contractor to deliver program services in each catchment area.
Contractors must ensure equitable access to the program by all job seekers, effective delivery of all
program services, and the tailoring of program delivery to meet the specific needs of all job seekers,
including those from “specialized populations” in their catchment area. Contractors use consortiums,
partnerships, or other arrangements with community organizations to offer the range of services
required.
The EPBC is being introduced with an extensive performance management system to enable the
Ministry to assess and adjust the program to ensure it achieves its objectives. Services fall into
two categories: general and supplemental services. General services include self-serve services, case
management and case managed services, and are required to be provided at the storefront. General
services to specialized populations may be provided through alternative service delivery channels to
accommodate their access to program services. Supplemental services are training, self-employment
services, and specialized assessments. These services may be delivered at the storefront or through
other service providers or institutions at other locations. The contractor may have partnership
arrangements with other service providers or may purchase services on behalf of the client to deliver
the suite of program supplemental services.
The program will use a mixed payment structure to balance client outcomes, service provider business
sustainability and Ministry accountability requirements. Payments will include:
Fixed operating fee – Will be paid monthly to compensate for operating costs required to keep the
Employment Services Centres open and available to serve clients (e.g., rent, utilities, equipment,
staff costs).
Variable service fee – Will be paid monthly to compensate for case management and case
managed services provided to clients by the contractor.
Financial supports and purchased services – Will be paid monthly to reimburse for financial
supports provided to clients to support program participation; and to reimburse for client services
purchased from independent third parties (e.g., job search, job start, short term training certificate,
specialized assessments)
Outcome fee – will be paid to contractors for clients that achieve sustained employment. The rates
will be set based on how quickly clients achieve labour market attachment, and will be paid
monthly, 13 months after outcomes are achieved.
Applying performance funding to Essential Skills:
State of knowledge review
Social Research and Demonstration Corporation 11
Job Training Partnership Act and Workforce Investment Act (US)
System goals
US employment and training programs were among the first to incorporate outcome-based
performance standards into their funding formulas, beginning in 1982 with the Job Training
Partnership Act (JTPA), and continuing with some operational changes in 2000 with the Workforce
Investment Act (WIA) (Courty, Heinrich, Marschke, & Smith, 2011).
The JTPA had formally stated equity and efficiency goals – that is, it explicitly sought to provide
appropriate levels of service to participants with a wide range of characteristics, and better labour
market outcomes than could have attained without the program. There was also an implicit goal of
poverty reduction, since eligibility criteria were based on economic disadvantage rather than
employment status. JTPA objectives focused on the development of labour-market specific human
capital with the hope that this would lead to better, more sustained employment, higher wages, and
reduced benefit dependency.
Against the backdrop of these broadly defined federal objectives, there was considerable variability in
program operation at the state level, and within states at the level of local service delivery areas. For
example, though programs were broadly targeted at the economically disadvantaged, funding levels
were only sufficient to provide services to a very small percentage of those who were nominally eligible
– thus, states and job training centers had considerable leeway in developing additional selection
criteria within the broad eligibility guidelines.
In general, a broad range of services were eligible for funding, from low-cost, largely self-directed
activities such as job search assistance to more intensive activities such as classroom and on-the-job
training. Under the largest of JTPA’s four programs (Title IIA), six categories of services were provided:
classroom training in occupational skills, subsidized on-the-job training, job search assistance,
basic/remedial education, temporary work experience in entry-level jobs, and other services (including
assessment, career exploration, and job-readiness training).
Early performance indicators included employment rate and earnings upon program completion, but
these were later shifted to focus on employment and earnings 13 weeks after program completion.
Employment and earnings indicators were measured separately for all enrollees and for the subset of
welfare-receiving enrollees.
Though the WIA continues to offer the same range of services as its predecessor JTPA, it has refocused
the bulk of its service provision away from training toward activities such as assessment and job search
support. These lower-cost activities are offered to a broader target population, with access to more
intensive services reserved for those who have been unable to attain employment through more basic
services. These changes reflect a shift in goals away from human capital development and toward
helping clients obtain employment in the shortest time possible. The less targeted approach of WIA
means serving a population with a more varied range of needs, with the result that matching clients
with appropriate types and levels of services is often challenging. Under WIA, the follow-up period for
the measurement of employment and earnings indicators has been extended to 26 weeks, and
Applying performance funding to Essential Skills:
State of knowledge review
Social Research and Demonstration Corporation 12
customer satisfaction indicators have been added for both participants and employers (Courty,
Heinrich, Marschke, & Smith, 2011).
Incentive system design
About 6-7 per cent of JTPA funding was intended to be performance based. Different states then decided how to distribute these funds among different categories of expenditure, the largest of which was awards for high performing training centers – some states however allocated a significant proportion (up to 25 per cent) to technical assistance for unsuccessful centers (Courty & Marschke, 2011).
States rewarded training centres based on whether their level of achievement met or exceeded a series of performance standards. Performance standards were based on averages rather than aggregate outcomes – e.g., the proportion, rather than the number, of unemployed participants who became employed after completing the program. Under JTPA, performance standards were usually established by taking a national standard set by the Department of Labor (DOL), then adjusting it according to a DOL regression
model that took into account local labour market conditions and program participant characteristics. For example, the regression adjustment ensured that employment and earnings targets were lower for welfare recipients than for enrollees who were not receiving welfare. In this way, service providers were not sanctioned for failing to meet performance standards because of factors outside of their control, such as a high local unemployment rate or a highly disadvantaged clientele. States had the option of developing their own adjustment procedures, but most chose to use the DOL regression model to set performance targets (Courty & Marschke, 2011).
States varied widely in the criteria used to determine eligibility for awards. For example, some states required all standards to be met while others required a subset of standards to be met, or simply paid for each standard that was met. Though in most cases, a training centre's award depended only on its own performance, some states encouraged competition between service providers. For example, the size of a particular provider's award sometimes depended on the number of other providers that qualified for an award – the fewer that qualified, the greater the allocation to successful ones. Despite the considerable variation in award qualification criteria and payment scale, for most training centres, incentive awards constituted a relatively small percentage of their operating budget – usually between 3 per cent and 9 per cent, though in some rare cases it could be in excess of 50 per cent (Courty & Marschke, 2011).
As in JTPA, WIA centres are rewarded for exceeding performance standards. However, performance targets are no longer set using a regression approach, but are instead negotiated between states, the DOL, and local delivery areas. In most cases, negotiations are informed by historical performance data,
adjusted to current conditions (Courty, Heinrich, Marschke, & Smith, 2011). In addition a state's incentive allocation is no longer fixed but instead depends on the aggregated performance of its various training centers. Only states that exceed performance standards associated with all performance indicators qualify for an incentive allocation (Courty & Marschke, 2003).

Applying performance funding to Essential Skills:
State of knowledge review
Social Research and Demonstration Corporation 13
Procurement model
Federal funding is allocated to states in proportion to various measures of economic need, such as size
of the economically disadvantaged or unemployed population. There are about 600 jurisdictions, each
with a geographic monopoly on local service provision. Service provision is directed and supervised at
the local level by a board of representatives from business, labour, community organizations, and
elected officials. These boards – known as Private Industry Councils under JTPA and Workforce
Investment Boards under WIA – determine the target population, the types of services provided, and
who should provide the services (Courty, Heinrich, Marschke, & Smith, 2011).
Adult Education (US)
System goals
In 1998, the Adult Education and Family Literacy Act (AEFLA), Title II of the Workforce Investment Act
(1998), was introduced. This Act authorized the Department of Education’s Office of Vocational and
Adult Education to establish an Adult Education Basic Grants program, which provides grants for states
to administer adult education programs. The amount each state receives is based on a formula
established by Congress. All states are required to provide a match for state funding, and have the
discretion to invest additional funds. States, in turn, distribute funds to local eligible entities to provide
adult education and literacy services.
The broad policy goal of the grant program is to “help American adults get the basic skills they need to
be productive workers, family members, and citizens” (Office of Vocational and Adult Education, 2012).
The policy objectives are threefold: assist adults to become literate and obtain the knowledge and skills
necessary for employment and self-sufficiency; assist parents to obtain the skills necessary to be full
partners in their children’s educational development; and assist adults in the completion of secondary
school education (Office of Vocational and Adult Education, 2011). The major areas of support are Adult
Basic Education, Adult Secondary Education, and English Language Acquisition, which emphasize basic
skills such as reading, writing, math, English language competency, and problem-solving. Grants are
provided for programs that serve adults and out-of-school youths age 16 and older who are not
enrolled or required to be enrolled in secondary school under state law.
In 1999, the US government implemented the National Reporting System (NRS), an outcome-based
reporting system that both the federal government and states use for monitoring purposes, and which
includes performance on measures of learning as well as on entering or retaining employment, and
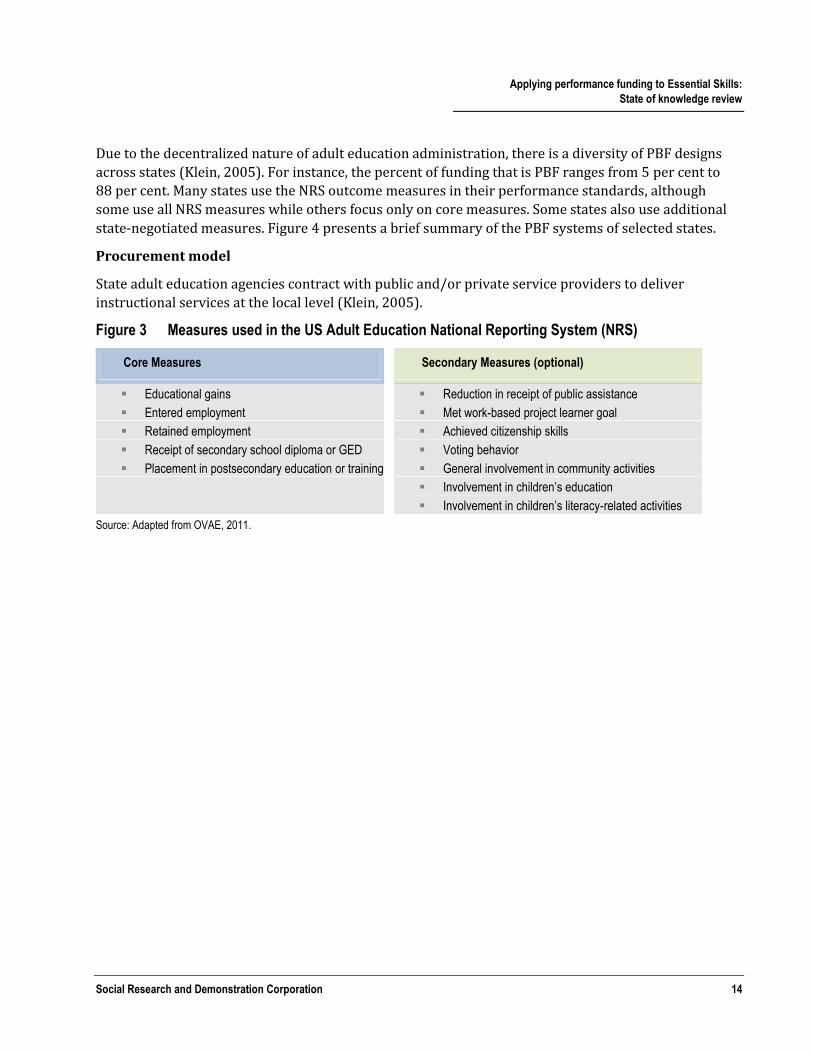
moving on to further postsecondary education or training (See Figure 3 for a complete list of outcome
measures collected by the NRS). Under the AEFLA, the Department of Education must reach agreement
with each state and outlying area on target levels of core performance measures in the NRS for adult
education programs.
Design of incentive system
Although states must report to the federal government on outcomes via the NRS, it is states that have
the discretion to implement and design PBF systems, including the proportion of funding that is based
on performance and which outcomes to include and emphasize in their performance standards.
Applying performance funding to Essential Skills:
State of knowledge review
Social Research and Demonstration Corporation 14
Due to the decentralized nature of adult education administration, there is a diversity of PBF designs
across states (Klein, 2005). For instance, the percent of funding that is PBF ranges from 5 per cent to
88 per cent. Many states use the NRS outcome measures in their performance standards, although
some use all NRS measures while others focus only on core measures. Some states also use additional
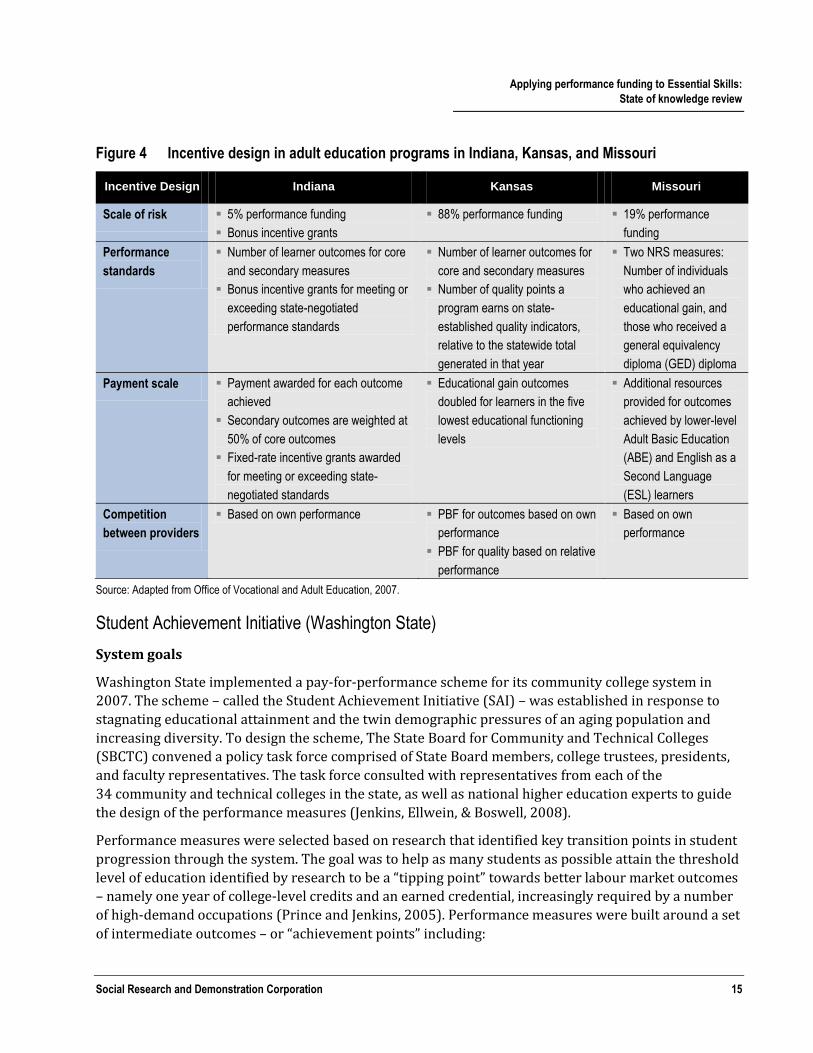
state-negotiated measures. Figure 4 presents a brief summary of the PBF systems of selected states.
Procurement model
State adult education agencies contract with public and/or private service providers to deliver
instructional services at the local level (Klein, 2005).
Figure 3 Measures used in the US Adult Education National Reporting System (NRS)
Core Measures Secondary Measures (optional)
Educational gains Reduction in receipt of public assistance
Entered employment Met work-based project learner goal
Retained employment Achieved citizenship skills
Receipt of secondary school diploma or GED Voting behavior
Placement in postsecondary education or training General involvement in community activities
Involvement in children’s education
Involvement in children’s literacy-related activities
Source: Adapted from OVAE, 2011.
Applying performance funding to Essential Skills:
State of knowledge review
Social Research and Demonstration Corporation 15
Figure 4 Incentive design in adult education programs in Indiana, Kansas, and Missouri
Incentive Design Indiana Kansas Missouri
Scale of risk 5% performance funding
Bonus incentive grants
88% performance funding 19% performance
funding
Performance
standards
Number of learner outcomes for core
and secondary measures
Bonus incentive grants for meeting or
exceeding state-negotiated
performance standards
Number of learner outcomes for
core and secondary measures
Number of quality points a
program earns on state-
established quality indicators,
relative to the statewide total
generated in that year
Two NRS measures:
Number of individuals
who achieved an
educational gain, and
those who received a
general equivalency
diploma (GED) diploma
Payment scale Payment awarded for each outcome
achieved
Secondary outcomes are weighted at
50% of core outcomes
Fixed-rate incentive grants awarded
for meeting or exceeding state-
negotiated standards
Educational gain outcomes
doubled for learners in the five
lowest educational functioning
levels
Additional resources
provided for outcomes
achieved by lower-level
Adult Basic Education
(ABE) and English as a
Second Language
(ESL) learners
Competition
between providers
Based on own performance PBF for outcomes based on own
performance
PBF for quality based on relative
performance
Based on own
performance
Source: Adapted from Office of Vocational and Adult Education, 2007.
Student Achievement Initiative (Washington State)
System goals
Washington State implemented a pay-for-performance scheme for its community college system in
2007. The scheme – called the Student Achievement Initiative (SAI) – was established in response to
stagnating educational attainment and the twin demographic pressures of an aging population and
increasing diversity. To design the scheme, The State Board for Community and Technical Colleges
(SBCTC) convened a policy task force comprised of State Board members, college trustees, presidents,
and faculty representatives. The task force consulted with representatives from each of the
34 community and technical colleges in the state, as well as national higher education experts to guide
the design of the performance measures (Jenkins, Ellwein, & Boswell, 2008).
Performance measures were selected based on research that identified key transition points in student
progression through the system. The goal was to help as many students as possible attain the threshold
level of education identified by research to be a “tipping point” towards better labour market outcomes
– namely one year of college-level credits and an earned credential, increasingly required by a number
of high-demand occupations (Prince and Jenkins, 2005). Performance measures were built around a set
of intermediate outcomes – or “achievement points” including:

Applying performance funding to Essential Skills:
State of knowledge review
Social Research and Demonstration Corporation 16
1. Gains in adult basic skill proficiency scores
2. Gains in pre-college remedial English and Math levels (developmental education)
3. Earning 15 college-level credits (the equivalent of three courses)
4. Earning 30 college-level credits
5. Completing a college-level Math course
6. Once a solid first-year base is established (with points 3, 4, and 5), the next level of achievement
recognized is completion of a certificate, degree, or apprenticeship.
The intermediate outcomes are a means of moving students towards greater educational attainment.
The overarching concept is one of a career pathway, with on and off ramps and throughputs, so that
students can exit – for example, when they need to work – but also get back on when they are ready and
have their on-the-job experience credited so they do not have to repeat what they have already done.
The major challenge with the pathway approach has proven to be getting students to progress from the
first two remedial achievement points into college-level programming. However, a continuing emphasis
on transition has resulted in the development of promising programs such as Integrated Basic
Education and Skills Training (I-BEST), in which a basic skills instructor and an occupational instructor
combine to teach courses in a wide range of occupations with integrated basic skills content. I-BEST
students receive college credit for the occupational component of the coursework, and they go on to
earn higher levels of educational attainment than other basic skills students. For example, in the first
years of the program's implementation, I-BEST students were more likely to earn college-level credits
and complete occupational certificates than other basic skills students with similar characteristics who
attempted occupational courses at colleges that didn't offer I-BEST (Zeidenberg, Cho, & Jenkins, 2010).
Incentive system design
The incentive system rewards institutions that move students through the critical achievement points
described above. The first performance year was 2008-09. The previous year was a "learning year"
during which colleges received seed funding to begin tracking their performance and developing
strategies to improve attainment in the various achievement point categories.
Though only about 2 per cent of each college's overall budget is performance-based, consultations
revealed that even this relatively small amount has a strong motivational impact. The performance
funds were initially intended to be new funding, based on the premise that new funds provide better
incentives, but that plan was derailed by the economic downturn. As a result, the budget for base
funding was cut and part of it was earmarked for performance, so that colleges could now recoup about
2 per cent through performance.
The SAI had three key features:
1. First, as mentioned above, the choice of performance measures was research-driven.
2. Second, rewarding a broad range of outcomes from skills gains to credential completion was
intended to focus attention on all students regardless of ability. Because relatively small gains in
skills and developmental education levels were rewarded, colleges had a greater opportunity to

Applying performance funding to Essential Skills:
State of knowledge review
Social Research and Demonstration Corporation 17
earn performance points in these categories than for actual college-level attainment. This is
currently under review, though, since it allows colleges to earn a relatively large percentage of their
performance funding by simply enrolling basic skills students who rarely progress to college-level
coursework.
3. Third, unlike some other models which base their standards on outcomes such as job placement
rates and earnings gains, the indicators chosen by the SAI task force were both more immediate and
more directly under the provider's control. The concurrent development of a unit-record database
(with student-level data) allowed colleges to track their performance in real time, identify areas for
improvement, and change their everyday practices in a timely fashion. Performance funding was
simply based on improvement in the total number of achievement points colleges accumulate from
year to year. There was no competition; each college was assessed against its own historical
performance.
The SAI model is being increasingly adopted by two-year colleges in other states, as well as by other
Washington state programs. For example, through a program called WorkFirst, the government
contracts with the SBCTC, which in turn awards grants to community and technical colleges as well as
community-based organizations and private career schools to provide education and training for
welfare recipients. Since 2010-11, the WorkFirst funding model has incorporated a performance
framework. WorkFirst uses SAI measures, but the scale of payment is different – for example, almost
four times as many performance points are awarded for I-BEST participation as for participation in
other basic skills or developmental education coursework. This reflects a perception that I-BEST is
especially effective for this target population. In addition, a full 20 per cent of funding is performance
based.
Procurement model
At the Governor’s direction, the SBCTC is currently exploring ways to move towards a competitive
performance-based contracting model.
Job Network (Australia)
System goals
Australia established the Job Network (JN) in 1998 as a new scheme for employment assistance,
featuring the privatization of services (which had been previously delivered by public sector agencies)
to a network of for-profit and non-profit organizations, and the introduction of outcome-based funding
incentives for providers. The main goals were to induce greater levels of flexibility, cost effectiveness,
and innovation through competition. The JN evolved through three distinct phases – each marked by a
different Employment Services Contract – before being reformed as Job Services Australia (JSA) in
2009.
In contrast to US programs and to its predecessor Working Nation, the policy objectives of the JN
focused on ‘work first’ and cost-cutting. Working Nation had placed an emphasis on skill development,
workplace and workforce training, wage subsidies to employers, and job creation. The JN, on the other
hand, emphasized decreasing inactivity among job seekers with short-term interventions culminating
in rapid job placement – an approach that was summarized succinctly by a former Minister for
Applying performance funding to Essential Skills:
State of knowledge review
Social Research and Demonstration Corporation 18
Employment Services as “hassle and help.” An underlying assumption of this approach was that human
capital development would be taken care of by the labour market after job placement (Fowkes, 2011).
Another feature of JN was mandatory participation for most benefits recipients. In the initial phases of
JN, job seekers were streamed into three levels of service provision: 1) Job matching – a basic service
referring the short-term unemployed to job vacancies; 2) Job search training – two weeks of intensive
job search training followed by job search assistance, for those unemployed for three to six months;
and 3) Intensive assistance – customized to individual needs for those who have been out of work for
an extended period (one year or more), or who are deemed at risk of long-term unemployment.
Job seekers generally accessed increasingly intensive levels of services as the length of their
unemployment spell increased. However, clients who upon referral were assessed to be especially
disadvantaged received immediate access to intensive assistance. The assessment instrument used
measured the job seeker’s relative labour market disadvantage based on responses to questionnaire
items about individual circumstances and other information known to influence job prospects.
The key outcomes of interest were job placement, and cost savings realized through more efficient
service provision and lower benefit payments. The assumption was that the performance-based system
would lead to more rapid placement into more sustained jobs. Performance indicators chosen as
proxies for sought-after outcomes were employment sustained for 13 weeks and 26 weeks for
disadvantaged job seekers, as well as cost per employment outcome.
In 2009, a change in government brought a new set of policy objectives, with more emphasis on human
capital development to address skill shortages. The new Job Services Australia (JSA) integrated JN
provision with several other programs that were formerly funded separately, thus broadening the
target client base significantly to include those with greater levels of disadvantage. Under JSA, job
seekers were categorized into four streams, with the most job ready referred to stream 1 and those
with severe barriers to stream 4 (Finn, 2011). In addition to more connection with the skills training
system, JSA objectives emphasized greater levels of direct contact between providers and employers
(employment brokering) to secure job placements for clients.
Incentive system design
Unlike the US system where providers received performance awards based on high average labour
market outcomes, Australia offered incentives on a piece rate, i.e., based on the number of persons who
attained pre-defined outcomes. Initially, JN providers received two kinds of payments – i) service fees,
for each client taken on by a provider, and ii) outcome payments upon achievement of various levels of
performance indicators, primarily job placement but also secondary outcomes such as completion of a
training course. The structure of payments has varied over time reflecting a desire to re-orient services
and payments around job outcomes, especially for the most disadvantaged job seekers.
The proportion of payments derived from outcomes rather than service fees determines the scale of
risk under which providers operate. In earlier rounds of the JN, providers collected most of their
revenue from non-outcome-based service fees (Saunders, 2008). However, in 2003 a new set of
payment scales was adopted that shifted the balance between service fees and outcome payments.

Applying performance funding to Essential Skills:
State of knowledge review
Social Research and Demonstration Corporation 19
Service fees were abolished for easier-to-place clients, and were reserved for those who needed
intensive assistance. Payments were weighted more towards achievement of high-priority outcomes.
In 2007, providers were paid $165-$385 per job placement (depending on duration of previous
unemployment), $550-$4400 per Intensive Assistance client placed in jobs lasting 13 weeks, with an
additional $825-$2200 for jobs lasting 26 weeks (Department of Employment and Workplace
Relations, 2007). In addition, smaller payments were made for secondary outcomes, such as placing
clients in education or training, or in part-time jobs that reduce the amount of welfare payments
received. A leading non-profit provider reported in 2006 that almost half of its revenue came from
placements and outcomes (Murray, 2006). Total JN expenditures for 2006-07 show that only 38 per
cent was spent on service fees, compared to 46 per cent on job outcome payments and placement fees
(Australian National Audit Office, 2008).
High-performing JN providers received not only higher levels of payment, but also non-financial,
reputational incentives in the form of star ratings. Star ratings were based on a mix of outcome rate and
speed of placement, adjusted by a regression formula that took into account factors that were out of the
provider’s control such as client characteristics and local labour market conditions. The ratings were
established as a means to help job seekers choose their provider, but in practice they were used most
by Department of Employment and Workplace Relations to assess provider quality as part of the
competitive bidding process. Providers with high star ratings often had their contracts renewed
without having to enter bids.
The incentive system was tweaked somewhat when the Job Network was replaced by Job Services
Australia (JSA) in 2009. The distinction between service fees and outcomes was maintained, as was the
emphasis on 13 and 26 week sustained employment outcomes and star ratings (though the method
used to calculate star ratings was modified). New incentives were created for provider-assisted and
provider-brokered job outcomes, where providers were paid more if they registered a job vacancy and
filled it from their caseload. In addition, incentives for training and skill upgrading were expanded, with
bonus payments for placing a client in a skills course that led to a job placement, especially for in-
demand occupations – also, when a participant was placed in approved training, the time spent training
was not counted in terms of how provider speed to job placement was rated (Finn, 2011).
Procurement model
Before the Job Network (JN) delivery model, employment services were the responsibility of the
government Commonwealth Employment Service (CES). By 1998, the new Coalition government had
instituted a privatized model of service delivery, the first such model in the OECD. This new model had
many market features including competitive tendering, performance rankings of providers, and
payments tied to outcomes. Under this new model, the Department of Employment and Workplace
Relations (DEWR) formed a partnership with a centralized statutory authority – Centrelink – to provide
a point of entry for job seekers before they were referred to JN providers (Saunders, 2008). The
provider network included for-profit and non-profit organizations, as well as the former public-sector
CES, which had been converted into a government-owned commercial agency called Employment
Nation. Centrelink’s role included determining the eligibility of job seekers for JN services, providing
information about JN services, registering job seekers for benefits, assessing their relative labour
Applying performance funding to Essential Skills:
State of knowledge review
Social Research and Demonstration Corporation 20
market disadvantage, referring them to JN providers, and administering their participation and
compliance requirements. All other “core” employment services including job matching, job search, and
intensive assistance were contracted out to JN providers, who were ultimately answerable to DEWR. JN
providers competed for referrals over three rounds of contracting – in 1998, 2000, and 2003. Price
competition was allowed for the first two rounds. By the third round, in response to the criticism that
this competition was compromising service quality, DEWR returned to fixed prices, with bidders
assessed on quality according to star ratings.
One of the most apparent trends over the three rounds of contracting was market concentration and
incumbency (Saunders, 2008). The number of bidders awarded contracts fell from 223 in the first
round to 168 in the second and 109 in the third. By 2003, the top ten providers had 55 per cent of the
market share, while the average share for providers outside the top ten was 0.5 per cent (Bruttel,
2003). Incumbency was introduced into the system in the third round, with 60 per cent of contracts
reserved for existing high performers from previous rounds and the remaining 40 per cent put out for
open competition (most of these contracts were also won by existing JN providers). A fourth round of
contract tendering was scheduled for 2006, but instead all providers with satisfactory star ratings had
their contracts extended.
Another trend was a shift from away from government service provision. In the first round,
Employment Nation (the former CES) won 37 per cent of the market share. However, by the second
round, the market share achieved by for-profits had increased from 33 per cent to 47 per cent, and non-
profits had increased their share from 30 per cent to 45 per cent – all at the expense of Employment
Nation whose share fell to 8 per cent (Saunders, 2008). By the third round, Employment Nation had
gone out of business.
A third major trend was greater prescription of provider service requirements (Finn, 2011; Fowkes,
2011). Initially JN providers were allowed to specialize, so that basic and intensive services were often
provided by different organizations. This was changed in 2003 when all providers were required to
offer all levels of service, and job seekers were able to access a continuum of services of increasing
intensity from the same provider for the duration of their unemployment spell.
The new Job Services Australia (JSA) model in 2009 introduced a new round of tendering which
focused on quality but gave relatively little weight to past performance (star ratings) and more weight
to harder-to-measure factors, resulting in significant disruption of existing contracting arrangements.
Many clients had to change providers, and even providers that retained their share of business often
had to decommission and re-commission sites (Finn, 2011).
Work Program (UK)
System goals
Welfare to work programs in the UK are designed and administered centrally by the Department for
Work and Pensions (DWP). Before 2011, the three main programs were Employment Zones, Pathways
to Work, and Flexible New Deal (FND). Jobseekers accessed different welfare to work schemes
depending on their type of benefit claim and where they lived. Recent reforms, referred to as “The

Applying performance funding to Essential Skills:
State of knowledge review
Social Research and Demonstration Corporation 21
Work Program,” were introduced in 2011 as the Coalition Government’s new employment support
program which replaced many of the previous New Deal and FND programs.
Employment Zones was rolled out in 2000. The scheme was initially intended for individuals aged
25 years and older who were claiming Job Seeker’s Allowance (a type of unemployment benefit which
requires jobseekers to actively seek work) for at least 18 of the previous 21 months, but was later
extended to include certain young jobseekers and some single parents (Bruttel, 2005). In 2005,
Pathways to Work, a program specifically for Incapacity Benefit claimants (people who cannot work
because they have an illness or disability) was also introduced. Employment Zones and Pathways to
Work ran simultaneously until 2009, when the government introduced the Flexible New Deal (FND).
The FND was designed to support individuals who had been claiming Jobseekers Allowance for
12 months or more into work and replaced most of the New Deal programs (Knight, 2010).
In 2011, the Work Program was introduced which significantly reformed welfare-to-work policy and
replaced many of the New Deal and FND programs (Cumming, 2011). While all of these programs have
the primary objective to move benefits claimants into work as quickly as possible, the new Work
Program aims to achieve greater job retention than previous programs. In addition, the program is
intended to “contribute to a decrease in numbers of workless households” (DWP, 2010). Moreover, in
contrast to previous UK welfare-to-work programs that have often been designed for specific groups,
the Work Program serves a wide range of jobseekers regardless of benefit type (Cumming, 2011).
Design of incentive system
Compared to previous programs, the new Work Program places a much higher scale of risk on
providers. As stated by the DWP (2011), “providers will be paid a small start fee for each new
participant in the early years of the contracts but this will be reduced each year and eliminated after
three years.” This is a drastic shift in light of previous designs, such as the Pathways to Work program
and Flexible New Deal, of which service fees represented 30 per cent and 40 per cent of total contract
funds, respectively (Cumming, 2011).
As with the Australian system, providers receive higher payments for clients with multiple barriers.
Providers also receive payments for achieving retention goals. After achieving a job outcome, providers
can claim sustainment payments every four weeks when a participant stays in work longer. These
payments can be claimed for up to one year, eighteen months or two years, depending on how far
removed the participant was from the labour market.
Service providers are also required to meet minimum performance levels for each participant group.
Providers are required to deliver results at least 10 per cent higher than a pre-determined ‘non-
intervention level,’ i.e., the job outcomes that would be expected for each of the main participant groups
if they had not joined the program. Additional incentive payments for high performance will be
available from the fourth year of the contracts (DWP, 2011).
Providers are judged based on their relative performance. To ensure fair grounds for comparison,
participants are randomly allocated to a provider in their area, to ensure that each provider has an
equal share of each group of participants (DWP, 2011). The key performance measure for providers in
the Work Program is the number of job outcomes as a percentage of the number of people who have
started on the program in the previous 12 months (DWP, 2011).
Applying performance funding to Essential Skills:
State of knowledge review
Social Research and Demonstration Corporation 22
Compared to previous UK welfare-to-work programs, the Work Program aims to give providers greater
flexibility to design programs. Previous programs specified in varying levels of detail the services that
providers had to deliver. For instance, Employment Zones required providers to complete specific
processes, such as writing a personal, costed ‘action plan’ and completing a ‘better-off in work’ calculation
(Bruttel, 2005). While the FND intended to give providers more freedom to deliver the services they
believed would be most effective, providers still had to complete certain process requirements such as
developing an ‘action plan’ of mandatory activities for jobseekers including a minimum of four weeks full-
time work-related activity (Vegeris et al., 2010). Instead, the Work Program is taking a ‘black box’
commissioning approach by providing freedom for providers to personalize support for the individual in
a way that fits the local labour market (DWP, 2011).
Procurement model
With the introduction of the Employment Zones program in 2000, a single provider model was
replaced with a competitive multi-provider model in which multiple providers in a zone would
compete for service contracts. In 2009, when the FND replaced most of the New Deal programs, there
was a reversion back to a less competitive model. Under the FND program, which was rolled out in
14 contract areas, ten areas had two prime contractors deliver services in competition, while in the
other four areas there was a single primary provider (House of Commons Work and Pensions
Committee, 2009). Under the Work Program, a range of private, public and voluntary sector
organizations compete for contracts. The successful providers for the 2011 fiscal year had to be on a list
of approved service providers, which was developed based on a framework used to identify the
providers that had demonstrated in the past the financial and organizational capacity to deliver large
scale, long-term, outcome-funded contracts. Providers from the list were then selected based on
detailed bids.

Applying performance funding to Essential Skills:
State of knowledge review
Social Research and Demonstration Corporation 23
3. Does PBF improve programs?
The promise of performance-based funding is that it will improve the efficiency and effectiveness of
service provision by conveying clear, measurable objectives, aligning funder and provider goals,
reducing costs and fostering innovation. However, it is well known that PBF can affect provider
behaviour in unexpected ways, potentially undermining performance and participant outcomes. In this
section we examine some of the empirically documented effects of PBF on provider behaviour and
participant outcomes, in the context of employment and training programs. Following the literature,
our review focused on three key questions:
1. How does PBF change provider behaviour, and what effects does this have on:
a) The type of person enrolled – Do PBF incentives induce providers to preferentially enroll clients who are
likely to have good outcomes with or without the program, making it easier for providers to meet performance
targets (‘cream skimming’)?
b) The type of services offered – Once clients are enrolled, do PBF incentives induce providers to focus higher
levels of services on those who are likely to be easier to place, while parking those who are less work ready
into more basic services?
c) Productivity – Do PBF incentives induce providers to devote greater effort to the achievement of outcomes?
d) Strategic behavior – Do PBF incentives induce providers to focus their energies on ways to influence
performance measures without changing actual performance (‘gaming’)?
2. Do PBF models add value? Are outcomes better than those that would have been attained without PBF?
3. Do performance indicators accurately reflect long-term program impacts and goals?
3.1 Effects of PBF on provider behaviour
Type of person enrolled (cream skimming)
When participation is voluntary – as it was with the U.S. JTPA/WIA programs – providers may have
considerable scope to selectively enroll people with a relatively narrow set of characteristics from the
broader eligible population. Incentives for provider cream skimming may be created more easily when
performance measures focus on levels – for example, whether or not participants become employed
post-program – rather than gains. Faced with a larger set of applicants than the program can
accommodate, decisions on who to enroll may focus on those who are closest to attaining the level that
would allow providers to meet the performance target, rather than those who may gain the most from
participating.
Applying performance funding to Essential Skills:
State of knowledge review
Social Research and Demonstration Corporation 24
Cream skimming behaviour has been investigated extensively in the context of JTPA/WIA (e.g., Barnow
& Smith, 2004; Courty, Kim, & Marschke, 2008; Heckman & Smith, 2011; Heckman, Heinrich, & Smith,
2011b). This literature focuses on two major questions:
Do providers respond to incentives for cream skimming by differentially enrolling those who are
closest to attaining good labour market outcomes, whether or not these outcomes result from the
program?
If cream skimming is occurring, what are its effects on program efficiency? Cream skimming may
actually lead to gains in efficiency if enrolment is differentially offered to those for whom the
program is likely to have the largest net impact. A loss in efficiency will only result if those who are
least likely to gain from the program are preferentially enrolled.
Do providers engage in cream skimming? Most of the early literature addressed this question by
comparing the characteristics of program participants with those of eligible non-participants. For
example, one analysis suggests that if eligible persons had participated in JTPA at random, the post-
program employment rate would have been 62 per cent rather than the observed value of 71 per cent
(Anderson, Burkhauser, & Raymond, 1993). The authors suggest that this provides evidence for cream
skimming. However, commentators later pointed out that this result could be at least partially
explained by self-selection that occurred prior to the application process. In other words, individuals
who were less work-ready may have been less aware of the program and/or less motivated to apply –
both of which were outside the providers' control.
When participants were compared with non-participants after application – i.e., those who were
enrolled vs. those who applied but were not accepted (a process over which providers had control) –
the difference between the groups was found to be much smaller (Heckman & Smith, 2011). In other
words, the evidence for cream skimming was weaker than initially thought, though still empirically
relevant.
There was also evidence of considerable heterogeneity across sites, with some providers engaging in
"negative" cream skimming, i.e., preferentially selecting for enrolment those whose characteristics
made them less work ready. Some attribute this behaviour to a strong intrinsic motivation to help the
hard-to-serve (Heckman, Smith, & Taber, 1996). However others note that providers may have had
conflicting incentives because performance standards under JTPA were subject to regression
adjustment based on participant characteristics such as educational attainment, welfare receipt, etc.
(Courty, Kim, & Marschke, 2008). For example, selecting more educated participants would have led to
more employment outcomes, but also tougher performance targets; on the other hand, favouring less
educated participants would have led to fewer employment outcomes, but also an easier standard to
meet in order to qualify for incentive awards. These kinds of conflicting incentives may have produced
the weak overall effect for positive cream skimming found by Heckman and Smith (2011).
The important influence the regression adjustment formula had on provider behaviour is confirmed in
two additional studies. First, the adjustment weights used to calculate performance targets were
changed from year to year as a result of changing labour market conditions. For example, an agency
that enrolled no high-school dropouts in 1992-93 would have had to achieve an employment rate
18 percentage points higher than one that enrolled only high-school dropouts, all other factors being
Applying performance funding to Essential Skills:
State of knowledge review
Social Research and Demonstration Corporation 25
equal. In 1998-99, the difference dropped to 7 percentage points (Courty, Kim, & Marschke, 2008).
Using data from 1993 to 1998, the authors found that increasing the adjustment factor for a particular
subgroup was associated with an increase in that subgroup's enrolment share, but also a decrease in
their employment rate. These results suggest that when the adjustment factor for a particular subgroup
was low, providers cream-skimmed within that subgroup – for example selectively enrolling only those
high-school dropouts with the best job prospects. When the adjustment factor increased, providers
increased overall enrollment from that subgroup, but in doing so enrolled more marginal participants
and reduced their overall performance outcomes (which may nevertheless have been sufficient to meet
the concurrently reduced performance targets). Thus, though the use of adjustment weights may have
balanced provider tendencies towards positive and negative cream skimming across subgroups,
providers also seemed to have the ability to selectively enroll the best candidates within subgroups.
Second, because adjustment weights were eliminated from performance targets under WIA, providers
now have stronger incentives to shift enrolment toward individuals who are more work ready. There is
anecdotal evidence that this is exactly what is happening (Barnow & Smith, 2004).
Evidence on the overall effects of cream skimming under JTPA reveals that it was largely efficiency
neutral – i.e., it neither improved program efficiency by inducing enrolment of those who benefitted the
most, nor did it decrease efficiency by inducing enrolment of those who benefitted the least (Barnow &
Smith, 2004; Heckman, Heinrich, & Smith, 2011b). The neutral effects of cream skimming on JTPA
program efficiency stem largely from the fact that: a) participants with a wide range of characteristics
benefited from the program, and b) participants who enjoyed long-term benefits were not necessarily
those who produced positive outcomes on the short-term indicators that were used to assess provider
performance. Cream skimming though may have compromised JTPA equity goals, to the extent that it
gave certain participants greater access to services that may have benefited others just as much.
Type of services offered (parking)
Though cream skimming program applicants is not an issue when participation is mandatory, as in
Australia, providers may still be induced to provide higher levels of service to some enrollees, while
"parking" others in more basic (and presumably less effective) services. The evidence for parking has
been less rigorously documented than that for cream skimming. Nevertheless, there is compelling
indirect evidence from Australia, where the Job Network (JN) system was redesigned several times in
response to perceived problems with parking (e.g., Productivity Commission, 2002).
The Job Network's initial incentive structure divided job seekers into different categories depending on
their work readiness, and adjusted the weight of the initial service fee in relation to the subsequent job
placement fee in order to induce providers to provide greater levels of service to the category of less
work ready participants. Nonetheless, the number of job seeker categories was sufficiently small (only
two in the second Job Network) to allow providers ample opportunity to select more job ready
participants within categories, and focus intensive services on them. Having fulfilled their minimum
requirements (and accepted service fees) for harder-to-place participants, providers often suspended
serious efforts to find work for these clients because they regarded the likelihood of success (and thus
of an outcome payment) as too low. Indeed, non-outcome dependent service fees comprised about
Applying performance funding to Essential Skills:
State of knowledge review
Social Research and Demonstration Corporation 26
70 per cent of provider income in the early stages of the JN. "Parked" participants who managed to get
jobs through their own efforts represented windfall gains for providers (Struyvent & Steurs, 2005).
Further adjustments attempted to minimize parking by providing greater rewards for placing the
harder to help into employment. Nonetheless problems remained. For example, if a provider failed to
place a client in employment within the first three months, it paid to minimize assistance until twelve
months had passed in order to qualify for higher level payments associated with long-term
unemployment (Murray, 2006).
Furthermore, heterogeneity in service provision within the long-term unemployed category actually
increased. In 2001, 35 per cent of job seekers in Intensive Support Customized Assistance – a service
category intended to provided tailored supports to the long-term unemployed – saw their case worker
once a week or more, but another 30 per cent saw them only once a month or less. By 2006, the group
who saw their caseworker once a month or less had increased to 48 per cent, while only 21 per cent
saw them once a week or more (Fowkes, 2011). It may be that making provider income more
dependent on outcome payments resulted in greater levels of risk aversion and an increased focus on
delivering “safe,” standardized services to a work-ready clientele.
The redesign of the classification system used to assess and categorize longer-term unemployed
participants resulted in the emergence of additional problems. Because clients taking employment
readiness surveys prior to referral often failed to reveal issues that would affect their classification,
providers were allowed to reclassify participants. This increased the level of support available for
misclassified individuals, but also meant potentially higher outcome fees and star ratings for providers
who inappropriately reclassified clients who didn't actually need intensive services. In 2007, several
providers were required to make repayments for inappropriate reclassifications, amounting in the case
of the Salvation Army to $9 million (Finn, 2008).
Productivity
There is very little evidence on how PBF may affect provider productivity. The broader economics
literature points to strong effects of pay-for-performance on individual output (Prendergast, 1999),
though it is unclear how well this generalizes to team performance where incentives are based on
additional budgetary allocations rather than individual compensation (Barnow & Smith, 2004).
In Australia, large gains in cost efficiency are often cited as an indicator of success for the performance-
based funding model established under the Job Network (JN). For example, a 2002 evaluation found
that cost per employment outcome was reduced from $8,000-$16,000 under previous programs to
$6500 in the first phase of JN, and $3500 by 2005 (Finn, 2011). It is important to note, however, that
the latter part of this decline was achieved through cuts in fees and outcome payments, which after
2003 were no longer indexed to inflation or provider costs. For example, from 2003 to 2006, the CPI
rose by 9 per cent and costs of delivery by 16.5 per cent, but fees and payments rose by only 2 per cent
(Murray, 2006).
The Job Network and its successor Job Services Australia have been characterized by critics as a high
volume – low margin business model fixated on achieving cost savings while at the same time making
service delivery increasingly prescriptive and job seeker activity requirements increasingly intensive.
Applying performance funding to Essential Skills:
State of knowledge review
Social Research and Demonstration Corporation 27
As a result, providers – who had to monitor job seeker compliance as well as deliver services – were
faced with increasingly large caseloads (usually more than 100 clients per caseworker) as well as
substantially greater administrative demands and increased transaction costs. The net result was
rationing and homogenization of services, so that instead of investing resources according to need
across a wide range of clients, providers focused their energy on picking winners, i.e., selecting
potentially lucrative clients with whom they would work more intensively (Fowkes, 2011).
Strategic behaviour (gaming)
Under some conditions, providers may have incentives to focus on achieving gains in performance
measures without actually improving performance. This is because this kind of ‘gaming’ behaviour may
yield additional funding at a very low cost to the provider. Note that cream skimming and parking are
sometimes thought of as forms of gaming, but in theory they could help to achieve greater program
efficiency by offering services to those who are most likely to benefit from them. Courty and Marschke
(2004) make a distinction between strategic behaviour that diverts resources from productive
activities and thus compromises program efficiency, and responses that simply reflect an accounting
phenomenon – they identify only the former as gaming.
In the U.S., there are multiple, rigorously documented examples of strategic manipulation of JTPA
regulations. For example, some providers were able to manipulate the regulations around participant
enrolment to their own advantage, by formally enrolling participants only after they had found a job
and not enrolling those who had received job search assistance but did not find employment (Barnow &
Smith, 2004). Since JTPA performance targets were based on program graduates, there was also
incentive to avoid officially graduating individuals who failed to find a job even after they had stopped
receiving services.
Systematic evidence of strategic timing of graduation decisions comes from an experimental study of
16 JTPA sites that compared long-term outcomes of participants with those of a randomly assigned
control group that didn’t have access to JTPA services (Courty & Marschke, 2004). The authors identify
two types of strategic behaviour. The first type exploited the fact that regulations allowed providers a
90 day window after training completion to report client employment status. The optimal strategy was
to graduate employed clients either on the last day of training or the first day of employment, and to
delay graduating those who had not found a job until the 90th day. Providers who followed this strategy
could be identified by longer average waiting times to graduation after training completion. As a result
of this behaviour, one of the principal JTPA performance indicators – overall employment rate at
graduation – was boosted by 11 percentage points. However, long-term client earnings impacts were
lower at training centers that strategically timed graduation decisions, suggesting that service quality
was compromised by this kind of behaviour (Courty & Marschke, 2004).
The second type of gaming behaviour occurred as the JTPA fiscal year came to a close each June.
Towards the end of each fiscal year, providers had to decide what to do with the pool of clients who
were still unemployed within the 90-day window after training completion. The optimal strategy
depended on how close the training center was to meeting the performance target for that year. If the
center had already exceeded the target – and there was no marginal reward for performance above the
targeted standard – the optimal strategy was to graduate unemployed participants from its inventory
Applying performance funding to Essential Skills:
State of knowledge review
Social Research and Demonstration Corporation 28
until the outcome for that year exactly met the required target. By doing so it would get the incentive
award while at the same time starting the next fiscal year with as small a pool of “underperforming”
clients as possible. The optimal strategy for a center which had not achieved the performance target by
the end of the fiscal year was to graduate its entire remaining inventory of unemployed participants on
the final day, thus maximizing its chances for the next fiscal year. There is evidence that training
centers behaved in precisely these ways. Furthermore, there is also evidence that these kinds of
strategic behaviour led to program inefficiencies. For example, training centers were more likely to
suddenly truncate training in June than in other months of the year. In addition, long-term earnings
impacts were lower for participants who graduated in June (Courty & Marschke, 2004).
3.2 Does PBF add value?
It has been difficult to separate the impact of performance funding per se from the impact of expanded
service packages that are often introduced along with PBF. For example, the federally commissioned
National JTPA Study was implemented in 16 local service delivery areas between 1987 and 1989,
randomly assigning about 20,000 applicants to either a treatment group (who were allowed immediate
access to JTPA services) or a control group (who could not access JTPA services for 18 months). The study
compared the employment, earnings, and welfare receipt of the two groups 18 and 30 months after
random assignment. Though the control group couldn’t access JTPA programs, they still had access to
existing services from local non-JTPA providers. The goal of the study was thus to estimate the impacts of
JTPA as an incremental source of services, since JTPA expenditures expanded services available in a given
service delivery area (Orr, Bloom, Bell, Doolittle, Lin, & Cave, 1996).
Findings generally showed modest but significant impacts on adult participants. For example, adult
women assigned to the treatment group had in the 30 month follow-up period earned on average
almost 10 per cent more than those assigned to the control group – in other words, almost 10 per cent
more than they would have earned without access to JTPA. Adult men earned just over 5 per cent more
than they would have earned without access to JTPA (Bloom, Orr, Bell, Cave, Doolittle, Lin, & Bos,
1997).
However it is difficult to estimate the extent to which these impacts were driven by the introduction of
PBF rather than simply by the extra services provided under JTPA. In other words, it is not clear what
the impact of extra services would have been if the performance standards had not been in place – thus
the value-added, incremental impact of linking service provision to performance standards is unknown.
In Australia, research has been constrained by lack of access to government-controlled data. The
measure that is most commonly used in government program evaluations is average cost per
employment outcome – that is, the total cost of all programs divided by the number of participants who
were in employment three months after leaving the program. This indicator fell sharply after
implementation of the first Job Network, and continued to decline with each subsequent contracting
round. The government attributed this decline to a combination of lower costs and better targeting,
however, doubts have been raised about some of these claims. For example, most jobs obtained by
participants were part-time and there was often a “carousel effect,” whereby many participants
returned to income support after a temporary period of short-term employment (Davidson, 2010). In
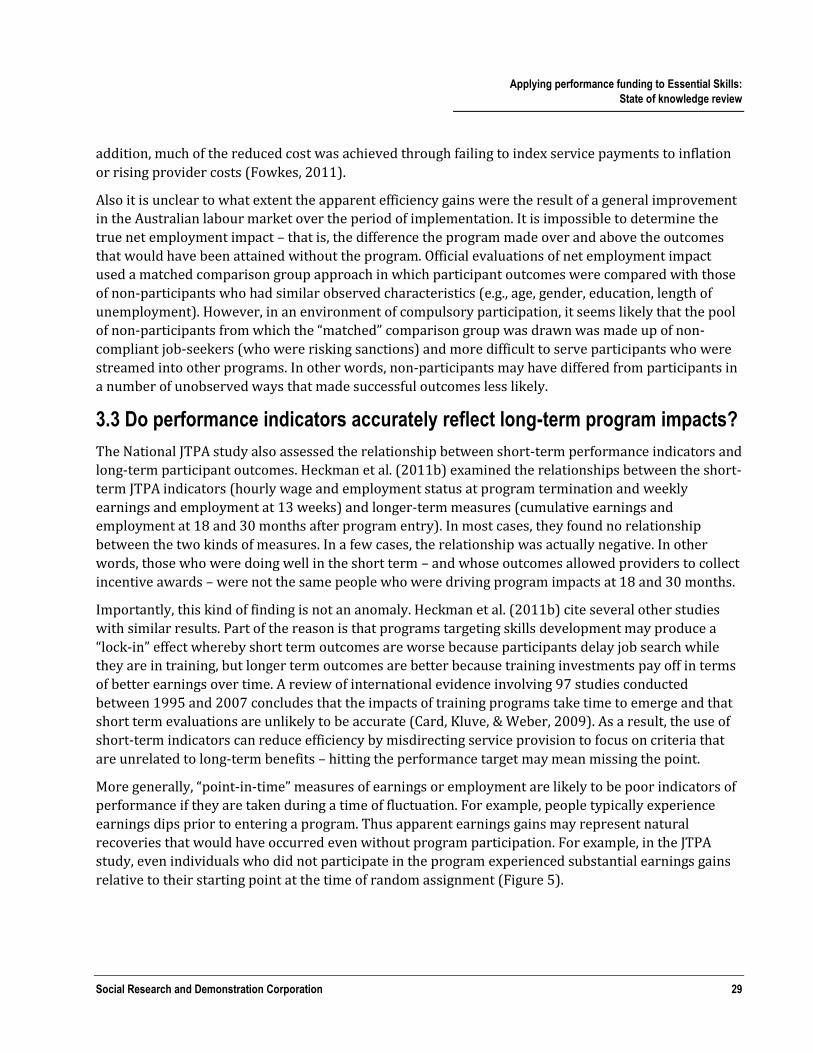
Applying performance funding to Essential Skills:
State of knowledge review
Social Research and Demonstration Corporation 29
addition, much of the reduced cost was achieved through failing to index service payments to inflation
or rising provider costs (Fowkes, 2011).
Also it is unclear to what extent the apparent efficiency gains were the result of a general improvement
in the Australian labour market over the period of implementation. It is impossible to determine the
true net employment impact – that is, the difference the program made over and above the outcomes
that would have been attained without the program. Official evaluations of net employment impact
used a matched comparison group approach in which participant outcomes were compared with those
of non-participants who had similar observed characteristics (e.g., age, gender, education, length of
unemployment). However, in an environment of compulsory participation, it seems likely that the pool
of non-participants from which the “matched” comparison group was drawn was made up of non-
compliant job-seekers (who were risking sanctions) and more difficult to serve participants who were
streamed into other programs. In other words, non-participants may have differed from participants in
a number of unobserved ways that made successful outcomes less likely.
3.3 Do performance indicators accurately reflect long-term program impacts?
The National JTPA study also assessed the relationship between short-term performance indicators and
long-term participant outcomes. Heckman et al. (2011b) examined the relationships between the short-
term JTPA indicators (hourly wage and employment status at program termination and weekly
earnings and employment at 13 weeks) and longer-term measures (cumulative earnings and
employment at 18 and 30 months after program entry). In most cases, they found no relationship
between the two kinds of measures. In a few cases, the relationship was actually negative. In other
words, those who were doing well in the short term – and whose outcomes allowed providers to collect
incentive awards – were not the same people who were driving program impacts at 18 and 30 months.
Importantly, this kind of finding is not an anomaly. Heckman et al. (2011b) cite several other studies
with similar results. Part of the reason is that programs targeting skills development may produce a
“lock-in” effect whereby short term outcomes are worse because participants delay job search while
they are in training, but longer term outcomes are better because training investments pay off in terms
of better earnings over time. A review of international evidence involving 97 studies conducted
between 1995 and 2007 concludes that the impacts of training programs take time to emerge and that
short term evaluations are unlikely to be accurate (Card, Kluve, & Weber, 2009). As a result, the use of
short-term indicators can reduce efficiency by misdirecting service provision to focus on criteria that
are unrelated to long-term benefits – hitting the performance target may mean missing the point.
More generally, “point-in-time” measures of earnings or employment are likely to be poor indicators of
performance if they are taken during a time of fluctuation. For example, people typically experience
earnings dips prior to entering a program. Thus apparent earnings gains may represent natural
recoveries that would have occurred even without program participation. For example, in the JTPA
study, even individuals who did not participate in the program experienced substantial earnings gains
relative to their starting point at the time of random assignment (Figure 5).
Applying performance funding to Essential Skills:
State of knowledge review
Social Research and Demonstration Corporation 30
Figure 5 Natural earnings fluctuations among JTPA control group members
Source: Orr, Bell, and Klerman (2009).
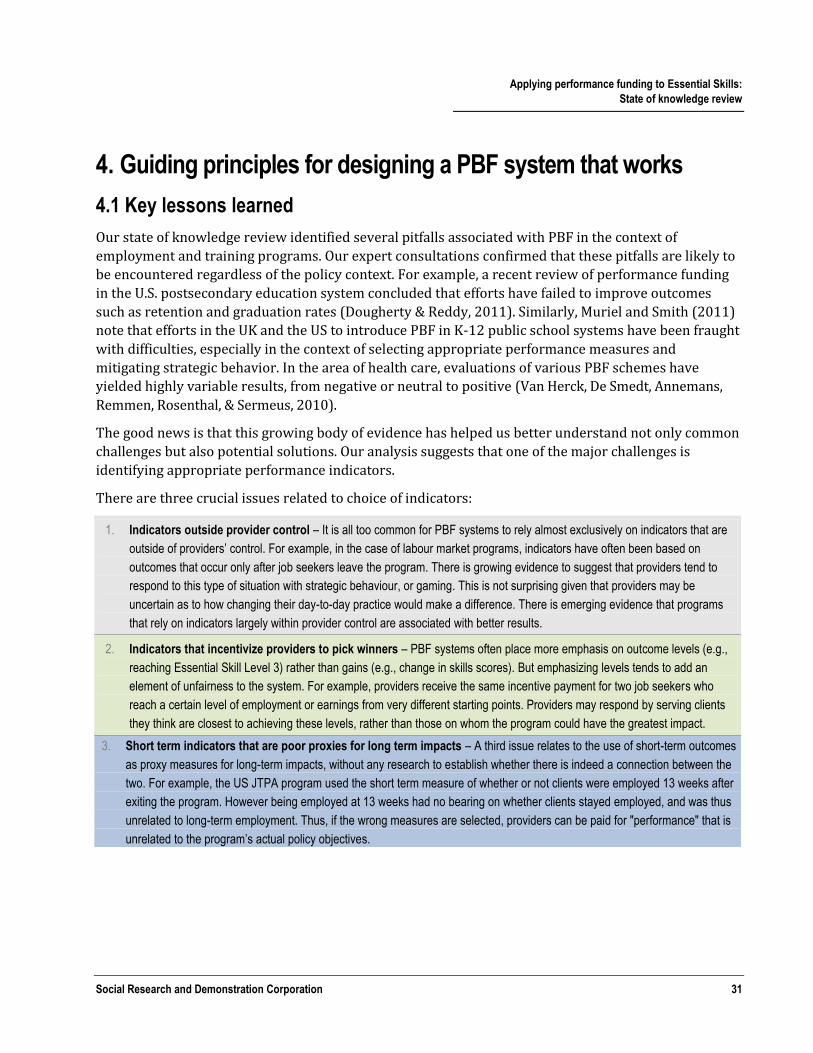
Applying performance funding to Essential Skills:
State of knowledge review
Social Research and Demonstration Corporation 31
4. Guiding principles for designing a PBF system that works
4.1 Key lessons learned
Our state of knowledge review identified several pitfalls associated with PBF in the context of
employment and training programs. Our expert consultations confirmed that these pitfalls are likely to
be encountered regardless of the policy context. For example, a recent review of performance funding
in the U.S. postsecondary education system concluded that efforts have failed to improve outcomes
such as retention and graduation rates (Dougherty & Reddy, 2011). Similarly, Muriel and Smith (2011)
note that efforts in the UK and the US to introduce PBF in K-12 public school systems have been fraught
with difficulties, especially in the context of selecting appropriate performance measures and
mitigating strategic behavior. In the area of health care, evaluations of various PBF schemes have
yielded highly variable results, from negative or neutral to positive (Van Herck, De Smedt, Annemans,
Remmen, Rosenthal, & Sermeus, 2010).
The good news is that this growing body of evidence has helped us better understand not only common
challenges but also potential solutions. Our analysis suggests that one of the major challenges is
identifying appropriate performance indicators.
There are three crucial issues related to choice of indicators:
1. Indicators outside provider control – It is all too common for PBF systems to rely almost exclusively on indicators that are
outside of providers’ control. For example, in the case of labour market programs, indicators have often been based on
outcomes that occur only after job seekers leave the program. There is growing evidence to suggest that providers tend to
respond to this type of situation with strategic behaviour, or gaming. This is not surprising given that providers may be
uncertain as to how changing their day-to-day practice would make a difference. There is emerging evidence that programs
that rely on indicators largely within provider control are associated with better results.
2. Indicators that incentivize providers to pick winners – PBF systems often place more emphasis on outcome levels (e.g.,
reaching Essential Skill Level 3) rather than gains (e.g., change in skills scores). But emphasizing levels tends to add an
element of unfairness to the system. For example, providers receive the same incentive payment for two job seekers who
reach a certain level of employment or earnings from very different starting points. Providers may respond by serving clients
they think are closest to achieving these levels, rather than those on whom the program could have the greatest impact.
3. Short term indicators that are poor proxies for long term impacts – A third issue relates to the use of short-term outcomes
as proxy measures for long-term impacts, without any research to establish whether there is indeed a connection between the
two. For example, the US JTPA program used the short term measure of whether or not clients were employed 13 weeks after
exiting the program. However being employed at 13 weeks had no bearing on whether clients stayed employed, and was thus
unrelated to long-term employment. Thus, if the wrong measures are selected, providers can be paid for "performance" that is
unrelated to the program’s actual policy objectives.

Applying performance funding to Essential Skills:
State of knowledge review
Social Research and Demonstration Corporation 32
4.2 Guiding principles for designing a PBF system that works
What follows is a set of ten guiding principles for addressing and overcoming these challenges for the
design of a performance funding framework. The general goal is to establish a context in which
providers are motivated and able to respond positively rather than strategically or with gaming
behavior. Box 2 provides a brief overview of these 10 principles.
Box 2 Guiding principles for designing a PBF model that works
1. Use in-program measures > Focus on in-program measurers that allow providers to track progress and understand
where and why clients succeed and where they falter.
2. Measure gains not levels > Use measures based on ‘gains’ that recognize progress regardless of the starting point,
rather than measures based on levels that recognize only the ending point and may lead to serving clients who are
already closest to the target.
3. Measure what counts > Avoid mission narrowing by ensuring that measures and incentives recognize the full range of
program objectives.
4. Identify key milestones > Identify intermediate milestones that can be used to track the progress of clients who may
enter at different points, with different levels of employment readiness.
5. Monitor system performance > Build a continuous learning process to respond to strategic behaviour.
6. ‘Right-size’ incentives > Ensure performance incentives are neither too big nor too small.
7. Encourage continuous improvement > Rather than setting targets, use an open-ended approach to encourage
continuous improvement.
8. Ensure all targeted clients are served > Link incentives with the intensity of effort required to attain client outcomes.
Thus, clients with more barriers are not a disadvantage.
9. Build provider capacity > Start with a ‘learning period’, in which providers are given technical assistance and
opportunities to build a community of practice with others facing similar challenges.
10. Link in-program measures to post-program impacts > Use longitudinal research to establish a connection between
in-program measures and post-program impacts.
1. Focus on in-program rather than post-program performance measures
There is emerging evidence that PBF systems that develop a set of in-program performance measures are
effective in terms of helping providers establish timely and meaningful connections between day-to-day
practice and performance. Focusing provider attention on these kinds of measures may encourage
innovation and improvement by allowing providers to track progress in a timely fashion, understand
where and why learners falter, and design interventions to help them progress through the obstacles.

Applying performance funding to Essential Skills:
State of knowledge review
Social Research and Demonstration Corporation 33
While it is more common to focus performance incentives on longer-term outcomes such as
employment and earnings, these outcomes are often largely beyond provider control. Thus holding
providers accountable for them may lead to perceptions of unfairness and shift focus away from day-to-
day practice towards strategic behaviour. Employment and/or earnings may be appropriate in-
program performance indicators under certain conditions, for example where services are explicitly
focused on job development, networking/negotiating with employers, and/or provision of subsidized
job placements.
2. Use measures based on gains, rather than point-in-time levels of attainment
Our review of the evidence suggests that in-program indicators should be based on individual client
gains rather than achievement of a particular level. Since a given client’s in-program outcomes are likely
to be heavily influenced by their baseline (pre-program) ability, measures that incorporate individual
gains from program entry to exit convey information about a provider’s potential impact on client
achievement, while also focusing provider attention on ways to improve outcomes. Focusing on gains
may avoid common pitfalls associated with models that rely on point-in-time measures.
Many PBF models rely on performance measures focused on levels attained by participants at a
particular point in time (for example, rates of graduation, employment, etc.). The downside of this
approach is these types of measures do not incorporate information about starting points and
magnitudes of improvement. Thus they may give providers incentive to shift their focus from assessing
how their own day-to-day performance can improve client outcomes to assessing learners in terms of
the outcome levels they are likely to attain at the time performance is evaluated (‘picking winners’). For
example, the most straightforward way for postsecondary institutions to improve graduation rates may
be to raise admission standards, rather than focus on improving service quality.
PBF models that focus on group gains rather than individual gains are also associated with pitfalls. For
example, teacher effectiveness has often been measured in terms of change in their class’s average
standardized test scores from one year to the next. However, such measures of group change may be
poor indicators of performance since they may vary according to group composition. For example, an
effective teacher may be penalized unjustly, if in a given year, they are assigned a cohort of students
who by chance happen to have lower abilities than previous cohorts.
3. Measure what counts
Providers often have multiple mission areas, designed to serve clients with a variety of different needs.
Thus, PBF systems should be sure to include measures that recognize this full range and not just areas
of low performance. While an implicit goal of performance funding is to boost areas in which providers
under-perform, while leaving high performance areas untouched, if performance measures are too
narrow, this goal may not be met. Performance funding may inadvertently lead to a kind of tunnel
vision or mission narrowing, as providers shift focus and resources to measures with higher levels of
reward and de-emphasize aspects with lower rewards (Dougherty & Reddy, 2011).
For low performance areas, monetary incentives may indeed kick-start productive behaviour, by
boosting intrinsic motivation to foster behavioural change. However, some behaviour is likely

Applying performance funding to Essential Skills:
State of knowledge review
Social Research and Demonstration Corporation 34
associated with high performance even in the absence of monetary incentives. For example, behaviour
may be guided by professional norms and/or intrinsic motivation. There is emerging evidence to
suggest that when significant effort is required to complete a task, monetary incentives may weaken or
'crowd out' signals associated with intrinsic motivation in favour of signals about how much (or, more
to the point, how little) the funder values that particular task in relation to other tasks (Gneezy, Meier,
& Rey-Biel, 2011). This finding provides a further rationale for ensuring that performance funding
recognizes the full range of provider mission areas.
4. Intermediate performance milestones along a continuum
Identifying key milestones along an employment or learning pathway allows providers to track
progress for a full range of clients who may enter the program with different levels of initial ability,
achievement and employment readiness. Milestones should not be based simply on the completion of
various kinds of services or activities, but rather on indicators of measurable improvement. Ideally,
these indicators should be selected on the basis of longitudinal research that identifies points at which
clients tend to stall or struggle, and ‘tipping points’ which when reached are associated with increased
likelihood of further success.
Focusing provider attention on these kinds of intermediate milestone outcomes may accelerate client
progress and ultimately increase the probability of reaching program exit points associated with labour
market gains. An example of an adult learning pathway with performance milestones is Washington
State’s Student Achievement Initiative (See Box 3).
5. Build in a continuous learning process to monitor and respond to strategic behaviour
One of the major findings of our literature review is that PBF schemes need to be vigilant for
unintended changes in provider behaviour. For example, test-based performance measures may give
rise to a variety of strategic responses designed to boost test scores – including: ‘teaching to the test;’
focusing on learners who are closer to attaining a performance threshold while neglecting those further
away; grade inflation or weakening of competency standards; and even replacing learners’ incorrect
answers with correct ones (Dougherty & Reddy, 2011; Muriel & Smith, 2011). In addition, performance
indicators based on pre-to-post intervention gains may be susceptible to strategic responses designed
to reduce pre-test scores – for example, by communicating to participants either implicitly or explicitly
that they are not expected to expend a great deal of effort in completing the pre-test.
Teaching to the test in particular may be a concern when Essential Skills gains are a key performance
measure. If there is a good match between carefully developed learning curricula and test items, then
teaching the curriculum will essentially be teaching to the test, in that it will produce test scores that
are a fair reflection of the knowledge and skills we want learners to acquire. However, teaching to the
test may be an issue if instruction focuses on repeated practice drills using the initial test, and the same
questions appear on the retest. In such cases, score improvements may not reflect gains in Essential
Skills, but rather familiarity with test items or even with answers to specific test items.
At this time standardized tests are only available for three of the nine Essential Skills, leaving the
possibility that instruction will be reallocated away from the other six – some of which employers may
value more. Thus, developing a broader set of measures that reflect other skills valued by employers
Applying performance funding to Essential Skills:
State of knowledge review
Social Research and Demonstration Corporation 35
should be a priority. In addition, emphasis should be placed on maintaining the integrity of the testing
process – for example, through third-party administration and scoring of tests, with standardized
reporting based on scores only rather than item by item answer keys; rotating in a certain proportion
of non-overlapping items each time the test is retaken; and limiting access to the entire bank of possible
test items.
6. Ensure performance incentives are neither too big nor too small
Stimulating innovation does not require a large proportion of provider budgets to be based on
performance. Evidence shows that innovative practices may develop even when a relatively small
percentage of funds are allocated to performance if other 'winning conditions' are in place. In fact, as
provider funding is made increasingly dependent on performance, there is a danger that focus may shift
away from innovation to risk management with providers reverting to the delivery of a safe, cheap
package of services to a relatively skilled, work-ready clientele, and 'picking winners' from among those
who require more intensive services. However, it is worth noting that in some cases performance funds
may be too small to finance the expansion of practices and tools that may lead to greater success.
Emerging evidence suggests that if the costs of implementing changes required to meet new
performance standards exceeds the cash value of the associated incentives, then the incentives may
simply be ignored (Shulock & Jenkins, 2011).
7. Encourage continuous improvement
To encourage progress on key outcomes, we recommend the use of an open-ended approach in which
performance payments are allotted according to the total number of intermediate milestones achieved.
While performance funding schemes often incorporate specific targets, these targets are often too
ambitious or not ambitious enough, either of which can lead to strategic behaviour. For example in
2002, the US No Child Left Behind Act mandated states to set challenging academic standards and
develop standardized tests to monitor student progress, with the goal that all students at each school
meet these standards within twelve years. States were required to set yearly goals tied to the
percentage of students meeting the standard, with the stipulation that this percentage rise each year.
Schools unable to meet targets were subject to sanctions. Many schools – especially those with a large
proportion of students from disadvantaged backgrounds – had little hope of meeting the target. Several
states responded by simply making tests easier (Ryan, 2004). Another issue was that schools that made
substantial gains but fell just short of the targets were treated no differently from those that made no
gains at all. Some schools responded to these circumstances by engaging in strategic behaviour such as
score inflation and even overt cheating (Georgia Governor’s Special Investigators, 2011; Muriel &
Smith, 2011). Strategic behaviour may also arise if targets are too easy to attain. For example, evidence
from the US JTPA program showed that once some providers met their targets for the year they
truncated further training activities, which may have had a negative impact on the outcomes of clients
who were still jobless (Courty & Marschke, 2004).
In some cases, targets put providers in competition with each other. The downside of this approach is
that it may penalize smaller providers who focus on a more disadvantaged clientele. It may also
discourage knowledge sharing and collaboration among providers. An alternative option is to instead

Applying performance funding to Essential Skills:
State of knowledge review
Social Research and Demonstration Corporation 36
base funding on a provider’s improvement relative to its own past performance. However, this may
incentivize providers to set their own, easy-to-beat performance targets, for example by
underperforming during a baseline data collection period or limiting year-to-year improvement in
order to give an easier target for the following year. In fact, setting performance targets based on year-
to-year improvement may punish high-performing providers who hit a performance ceiling relatively
quickly.
Instead, a better approach is to allot performance dollars according to the total number of milestones
achieved. This approach not only encourages continuous improvement it also facilitates the sharing of
expertise and the development of a collective knowledge base of best practices.
8. Ensure incentives motivate service to all target group members, including the least prepared
Completely equitable service provision may not always be possible or desirable since a particular set of
services may not be suitable or even beneficial for every type of potential client. However, most would
agree on the importance of equitable service provision for all clients who can potentially benefit from
it, regardless of initial ability or educational attainment. Indeed most PBF schemes make some effort to
‘level the playing field.’ The most common approach is to place clients in tiers according to employment
readiness, with incentives weighted by tier so that higher levels of payment are associated with harder-
to-serve clients. However, our review of the evidence suggests that tiering clients accurately is difficult
to achieve in practice and is often associated with strategic behaviour.
There is emerging evidence to suggest that a pathways approach that uses the same set of measures to
establish starting points and to track progress may be more effective at leveling the playing field.
Incentive payments would then depend on the magnitude of progress each client makes along the
pathway so that, for example, lower-skilled learners would pay out more than higher-skilled learners
for achieving the same level of outcome.
For example, Washington State’s Student Achievement Initiative awards achievement points each time
a learner reaches a milestone. Because points can be gained along the entire pathway, colleges are
motivated to serve a wide range of students. Moreover, the incentives structure follows the principle of
equivalent effort whereby each point requires roughly the same intensity of effort to attain. In other
words, rather than being distributed evenly along the pathway, points are clustered at lower levels of
achievement. This reflects the fact that those who enter closer to the starting point require greater
effort to transition between milestones.
9. Ensure that providers have the institutional capacity to improve their performance
Even under an ideally designed system, providers may require guidance on what they need to do to
improve their performance. Some performance funding schemes have devoted little attention to this
issue, assuming that if providers are properly incentivized, innovative practice will develop organically.
This may represents an overly simplistic view given that resource-poor providers who may be in
danger of not meeting standards and thus losing funding may have little choice but to focus their efforts
on strategic behaviour.
Applying performance funding to Essential Skills:
State of knowledge review
Social Research and Demonstration Corporation 37
Other models have gone to the other extreme and mandated a specific set of practices. In some cases,
where there is a fairly simple chain of evidence from process to outcome (for example, using diagnostic
tests in health care), mandating and rewarding specific practices may increase the effectiveness of a
PBF scheme (Van Herck et al., 2010). However, where the evidence chain is less well established and
the goal is to stimulate innovation, being less prescriptive may be beneficial.
A middle ground between these two extremes could focus on improving provider capacity to develop
effective tools and practices. For example, a performance funding scheme could be introduced with a
'learning period,' in which providers are given technical assistance and opportunities to build a
community of practice with others facing similar challenges. This period could focus on identifying
promising practices. The ultimate goal could be the development of a menu of practices and tools from
which providers could select according to client goals and needs. The menu could be arranged along a
continuum of activities put in place to support one or several employment pathways.
10. Establish a connection between in-program measures and post-program impacts
The central assumption of performance funding – usually untested – is that the performance measures
that funders are paying for are empirically connected to the ultimate program impacts they wish to
achieve. Our literature review revealed that the few studies that have been done have generally found
little or no connection between performance measures and program impacts. This could be because of
serious limitations in the way performance measures are usually selected - i.e., as point-in-time
measures rather than gains. Perhaps it is not surprising that, for example, employment or earnings
measured at a single point in time after exiting a program do not provide much information about long-
term improvement in labour market outcomes.
Focusing performance measures on gains over time (see principle #2) may be more promising. For
example, it makes sense to hypothesize that gains in skills may produce gains in employment and
earnings; however, the hypothesis would need to be tested because it is also possible for example that
skill gains might not be recognized by the labour market.
Thus longitudinal research should be conducted to identify key milestones that if achieved act as
tipping points to further education and/or labour market success. Research is also required to establish
the impact of performance funding not only on the intermediate learning outcomes that make up the
performance measurement framework, but also on longer-term outcomes of interest such as
employment, earnings, and continuous learning.
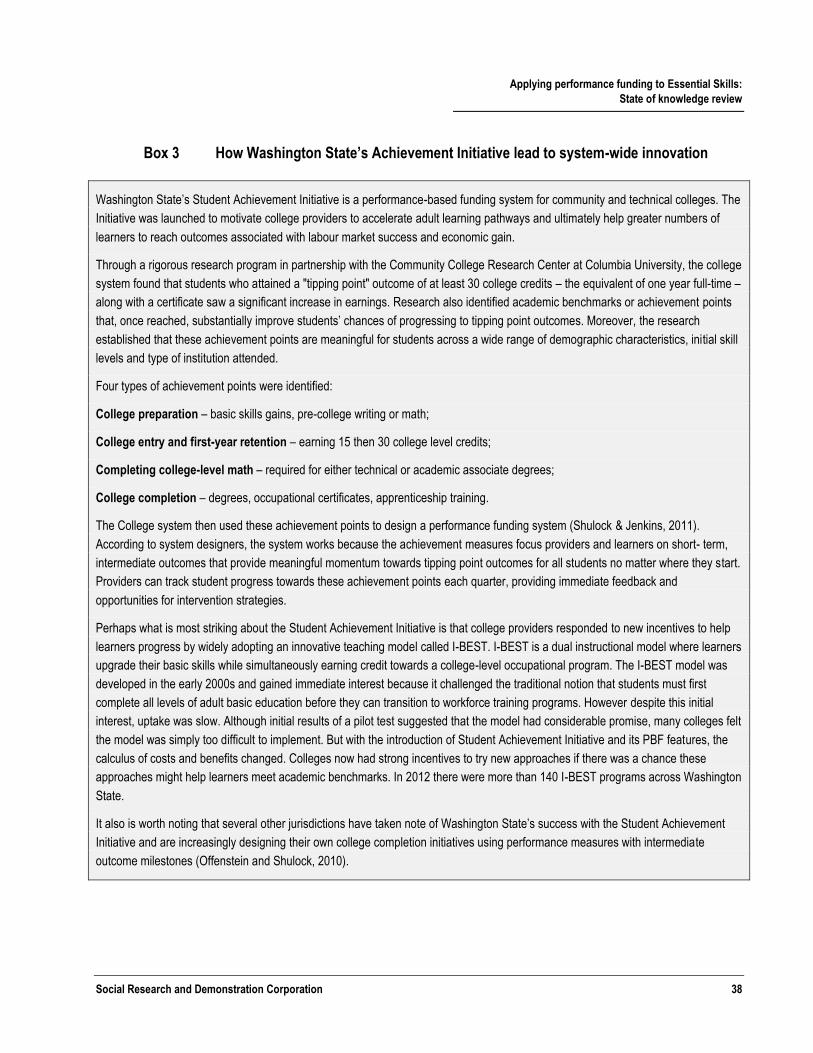
Applying performance funding to Essential Skills:
State of knowledge review
Social Research and Demonstration Corporation 38
Box 3 How Washington State’s Achievement Initiative lead to system-wide innovation
Washington State’s Student Achievement Initiative is a performance-based funding system for community and technical colleges. The
Initiative was launched to motivate college providers to accelerate adult learning pathways and ultimately help greater numbers of
learners to reach outcomes associated with labour market success and economic gain.
Through a rigorous research program in partnership with the Community College Research Center at Columbia University, the college
system found that students who attained a "tipping point" outcome of at least 30 college credits – the equivalent of one year full-time –
along with a certificate saw a significant increase in earnings. Research also identified academic benchmarks or achievement points
that, once reached, substantially improve students’ chances of progressing to tipping point outcomes. Moreover, the research
established that these achievement points are meaningful for students across a wide range of demographic characteristics, initial skill
levels and type of institution attended.
Four types of achievement points were identified:
College preparation – basic skills gains, pre-college writing or math;
College entry and first-year retention – earning 15 then 30 college level credits;
Completing college-level math – required for either technical or academic associate degrees;
College completion – degrees, occupational certificates, apprenticeship training.
The College system then used these achievement points to design a performance funding system (Shulock & Jenkins, 2011).
According to system designers, the system works because the achievement measures focus providers and learners on short- term,
intermediate outcomes that provide meaningful momentum towards tipping point outcomes for all students no matter where they start.
Providers can track student progress towards these achievement points each quarter, providing immediate feedback and
opportunities for intervention strategies.
Perhaps what is most striking about the Student Achievement Initiative is that college providers responded to new incentives to help
learners progress by widely adopting an innovative teaching model called I-BEST. I-BEST is a dual instructional model where learners
upgrade their basic skills while simultaneously earning credit towards a college-level occupational program. The I-BEST model was
developed in the early 2000s and gained immediate interest because it challenged the traditional notion that students must first
complete all levels of adult basic education before they can transition to workforce training programs. However despite this initial
interest, uptake was slow. Although initial results of a pilot test suggested that the model had considerable promise, many colleges felt
the model was simply too difficult to implement. But with the introduction of Student Achievement Initiative and its PBF features, the
calculus of costs and benefits changed. Colleges now had strong incentives to try new approaches if there was a chance these
approaches might help learners meet academic benchmarks. In 2012 there were more than 140 I-BEST programs across Washington
State.
It also is worth noting that several other jurisdictions have taken note of Washington State’s success with the Student Achievement
Initiative and are increasingly designing their own college completion initiatives using performance measures with intermediate
outcome milestones (Offenstein and Shulock, 2010).

Applying performance funding to Essential Skills:
State of knowledge review
Social Research and Demonstration Corporation 39
4.3 A promising PBF model for Essential Skills programs
Based on our review of the evidence and in accordance with guiding principles described in the
previous section, we recommend that any model that aims to apply performance based funding to
Essential Skills should be carefully designed to establish links between practice and performance and
encourage progress along a continuum. A critical success factor of this type of approach is that
performance milestones should be selected based on consultations with providers as well as
longitudinal research that identifies key transition points along the pathway(s) that, if reached, are
associated with further progress and ultimately longer term labour market success. Establishing these
types of connections is what distinguishes our recommended approach from more traditional PBF
models. While the details of our recommended approach would need to be worked out in relationship
to a given program’s policy objectives and existing design, Figure 6 provides a high level illustration of
what our recommended approach could look like in terms of system goals and incentive design.
Broadly speaking our proposed model has three key features:
1. Rewards achievement of key milestones – Encourages the progress of clients by rewarding
achievement of key intermediate milestones that if reached are associated with further progress
and ultimately long-term labour market success.
2. Focuses on ‘in-program’ measures – Focuses on measures that are within provider control (e.g.,
skills gains) which helps providers to understand where clients succeed and where they falter and
thus provides the data to drive innovation.
3. Fosters collaboration not competition – Allocates performance dollars according to the total
number of milestones achieved along the pathway. Thus providers are not in competition with each
other. Indeed they may be motivated to share expertise and collaborate to improve outcomes.
Our review of the evidence suggests that a model designed with these features would add value in three
distinct but inter-related ways:
1. Encouraging innovation – The model would encourage innovation because providers are
rewarded for helping clients reach key milestones, which motivates them to try new ways of
delivering programs. And because providers are not in competition with each other, the system
implicitly encourages them to come together to build a ‘community-of-practice’ to identify and
foster promising approaches.
2. Avoiding common PBF pitfalls – Because the approach uses ‘in-program’ indicators, it avoids
reliance on indicators that are often perceived as outside providers’ control (e.g., sustained
employment) and thus associated with gaming. Also because the approach focuses on progress
along a continuum, it avoids reliance on point-in-time targets (e.g., employment level or educational
attainment) which may incentivize providers to only serve clients closest to the target.
3. Complementing current policy goals – Because this approach to PBF is consistent with the
broader policy goal of accelerating client progress along the employment continuum, the model will
reinforce emerging approaches at both the policy and programmatic level.
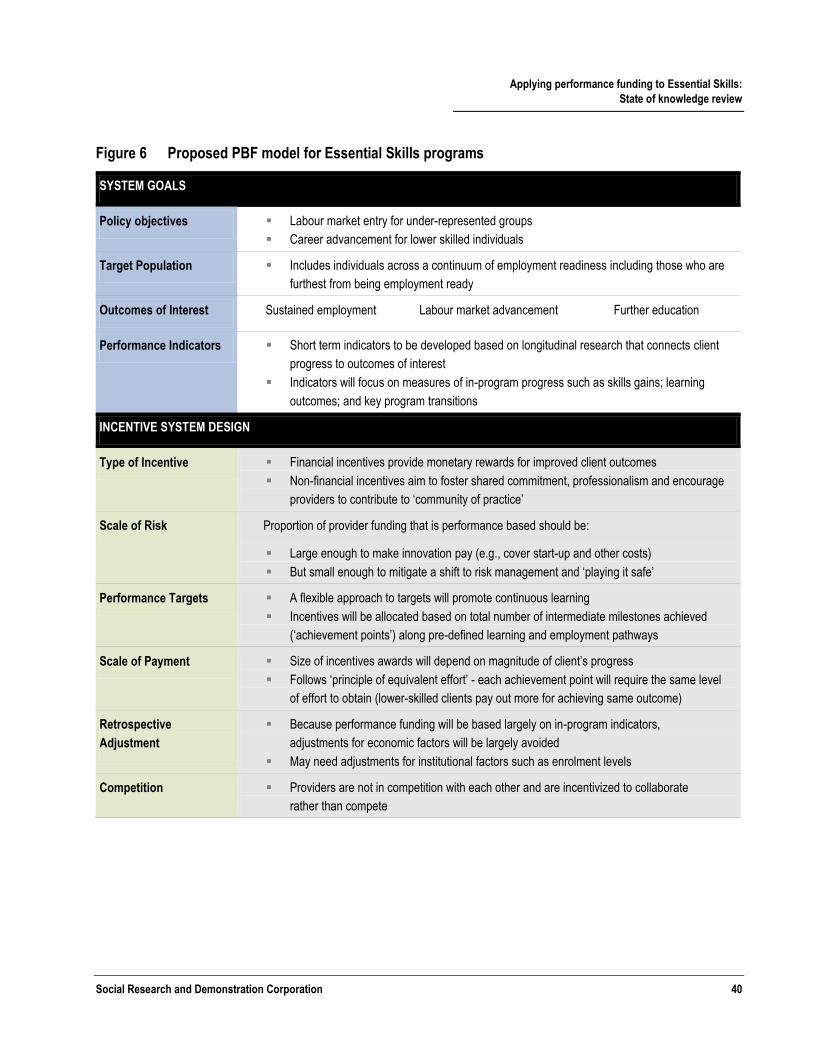
Applying performance funding to Essential Skills:
State of knowledge review
Social Research and Demonstration Corporation 40
Figure 6 Proposed PBF model for Essential Skills programs
SYSTEM GOALS
Policy objectives Labour market entry for under-represented groups
Career advancement for lower skilled individuals
Target Population Includes individuals across a continuum of employment readiness including those who are
furthest from being employment ready
Outcomes of Interest Sustained employment Labour market advancement Further education
Performance Indicators Short term indicators to be developed based on longitudinal research that connects client
progress to outcomes of interest
Indicators will focus on measures of in-program progress such as skills gains; learning
outcomes; and key program transitions
INCENTIVE SYSTEM DESIGN
Type of Incentive Financial incentives provide monetary rewards for improved client outcomes
Non-financial incentives aim to foster shared commitment, professionalism and encourage
providers to contribute to ‘community of practice’
Scale of Risk Proportion of provider funding that is performance based should be:
Large enough to make innovation pay (e.g., cover start-up and other costs)
But small enough to mitigate a shift to risk management and ‘playing it safe’
Performance Targets A flexible approach to targets will promote continuous learning
Incentives will be allocated based on total number of intermediate milestones achieved
(‘achievement points’) along pre-defined learning and employment pathways
Scale of Payment Size of incentives awards will depend on magnitude of client’s progress
Follows ‘principle of equivalent effort’ - each achievement point will require the same level
of effort to obtain (lower-skilled clients pay out more for achieving same outcome)
Retrospective
Adjustment
Because performance funding will be based largely on in-program indicators,
adjustments for economic factors will be largely avoided
May need adjustments for institutional factors such as enrolment levels
Competition Providers are not in competition with each other and are incentivized to collaborate
rather than compete

Applying performance funding to Essential Skills:
State of knowledge review
Social Research and Demonstration Corporation 41
5. Conclusion
This project aimed to explore ideas for experimenting with various approaches to rewarding Essential
Skills service delivery providers for their performance; or in other words, paying for success, as a means
to stimulate innovation and improvements in employment outcomes.
Specifically, the project had three broad objectives: first, to investigate the current state of knowledge
on what works with performance-based funding (PBF), identify key lessons learned, and highlight
promising approaches; second, to consult with key stakeholders to determine whether and how these
promising approaches could be applied to an Essential Skills training context; and finally, building on
these consultations and wider lessons learned, develop a recommended approach for applying
performance-based funding model to Essential Skills training delivery.
Overall, our state of knowledge review of what works and does not work with performance-based
funding system has identified five key findings:
1. First, PBF systems vary widely in their design. Even PBF systems that address the same policy issue
may differ significantly in terms of key features such as performance indicators and targets, size
and types of incentives used, and degree of competition across providers.
2. Second, despite this variation, a consistent finding is that even small amounts of performance-based
funding may change provider behaviour.
3. Third, not all changes are in the desired direction. Regardless of the incentive design, the
implementation of a PBF system is almost always associated with significant unintended
consequences such as increased gaming or strategic behavior on the part of providers.
4. Fourth, in addition to paying attention to incentives design, great care needs to be taken in selecting
performance indicators. The literature is rife with examples of systems that use short-term
indicators with no demonstrable link to desired long-term benefits, leading to situations where
hitting the performance target may mean missing the point.
5. Finally, despite these pervasive pitfalls, recent innovations in the design of PBF systems are
encouraging. There is emerging evidence that PBF systems can be successfully designed to improve
outcomes if they are built on a measurement framework that establishes timely and meaningful
connections between day-to-day providers’ practice and performance. These connections enable
service delivery providers to better understand where and why clients succeed and where and why
they falter, and they provide incentives to providers to adjust, shift and innovate their practice
accordingly.
We drew on this evidence to identify lessons learned and guiding principles for identifying a model that
works. Based on these principles, we recommend that any effort to apply performance based funding to
Essential Skills delivery should be carefully designed to establish links between practice and
performance, encourage progress along the employment continuum, and foster collaboration not
competition among providers.
Applying performance funding to Essential Skills:
State of knowledge review
Social Research and Demonstration Corporation 42
Our proposed model has three key strengths. First, because providers are rewarded for helping clients
reach key milestones and funds are allocated according to the total number of milestones achieved
rather than based on relative performance, providers are motivated to innovate and try new delivery
approaches, and there is an incentive to build a ‘community-of-practice’ for identifying and promoting
promising approaches. Over time, this should lead to innovations that generate more integrated,
accelerated and effective pathways to education and labour market advancement. This in turn should
lead to even greater likelihood of clients achieving long term labour market success. Thus, client
outcomes improve not just because providers are now paid for their success but because this practice
stimulates innovation that results in lasting system-wide improvements.
Second, because the model uses in-program indicators and focuses on progress along a continuum, it
avoids both the common pitfalls of (i) an over-reliance on performance indicators which are often
beyond provider control which may lead to gaming behavior, and (ii) an over-reliance on single point-
in-time performance targets, which may inadvertently incentivize providers to serve only those clients
closest to the target.
Finally, a Pathways Approach to measurement is not only consistent with but actually complements
current policy goals of moving clients along accelerated pathways of employment readiness and career
advancement. In fact, a Pathways Approach would harness existing policy momentum to map out these
pathways and use them to engineer the PBF system. Thus, a Pathways Approach would work in tandem
with and reinforce emerging approaches at both the policy and programmatic level.
Applying performance funding to Essential Skills:
State of knowledge review
Social Research and Demonstration Corporation 43
References
Anderson, K., Burkhauser, R., and Raymond, J. (1993). “The Effect of Creaming on Placement Rates
under the Job Training Partnership Act.” Industrial and Labor Relation Review 46(4): 613-24.
Atkinson-Grosjean, J., Grosjean, G., Fisher, D. and Rubenson, K. (1999). Consequences of Performance
Models in Higher Education: An International Perspective. Centre of Policy Studies in Higher
Education and Training. University of British Columbia. URL:
www.fedcan.ca/english/fromold/perf-ind-literaturereviews-ubc.cfm.
Australian National Audit Office. (2008). Administration of Job Network Service Fees. Audit Report No.38
2007–08, Australian National Audit Office, Canberra, available at
http://anao.gov.au/director/publications/auditreports/2007-
2008.cfm?item_id=31CBC3991560A6E8AA31B15FC67D4262.
Barnow, B. and Smith, J. (2004). "Performance Management of U.S. Job Training Programs" in Job
Training Policy in the United States, Christopher J. O'Leary, Robert A. Straits, and Stephen A.
Wandner, eds. Kalamazoo, MI: W.E. Upjohn Institute, pp. 21-56.
Bloom, H., Orr, L., Bell, S., Cave, G., Doolittle, F., Lin, W., and Bos, J. (1997). “The benefits and costs of
JTPA Title II-A programs: Key findings from the National Job Training Partnership Act Study.” The
Journal of Human Resources 32(3): 549-576.
Bruttel, O. (2005). “Are Employment Zones Successful? Evidence From the First Four Years,” Local
Economy 4.
Bruttel O. (2003). Managing Competition in a Public Service Market: The Job Network in an International
Perspective, Centre for Labour Market Research Discussion paper, no. 3.
Buery, R. (2012). “Nonprofits and the Government: A Relationship Strained by Bureaucracy.”
http://www.huffingtonpost.com/richard-buery/post_3708_b_1711650.html
Card, D., Kluve, J., and Weber, A. (2009). "Active Labor Market Policy Evaluations: A Meta-Analysis," IZA
Discussion Papers 4002, Institute for the Study of Labor (IZA).
Courty, P., Heinrich, C., Marschke, G., and Smith, J. (2011). “US Employment Training Programs and
Performance Standards System Design” in The Performance of Performance Standards, James
Heckman, Carolyn Heinrich, Pascal Courty, Gerald Marschke, and Jeffrey Smith, eds. Kalamazoo, MI:
W.E. Upjohn Institute, pp. 15-28.
Courty, P., Kim, D., and Marschke, G. (2008). Curbing Cream-Skimming: Evidence on Enrolment
Incentives. Institute for the Study of Labor: Bonn, Germany.
Courty, P. and Marschke, G. (2011). “The JTPA Incentive System: Implementing Performance
Measurement and Funding” in The Performance of Performance Standards, James Heckman, Carolyn
Heinrich, Pascal Courty, Gerald Marschke, and Jeffrey Smith, eds. Kalamazoo, MI: W.E. Upjohn
Institute, pp. 65-94.

Applying performance funding to Essential Skills:
State of knowledge review
Social Research and Demonstration Corporation 44
Courty, P. and Marschke, G. (2004). “An Empirical Investigation of Gaming Responses to Explicit
Performance Incentives.” Journal of Labor Economics 22(1).
Courty, P. and Marschke, G. (2003). "Performance Funding in Federal Agencies: A Case Study of a
Federal Job Training Program." Public Budgeting and Finance 23(3): 22-48.
Cumming, L. (2011). Case Study 1: Payment-by-Outcome in Welfare to Work. London: 2020 Public
Services Trust.
Davidson, P. (2010). “Did ‘work-first’ work? The role of employment assistance programs in reducing
long-term unemployment in Australia.” Australian Bulletin of Labour vol. 36, no. 4.
Department of Employment and Workplace Relations. (2007). Labour Market Assistance Outcomes: Year
Ending June 2007. Canberra: DEWR.
Dicker, J. (2011). Case Study 2: Payment-by-Outcome in Offender Management. London: 2020 Public
Services Trust.
DWP. (2011). The Work Programme , available at http://www.dwp.gov.uk/docs/the-work-
programme.pdf.
DWP. (2010). The Work Programme: Invitation to Tender: Specification and Supporting Information,
Version 5.0.
Dougherty, K. and Reddy, V. (2011). The Impacts of State Performance Funding Systems on Higher
Education Institutions: Research Literature Review and Policy Recommendations. CCRC Working
Paper No. 37. New York: Community College Research Center, Teachers College, Columbia
University.
Finn, D. (2011). Job Services Australia: design and implementation lessons for the British context.
Department for Work and Pensions: London.
Finn, D. (2008). The British ‘welfare market’: Lessons from contracting out welfare to work programmes
in Australia and the Netherlands. Joseph Rowntree Foundation: York, UK.
Fowkes, L. (2011). Rethinking Australia’s Employment Services. Whitlam Institute, University of Western
Sydney: Sydney.
Georgia Governor’s Special Investigators Report. (2011). Volume 1:
http://www.courthousenews.com/2011/07/27/APS1.pdf; Volume 2:
http://www.courthousenews.com/2011/07/27/APS2.pdf; Volume 3:
http://www.courthousenews.com/2011/07/27/APS3.pdf
Gneezy, U., Meier, S. and Rey-Biel, P. (2011). "When and Why Incentives (Don't) Work to Modify
Behavior." Journal of Economic Perspectives, 25(4): 191–210.
Giloth, Robert, (2009), Lessons for a new context: workforce development in an era of economic
challenge, Community Investments, issue Spr, p. 8-13.
Applying performance funding to Essential Skills:
State of knowledge review
Social Research and Demonstration Corporation 45
Heckman, J., Heinrich, C., and Smith, J. (2011a). “A Formal Model of a Performance Incentive System” in
The Performance of Performance Standards, James Heckman, Carolyn Heinrich, Pascal Courty,
Gerald Marschke, and Jeffrey Smith, eds. Kalamazoo, MI: W.E. Upjohn Institute, pp. 29-63.
Heckman, J., Heinrich, C., and Smith, J. (2011b). “Do Short-Run Performance Measures Predict long-run
Impacts?” in The Performance of Performance Standards, James Heckman, Carolyn Heinrich, Pascal
Courty, Gerald Marschke, and Jeffrey Smith, eds. Kalamazoo, MI: W.E. Upjohn Institute, pp. 273-304.
Heckman, J. and Smith, J. (2011). “Do the Determinants of Program Participation Data Provide Evidence
of Cream Skimming?” in The Performance of Performance Standards, James Heckman, Carolyn
Heinrich, Pascal Courty, Gerald Marschke, and Jeffrey Smith, eds. Kalamazoo, MI: W.E. Upjohn
Institute, pp. 125-202.
Heckman, J., Smith, J., and Taber, C. (1996). “What Do Bureaucrats Do? The Effects of Performance
Standards and Bureaucratic Preferences on Acceptance into the JTPA Program.” In Advances in the
Study of Entrepreneurship, Innovation and Economic Growth, Volume 7, Gary Libecap, ed. Greenwich,
CT: JAI Press, pp. 191–218.
House of Commons Work and Pensions Committee. (2009). DWP’s Commissioning Strategy and the
Flexible New Deal. London: The Stationery Office Limited.
Jenkins, D., Ellwein, T., and Boswell, K. (2008). Formative Evaluation of the Student Achievement
Initiative “Learning Year”. New York: Community College Research Center, Teachers College,
Columbia University.
Jongbloed, B. and Vossensteyn, H. (2001). “Keeping up Performances: An international survey of
performance-based funding in higher education.” Journal of Higher Education Policy and
Management, 23:2, 127-145.
Klein, S. (2005). Performance-Based Funding In Adult Education: Literature Review and Theoretical
Framework. Berkeley, CA: MPR Associates.
Knight, G. (2010). Jobseekers Regime and Flexible New Deal, the Six Month Offer and Support for the
Newly Unemployed evaluations: An early process study. Norwich: Department for Work and
Pensions.
Muriel, A. and Smith, J. (2011). “On Educational Performance Measures.” Fiscal Studies 32(2): 187-206.
Murray, P. (2006). A Job Network for Job Seekers. Curtin, ACT, Australia: Catholic Social Services
Australia.
Myers, K. & de Broucker, P. (2006). Too many left behind: Canada’s adult education and training system
Ottawa: Canadian Policy Research Networks.
NTEU (National Tertiary Education Union). (2004). Learning and Teaching Performance Fund.
Canberra, Australia: Department of Education, Science and Training.
Offenstein, J. and Shulock, N. (2010). Taking the next step: The promise of intermediate measures for
meeting postsecondary completion goals. Sacramento, CA: Institute for Higher Education Leadership
& Policy.

Applying performance funding to Essential Skills:
State of knowledge review
Social Research and Demonstration Corporation 46
Office of Vocational and Adult Education (OVAE). (2012). Adult Education and Literacy. URL:
http://www2.ed.gov/about/offices/list/ovae/pi/AdultEd/index.html.
Office of Vocational and Adult Education (OVAE). (2011). Implementation Guidelines: Measures and
Methods for the National Reporting System for Adult Education. Washington, D.C.: U.S. Department of
Education.
Office of Vocational and Adult Education (OVAE). (2007). Performance-based Funding in Adult
Education. Washington, D.C.: U.S. Department of Education.
OCUFA (Ontario Confederation of University Faculty Associations). (2006). Performance indicator use in
Canada, the U.S. and abroad. Toronto: Ontario Confederation of University Faculty Associations.
OECD. (2010). “Value for Money in Health Spending.” OECD Health Policy Studies. OECD Publishing.
Orr, L., Bloom, H., Bell, S., Doolittle, F., Lin, W., and Cave, G. (1996). Does Training for the Disadvantaged
Work? Evidence from the National JTPA Study. The Urban Institute Press: Washington.
Orr, L.L., Bell, S.H., and Klerman, J.A. (2009). American Lessons on Designing Reliable Impact Evaluations,
from Studies of WIA and Its Predecessor Programs. Center for International Policy Exchanges,
University of Maryland School of Public Policy Conference: Evaluation and Performance
Management of Job Training Programs, Washington, DC, November 7, 2009.
http://umdcipe.org/conferences/WIAWashington/Papers/Orr%20-
%20American%20Lessons%20on%20Designing%20Reliable%20Impact%20Evaluations.pdf
Pew Center on the States. (2011). State of Recidivism: The Revolving Door of America’s Prisons.
Washington, DC: The Pew Charitable Trusts.
Prendergast, C. (1999). “The Provision of Incentives in Firms.” Journal of Economic Literature 37(1): 7–
63.
Prince, D. and Jenkins, D. (2005). Building Pathways to Success for Low-Skilled Adult Students: Lessons
for Community College Policy and Practice from a Longitudinal Student Tracking Study. CCRC Brief
No. 25. New York: Community College Research Center, Teachers College, Columbia University.
Productivity Commission. (2002). Independent Review of the Job Network, Report 21, 3 June 2002.
Ryan, J.E. (2004). The Perverse Incentives of the No Child Left Behind Act. New York University Law
Review, Spring 2004.
Saunders, P. (2008). The experience of contracting out employment services in Australia’, in P. Lilley
and O. Hartwich (eds) Paying for Success: How to Make Contracting out Work in Employment
Services. London: Policy Exchange.
Shulock, N. and Jenkins, D. (2011). Performance Incentives to Improve Community College Completion:
Learning from Washington State's Student Achievement Initiative. New York: Community College
Research Center, Teachers College, Columbia University, and Sacramento, CA: Institute for Higher
Education Leadership & Policy, California State University.

Applying performance funding to Essential Skills:
State of knowledge review
Social Research and Demonstration Corporation 47
Struyvent, L. and Steurs, G. (2005). “Design and redesign of a quasi-market for the reintegration of
jobseekers: empirical evidence from Australia and the Netherlands”, Journal of European Social
Policy, Vol. 15, No. 3, pp. 211–19.
Van Herck, P., De Smedt, D., Annemans, L., Remmen, R., Rosenthal, M.B., and Sermeus, W. (2010).
“Systematic review: Effects, design choices, and context of pay-for-performance in health care.”
BMC Health Services Research, 10:247.
Vegeris, S., Vowden, K., Bertram, C., Davidson, R., Durante, L., Hudson, M., Husain, F., Mackinnon, K., and
Smeaton, D. (2010). Jobseekers Regime and Flexible New Deal Evaluation: A report on qualitative
research findings. London: Department for Work and Pensions.
Zeidenberg, M., Cho, S., and Jenkins, D. (2010). Washington State's Integrated Basic Education and Skills
Training Program (I-BEST): New Evidence of Effectiveness. CCRC Working Paper No. 20. New York:
Community College Research Center, Teachers College, Columbia University.