Embed Size (px)
Citation preview
Research in Higher Education Journal
Applying marginal analysis, page 1
Applying marginal analysis in determining the number of
contractors: An approach for the Advisory and Assistance Services
(A&AS) and Department of Defense (DOD)
Ray M. Valadez
Pepperdine University
Leo A. Mallette
Pepperdine University
Aaron Albrecht
Pepperdine University
ABSTRACT
The Department of Defense (DOD) finds itself with budget constraints and having to
account not only for its deliverance of its core missions but for its efficient use of resources as
well. Contractors are considered an important resource. Several publications have recently
suggested the DOD needs a better budget allocation methodology as well as a better census of
contractors. It has been criticized for not even knowing how many contractors it has under
contract.
This paper suggests the use of an economic concept called marginal analysis to help
project managers, directors, contracting officers, and other decision-makers in government and
non-government agencies manage the allocated budget. Arriving at an efficient use of
contractors, while not losing control of the DOD’s responsibilities or outsourcing inherently
governmental functions intimately related to public interest, may be provided by using marginal
analysis. The DOD relies on organizations under the Advisory and Assistance Services (A&AS)
contracts to provide services that help improve the quality and timely delivery of contractor’s
services while minimizing costs. The services provided by A&AS take the form of information,
advice, opinions, alternatives, analyses, evaluations, recommendations, training, and technical
support. The researchers using recent data, a hypothetical budget, and marginal analysis where
fixed costs are locked in, suggest that the A&AS should aim for the number of contractors that
gains its most efficient use of resources by minimizing costs while ensuring mission success.
Keywords: marginal analysis, project management, Department of Defense, DOD contracting
Copyright statement: Authors retain the copyright to the manuscripts published in AABRI
journals. Please see the AABRI Copyright Policy at http://www.aabri.com/copyright.html.

Research in Higher Education Journal
Applying marginal analysis, page 2
INTRODUCTION
The recent U.S. government impasse on approving the budget by March 1, 2013, has
created the implementation of automatic cutbacks in government spending. According to news
reports approximately half of the automatic budget cuts of 1.2 trillion dollars will be in defense
(Przbyola & Rubin, 2013). While political efforts are taking place to prevent such drastic cuts,
budgets will be slashed in almost every area of spending including defense. The Department of
Defense (DOD) finds itself not only with having to account for its deliverance of its core
missions but for its efficient use of resources as well under these budget reductions. One of the
considerations is the reduction of the use of independent contractors.
Contractors are considered an important resource. Several publications have recently
suggested the DOD needs a better budget allocation methodology as well as a better census of
contractors in order to make budget cuts (Weigelt, 2011). Budget allocations for contractors are
based on the term, Full Time Equivalent (FTE) in measuring the dollar amount for each
contractor to arrive at the number of contractors. The DOD has been criticized for not even
knowing how many contractors it has under contract (Clark, 2011).
This paper suggests the use of an economic concept called marginal analysis to help
project managers, directors, contracting officers, and other decision-makers in government and
non-government agencies manage the allocated budget. Arriving at an efficient use of
contractors while not losing control of the DOD’s responsibilities, may be provided by using
marginal analysis. The analysis presented in this paper is from a purely economic point of view
and other factors in decision making, such as maintaining the inherently functional
responsibilities of the government internally, are not addressed.
The DOD relies on organizations under the Advisory and Assistance Services (A&AS)
contracts to provide services that help improve the quality and timely delivery of contractor’s
services while minimizing costs. This paper was the result of a directed study and provides an
approach to assist decision makers manage budgets. It begins with who will benefit from the
marginal analysis approach. The methodology and definitions of terms is given. Then an
explanation of the results is provided along with tables and figures. Finally, a conclusion and
recommendation is stated suggesting the government decision makers consider applying the
concept of marginal analysis in deciding on the most efficient use of resources.
BENEFICIARIES OF THE SUGGEST APPROACH
Project managers, directors, contracting officers, and other decision-makers in
government and commercial enterprises are required to perform a make-buy analysis when
selecting a part, subsystem, or company to perform a task. There are many reasons for making a
make decision; such as to maintain core competence, lower production cost, utilize surplus labor
or facilities, obtain unique items, protect personnel from a layoff, or increase or maintain size of
company (Heizer & Render, 2010).
Similarly, there are many reasons for making a buy decision; such as freeing management
to deal with its core competence, lower acquisition cost, obtain technical or management ability,
inadequate managerial or technical resources, or product is protected by a patent or trade secret
(Heizer & Render, 2010). The analysis presented in this paper is from a purely economic point of
view and these other factors in the make-buy decision are not addressed.

Research in Higher Education Journal
Applying marginal analysis, page 3
GOVERNMENT SUPPORTING ORGANIZATIONS
The DOD defines Advisory and Assistance Service (A&AS) as:
… identifying services acquired by contract from non-governmental sources to support or
improve organization policy development, decision making, management and
administration; support program and/or project management and administration; provide
management and support services for Research & Development (R&D) activities;
provide engineering and technical support services; or improve the effectiveness of
management processes or procedures. These services may take the form of information,
advice, opinions, alternatives, analyses, evaluations, recommendations, training, or
technical support. (Office of the Secretary of Defense, 2013, p. 2)
The A&AS services take the form of information, advice, opinions , alternatives,
analyses, evaluations, recommendations, training, and technical support (Office of the Secretary
of Defense, 2012). Within the A&AS, the following types of service organizations may benefit
by using marginal analysis. Two of these are broadly defined as Systems Engineering and
Technical Assistance (SETA) contractors and Federally Funded Research and Development
Centers (FFRDC) contractors.
SETA. Many civilian employees of companies provide assistance to the government.
These companies are often called Systems Engineering and Technical Assistance (SETA)
contractors. These
contractors are civilian employees or government contractors who are contracted to assist
the United States Department of Defense (DoD) components, and acquisition programs.
(In some areas of DoD, the acronym SETA refers to "Systems Engineering and Technical
Assessment" contractors; also refers to "Systems Engineering and Technical Advisors.")
SETA contractors provide analysis and engineering services in a consulting capacity,
working closely with the government's own engineering staff members. SETA
contractors provide the flexibility and quick availability of expertise without the expense
and commitment of sustaining the staff long-term. (SETA, 2013, p. 1)
FFRDC. There are about 40 Federally Funded Research and Development Centers
(FFRDC) according to Master (2005). One of the better known FFRDCs is the Jet Propulsion
Laboratory (JPL) which is managed by the California Institute of Technology (Caltech) in
Pasadena California. Part 2.101 of the Federal Acquisition Regulation (1983) defines them as:
Federally Funded Research and Development Centers (FFRDC’s) means activities that
are sponsored under a broad charter by a Government agency (or agencies) for the
purpose of performing, analyzing, integrating, supporting, and/or managing basic or
applied research and/or development, and that receive 70 percent or more of their
financial support from the Government; and—(1) A long-term relationship is
contemplated; (2) Most or all of the facilities are owned or funded by the Government;
and (3) The FFRDC has access to Government and supplier data, employees, and
facilities beyond that common in a normal contractual relationship. (p. 31)
Research in Higher Education Journal
Applying marginal analysis, page 4
METHODOLOGY
Marginal analysis was primarily used in teaching business management to either
maximize profits or minimize losses in manufacturing. It has since evolved as a tool to help
management make decisions when deciding at what production levels of goods and services
would make the most efficient use of resources. In this paper, the concept is being applied to
determine on a fixed budget what number of contractors should be considered to minimize cost
without being inefficient. Of course, there are many variables that affect efficiency. However,
the attempt using marginal analysis will seek efficient use of resources such as contractors.
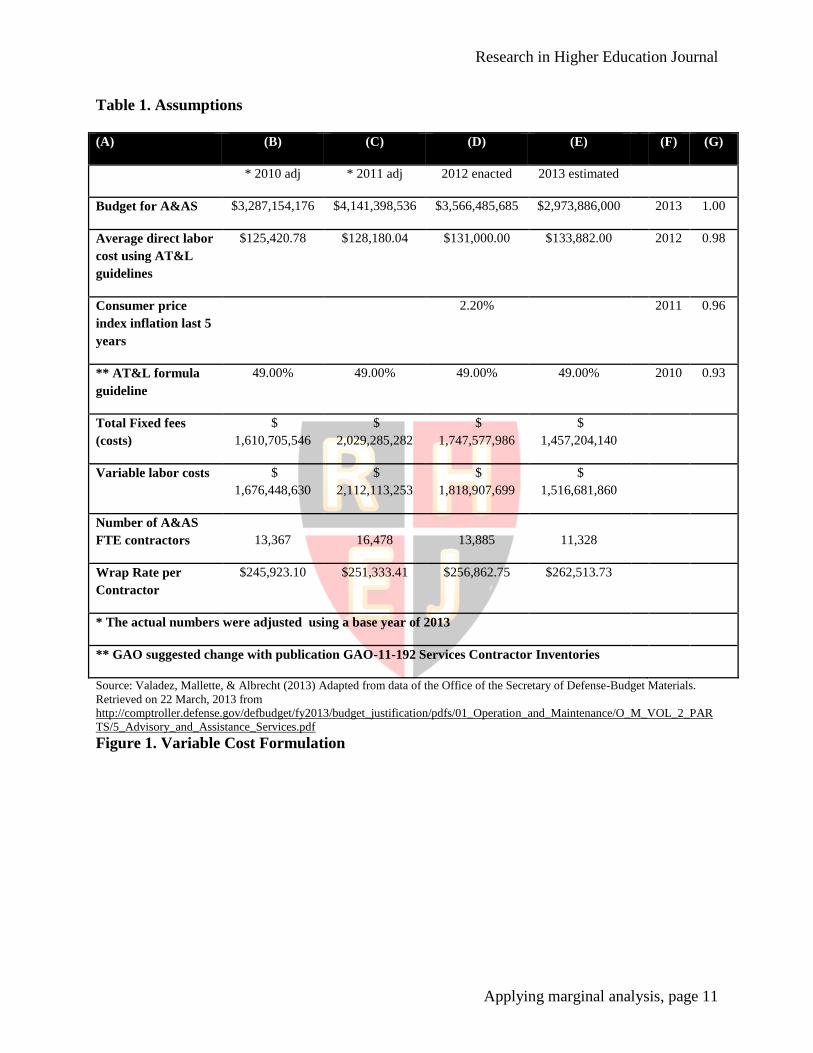
The researchers took the estimated budget for the A&AS for 2013 (Office of the
Secretary of Defense, 2013) as shown in Table 1 of the Appendix and adjusted the actual budgets
for 2010 and 2011 as well as the enacted budget for 2012. The actual budget for 2012 was not
available, therefore the enacted budget was used and was adjusted based on the 2013 year.
Additionally, from a Government Accounting Office (GAO) publication the average direct labor
cost using the Acquisition, Technology and Logistics (AT&L) guidance number of $131,000 per
FTE contractor (Hutton & Solis, 2011, p. 12) was used to back in the averages for 2010-1013
respectively. The guideline of 51 percent of the obligated contract for the contractor was used as
the variable cost. Knowing the variable costs and the average direct labor costs gives us the data
points to solve for the relationship. These data points were used to arrive at a polynomial
equation for the variable cost curve as shown in Figure 1 in the Appendix. Excel was used to
solve for the equation. The equation for the variable cost curve is:
𝑦 = 0.0004557659𝑥2 − 13.6560248362𝑥 + 229,704.277 (1)
Where
y = average cost per A&AS FTE contractor (dollars)
x = number of A&AS contractors
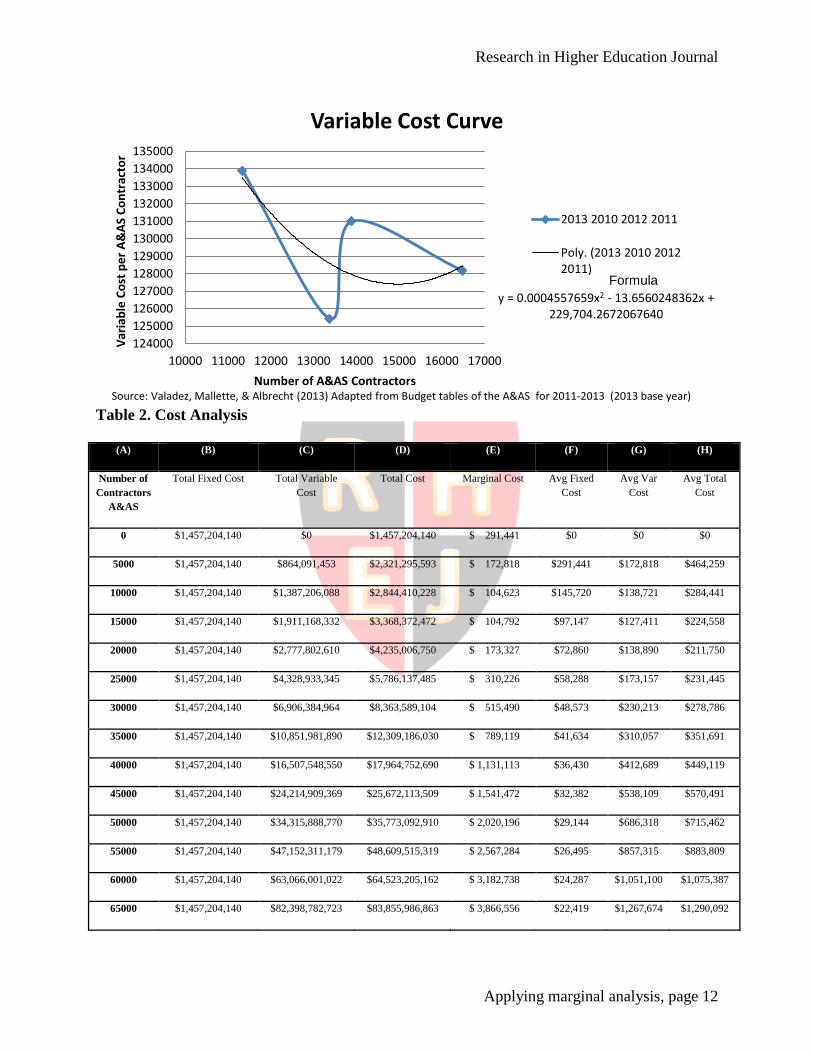
The total cost formula is made up of two elements, the fixed costs and variable costs. The
Fixed cost were calculated from the fixed cost in 2010 per employee times the number of A&AS
contractors for that year. Using the assumptions in Table 1 and extracting the polynomial
equation from Figure 1, Table 2 was created as shown in the Appendix. Once a budget has been
set and using the guidelines as suggested by the GAO, one locks in the fixed cost (49 percent of
the allocated budget). In 2013 using a fixed cost of $1,457,204,140 and formula (1), one can
create Table 2. The number of contractors (column A) was assumed. The fixed cost (column B)
was defined as 49 percent of the allocated budget. The variable cost (column B) was calculated
using formula (1) as previously noted. The total cost is simple adding the fixed cost and variable
cost. The marginal cost is the change in total cost (column D) divided by the change in the
number of contractors (column A). The average fixed cost is arrived by taking the total cost
(column B) and dividing it by the number of contractors (column A). The average variable cost
is similarly arrived at by taking the variable cost (column C) and dividing it by the number of
contractors (column A). Finally, the average total cost is found by taking the total cost (column
D) and dividing it by the number of contractors (column A).
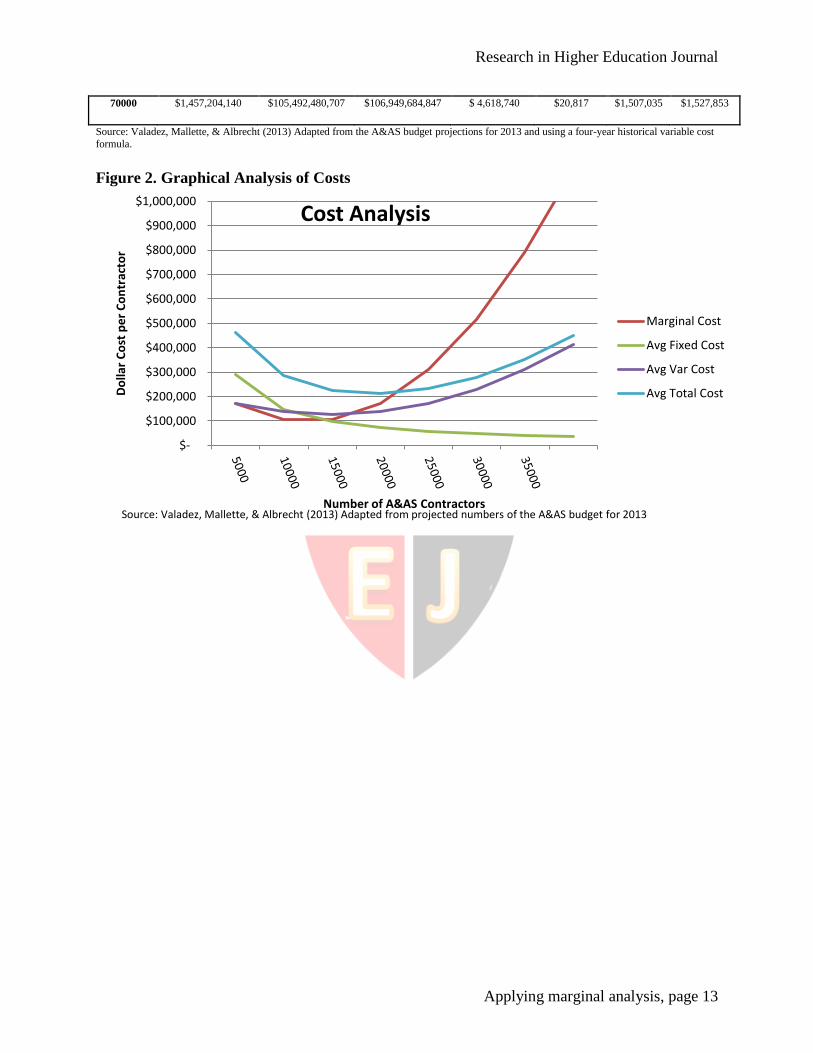
Table 2 numbers were then graphed as shown in Figure 2 of the Appendix. Notice that
the marginal cost curve represents the numbers in column E of Table 2 and looks like a typical
“J” curve for which the marginal curve is known for in economics. The average fixed cost,
Research in Higher Education Journal
Applying marginal analysis, page 5
average variable cost, and average total cost curves come from the numbers in columns F
through H of Table 2 respectively. Also, special attention should be placed on where the
marginal cost curve crosses the average total cost curve. This point happens to be the minimum
point of the average total cost which suggests effective use of resources in economics.
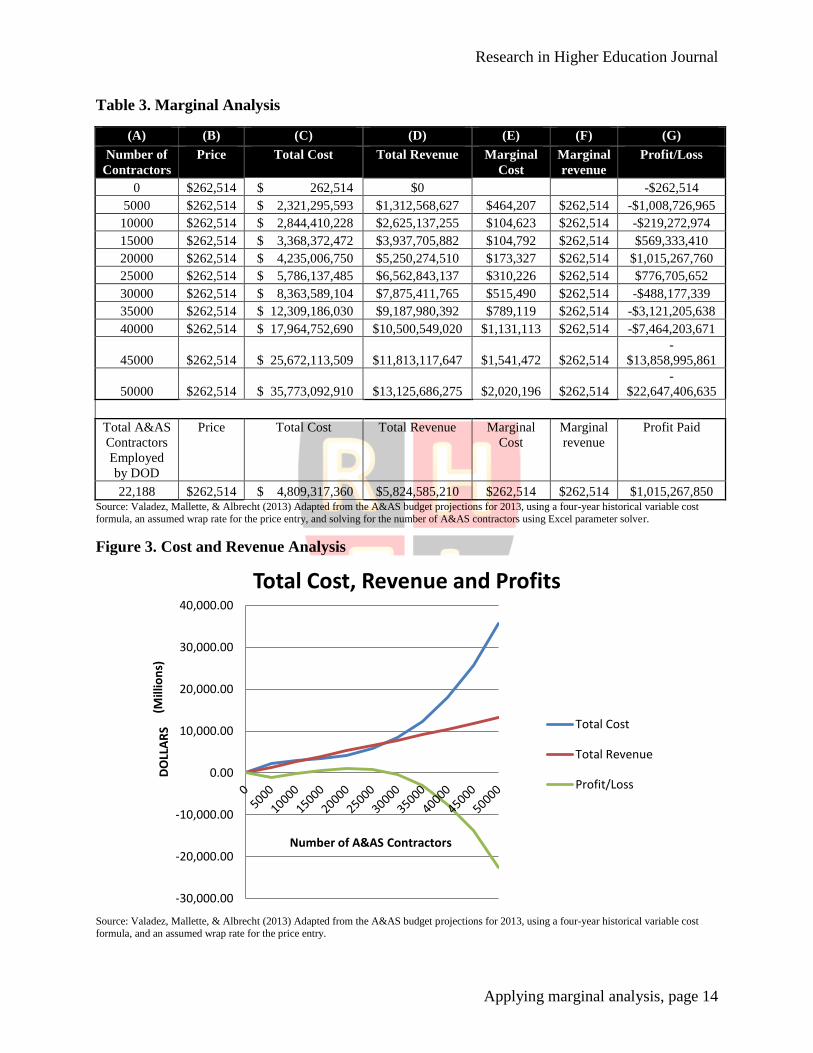
Expanding on Table 2 and Figure 2, Table 3 was created to demonstrate further the
effective use of resources by attempting to measure profit/loss using different levels of
contractors. Column A of Table 3 is the number of contractors. Column B is the wrap rate per
contractor and will be considered to be the hypothetical price of the contractor or the total cost
to the government per contractor. In this case the wrap rate is assumed to be $262,513.73 per
contractor. Colum C is the total cost to the government as has been previously calculated in
Table 2. Column D is the total revenue generated by taking the assumed price per contractor and
multiplying it by the number of contractors. Column E is the marginal cost by taking the change
in total cost and dividing it by the change in the number of contractors similar to the way it was
calculated in Table 2. Column F is the marginal revenue, which is nothing more than the price
used per contractor. Finally, column G is the difference between total revenue (column D) and
total cost (column C) to reveal the profit/loss at each level of contractors. Notice that one
maximizes profit (gain) between levels 20,000 and 25,000.
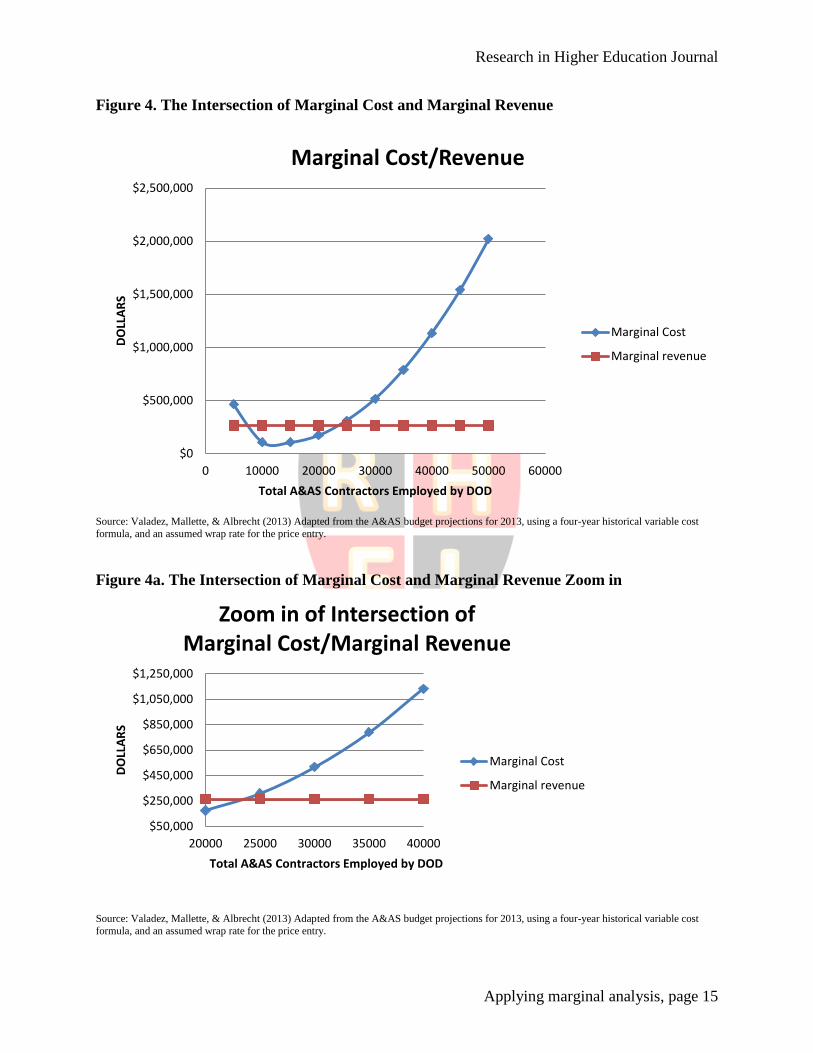
The numbers from Table 3 are graphed and shown in Figure 3 in the Appendix.
Abstractly, one can visually see where the total revenue curve exceeds the total cost curve
resulting and displaying the profit/loss curve. Again, notice that the number maximizing the
profit is somewhere between 20,000 and 25,000 contractors. Further display of the numbers are
isolated and displayed in Figure 4. This figure is very consistent with other marginal analysis
showing the intersection of the marginal cost and marginal revenue. In economic terms, one says
this would be the ideal quantity of producers. In this case, quantity of producers is used
interchangeably with quantity of products or units. Figure 4a is zooming in on Figure 4 for better
discernment of the intersection between the two curves, marginal cost and marginal revenue.
RESULTS
Marginal analysis seeks the intersection of economic costs where the marginal cost
crosses the average total cost at its minimum point. As seen, the marginal cost (MC) in Figure 2
in the Appendix intersects the average variable cost (AVC) and average total cost (ATC) at the
minimum points. This is the result of a relationship called the marginal-average rule. “The
marginal-average rule states that when marginal cost is below average cost, average cost falls…
[and] when marginal cost is above average cost, average cost rises” (Tucker, 2011, p. 191). The
best way to understand this rule is to apply it in other noneconomic terms. In sports, if a player is
added with an average scoring record exceeding the team’s average, the team’s average score
will increase. In this paper’s hypothetical example using Excel, it was determined that below
22,188 the average costs were dropping, and above 22,188, they were rising. Thus, concluding
this was the minimum points of the cost curves for the AVC and ATC.
Further exploration of the mathematical representations of the marginal cost curve,
average variable cost curve, and average total cost curve were done using Excel by taking the
data from Table 2 and Figure 2. The following equations (equations 2-4) represent these
polynomial curves respectively:
𝑦 = 34182𝑥2 − 170743𝑥 + 309379 (2)
Research in Higher Education Journal
Applying marginal analysis, page 6
𝑦 = 11394𝑥2 − 91063𝑥 + 309365 (3)
𝑦 = 19665𝑥2 − 172075𝑥 + 584879 (4) Where
y = dollar cost of each contractor
x = units of 5000 contactors
Letting x represent units of 5000 contractors and setting equations (2) and (4) equal to each other
provides:
34182𝑥2 − 170743𝑥 + 309379 = 19665𝑥2 − 172075𝑥 + 584879, or
14517𝑥2 + 1332𝑥 − 275500 = 0 (5)
Solving equation (5) for x using the formula
𝑥 = −𝑏 ± √𝑏2 − 4𝑎𝑐
2𝑎
Provides
x = −1332±√(1332)2−[(4)∗(14517)∗(275500)]
(2)∗(14517)≈ 4.31 (pos. #) (6)
The negative number in the above answer of -4.40 was not used because this would give
a negative number of contractors. From formula (6), one gets an answer for x as 4.31. Since each
x represents a unit of 5000 contractors, the number of contractors at the minimum average cost
and where marginal cost equal marginal revenue will be approximately
5000𝑥 ≈ 21,550 (7)
To check the number resulting from formula (7), one gets approximately 21,550
contractors as being the ideal number of contractors based upon the budget and the allocated
direct labor cost. Excel’s parameter solver under the Data menu was used by matching the
marginal cost figure with the marginal revenue figure and solving for the number of contractors.
In economics we often use the marginal revenue equals marginal cost method to determine the
maximizing level of output (Tucker, 2011, p. 216). In Table 3 column (A) line 15 was calculated
using this method and resulted in 22,188 contractors. This was a minor difference from the
quadratic formula resulting from formulas (2) and (4). However, the quadratic formulas 2
through 4 are polynominal estimates to the second degree using the Excel line trends function,
and therefore, they may explain the minor difference. Consequently, the use of Excel’s data
solver may be more reliable, and the researchers would lean towards using 22,188 as a more
reasonable number.
Research in Higher Education Journal
Applying marginal analysis, page 7
CONCLUSIONS AND RECOMMENDATIONS
This paper was the result of a directed study at Pepperdine University and provides a
marginal analysis approach to assist government decision makers manage budgets that use Full
Time Equivalent (FTE) contractors. Its focus was primarily on arriving at the number of FTE
contractors used by the Department of Defense (DOD).
Project managers, directors, contracting officers, and other decision-makers in
government and commercial enterprises are required to perform a make-buy analysis when
selecting a part, subsystem, or company to perform a task using independent contractors. More
importantly, the profit window for contractors’ to bid on A&AS contracts may be relatively
small as has been discovered in this study. The researchers using recent data, a hypothetical
budget estimated for 2013, and marginal analysis where fixed costs are locked in, suggest that
the A&AS should target the number of contractors that gains its most efficient use of resources
by minimizing costs while ensuring mission success. The target is where marginal costs meet
marginal revenue.
Given a budget and knowing what portion will be used for direct labor costs or variable
cost allows the decision maker a method to arrive at the ideal number of contractors using
marginal analysis. More importantly with this type of analysis, the Executive and Congressional
branches can more accurately answer the controversial question of how much assistance from
A&AS is appropriate for the DOD. Besides determining the budget, considering what will be
outsourced and what will be kept functionally inside, and setting the percent allocation for direct
labor cost, the decision maker will be able to determine the number of contractors most
appropriate by minimizing costs. Additionally, performing this analysis will provide the
marginal cost of adding one additional contractor which can be compared to adding one more
government employee.
Because of limited access to data, the researchers only approximated the ideal number of
contractors to be used by A&AS in 2013. More access to accurate data would provide better
estimates and results. Finally with budget constraints becoming a political issue, it becomes
imperative that the decision makers use different approaches to solving the dilemma of the
number of contractors to be hired given a fixed budget. Finally, contents of this paper represent
personal opinion and thoughts and should in no way be construed as the opinion of the United
States Air Force, Department of Defense, or the Advisory and Assistance Services.
REFERENCES
Clark, S. (2011, February). Pentagon to reduce number of contractors, doesn’t know how many it
has. Fox News. Retrieved from http://www.foxnews.com/politics/2011/02/09/pentagon-
seeks-reduce-number-contractors-knowing/
Research in Higher Education Journal
Applying marginal analysis, page 8
Executive Correspondence. (2011). Executive Correspondence - Letter with Enclosed
Documents from Ohio Senators Mike DeWine and George V Voinovich and
Representatives, Sequence: 13 | UNT Digital Library. Retrieved 22 Sept. 2012 from
http://digital.library.unt.edu/ark%3A/67531/metadc20946/m1/13/
Federal Acquisition Regulation. (1983). Federal Acquisition Regulation. Retrieved February 22,
2013 from http://www.gpo.gov/fdsys/pkg/CFR-2010-title48-vol1/pdf/CFR-2010-title48-
vol1-part2.pdf
Hutton, J. P., & Solis, W. (2011). Report to Congressional Committee. Defense acquisitions
(GAO Publication No. GAO-11-192) Retrieved 1 March, 2013 from
http://www.gao.gov/assets/320/314659.pdf.
Heizer & Render. (2010). Operations Management, Tenth edition, Upper Saddle River, NJ:
Pearson/Prentice Hall
Jolliffe, R. B. (2010). Advisory and Assistance Services Contracts in Support of the Air Force
Combat Search and Rescue Helicopter. Office of the Deputy Inspector General for
Auditing. Retrieved 22 Sept. 2012 from http://www.dodig.mil/audit/reports/fy10/10-
054_redacted.pdf
Kingsbury, N. (1994). Government Contractors Measuring Costs of Service Contractors Versus
Federal Employees. Government Accountability Office. Retrieved on 22 Sept. 2012 from
http://www.gao.gov/assets/220/219269.pdf
Master. (2005). Master government list of federally funded research and development centers.
Retrieved February 22, 2013 from http://www.nsf.gov/statistics/nsf05306/
Office of the Secretary of Defense. (2012). Office of the Secretary of Defense - Budget
Materials. Retrieved on 22 Sept. 2012 from
http://comptroller.defense.gov/defbudget/fy2012/budget_justification/pdfs/01_Operation
_and_Maintenance/O_M_VOL_2_PARTS/5_PB-15.pdf
Office of the Secretary of Defense. (2013). Office of the Secretary of Defense - Budget
Materials. Retrieved on 22 March, 2013 from
http://comptroller.defense.gov/defbudget/fy2013/budget_justification/pdfs/01_Operation
_and_Maintenance/O_M_VOL_2_PARTS/5_Advisory_and_Assistance_Services.pdf
SETA. (2013). Systems engineering and technical assistance. Retrieved February 22, 2013 from
http://en.wikipedia.org/wiki/Systems_Engineering_and_Technical_Assistance
Przybyla, H., & Rubin, R. (2013, January). Spending cuts including to defense seen to start in
March. Bloomberg News, Retrieved from http://www.bloomberg.com/news/print/2013-
01-30/automatic-u-s-budget-cuts-more-likely-as-stances-harden.html
Weigelt, M. (2011, January 20). DOD needs better census of contractors. Washington
Technology. Retrieved from http://washingtontechnology.com/articles/2011/01/20/gao-
dod-service-contract-inventory.aspx

Research in Higher Education Journal
Applying marginal analysis, page 9
AUTHORS
Ray M. Valadez. Ed.D. , MBA is a professor of economics at Pepperdine University and serves
in various faculty committees including the elected office of Faculty Council. He has published
several award winning papers as well as serves as a reviewer and advisor for academic
publishing journals. He previously held line and staff positions in the financial services industry
and was a registered principal before the NASD. Besides teaching, he is a practitioner and
consults for international businesses.
Leo A. Mallette, Ed.D. is an adjunct faculty at Pepperdine University. He is currently associated
with the Aerospace Corporation. Dr. Mallette has published over 70 conference and peer-
reviewed journal articles and is co-author of the book Writing for Conferences (Greenwood,
2011) and co-editor of The SPELIT Power Matrix (CreateSpace, 2007).
Aaron Albrecht is a contract negotiator for the United States Air Force at the Los Angeles Air
Force Base and has worked for the Air Force for over 9 years. He is completing his MBA from
the Graziadio School of Business and Management, Pepperdine University.

Research in Higher Education Journal
Applying marginal analysis, page 10
APPENDIX
Research in Higher Education Journal
Applying marginal analysis, page 11
Table 1. Assumptions
(A) (B) (C) (D) (E) (F) (G)
* 2010 adj * 2011 adj 2012 enacted 2013 estimated
Budget for A&AS $3,287,154,176 $4,141,398,536 $3,566,485,685 $2,973,886,000 2013 1.00
Average direct labor
cost using AT&L
guidelines
$125,420.78 $128,180.04 $131,000.00 $133,882.00 2012 0.98
Consumer price
index inflation last 5
years
2.20% 2011 0.96
** AT&L formula
guideline
49.00% 49.00% 49.00% 49.00% 2010 0.93
Total Fixed fees
(costs)
$
1,610,705,546
$
2,029,285,282
$
1,747,577,986
$
1,457,204,140
Variable labor costs $
1,676,448,630
$
2,112,113,253
$
1,818,907,699
$
1,516,681,860
Number of A&AS
FTE contractors
13,367
16,478
13,885
11,328
Wrap Rate per
Contractor
$245,923.10 $251,333.41 $256,862.75 $262,513.73
* The actual numbers were adjusted using a base year of 2013
** GAO suggested change with publication GAO-11-192 Services Contractor Inventories
Source: Valadez, Mallette, & Albrecht (2013) Adapted from data of the Office of the Secretary of Defense-Budget Materials.
Retrieved on 22 March, 2013 from
http://comptroller.defense.gov/defbudget/fy2013/budget_justification/pdfs/01_Operation_and_Maintenance/O_M_VOL_2_PAR
TS/5_Advisory_and_Assistance_Services.pdf
Figure 1. Variable Cost Formulation
Research in Higher Education Journal
Applying marginal analysis, page 12
Table 2. Cost Analysis
(A) (B) (C) (D) (E) (F) (G) (H)
Number of
Contractors
A&AS
Total Fixed Cost Total Variable
Cost
Total Cost Marginal Cost Avg Fixed
Cost
Avg Var
Cost
Avg Total
Cost
0 $1,457,204,140 $0 $1,457,204,140 $ 291,441 $0 $0 $0
5000 $1,457,204,140 $864,091,453 $2,321,295,593 $ 172,818 $291,441 $172,818 $464,259
10000 $1,457,204,140 $1,387,206,088 $2,844,410,228 $ 104,623 $145,720 $138,721 $284,441
15000 $1,457,204,140 $1,911,168,332 $3,368,372,472 $ 104,792 $97,147 $127,411 $224,558
20000 $1,457,204,140 $2,777,802,610 $4,235,006,750 $ 173,327 $72,860 $138,890 $211,750
25000 $1,457,204,140 $4,328,933,345 $5,786,137,485 $ 310,226 $58,288 $173,157 $231,445
30000 $1,457,204,140 $6,906,384,964 $8,363,589,104 $ 515,490 $48,573 $230,213 $278,786
35000 $1,457,204,140 $10,851,981,890 $12,309,186,030 $ 789,119 $41,634 $310,057 $351,691
40000 $1,457,204,140 $16,507,548,550 $17,964,752,690 $ 1,131,113 $36,430 $412,689 $449,119
45000 $1,457,204,140 $24,214,909,369 $25,672,113,509 $ 1,541,472 $32,382 $538,109 $570,491
50000 $1,457,204,140 $34,315,888,770 $35,773,092,910 $ 2,020,196 $29,144 $686,318 $715,462
55000 $1,457,204,140 $47,152,311,179 $48,609,515,319 $ 2,567,284 $26,495 $857,315 $883,809
60000 $1,457,204,140 $63,066,001,022 $64,523,205,162 $ 3,182,738 $24,287 $1,051,100 $1,075,387
65000 $1,457,204,140 $82,398,782,723 $83,855,986,863 $ 3,866,556 $22,419 $1,267,674 $1,290,092
y = 0.0004557659x2 - 13.6560248362x + 229,704.2672067640
124000
125000
126000
127000
128000
129000
130000
131000
132000
133000
134000
135000
10000 11000 12000 13000 14000 15000 16000 17000
Var
iab
le C
ost
pe
r A
&A
S C
on
trac
tor
Number of A&AS Contractors
Variable Cost Curve
2013 2010 2012 2011
Poly. (2013 2010 20122011)
Formula
Source: Valadez, Mallette, & Albrecht (2013) Adapted from Budget tables of the A&AS for 2011-2013 (2013 base year)
Research in Higher Education Journal
Applying marginal analysis, page 13
70000 $1,457,204,140 $105,492,480,707 $106,949,684,847 $ 4,618,740 $20,817 $1,507,035 $1,527,853
Source: Valadez, Mallette, & Albrecht (2013) Adapted from the A&AS budget projections for 2013 and using a four-year historical variable cost
formula.
Figure 2. Graphical Analysis of Costs
$-
$100,000
$200,000
$300,000
$400,000
$500,000
$600,000
$700,000
$800,000
$900,000
$1,000,000
Do
llar
Co
st p
er
Co
ntr
acto
r
Number of A&AS Contractors
Cost Analysis
Marginal Cost
Avg Fixed Cost
Avg Var Cost
Avg Total Cost
Source: Valadez, Mallette, & Albrecht (2013) Adapted from projected numbers of the A&AS budget for 2013
Research in Higher Education Journal
Applying marginal analysis, page 14
Table 3. Marginal Analysis
(A) (B) (C) (D) (E) (F) (G)
Number of
Contractors
Price Total Cost Total Revenue Marginal
Cost
Marginal
revenue
Profit/Loss
0 $262,514 $ 262,514 $0 -$262,514
5000 $262,514 $ 2,321,295,593 $1,312,568,627 $464,207 $262,514 -$1,008,726,965
10000 $262,514 $ 2,844,410,228 $2,625,137,255 $104,623 $262,514 -$219,272,974
15000 $262,514 $ 3,368,372,472 $3,937,705,882 $104,792 $262,514 $569,333,410
20000 $262,514 $ 4,235,006,750 $5,250,274,510 $173,327 $262,514 $1,015,267,760
25000 $262,514 $ 5,786,137,485 $6,562,843,137 $310,226 $262,514 $776,705,652
30000 $262,514 $ 8,363,589,104 $7,875,411,765 $515,490 $262,514 -$488,177,339
35000 $262,514 $ 12,309,186,030 $9,187,980,392 $789,119 $262,514 -$3,121,205,638
40000 $262,514 $ 17,964,752,690 $10,500,549,020 $1,131,113 $262,514 -$7,464,203,671
45000 $262,514 $ 25,672,113,509 $11,813,117,647 $1,541,472 $262,514
-
$13,858,995,861
50000 $262,514 $ 35,773,092,910 $13,125,686,275 $2,020,196 $262,514
-
$22,647,406,635
Total A&AS
Contractors
Employed
by DOD
Price Total Cost Total Revenue Marginal
Cost
Marginal
revenue
Profit Paid
22,188 $262,514 $ 4,809,317,360 $5,824,585,210 $262,514 $262,514 $1,015,267,850 Source: Valadez, Mallette, & Albrecht (2013) Adapted from the A&AS budget projections for 2013, using a four-year historical variable cost
formula, an assumed wrap rate for the price entry, and solving for the number of A&AS contractors using Excel parameter solver.
Figure 3. Cost and Revenue Analysis
Source: Valadez, Mallette, & Albrecht (2013) Adapted from the A&AS budget projections for 2013, using a four-year historical variable cost
formula, and an assumed wrap rate for the price entry.
-30,000.00
-20,000.00
-10,000.00
0.00
10,000.00
20,000.00
30,000.00
40,000.00
DO
LLA
RS
(Mill
ion
s)
Number of A&AS Contractors
Total Cost, Revenue and Profits
Total Cost
Total Revenue
Profit/Loss
Research in Higher Education Journal
Applying marginal analysis, page 15
Figure 4. The Intersection of Marginal Cost and Marginal Revenue
Source: Valadez, Mallette, & Albrecht (2013) Adapted from the A&AS budget projections for 2013, using a four-year historical variable cost
formula, and an assumed wrap rate for the price entry.
Figure 4a. The Intersection of Marginal Cost and Marginal Revenue Zoom in
Source: Valadez, Mallette, & Albrecht (2013) Adapted from the A&AS budget projections for 2013, using a four-year historical variable cost
formula, and an assumed wrap rate for the price entry.
$0
$500,000
$1,000,000
$1,500,000
$2,000,000
$2,500,000
0 10000 20000 30000 40000 50000 60000
DO
LLA
RS
Total A&AS Contractors Employed by DOD
Marginal Cost/Revenue
Marginal Cost
Marginal revenue
$50,000
$250,000
$450,000
$650,000
$850,000
$1,050,000
$1,250,000
20000 25000 30000 35000 40000
DO
LLA
RS
Total A&AS Contractors Employed by DOD
Zoom in of Intersection of Marginal Cost/Marginal Revenue
Marginal Cost
Marginal revenue