Embed Size (px)
Citation preview
International Journal of Testing, 00: 1–22, 2016 Copyright OC Taylor & Francis Group, LLC ISSN: 1530-5058 print / 1532-7574 online DOI: 10.1080/15305058.2015.1108322
Applying Evidence-Centered Design for the Development of Game-Based Assessments in Physics Playground
Yoon Jeon Kim
Department of Social Science and Policy Studies, Worcester Polytechnic
Institute, USA
Russell G. Almond and Valerie J. Shute Educational Psychology and Learning Systems, Florida State University,
USA
Game-based assessment (GBA) is a specific use of educational games that em-
ploys game activities to elicit evidence for educationally valuable skills and knowl-
edge. While this approach can provide individualized and diagnostic information
about students, the design and development of assessment mechanics for a GBA
is a nontrivial task. In this article, we describe the 10-step procedure that the de-
sign team of Physics Playground (formerly known as Newton’s Playground) has
established by adapting evidence-centered design to address unique challenges
of GBA. The scaling method used for Physics Playground was Bayesian net-
works; thus this article describes specific actions taken for the iterative process
of constructing and revising Bayesian networks in the context of the game Physics
Playground.
Keywords: Bayesian networks, evidence-centered design, game-based assessment, stealth assessment
Correspondence should be sent to Yoon Jeon Kim, Department of Social Science and Policy
Studies, Worcester Polytechnic Institute, 100 Institute Rd. 315 Salisbury Laboratories, Worcester, MA
01609, USA. E-mail: [email protected]
Color versions of one or more of the figures in the article can be found online at
www.tandfonline.com/hijt.
Do
wn
load
ed b
y [
68
.84
.16
.83
] at
12
:23
21
Dec
emb
er 2
01
5

2 KIM, ALMOND, SHUTE
INTRODUCTION
Recently, interest in using digital games to assess and support learning has in-
creased (Baker & Delacruz, 2008; Behrens et al., 2010; Mislevy et al., 2014;
Shute et al., 2009). Game-based assessment (GBA) uses game activities as tasks
to elicit evidence for complex skills. Advocates of GBA (e.g., DiCerbo, 2014;
Mislevy et al., 2012; Shute, 2011) list several advantages of GBA. First, digital
games can provide complex, authentic tasks based on modern theories of learning
and cognition. Second, games require constant interaction between the player and
the game yielding copious data that can be used to build a comprehensive student
model. Finally, because of the engaging nature of games, GBA can avoid possible
“text anxiety” that leads to underperformance of learners, which in return can
increase assessment accuracy (Sundre & Wise, 2003).
Developing GBA can be challenging (Almond et al., 2014; DiCerbo, 2014;
Mislevy et al., 2012; Zapata-Rivera & Bauer, 2012) because game mechanics
must be aligned with learning and assessment (Habgood & Ainsworth, 2011).
Furthermore, many game tasks require multiple competencies for successful ex-
ecution, and untangling the contributions of the multiple competencies can be
quite difficult. Evidence-centered assessment design (ECD; Mislevy, Steinberg, &
Almond, 2003) provides a language for expressing the relationship between multi-
ple aspects of proficiency and performance, and stealth assessment (Shute, 2011)
extends ECD to game-based assessment. Bayesian networks, with their graphical
representation of probability distributions, provide a convenient representation for
building scoring engines that untangle multivariate relationships.
This article describes a development process for game-based assessment, with
emphasis on the phase of constructing assessment machinery using Bayes net-
works. We first briefly describe ECD in the context of GBA, and then review
how Bayesian networks have been used in educational assessment. The 10-step
framework presented in this article describes procedure used to build the assess-
ment machineries and tasks undergirding Physics Playground (formerly called
Newton’s Playground, see Shute & Ventura, 2013).
BACKGROUND
Application of ECD in GBA
ECD lays out the structures of assessment as an evidentiary argument that connects
what students do, say, or create in given contexts with general skills and knowledge
(Mislevy et al., 2003). The ECD process addresses a series of questions that should
be asked in any assessment design; what, where, and how are we measuring, and
how much do we need to measure. The answers to these questions are recorded in
several design objects called competency, evidence, task, and assembly models;
Do
wn
load
ed b
y [
68
.84
.16
.83
] at
12
:23
21
Dec
emb
er 2
01
5

APPLICATION OF ECD FOR GAME-BASED ASSESSMENTS3
FIGURE 1
Four focal models of Evidence-Centered Design (Mislevy, Almond, & Lukas, 2003).
the collection of all models used for a particular assessment is called the conceptual
assessment framework (CAF; Figure 1). These models then guide the development
of the operational machinery of assessment, such as tasks, rubrics, and statistical
models (Almond et al., 2015; Mislevy et al., 2003).
Competency Models: What Are We Measuring?. A competency model
(CM) reflects the claims (stars in Figure 1) that the assessor wishes to make about
students at the end of the assessment. The claims are used to define CM vari-
ables, which describe aspects of skills, knowledge, traits, and attitudes of interest.
The distribution of the CM variables in the target population is described with a
statistical model. ECD explicitly allows multidimensional CMs, and Bayesian net-
works provide graphical language for expressing multidimensional relationships
(Almond et al., 2015).
Evidence Models: How Do We Measure the Competencies?. A student
interacting with assessment tasks produces work products. In GBA, the work
product typically consists of a transcript of player activities (typically captured in
a log file) and the state of the system at the end of a task. An evidence model
(EM) provides rules for updating the CM given the work project. An EM has two
parts: the evidence rules and the statistical model. The evidence rules (the right
side of the EM in Figure 1) define the observables: salient features of the work
product that provide evidence about one or more competencies (Mislevy et al.,
2003). In GBA, evidence rules are often expressed in computer code (e.g., Did
the player successfully complete a game level? Did the player use a particular
tool in the solution of a problem?). The statistical model describes relationships
Do
wn
load
ed b
y [
68
.84
.16
.83
] at
12
:23
21
Dec
emb
er 2
01
5

4 KIM, ALMOND, SHUTE
between the competency variables and the observables, particularly expressing
the probability that a student with a given profile will produce a particular value
for each observable variable. Almond and Mislevy (1999) suggested expressing
evidence models as Bayesian network fragments that are attached to the CM
Bayesian network during scoring.
Task Models: Where Do We Measure the Competencies? A task is a
unit of activity that is attempted by the student which produces a work product. A
task can be as simple as a multiple choice question, but ECD encourages
assessment designers to think about more complex performance tasks as well. In
GBA, a task is a self-contained unit of game play. In some games, game play
is naturally divided into levels, and tasks correspond to the game levels. In other
cases, a task may be a segment of a more complex interaction, and defining the task
boundary can be challenging (Mislevy et al., 2012). A task model (TM) describes
a family of related tasks (often all of which are variations on a single prototype),
and task model variables express features of a task that can be manipulated to
both create variants and change the evidentiary strength or focus (Almond et al.,
2014).
Assembly Model: How Much Do We Need to Measure?. An assembly
model (AM) specifies how the CMs, EMs, and TMs work together to generate
sufficient evidence to form a valid assessment (Almond et al., 2015). In partic-
ular, the AM specifies how much evidence is required about the value of each
competency variable. The AM ensures comparability between multiple possible
forms, particularly in applications such as computer adaptive testing where each
student receives a unique form (Mislevy & Levy, 2006). Similarly, addressing
this comparability issue in GBA can be challenging because players have more
freedom in games compared to conventional assessment, and their choices in the
game can lead to variations in the focus, scope, and strength of the evidence (Kim,
2014; Mislevy et al., 2012).
The CM, EMs, and AM together make up the measurement model of the as-
sessment. To build a scoring engine, test designers must construct a mathematical
realization of the CM and an EM for each task that might be selected by the
AM. This article looks at one possible realization of those models using Bayesian
networks. Note that a complete CAF looks at two additional models: presenta-
tion and delivery system models. The presentation model describes how tasks
are rendered on different platforms (e.g., desktop computer vs. smart phone).
The delivery system model describes other factors related to the assessment en-
vironment, including eligibility to participate in the assessment. In the class-
room use of GBA, instructions given by the teacher could influence how students
interact with the game (Slota, 2014). For example, demonstrating how simple
machines work in the classroom before the students play Physics Playground
Do
wn
load
ed b
y [
68
.84
.16
.83
] at
12
:23
21
Dec
emb
er 2
01
5

APPLICATION OF ECD FOR GAME-BASED ASSESSMENTS5
as part of curriculum helps focus the students’ gameplay on creating simple
machines.
Bayesian Networks in Educational Assessment
Bayesian networks (or Bayes nets) provide a graphical notation for describing
complex, multivariate probability models (Pearl, 1988; Almond et al., 2015). In a
Bayes net, variables separated in the graph are conditionally independent. Exploit-
ing these independence relationships produces efficient algorithms for calculating
probabilities; in particular, the conditional probability that a student has a given
competency profile, given a pattern of evidence collected about that student. Mod-
eling both competency and observable outcome variables as discrete allows the
use of commercially supported software such as Netica (Norsys, 2012) to score
the assessment.
Constructing a Bayes net involves two main steps. First, psychometricians
working with domain experts define the targeted competency and observable
variables, and then draw an acyclic directed graph that captures the important
conditional independence relationships. Second, for each variable in the model, the
design team specifies the conditional probability of that variable given its parents
(i.e., nodes from which an arrow extends connecting them to the child node) in the
graph. In the case of a discrete Bayes net (one in which all variables are discrete),
this takes the form of a conditional probability table (CPT) that gives the probability
of each state of the child variable given each possible configuration of parents in the
graph. As these tables can be quite large (they grow exponentially with the number
of parent variables), psychometricians often use a parametric representation for
the tables (Almond et al., 2001, 2015). Almond (2015) described a class of models
for CPTs based on multivariate item response theory (IRT) models, for which the
designers must choose a combination function (e.g., compensatory or conjunctive)
and a link function (e.g., graded response or partial credit). In Step 4 of our process,
the designers picked both a parameterization (e.g., compensatory or conjunctive)
and a set of parameters (difficulty and discrimination) for each observable. (Note
that in a Bayes net, the parameterization decision is made at the node level and
not the assessment level.)
Generally, there are two approaches to specifying parameters. The first is to
directly specify them. The resulting Bayes net can then immediately be used to
score the assessment. The Bayes net using “expert numbers” often has a reliability
and validity comparable to (or possibly better than) a number right assessment
(Shute, Hansen, & Almond, 2008), because thinking about the evidence required
to build the Bayes net may lead to better task designs. The second approach is to
use the expert numbers as prior distributions for the CPTs (Almond, 2015). This
still allows the Bayes net to be used immediately for scoring, but also allows the
CPTs to be updated with data from field studies.
Do
wn
load
ed b
y [
68
.84
.16
.83
] at
12
:23
21
Dec
emb
er 2
01
5

6 KIM, ALMOND, SHUTE
Physics Playground
Physics Playground (PP) is a two-dimensional physics game developed to assess
players’ qualitative understanding of Newton’s three laws of physics, and also their
persistence. The core mechanic of PP is that the player draws physical objects on
the screen that “come to life” following the basic laws of physics, and are intended
to move a ball to a target (i.e., balloon on the screen). Particular objects are called
agents of motion—simple machine-like objects that execute force to the ball thus
causing the ball to move. The game levels focus on four primary agents of motion:
ramp, lever, pendulum, and springboard. Therefore, when players draw objects that
represent agents of motion, they provide evidence relative to their understanding
of particular aspects of qualitative physics.
PP stores a complete transcript of players’ activities during each game level.
This is the work product for the game-level, which is the ECD task. The game
engine contains rules of evidence; that is, code that identifies which agents of
motion were used in each step and code that calculates whether the player’s
solution uses a certain number of objects qualifying for a gold or silver trophy (see
Shute and Ventura, 2013 for detailed information about the game engine). A gold
trophy indicates an “elegant” solution (i.e., one with a limited number of objects,
in most cases less than three objects), while a silver trophy simply means that the
player has solved the problem, using more than three objects.
In a field study with 167 middle school participants (grades 8–9), Shute and
colleagues (2013) investigated whether stealth assessment in PP satisfied psycho-
metric criteria. Relevant in-game performance measures in PP (e.g., the number of
silver and gold trophies obtained) significantly correlated with external measures
of physics understanding, suggesting construct validity of PP. In particular, the
number of gold trophies per agent was significantly correlated with the external
physics test scores (ramp r = 0.27, lever r = 0.22, pendulum r = 0.31, springboard
r = 0.40, p < 0.01).
THE 10-STEP PROCEDURE OF BUILDING BAYES
NETS IN GBA
ECD as described in Mislevy and colleagues (2003) is a generic procedure for
developing assessments. In any particular assessment design process, various parts
of the framework may take on more or less importance. In GBA, the task must
prompt the student to produce a work product that will provide evidence for one
or more relevant competencies. This can be more complex in GBA because the
task must also be aligned with the core mechanics of the gameplay (Mislevy et al.,
2012). Mislevy and associates (2014) proposed an extension called evidence-
centered game design (ECgD) to align the game and the evidentiary reasoning
Do
wn
load
ed b
y [
68
.84
.16
.83
] at
12
:23
21
Dec
emb
er 2
01
5

APPLICATION OF ECD FOR GAME-BASED ASSESSMENTS7
FIGURE 2
10-step procedure of building Bayesian nets in game-based assessment.
mechanisms in GBA. Similar to ECgD, the 10-step procedure we describe here al-
lows game and assessment designers and developers to iteratively design, develop,
and revise game-based assessment systems and revisit with particular emphasis
on constructing Bayes nets.
Figure 2 provides an overview of the ten steps that we established and applied in
the development of PP. This 10-step procedure can be applied for any game-based
assessment using Bayes nets as the scoring engine. These steps are organized into
four distinct phases: (a) designing levels in PP (i.e., Task Authoring), (b) creating
assessment models (i.e., the CAF), (c) putting all assessment models together
using Bayes nets as assessment machinery (i.e., Nuts & Bolts), and (d) evaluating
and refining the assessment models (i.e., Debugging). Although Figure 2 suggests
a linear flow through the phases, in its actual implementation the process should
be iterative, as indicated by the dashed arrows. That is, problems that may show up
in later steps often require revisiting design decisions made earlier. The following
sections describe each step, with particular emphasis on those steps necessary to
build the Bayesian networks used to score PP.
Step 1: Identify key variables
First, the design team must (a) determine the goals and purposes of the assessment,
(b) define the competencies of interest relative to the assessment, (c) describe the
relationship(s) among each competency variable and the range of the competency
levels that can be measured in the game, and (d) identify in-game observables that
can provide evidence for one or more competencies. This step produces “working
Do
wn
load
ed b
y [
68
.84
.16
.83
] at
12
:23
21
Dec
emb
er 2
01
5

8 KIM, ALMOND, SHUTE
definitions,” which will be revised as later steps in the process reveal limits of
what can be observed in the game.
The nature of this first step depends on whether the game uses new mechanics
or adapts an existing game. As PP was partially based on an existing game (i.e.,
Crayon Physics Deluxe), the design team spent a considerable amount of time
during this step playing and analyzing various solutions to Crayon Physics game
levels. During this time, we noted how different game levels could be solved with
different agents of motion. We also noticed that the Crayon Physics game engine
treated the mass of an object as simplistically related to its volume (area). Because
confusing mass and volume is a common misunderstanding in qualitative physics,
we realized the need to create a different mechanism for expressing the mass of
an object (density of lines). Shute and Ventura (2013) provided more detailed
information about this adaptation. Additionally, activities in this phase include
general activities of the domain analysis phase of ECD (Mislevy et al., 2003) such
as cognitive task analysis, literature review, and subject-matter expert interviews
(both game and domain experts). For PP, the design team consulted with two
physics experts who reviewed gameplay and identified physics principles needed
to solve problems in the game.
It is important during this first step to start drawing graphical models that
represent the relationships among competency variables and between competency
and observable variables using simple drawing tools (e.g., white boards, presenta-
tion software). As the authoring of game levels preceded, an augmented Q-matrix
(Figure 3) was used to track the progress. The augmented Q-matrix documents
the relationship between observable variables associated with tasks and compe-
tency variables (the traditional role of the Q-matrix; Tatsuoka, 1983). It also has
additional columns that capture detailed information about tasks (e.g., game level
difficulty, task ID) that later experts used for task-specific parameters. Note that the
Q-matrix combines information from the evidence models (which proficiencies
are tapped) and the assembly model (how many tasks are there of each type). We
also used it to check that we had sufficient evidence for each proficiency variable
(see Almond et al., 2015).
Step 2: Draw Network Structure
Based on the artifacts from Step 1, the design team decides the structure of the
Bayesian network. The complete Bayes net, sometimes called a motif (Almond
et al., 2015), contains all of the competency variables and all of the observables
from every task. To make the construction task more manageable, the motif is bro-
ken into a core competency model—which represents the distribution of the com-
petency profiles in the target population—and a collection of Bayes net fragments
called links—one for each task. Note that the graphical structure for task-related
links from a common TM is usually the same, so the graphical structure for a link
Do
wn
load
ed b
y [
68
.84
.16
.83
] at
12
:23
21
Dec
emb
er 2
01
5

APPLICATION OF ECD FOR GAME-BASED ASSESSMENTS9
Downloaded by [68.84.16.83] at 12:23 21 December 2015
FIGURE 3
An augmented Q-matrix.
9

APPLICATION OF ECD FOR GAME-BASED ASSESSMENTS 11
FIGURE 4
Two versions of the physics competency model in PP.
is associated with its EM. The Bayes net fragment for a link generally has different
values for the CPTs but the same graphical structure as the fragment associated
with the EM. Therefore, at this step, Bayes net fragments are only needed for the
CM and each unique EM.
Because all of the tasks in PP shared the same work product (i.e., objects
drawn by the player) and hence the same observables in PP, only a single EM
structure was needed. We built the Bayes nets and fragments using both the Netica
(Norsys, 2012) graphical user interface and RNetica (Almond, 2013), an interface
for driving Netica from R (R Core Development Team, 2013). RNetica could read
details about the game level from the augmented Q-matrix, calculate conditional
probability tables appropriate to the link, and convert the generic EM fragment
to a task-specific link. It could also adjoin the fragment with the CM to create a
one-task motif for validating the links.
The initial network structure will likely be revised (usually simplified) as the
design process proceeds. Figure 4 shows two versions of the physics competency
model for PP. The model on the left is the initial model. The subject-matter
expert suggested two facets of understanding of Newton’s laws: one for problems
using linear momentum and one for problems using angular momentum. This
results in a mezzanine layer between the overall proficiency (Newton’s Laws)
and the four nodes representing the four agents of motion. The final version
(shown on the right) removed the mezzanine layer for two reasons. First, there
were no direct observables for the two variables at this layer, and the strengths of
relationships between variables that cannot be directly measured are difficult to
estimate (Almond, Yan, & Hemat, 2008). Second, the distinction between the two
was only that levels involving ramp solutions can be solved without knowledge
of angular momentum, and there were not enough levels involving only ramps to
provide good evidence of the distinction between knowledge of linear and angular
momentum. It is quite common for the CM to be simplified as the development
process unfolds, as the domain experts will often identify more subtle distinctions
of knowledge than the assessment can meaningfully separate.
Do
wn
load
ed b
y [
68
.84
.16
.83
] at
12
:23
21
Dec
emb
er 2
01
5
10 KIM, ALMOND, SHUTE
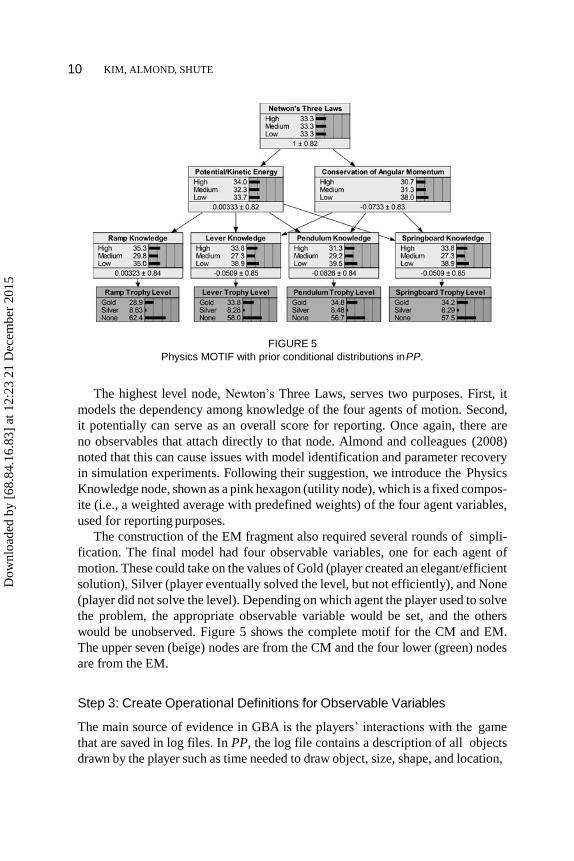
FIGURE 5
Physics MOTIF with prior conditional distributions in PP.
The highest level node, Newton’s Three Laws, serves two purposes. First, it
models the dependency among knowledge of the four agents of motion. Second,
it potentially can serve as an overall score for reporting. Once again, there are
no observables that attach directly to that node. Almond and colleagues (2008)
noted that this can cause issues with model identification and parameter recovery
in simulation experiments. Following their suggestion, we introduce the Physics
Knowledge node, shown as a pink hexagon (utility node), which is a fixed compos-
ite (i.e., a weighted average with predefined weights) of the four agent variables,
used for reporting purposes.
The construction of the EM fragment also required several rounds of simpli-
fication. The final model had four observable variables, one for each agent of
motion. These could take on the values of Gold (player created an elegant/efficient
solution), Silver (player eventually solved the level, but not efficiently), and None
(player did not solve the level). Depending on which agent the player used to solve
the problem, the appropriate observable variable would be set, and the others
would be unobserved. Figure 5 shows the complete motif for the CM and EM.
The upper seven (beige) nodes are from the CM and the four lower (green) nodes
are from the EM.
Step 3: Create Operational Definitions for Observable Variables
The main source of evidence in GBA is the players’ interactions with the game
that are saved in log files. In PP, the log file contains a description of all objects
drawn by the player such as time needed to draw object, size, shape, and location,
Do
wn
load
ed b
y [
68
.84
.16
.83
] at
12
:23
21
Dec
emb
er 2
01
5

12 KIM, ALMOND, SHUTE
as well as information about the level as a whole (e.g., whether a gold or silver
trophy was earned, the duration of time spent on the level, and how many times the
player restarted the level). Much of this information is low level, and higher level
summaries were needed to enter into the Bayes net observables. In particular, the
design team early on identified the most applicable agent(s) of motion, per level, to
solve the level. This required identifying whether an object the player had drawn on
the screen was intended to be a ramp, lever, springboard, pendulum, or something
else. To this end, the design team of PP needed to develop an identification
system based on specific rules of evidence that could distinguish among the four
agents (Shute et al., 2013 describe the agent identification system). Deciding an
appropriate level of indicators is an important issue that the design team carefully
needs to decide. While low-level features can be directly used, it is often more
efficient to create high-level summary indicators to (1) generate scores that can be
more human interpretable and (2) reduce complexity of the BNs.
Building such system was possible because of the built-in physics engine of
the game, Box2D (Catto, 2013). Because the agent identification system relied
on much of the same code as the game engine, it was implemented as part of the
game mechanism, and the log file format was augmented to include the output of
the agent identification system.
Step 4: Parameterization of Conditional Probability Tables
While experts could provide priors for conditional probability tables (CPTs) for
each link for each game level, it can be a daunting task because it requires experts
to consider a large number of configurations (Almond, 2010). To make this task
manageable, design patterns (Mislevy et al., 2003) can be used to select parame-
terizations and experts’ judgments on task difficulty and discrimination to set the
initial parameter values. The CPTs for most observables can use the conjunctive,
disjunctive, or compensatory design patterns (Almond et al., 2001, 2015). This in-
formation is recorded in the augmented Q-matrix created in Step 1 and completed
during this step.
As mentioned earlier, PP awards a silver trophy for any solution to a level
in the game, but only awards a gold trophy for an efficient solution that only
uses a few objects. Therefore, the observables are naturally ordered categorical
variables (with categories of gold, silver, and none). There are two commonly used
models for ordered categories: the graded response model (Samejima, 1997) and
the generalized partial credit model (GPCM, Muraki, 1992). While both of these
are IRT models and assume a single continuous competency variable, Almond
and colleagues (2001) adapted the graded response model for multiple discrete
competency variables using the common design patterns.
Although design patterns based on the graded response model have been shown
to work well in other applications (e.g., ACED—Shute, Hansen, & Almond, 2008),
Do
wn
load
ed b
y [
68
.84
.16
.83
] at
12
:23
21
Dec
emb
er 2
01
5

APPLICATION OF ECD FOR GAME-BASED ASSESSMENTS13
FIGURE 6
Roller Coaster and two possible solutions.
they did not work well in PP. For some levels, players could stumble on a solution
by randomly drawing things. In these levels, the distinction between the gold
and silver categories provided more evidence (i.e., showed higher discrimination)
than the distinction between silver and none. Other game levels were so difficult
that only a few players achieved a gold trophy. In those levels, the distinction
between silver and none provided the most evidence. The graded response model
was limited in that the discrimination had to be the same for each level of the
observable variable. The generalized partial credit model provided more flexibility,
so we adapted the models of Almond et al. (2001) to use the partial credit rather
than the graded response model (Almond et al., 2013; Almond, 2015). This new
approach required four parameter values from the expert: difficulty for silver,
difficulty for gold, discrimination for silver, and discrimination for gold for each
agent of motion per level.
Step 5: Elicit Prior Values
PP consisted of 74 different levels, each of which possessed four observable out-
come variables (corresponding to the four agents of motion). For each outcome
variable, a game designer assigned four values: two difficulty values ranging be-
tween –5 and 5 for the gold and silver trophies for that level, and two discrimination
values ranging between 0 and 2. We illustrate this process using Roller Coaster as
an example (Figure 6).
Roller Coaster is designed to have a medium-level difficulty, and the intention is
for players to use a springboard solution, which is already present in the level (i.e.,
the red bar hanging in the air), to propel the green ball to the balloon by attaching
a weight to the springboard (see the picture in the middle panel of Figure 6).
However, the design team noticed from a series of playtests that players could also
use a pendulum to solve the problem (see panel on the right side of Figure 6).
Table 1 reflects the design team’s knowledge about this level regarding difficulty
and discrimination power.
Do
wn
load
ed b
y [
68
.84
.16
.83
] at
12
:23
21
Dec
emb
er 2
01
5

14 KIM, ALMOND, SHUTE
TABLE 1
Experts’ Estimates on Roller Coaster’s Difficulty and Discrimination Parameters
Ramp Lever Pendulum Springboard
S G S G S G S G
Difficulty 3 4 3 4 1 2 1 2
Discrimination 0.1 0.4 0.3 0.6 0.5 0.9 0.5 0.8
S = Silver, G = Gold.
The first values represent difficulty for silver trophy and gold trophies, respec-
tively. As ramp and lever solutions are rarely used for this level, the difficulty for
silver and gold trophies for a ramp and lever solution were set high—as 3 and
4, respectively. Because pendulum and springboard solutions would be similarly
simple for this level, the difficulty for pendulum and springboard were set as 1
and 2, respectively. Again, gold trophies are always harder to achieve than silver
trophies. As ramp and lever trophies typically have less discrimination power than
pendulum and springboard trophies, the values for them are relatively lower than
the ones for pendulum and springboard.
Given these parameter estimates, we were able to calculate the CPTs for the
four observable variables. From the graph in Figure 5, each of the observables
has a single parent competency that can assume the values of Low, Medium, or
High. These competencies were assigned values of –0.97, 0, and +0.97 (the 17th,
50th, and 83rd percentiles of a normal distribution). Plugging these values and the
parameters from Table 1 into the GPCM equations (Muraki, 1992) yields the CPTs
shown Table 2. We should emphasize that Table 2 shows experts’ initial beliefs, and
TABLE 2
Prior CPTs for Each Observable Related to the Roller Coaster Level in the Game
Ramp Lever
Gold Silver None Gold Silver None
High 0.001 0.002 0.997 High 0.001 0.002 0.997
Medium 0.0005 0.0005 0.998 Medium 0.0005 0.0005 0.998
Low 0.0005 0.0005 0.998 Low 0.0005 0.0005 0.998
Pendulum Springboard
Gold Silver None Gold Silver None
High 0.050 0.121 0.828 High 0.044 0.106 0.850
Medium 0.006 0.032 0.962 Medium 0.006 0.032 0.962
Low 0.0006 0.008 0.992 Low 0.000 0.009 0.990
Do
wn
load
ed b
y [
68
.84
.16
.83
] at
12
:23
21
Dec
emb
er 2
01
5

APPLICATION OF ECD FOR GAME-BASED ASSESSMENTS15
the prior distribution should be further refined and updated as more observations
are entered. We developed an R software package (CPTTools; Almond, 2013) that
calculated the CPTs and then used RNetica to create both an EM fragment and
a level-specific motif—the EM fragment connected to the CM Bayes net—which
could be used to check if the parameters supplied by the game designer produced
reasonable inferences. This process was repeated for all 74 game levels.
Step 6: Construct Proxy Variables for Latent Variables (Optional)
Step 5 produced a complete set of Bayes nets (i.e., the CM and an EM fragment per
level). This produces the expert network, which can now be used to score a player.
The scores from the expert network are probably no worse than a simple count
of game levels solved. However, one of the advantages of using a full Bayesian
approach is that the prior opinions about the difficulty of the game levels can be
combined with data from field testing to refine the model parameters.
Estimating the parameters of models with latent competency variables (of
which Bayes nets are just one example) is tricky because the competency variables
are never directly observed. Although it is possible to use various forms of the
EM or MCMC algorithms, insufficient information about the latent variable can
cause problems with convergence (Almond, Yan, & Hemat, 2008). A further
complication in the case of PP was that we were using a new parameterization
for the CPTs, so new software would be needed to estimate the parameters of the
model (Almond, 2015).
To avoid some of these difficulties, we created proxy variables for the latent
competencies from the pretest and posttest. As both the pretest and posttest were
short, we combined the two tests and created four subscales focused on each of the
agents of motion. As the four subscales were short, we shrank them toward each
other using the procedure suggested by Wainer and colleagues (2001). As a first
pass at determining difficulties, we then divided the subscale scores into High,
Medium, and Low values by taking the one-third and two-third quantiles as the cut
points. Using the proxy variables in place of the latent variables allowed us to use
a simpler gradient descent algorithm in Step 8 rather than the more complicated
EM algorithm.
A possible drawback of the proxy variable approach is that correlation between
the Bayes net values and the pretest and posttest scores was one of the primary
planned validity measures for PP. The use of the proxy variables in calibration
(Step 8) would produce parameters that have maximum correlations. While the
validity estimates could be positively biased, as the correlation between the Bayes
net estimates and the pretest and posttest scores was fairly low, we thought that
such an optimistic estimate would provide information about whether the problem
was with the network parameters or the choice of observables. In particular, if
Do
wn
load
ed b
y [
68
.84
.16
.83
] at
12
:23
21
Dec
emb
er 2
01
5

16 KIM, ALMOND, SHUTE
FIGURE 7
An illustration of evidence identification and accumulation in PP.
the correlation is still modest even with this optimistic calibration it indicates that
more observable variables, or different tasks are needed to increase the evidence.
Step 7: Calculate Observable Variables from Game Log Files
According to the four-process architecture of Almond, Steinberg, and Mislevy
(2002), the scoring of an assessment consists of two phases: evidence identifi-
cation (EI)—calculating the observables from the work product, and evidence
accumulation (EA)—updating competency variables on the basis of observed out-
comes. In PP, the EA is a script running on top of the Bayesian networks written
in RNetica and the presentation process is the game engine (Figure 7).
The EI was a script written in Perl that extracted a vector of features (e.g.,
{RampTrophy:None, LeverTrophy:None, SpringboardTrophy:Silver, Pen-
dulumTrophy:None}) for each game level. For instance, consider the game level
Roller Coaster, described earlier. According to the EM, the EI process must (a)
identify the final agent of motion used in the solution, and (b) determine whether or
not the solution earned a silver or gold trophy. The EI process must also make one
other determination: whether to consider each variable as “observed” or “missing.”
If the player solved the level, then the rule was to observe only the solution. For
example, if the player solved the Roller Coaster level with a springboard, this pro-
vides minimal information about the player’s ability to use ramps or pendulums. If
the player does not solve the level, only the agents the designer thought applicable
are considered as “observed.” In the Roller Coaster level, only springboard and
pendulum agents were considered to be applicable. If the player did not solve the
level, SpringboardTrophy and PendulumTrophy would be considered observed
(with value = None) and the other two observables would be considered missing.
Conceptually, this should all be handled with the EI process. However in prac-
tice, the boundaries of the EI process extend beyond the Perl script. As the rules
for identifying agents required the physics engine, that part of the EI process
was implemented within the game engine. As the rules for setting observables
required level-specific data not in the log files, the logic of which observable to set
to “missing” was handled by the RNetica code implementing the EA process.
Do
wn
load
ed b
y [
68
.84
.16
.83
] at
12
:23
21
Dec
emb
er 2
01
5

APPLICATION OF ECD FOR GAME-BASED ASSESSMENTS17
Much of the development of the EI process was done in a rapid prototyping
mode. The game output would be sent through the Perl script and the output
checked against human viewing of replays of the game levels. In later stages, the
results would also be run through the Bayes nets to score the players involved in
the field test. In several cases, this revealed problems with the definitions of some
observables that needed to be resolved. Fortunately, both Perl and R support rapid
prototyping.
Step 8: Updating CPTs
We scored the field test data with the expert Bayes nets. For each student, we
took the expected value of the highest level node (i.e., Newton’s Three Laws),
assigning a value of 2 to High and 1 to Medium. The correlation with this expected
a posteriori score with the posttest was low (around 0.1), so we decided to improve
the Bayes nets by calibrating the CPTs to the pilot test data.
If we assume that the parameters for each CPT are independent given the
values of the variables, then the sufficient statistic for each CPT is the counts
of observed cases in the cross-tabulation of the parent variables and the child
variables (Spiegelhalter & Lauritzen, 1990). In each case, the parent variable
is a latent competency instead of an observable variable. Therefore, the proxy
variables constructed in Step 6 were used in place of the latent competencies. The
parameters of the GPCM could be learned via a simple gradient descent algorithm
implemented in the CPTTools package (Almond, 2015).
Note that the data for some tables was fairly sparse, as for many levels there was
one or more agents which were rarely used in solutions. We guarded against this
in two ways. First, if players never successfully solved the level with a particular
agent, then the CPT for that table was left at the priors. Second, the prior CPT was
multiplied by 10 to produce pseudo observations, which were then added to the
data from the field test. This is similar to the sometimes used trick of adding half
to all cells of a contingency table where some of the cells are zero. The weight of
10 was chosen as a good balance between letting the CPT for a level be influenced
by a few observations and letting the CPT for a level with many observations be
mainly data driven. Using this method, we were able to bring the correlation with
the posttest up to around 0.36, closer to the correlation of the number of gold
trophies with the posttest score.
The proxy variables are a less than ideal solution as we expect that the networks
calibrated using them will have a higher correlation with the posttest scores than
if we used only data from the game. A better way to calibrate the CPTs is to use
an EM algorithm, which alternates between calculating expected values for cell
counts (the sufficient statistics for the CPTs) and maximizing the parameter values
(Spiegelhalter & Lauritzen, 1990). Netica implements this learning algorithm
but only in the special case where the table is parameterized as a collection of
Do
wn
load
ed b
y [
68
.84
.16
.83
] at
12
:23
21
Dec
emb
er 2
01
5

18 KIM, ALMOND, SHUTE
independent Dirichlet distributions (one for each row). This does not work well
for educational measurement as often the data for some rows of the CPT is much
sparser than for others (Almond et al., 2015). A more complete implementation
of this EM algorithm is planned for later work.
Step 9 and Step 10: Debugging
Complex systems, like GBAs, are rarely perfect on the initial implementation.
Instead, they may contain flaws in conceptualization, specification, or implemen-
tation that must be uncovered and corrected. In GBAs, an additional problem
occurs in that players can approach the game in a way that is quite different
from the approach envisioned by the designers. Almond and colleagues (2013)
described some of the debugging procedures used with PP. We briefly review
them here.
First, completing Step 8 produced a pair of difficulty and discrimination pa-
rameters for each game level and agent. The first level of debugging was to look
for excessively low and high difficulty or discrimination values. For cases with
unusual parameter values, the next step was to look at the estimated CPTs and the
counts of trophies by relevant skill. In some cases, there was no problem (i.e., the
gradient descent algorithm sometimes converged to a point at the tail of the IRT
curve but still produced reasonable CPTs). If the CPT looked strange as well, this
prompted a review of the game level. In one case, we discovered that an observable
was accidently reverse coded.
Second, we constructed evidence balance sheets (Almond et al., 2013; Madigan,
Mosurski & Almond, 1997) for each student playing through the game. The
evidence balance sheet is a graphical representation of how the probability of a
high level of “Newton’s Three Laws” changes as evidence from each game level
arrives from the system (Figure 8). Sudden jumps in the probability—that is, levels
with high weights of evidence—could indicate a possible problem. Viewing the
replays for levels with high weights of evidence could reveal problems with a
player’s game strategy.
For instance, one approach taken by players in some anomalous levels was
called stacking. In stacking solutions, players exploited a feature of the game
that if a thin object/line was drawn under the ball, the ball would jump on top
of it. While this allowed players to, say, draw the arm of a lever under the ball,
it also allowed players to move the ball around the screen by stacking multiple
objects under it. Using stacking, players were able to solve somewhat difficult
levels without applying much knowledge of qualitative physics. The prevalence of
stacking led us to revise both the game mechanics (putting limits on the number of
objects that could be drawn) and the agent identification rules (to avoid classifying
stacks as simple machines).
Do
wn
load
ed b
y [
68
.84
.16
.83
] at
12
:23
21
Dec
emb
er 2
01
5

APPLICATION OF ECD FOR GAME-BASED ASSESSMENTS19
FIGURE 8
An example of balance sheet.
This example illustrates a larger conceptual problem in the way the field
study was conceived and the game was framed. When the design team play
tested the game under development, our focus was on particular agents of mo-
tion. Although there was no formal reward system, players would receive credit
from their peers for solutions that used the agents of motion in creative and
interesting ways. During the field test, however, the players were told that the
player who earned the most trophies (with gold counting twice as much as sil-
ver) would receive an extra $25 gift card. This encouraged the players to treat
PP as a game, getting through the levels using any means possible. It is possi-
ble that with different framing, for example, allowing players to show off their
best solution in front of the class, the players would focus more on physics and
creativity.
Do
wn
load
ed b
y [
68
.84
.16
.83
] at
12
:23
21
Dec
emb
er 2
01
5

APPLICATION OF ECD FOR GAME-BASED ASSESSMENTS 21
DISCUSSION
While the 10-step procedure described here focuses on constructing Bayes nets,
many of the steps are still applicable when different approaches (e.g., IRT) are
used as a scoring engine. For example, if the score was simply a tally of the
number of levels the player completed, Step 5 would still require the designers to
decide if all levels should be weighted equally or if some should be given extra
weight. However, because Bayes nets are so flexible, they did require the design
team to spend more time on certain steps to explore alternative representations.
In particular, the flexibility of Bayes nets to model dependent observables from
a single game level was an important part of the early conceptualization of the
game-based assessment, even though in later iterations much of the complexity
was removed from the scoring model. Because of that flexibility, a more deliberate
approach to design (in our case ECD; Almond et al., 2014; Mislevy et al., 2003,
2014) was necessary.
It is fairly simple to get a Bayes net model up and running quickly. This
was especially true once the design team had built scripts using RNetica to con-
vert the augmented Q-matrix into Bayes nets. One consequence of this building
Bayes nets quickly meant that the design team could inspect and evaluate the
amount of evidence from game levels under various circumstances and then ad-
just the game accordingly. This supports an iterative development of the game-
based assessment. As demonstrated in Almond and colleagues (2013), focusing
on evidence provided by the levels can also be used to help validate and de-
bug the game. On the other hand, if a game-based assessment was intended
for high-stakes purposes, a more careful definition of the latent ability nodes
(and a better external test to serve as a proxy for the latent node) would be
needed.
Bayes nets are not a panacea that allows any game to be converted into a game-
based assessment. While the Bayes nets can flexibly combine the evidence from
multiple dependent observables, they do not help if the game does not provide
adequate evidence. In particular, if the game mechanisms are not well aligned with
the competencies being measured, or if unmodeled competencies are necessary
to succeed at the game, the game might provide inadequate evidence. Putting the
focus on the desired evidentiary information into the early stages of the design
process should help designers create games that provide sufficient evidence to
assess an interesting collection of proficiencies.
REFERENCES
Almond, R. G. (2015). An IRT-based parameterization for conditional probability tables. In J. M.
Augusta and R. N. Carvalho, (Eds.), (Proceedings of the 2015 Bayesian Modeling Application
Do
wn
load
ed b
y [
68
.84
.16
.83
] at
12
:23
21
Dec
emb
er 2
01
5

20 KIM, ALMOND, SHUTE
Workshop at the 2015 Uncertainty in Artificial Intelligence conference. Retrieved from http://pluto.
coe.fsu.edu/RNetica/.
Almond, R. G. (2010). “I can name that Bayesian network in two matrixes!”. International Journal of
Approximate Reasoning, 51(2), 167–178.
Almond, R. G., DiBello, L., Jenkins, F., Mislevy, R. J., Senturk, D., Steinberg, L. S., & Yan, D.
(2001). Models for conditional probability tables in educational assessment. In T. Jaakkola and T.
Richardson (Eds.). Proceedings of Artificial Intelligence and Statistics 2001 (pp. 137–143).
Almond, R. G., Kim, Y. J., Shute, V. J., & Ventura, M. (2013). Debugging the evidence chain. In R. G.
Almond and O. Mengshoel (Eds.), Proceedings of the 2013 UAI Application Workshops: Big Data
meet Complex Models and Models for Spatial, Temporal and Network Data (UAI2013AW), CEUR
Conference Proceedings, 1024 (pp. 1–10). Retrieved from http://ceur-ws.org/Vol-1024/paper-01.
Almond, R. G., Kim, Y. J., Velasquez, G., & Shute, V. J. (2014). How task features impact evidence
from assessments embedded in simulations and games. Measurement: Interdisciplinary Research
& Perspectives, 12(1–2), 1–33
Almond, R. G. & Mislevy, R. J. (1999). Graphical models and computerized adaptive testing. Applied
Psychological Measurement, 23, 223–238.
Almond, R. G., Mislevy, R. J., Steinberg, L. S., Yan, D., & Williamson, D. M. (2015). Bayesian
networks in educational assessment. New York, NY: Springer.
Almond, R. G., Steinberg, L. S., & Mislevy, R. J. (2002). Enhancing the design and delivery of
assessment systems: A four-process architecture. Journal of Technology, Learning, and Assessment,
1(5). Retrieved from https://ejournals.bc.edu/ojs/index.php/jtla/article/view/1671
Almond, R., Yan, D., & Hemat, L. (2008). Parameter recovery studies with a diagnostic Bayesian
network model. Behaviormetrika, 35, 159–185.
Baker, E. L., & Delacruz, G. C. (2008). A framework for the assessment of learning games. In H.
F. O’Neil & R. S. Perez (Eds.), Computer games and team and individual learning (pp. 21–37).
Oxford, UK: Elsevier.
Behrens, J., Mislevy, R., DiCerbo, K., & Levy, R. (2010). An evidence centered design for learning
and assessment in the digital world. In M. C. Mayrath, J. Clarke-Midura, & D. Robinson (Eds.),
Technology-based assessments for 21st century skills: theoretical and practical implications from
modern research (pp. 13–53). Charlotte, NC: Information Age.
Catto, E. (2013). Box2d: A 2d physics engine for games. Retrieved from http://box2d.org/
DiCerbo, K. (2014). Game-based assessment of persistence. Journal of Educational Technology and
Society, 17(1), 17–28.
Habgood, M. P. J., & Ainsworth, S. E. (2011). Motivating children to learn effectively: Exploring
the value of intrinsic integration in educational games. Journal of the Learning Sciences, 20(2),
169–206.
Kim, Y. J. (2014). Search for the optimal balance among learning, psychometric qualities, and en-
joyment in game-based assessment. Unpublished doctoral dissertation, Florida State University,
Tallahassee, FL.
Madigan, D., Mosurski, K., & Almond, R. G. (1997). Graphical explanation in belief networks. Journal
of Computational Graphics and Statistics, 6, 160–181.
Mislevy, R. J., Almond, R. G., & Lukas, J. F. (2003). A brief introduction to evidence-centered
design (ETS Research Report RR-03-16). Princeton, NJ: Educational Testing Service. Retrieved
from http://www.ets.org/Media/Research/pdf/RR-03-16.pdf
Mislevy, R. J., Behrens, J. T., DiCerbo, K. E., Frezzo, D. C., & West, P. (2012). Three things game
designers need to know about assessment. In D. Ifenthaler, D. Eseryel, & X. Ge (Eds.), Assessment in
game-based learning: foundations, innovations, and perspectives (pp. 59–81). New York: Springer.
Mislevy, R. J., Hamel, L., Fried, R. G., Gaffney, T., & Haertel, G. (2003). Design patterns for assessing
science inquiry (PADI Technical Report No.1). Menlo Park, CA: SRI International.
Do
wn
load
ed b
y [
68
.84
.16
.83
] at
12
:23
21
Dec
emb
er 2
01
5

APPLICATION OF ECD FOR GAME-BASED ASSESSMENTS 21
Mislevy, R. J., Oranje, A., Bauer, M., von Davier, A. A., Hao, J., Corrigan, S., . . . John, M. (2014).
Psychometric considerations in game-based assessment. Redwood City, CA: GlassLab.
Mislevy, R. J., Steinberg, L. S., & Almond, R. G. (2003). Focus article: on the structure of educational
assessments. Measurement: Interdisciplinary Research and Perspectives, 1(1), 3–62.
Muraki, E. (1992). A Generalized partial credit model: application of an EM algorithm. Applied
Psychological Measurement, 16(2), 159–176.
Norsys (2012). Netica Application: A complete software package to solve problems using Bayesian
Belief Networks and Influence diagrams. Computer software retrieved 2015-02-27 from http://www.
norsys.com/.
Pearl, J. (1988). Probabilistic reasoning in intelligent systems: networks of plausible inference. San
Mateo, CA: Morgan Kaufmann.
R Core Team. (2013). R: A language and environment for statistical computing. R Foundation for
Statistical Computing, Vienna, Austria. Retrieved from http://www.R-project.org/
Samejima, F. (1997). Graded response model. In W. van der Linden & R. Hambleton (Eds.), Handbook
of modern item response theory (pp. 85–100). New York: Springer.
Shute, V. J. (2011). Stealth assessment in computer-based games to support learning. In S. Tobias &
J. D. Fletcher (Eds.), Computer games and instruction (pp. 503–524). Charlotte, NC: Information
Age Publishers.
Shute, V. J., Hansen, E. G., & Almond, R. G. (2008). You can’t fatten a hog by weighing it—or can
you? Evaluating an assessment for learning system called ACED. International Journal of Artificial
Intelligence in Education, 18(4), 289–316.
Shute, V. J., & Ventura, M. (2013). Measuring and supporting learning in games: Stealth assessment.
Cambridge, MA: The MIT Press.
Shute, V. J., Ventura, M., Bauer, M., & Zapata-Rivera, D. (2009). Melding the power of serious games
and embedded assessment to monitor and foster learning. In U. Ritterfeld, M. J. Cody, & P. Vorderer
(Eds.), The social science of serious games: theories and applications (pp. 295–321). Philadelphia:
Routledge/LEA.
Shute, V. J., Ventura, M., & Kim, Y. J. (2013). Assessment and learning of qualitative physics in
Newton’s Playground. The Journal of Educational Research, 106(6), 423–430.
Slota, S. T. (2014). Project TECHNOLOGIA: A game-based approach to understanding situated
intentionality (Doctoral dissertation). University of Connecticut, Storrs, CT.
Spiegelhalter, D. J., & Lauritzen, S. L. (1990). Sequential updating of conditional probabilities on
directed graphical structures. Networks, 20, 579–605.
Sundre, D. L., & Wise, S. L. (2003). ‘Motivation filtering’: An exploration of the impact of low
examinee motivation on the psychometric quality of tests. Paper presented at the Annual meeting
of the National Council on Measurement in Education, Chicago, IL.
Tatsuoka, K. K. (1983). Rule space: an approach for dealing with misconceptions based on item
response theory. Journal of Educational Measurement, 20(4), 345–354.
Wainer, H., Veva, J. L., Camacho, F., Reeve III, B. B., Rosa, K., Nelson, L., Swygert, K. A., & Thissen,
D. (2001). Augmented scores—“borrowing strength” to compute scores based on a small number
of items. In D. Thissen & H. Wainer (Eds.), Test scoring (pp. 343–388). Hillsdale, NJ: Lawrence
Erlbaum Associates.
Zapata-Rivera, D., & Bauer, M. (2012). Exploring the role of games in educational assessment. In
M. Mayrath, J. Clarke-Midura, D. Robinson, & G. Shraw (Eds.), Technology-based assessments
for twenty-first-century skills: theoretical and practical implications from modern research (pp.
147–169). Charlotte, NC: Information Age Publishing.
Do
wn
load
ed b
y [
68
.84
.16
.83
] at
12
:23
21
Dec
emb
er 2
01
5


![Chapter 4 Game-Based Learning Analytics in Physics ...myweb.fsu.edu/vshute/pdf/gamification.pdf9 supports within a game called Physics Playground [2], (c) present the results from](https://img.pdfslide.us/doc/110x75/5e823a0a9bb0c56b780df890/chapter-4-game-based-learning-analytics-in-physics-mywebfsueduvshutepdf.jpg)