Embed Size (px)
Citation preview
Dcsl~JI)
Applying Environmental Life-Cycle Analysis to Materials
Sleven B. Young and Willem H. Vanderburg
The life-cycle analysis (LeA) of products is essentially the LeA of materials: both are concurrently and interdependently analyzed and assessed according to their environmental effects. This approach provides a framework to measure the extrinsic environmental properties of materials. In the following, three properties-gross energy requirement, global-warming potential, and solid-waste burden-are broadly discussed for steel, aluminum, and polyethylene. The environmental profiles are then applied to assess the use of alternative materials in terms of the LeA of an automotive component. Given the possibility of a substantial variation in results, one must be careful with the scoping and assessment of LeA. Despite the limitations, it provides a useful map for improving environmental compatibility and performance.
Table I. Energy Profile Used for the LCA of an Automotive Componenp,CG-42
GER Emissions Air Emissions
CO2 Emissions CO HC NO,
SWB
Electricity Gasoline
11.7MJ/kWh 36MJ/I
640g/kWh 0.22g/kWh 1.7g/kWh 2.0g/kWh 20g/kWh
2,300 g/ l 19 g/ l 2.4g/1 4.88/ 1 2 g/I
INTRODUCTION
Environmental life-cycle analysis (LCA) has emerged over the last several years as a key tool for the environmental management of product systems. 1-9 It forms part of the novel orientation in environmental management toward pollution prevention, away from old-style "end of pipe" approaches. lO,lI Within this paradigm, the concept of product stewardship is gaining acceptance: it encourages producers to take responsibility for all their product's interactions with the environment, including pollution, resource consumption, and safety.12
Life-cycle analysis has been and continues to be developed as a tool to systematically measure and assess any environmental impact attributable to a product and its supporting product system. With further development, LCA appears promising as an important technique for product stewardship and pollution prevention-and for realizing the potential benefits for all stakeholders.
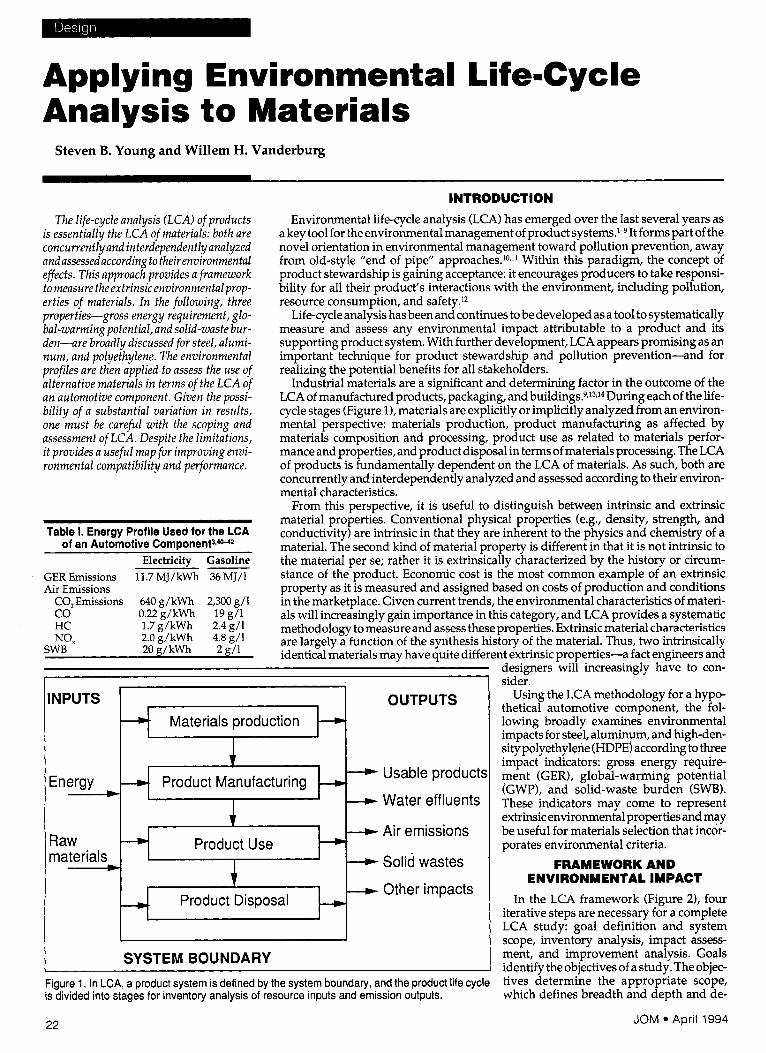
Industrial materials are a significant and determining factor in the outcome of the LCA of manufactured products, packaging, and buildings.9•13,14 During each of the lifecycle stages (Figure 1), materials are explicitly or implicitly analyzed from an environmental perspective: materials production, product manufacturing as affected by materials composition and processing, product use as related to materials performance and properties, and product disposal in terms of materials processing. The LCA of products is fundamentally dependent on the LCA of materials. As such, both are concurrently and interdependently analyzed and assessed according to their environ-mental characteristics.
From this perspective, it is useful to distinguish between intrinsic and extrinsic material properties. Conventional physical properties (e,g" density, strength, and conductivity) are intrinsic in that they are inherent to the physics and chemistry of a material. The second kind of material property is different in that it is not intrinsic to the material per se; rather it is extrinsically characterized by the history or circumstance of the product. Economic cost is the most common example of an extrinsic property as it is measured and aSSigned based on costs of production and conditions in the marketplace. Given current trends, the environmental characteristics of materials will increasingly gain importance in this category, and LCA provides a systematic methodology to measure and assess these properties. Extrinsic material characteristics are largely a function of the synthesis history of the material. Thus, two intrinsically identical materials may have quite different extrinsic properties-a fact engineers and
------------------------------ designers will increasingly have to con-sider.
INPUTS OUTPUTS Using the LCA methodology for a hypo-
Materials production
Energy Product Manufacturing
thetical automotive component, the following broadly examines environmental impacts for steel, aluminum, and high-density polyethylene (HDPE) according to three impact indicators: gross energy require-
Usable products ment (GER), global-warming potential (GWP), and solid-waste burden (5WB). These indicators may come to represent extrinsic environmental properties and may be useful for materials selection that incorporates environmental criteria. Raw
materials Product Use
Product Disposal
SYSTEM BOUNDARY
Water effluents
Air emissions
Solid wastes
Other impacts
Figure 1. In LCA, a product system is defined by the system boundary, and the product life cycle is divided into stages for inventory analysis of resource inputs and emission outputs.
22
FRAMEWORK AND ENVIRONMENTAL IMPACT
In the LCA framework (Figure 2), four iterative steps are necessary for a complete LCA study: goal definition and system scope, inventory analysis, impact assessment, and improvement analysis, Goals identify the objectives of a study. The objectives determine the appropriate scope, which defines breadth and depth and de-
JOM • April 1994
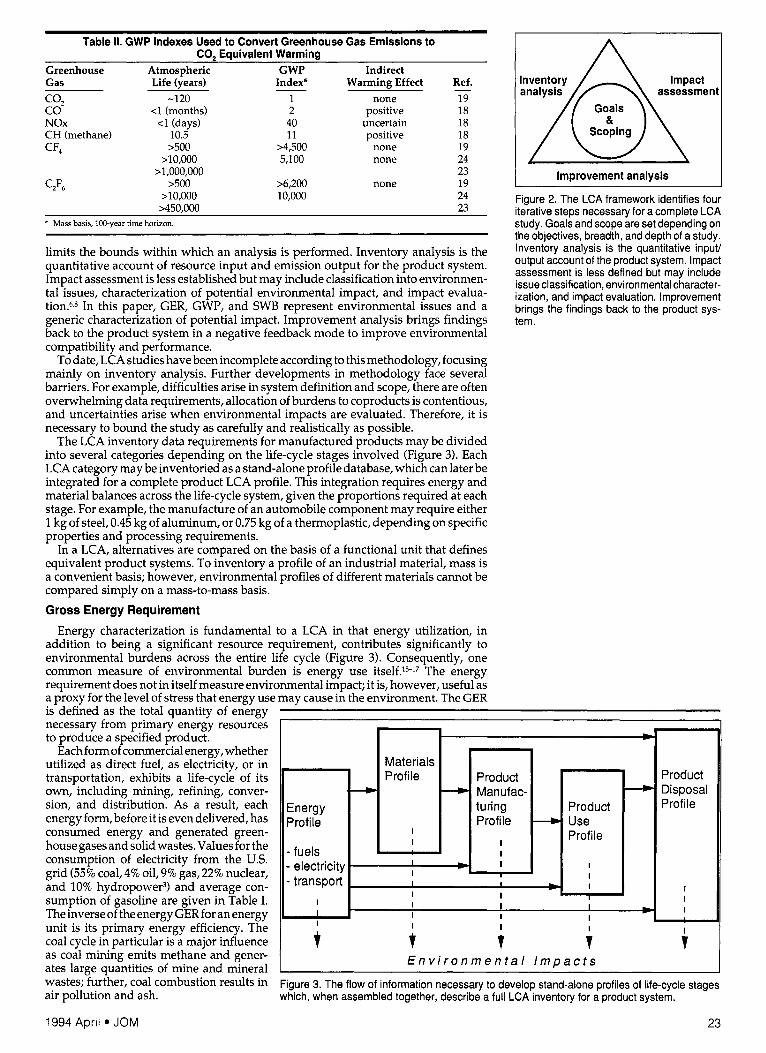
Table II. GWP Indexes Used to Convert Greenhouse Gas Emissions to CO2 Equivalent Warming
Greenhouse Atmospheric GWP Indirect Gas Life (years) Index' Warming Effect Ref.
CO2 -120 1 none 19 CO <1 (months) 2 positive 18 NOx <1 (days) 40 uncertain 18 CH (methane) 10.5 11 positive 18 CF4 >500 >4,500 none 19
>10,000 5,100 none 24 > 1,000,000 23
C2F6 >500 >6,200 none 19 >10,000 10,000 24 >450,000 23
... Mass basis, 1 DO-year time horizon.
limits the bounds within which an analysis is performed. Inventory analysis is the quantitative account of resource input and emission output for the product system. Impact assessment is less established but may include classification into environmental issues, characterization of potential environmental impact, and impact evaluation.6,s In this paper, GER, GWP, and SWB represent environmental issues and a generic characterization of potential impact. Improvement analysis brings findings back to the product system in a negative feedback mode to improve environmental compatibility and performance.
To date, LCA studies have been incomplete according to this methodology, focusing mainly on inventory analysis. Further developments in methodology face several barriers. For example, difficulties arise in system definition and scope, there are often overwhelming data requirements, allocation of burdens to coproducts is contentious, and uncertainties arise when environmental impacts are evaluated. Therefore, it is necessary to bound the study as carefully and realistically as pOSSible.
The LCA inventory data requirements for manufactured products may be divided into several categories depending on the life-cycle stages involved (Figure 3). Each LCA category may be inventoried as a stand-alone profile database, which can later be integrated for a complete product LCA profile. This integration requires energy and material balances across the life-cycle system, given the proportions reqUired at each stage. For example, the manufacture of an automobile component may require either 1 kg of steel, 0.45 kg of aluminum, or 0.75 kg of a thermoplastic, depending on specific properties and processing requirements.
In a LCA, alternatives are compared on the basis of a functional unit that defines equivalent product systems. To inventory a profile of an industrial material, mass is a convenient basis; however, environmental profiles of different materials cannot be compared simply on a mass-to-mass basis.
Gross Energy Requirement
Energy characterization is fundamental to a LCA in that energy utilization, in addition to being a significant resource requirement, contributes significantly to environmental burdens across the entire life cycle (Figure 3). Consequently, one common measure of environmental burden is energy use itself.15-17 The energy requirement does not in itself measure environmental impact; it is, however, useful as a proxy for the level of stress that energy use may cause in the environment. The GER
Impact assessment
Improvement analysis
Figure 2. The LeA framework identifies four iterative steps necessary for a complete LeA study. Goals and scope are set depending on the objectives, breadth, and depth of a study. Inventory analysis is the quantitative input! output account of the product system. Impact assessment is less defined but may include issue classification, environmental characterization, and impact evaluation. Improvement brings the findings back to the product system.
is defined as the total quantity of energy ------------------------------necessary from primary energy resources to produce a specified product.
Each form of commercial energy, whether utilized as direct fuel, as electricity, or in transportation, exhibits a life-cycle of its own, including mining, refining, conversion, and distribution. As a result, each energy form, before it is even delivered, has consumed energy and generated greenhouse gases and solid wastes. Values for the consumption of electricity from the U.s. grid (55% coal,4% oil, 9% gas,22% nuclear, and 10% hydropower3) and average consumption of gasoline are given in Table 1. The inverse of the energy GER for an energy unit is its primary energy efficiency. The coal cycle in particular is a major influence as coal mining emits methane and generates large quantities of mine and mineral
~
Energy Profile
- fuels - electricity - transport
I I I
t
Materials Profile Product
~ Manufac-turing Profile
I I I
I L I I
I I I I I I I I
• , Environmental
Product
---- Disposal
Product Profile -----. Use
Profile
I I I I
I .. I I I I , ,
Impacts
wastes; further, coal combustion results in Figure 3. The flow of information necessary to develop stand-alone profiles of life-cycle stages air pollution and ash. which, when assembled together, describe a full LeA inventory for a product system.
1994 April • JOM 23
Global-Warming Potential
Global-warming potential is a relatively new scientific measure constructed to assist decision makers in grappling with the issue of global climate change. It is an index calculated from total emissions of greenhouse gases weighted relative to CO2 in their propensity to contribute to global atmospheric warming. The potential global warming from a quantity of gas emitted to the atmosphere is calculated from the direct radiative forcing of the molecule and the length of time it resides in the atmosphere. Cumulative radiative forcing is integrated over an arbitrary time horizon (100 years is often used).I8-22 Table II presents GWP indexes that are used to convert emissions of greenhouse gases into the GWP currency of CO
2-equivalent mass. Most of these
indexes are "official" values from the Intergovernmental Panel on Climate Change.18,19
Indexes for CF4 and Cl6 (produced in small amounts during aluminum smelting) require careful consideration. These fully fluorinated species are unlike other chlorofluorocarbons (CFCs) in that they do not contribute to stratospheric ozone depletion; however, like other CFCs, they exhibit high warming potential. Their indexes are large because of their high radiative forcing and their very long atmospheric residence times.23 Isaksen et al. have most recently measured the direct radiative forcing of these species and calculated their indexes.24
Solid-Waste Burden
Solid wastes occur at all life-cycle stages, and the SWB is the simple unweighted addition of their mass. The largest volumes of waste generally result from raw material acquisition and processing. Although these mining, metallurgical, and drilling wastes are qualitatively different from other solid wastes in that they are site limited and
------------------....:..---....::..--------- handled as part of standard processing, this rn I ~ article includes them in the SWB; e sewhere, ~ they are often not defined as waste. Addi
tionally, various industrial wastes occur during manufacture, although it is common business practice to recycle or sell most nonproduct solids. Thus, the SWB from manufacturing is relatively small. The most socially and politically visible fraction of the SWB is municipal solid waste, which, in
~;;'(""'--+--~ ___ """--I the total life cycle, frequently represents a High Density small fraction of solid wastes, but it does Integrated
Steel EAF Steel
Primary Aluminum
Secondary Aluminum Polyethylene pose a substantial disposal problem for
municipalities. The actual ecological and health effects of solid wastes are not factored into the SWB.
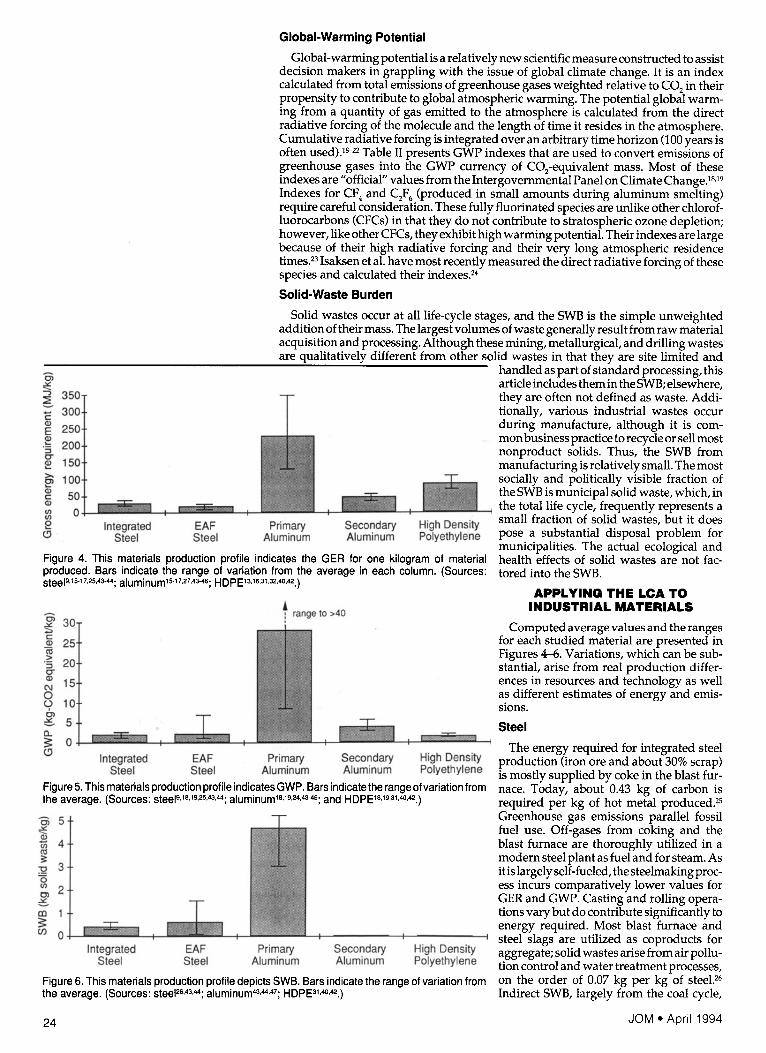
Figure 4. This materials production profile indicates the GER for one kilogram of material produced. Bars indicate the range of variation from the average in each column. (Sources: steeI9,15.17,25,43-44; aluminuml5-17,27.43.45; HDPEI3.16.31 .32.4Q,42.)
Integrated Steel
EAF Steel
t range to >40
Primary Aluminum
Secondary Aluminum
High Density Polyethylene
Figure 5. This materials production profile indicates GWP. Bars indicate the range of variation from the average. (Sources: steeI9,18,19,25,43,44; aluminumI8,19,24,43-45; and HDPEI8,19,31,4Q,42.)
rn 5 'al Vi 4 ('t!
~ 3 :2
(5 (/)
2 Ol ~ en 3: en 0
Integrated Steel
EAF Steel
Primary Aluminum
Secondary Aluminum
High Density Polyethylene
Figure 6. This materials production profile depicts SWB. Bars indicate the range of variation from the average. (Sources: steeI26,43,44; aluminum43,44,47; HDPE31,4Q,42.)
24
APPLYING THE LeA TO INDUSTRIAL MATERIALS
Computed average values and the ranges for each studied material are presented in Figures 4-6. Variations, which can be substantial, arise from real production differences in resources and technology as well as different estimates of energy and emissions.
Steel
The energy required for integrated steel production (iron ore and about 30% scrap) is mostly supplied by coke in the blast furnace. Today, about 0.43 kg of carbon is required per kg of hot metal produced.25
Greenhouse gas emissions parallel fossil fuel use. Off-gases from coking and the blast furnace are thoroughly utilized in a modern steel plant as fuel and for steam. As itis largely self-fueled, the steelmaking process incurs comparatively lower values for GER and GWP. Casting and rolling operations vary but do contribute significantly to energy reqUired. Most blast furnace and steel slags are utilized as coproducts for aggregate; solid wastes arise from air pollution control and water treatment processes, on the order of 0.07 kg per kg of steel,26 Indirect SWB, largely from the coal cycle,
JOM • April 1994
makes up the majority of the SWB. Geographic variations in practice contribute to the variance shown in Figures 4-6.
Electric arc furnace (EAF) steel production that utilizes 100% scrap makes large contributions to the GER, GWP, and SWB through the electricity it consumes. If the power is coal fired (typically 35% energy efficient), loadings greater than those for integrated steel may result, particularly in greenhouse gases. If the coal is replaced by hydropower, however, the GER and GWP values drop an order of magnitude or more. Slags are used for aggregate, and the bulk of EAF dust, considered hazardous, is recovered for processing.26 Casting and forming may add considerably to the total GER.
Aluminum
For the profile of primary aluminum production, four stages are considered: mining, Bayer refining, primary smelting, and metal finishing. The GER is highly dependent upon assumptions made about Hall-Heroult electrolysis. The average case
considers the world's primary industrial --:::=========;::===================, electric power mix (56% hydropower, 34% coal, 1 % oil, 4% natural gas, and 5% nuclear power) and a weighted average power consumption of 16.1 kWh/kg for primary aluminum.27 Variation from 100% coal to 100% hydropower and from 12.5 kWh/kg to 20 kWh/kg accounts for most of the range in Figures 4 and 6. The contributions to the GER from refining and metal finishing are approximately 20% and 10%, respectively. The SWB from refining is on the order of 2 kg per kg metal. Solid wastes from smelting, drosses, and spent pot linings are quantitatively small; indirect wastes from electricity generation, particularly where coal power is used, make up the remainder oftheSWB.
The GWP is significant because of the fossil fuels reqUired for smelting power, refining, and finishing, and because of the carbon consumed in electrodes. In addition to the common greenhouse gases, CF
4 and
C2F6 constitute a substantial and, until recently, largely overlooked source of global warming from primary aluminum smelting. Evidence is still being collected to measure accurately the sources of CF gases and to determine the nature of their GWP.28,29 Emissions are proportional to the frequency and duration of anode effects and the current flow, which is a function of process control in a cell.30 In some older plants, anode effects are intentionally permitted as part of normal operation; in most modern facilities, anode effects are considered detrimental and are rare. For Figure 5, weighted average emissions were estimated at 2 g CF4 per kg of aluminum smelted with values for C2F6 assumed to be tenfold lower. Because of the magnitude of their GWP indexes (Table II), these gases may be responsible for half of the GWP value for primary aluminum.
Secondary metal production from scrap includes melting, processing, and subsequent metal finishing. Bulk energy, greenhouse gas, and waste burdens are a fraction of primary production. Casting and forming operations consequently become dominant in the measurment of the GER and GWP. When analyzing aluminum as a material, careful consideration must be given to the primary versus secondary content of the metal in question because of the large differences that exist in their extrinsic environmental properties.
1994 April • JOM
Material production Part manufacture Use Disposal
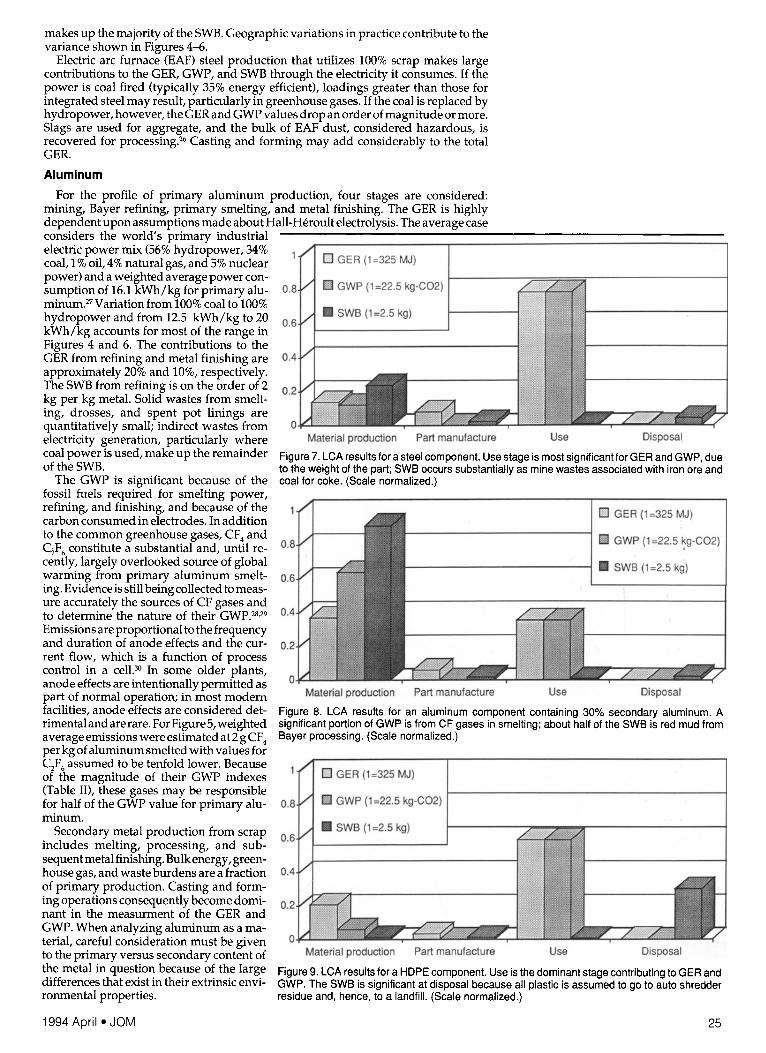
Figure 7. LCA results for a steel component. Use stage is most significant for GER and GWP, due to the weight of the part; SWB occurs substantially as mine wastes associated with iron ore and coal for coke. (Scale normalized.)
Material production Part manufacture Use
o GER (1=325 MJ)
UI GWP (1 =22.5 ~g·C02)
• SWB (1 =2.5 kg)
Disposal
Figure 8. LCA results for an aluminum component containing 30% secondary aluminum. A significant portion of GWP is from CF gases in smelting; about half of the SWB is red mud from Bayer processing. (Scale normalized.)
Material production Part manufacture Use Disposal
Figure 9. LCA results for a HDPE component. Use is the dominant stage contributing to GER and GWP. The SWB is significant at disposal because all plastic is assumed to go to auto shredder residue and, hence, to a landfill. (Scale normalized.)
25
References 1. J.A. Fava et aI., A Technical Framework for Product Life-Cycle Assessments (Washington, D.C: Society of Environmental Toxicology and Chemistry and the SETAC Foundation for Environmental Education, January 1991). 2. J.A Assies, "Introduction Paper to the SETAC-Europe Workshop on Environmental Life Cycle Analysis of Products" (Leiden, Netherlands, 1991). 3. Product Life-Cycle Assessment: Inventory Guidelinesand Principles, EPAj600jR-92j036 (Cincinnati, OH: Risk Reduction Engineering Laboratory, U.s. EPA, November 1992). 4. RG. Hunt, J.D. Sellers, and W.E. Franklin, "Resource and Environmental Profile Analysis: A Life Cycle Environmental Assessment for Products and Procedures," Environ. Impact Assess. Review, 12 (245) (1992). 5. J.A. Assies, "Towards a General Framework for Life Cycle Assessment" (Paper presented at the IIR Conference on LCA, London, 1992). 6. R Heijings, ed., Environmental Life Cycle Assessment of Products, Reports 9266 and 9267 (Netherlands: Leiden University, 1992). 7. Canadian Standards Association, Environmental Ufe Cycle Assessment, CAN jCSA-Z 760.2 (Toronto, Canada: Canadian Standards Association, 1994). 8. A Conceptual Framework for Life-Cycle Impact Assessment (Pensacola, FL: Society of Environmental Toxicology and Chemistry, 1993). 9. Environmental Resource Guide Subscription (Wahington, D.C.: American Institute of Architects, 1993). 10. H. Freeman et al., "Industrial Pollution Prevention: A Critical Review," J. Air and Waste Management Assoc., 42 (5) (1992), pp. 618-656. 11. S.B. Young and W.H. Vanderburg, "A Materials Life Cycle Framework for Preventive Engineering," IEEE Technology and Society, 11 (3) (1992), pp. 26-31. 12. Responsible Care: A Total Commitment (Ottawa, Canada: Canadian Chemical Producers' Association, October 1990). 13. Franklin Associates for the Society of Plastics Industries, Comparative Energy Evaluation of Plastic Products and Their Alternatives for the Building and Construction and Transport Industries (Prairie Village, KS: March 1991). 14. U. Lene!, "Life Cycle Analysis Explained," Metals and Materials (November 1992), pp. 589-591. 15. Battelle Columbus Laboratories, Energy Use Patterns in the Metallurgical and Non-Metallic Mineral Processing, Phase 4-Energy Data and Flowsheets,High-Priority Commodities, USBM OFR 80-7, NTIS PB-245 759 (Washington, D.C.: U.s. Bureau of Mines, June 27, 1975). 16. P.F. Chapman and F. Roberts, Metal Resources and Energy (Boston, MA: Butterworths, 1983), 17. G.F. Hancock, "Energy Requirements for Manufacture of Some Non-Ferrous Metals," Metals Technology, 11 (July 1984), pp. 290-299. 18. J.T. Houghton, G.J. Jenkins, and j.J. Ephraums, eds., Climate Change: The IPCC Scientific Assessment (Cambridge, U.K.: Cambridge University Press, 1990). 19. J.T. Houghton, B.A. Callander, and S.K. Varney, eds., Climate Change 1992: The Supplementary Report to the IPCC Scientific Assessment (Cambridge, U.K.: Cambridge University Press, 1992). 20. D.A. Lashof and D.R. Ahuja, "Relative Contributions of Greenhouse Gas Emissions to Global Warming," Nature, 344 (1990), pp. 529-531. 21. V. Ramanathan et aI., "Trace Gas Trends and Their Potential Role in Climate Change," J. Geophys. Res., 90 (1985), pp.5547-5566. 22. L.L.D. Harvey, "A Guide to Global Warming Potentials (GWP)," Energy Policy (January 1993), pp. 24-34. 23. A.R. Ravishankara et aI., "Atmospheric Lifetimes of Long-Lived Halogenated Species," Science, 259 (1993), pp. 194-199.
26
HOPE Polyethylene resin is produced in three basic stages. Raw materials are sourced from
the naphtha fraction of refined crude oil or from processed natural gas. Naphtha and natural gas are cracked to produce olefin hydrocarbons with reduced molecular weight and unsaturated bonds. The ethylene fraction from cracking is polymerized to create polyethylene; HDPE is produced in a low-pressure process. Across this production route, a large portion of the feedstock material is carried with and embodied into the product resin (approximately 43 MJ /kg); as is normal in LCA, this energy has been included in the GER of the thermoplastic. Most of the remaining energy requirements occur during cracking and polymerization in the form of process fuels, electricity, and consumed feedstock. Boustead, in the most comprehensive series of profiles published, reports an average value for HDPE of 81 MJ /kg, within a range of 69-102 MJ / kg, for European production. 31 These values are used here because they are current and compare well with others reported in the literature across various locations and conditions.9,13,16,32 Greenhouse gas emissions correspond strongly with the combustion of fossil fuels and, consequently for HDPE, with the consumption of energy at each stage. Solid wastes are generated at each stage of production. Mineral wastes constitute the bulk of these wastes; the remainder is composed of industrial waste, Slags, ashes, and chemical wastes.31
The environmental profile of HDPE is distinct from the metals, quantitatively and qualitatively. This makes life-cycle comparisons problematic. Quantitatively in hydrocarbon processing and plastics production, there is high-efficiency materials usethose fractions not used as material feedstock are likely utilized in fuels or other products. Metal extracted from ore necessitates a significant mass separation; the oxygen or sulfur have to be removed somehow and somewhere. Conversely, HDPE production has no stage equivalentto the blast furnace or the Hall-Heroult process, For polyethylene, the quantities of fuel input and waste output occur across all production stages. Qualitatively, it is the relatively small quantities of chemical and me.tal wastes that cause the most concern, in that they may be hazardous or may contaminate the air, water, or soil. These more complex impacts are not considered here.
ASSESSING MATERIALS
The distinction between plastics and metals highlights the multiparameter considerations of LCA and illustrates the possible error of applying limited comparisons between materials without well-defined goals. In addition to the array of conventional considerations necessary when comparing materials, extrinsic environmental properties carry with them added complications. First, because environmental impact, in terms of human health, ecosystem damage, or resource depletion, is not easily defined and is often intangible,6,8 impact indicators are used as proxies and are limited to that role. The GER, GWP, and SWB are convenient measures, but they are simply indicators of potential impact. Second, since a material profile covers only material production, impacts that occur at other stages of the product life cycle (Figure 1) must be factored into the total assessment. Of course, steel, aluminum, and HDPE cannot be judged directly on a mass-to-mass basis, as might be done using only Figures 4-6. Some measure of utility must be introduced to facilitate a meaningful basis of comparison.
MATERIALS SELECTION FOR AN AUTOMOTIVE COMPONENT
Design is a decision activity requiring the balancing of innumerable factors; some are quantifiable and many are not. Today, in light of industrial initiatives such as product stewardship, adding environmental criteria to the list is essential.9,32-35 Moreover, because many criteria (environmental and otherwise) ultimately depend on societal values, choices should be made explicitly as part of the process, Thus, to omit environmental criteria is in itself a value-laden decision,
Intrinsic and extrinsic materials properties have always been involved in the design balance (e.g., the economic costing of feasible alternatives). To demonstrate how materials may influence a product's environmental profile and to illustrate the role materials selection may play, a simple LCA of an automotive part is illustrative. Assume that the same structural component is manufactured from sheet steel, sheet aluminum, or HDPE. Assume also thatthis component is plate-like and must be as stiff and light as possible; thus, in terms of materials selection, following the method of
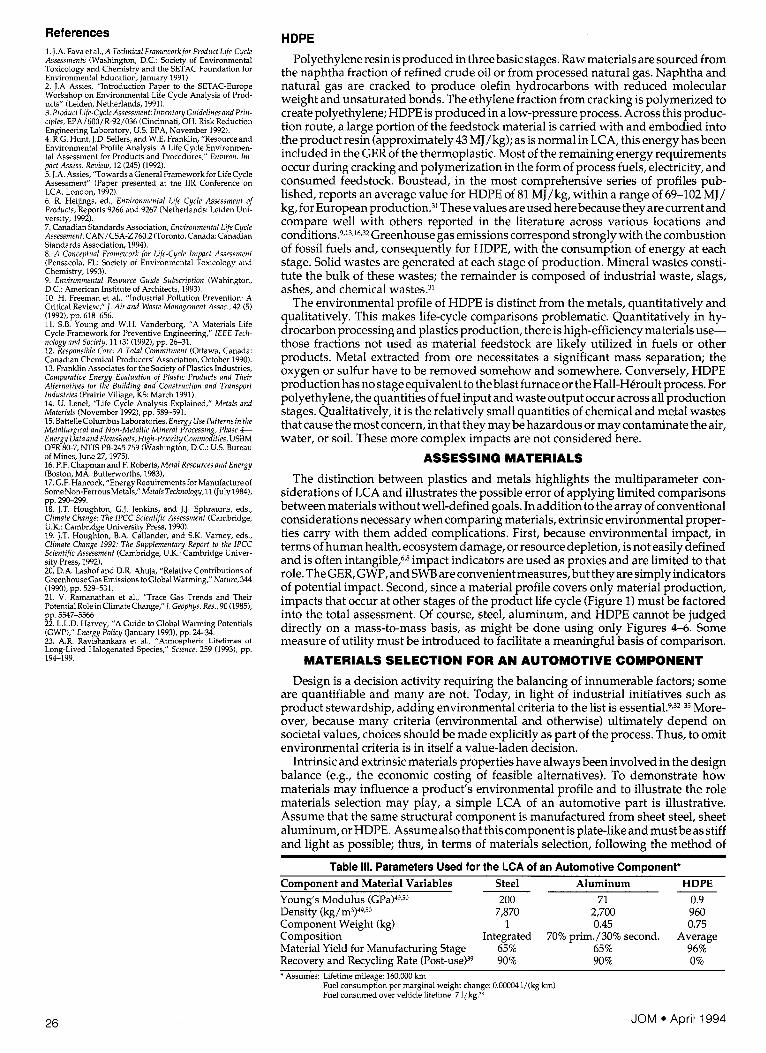
Table III. Parameters Used for the LCA of an Automotive Component"
Component and Material Variables Steel Aluminum HDPE Young's Modulus (GPa)49.50 200 71 0.9 Density (kg/m3)49,50 7,870 2,700 960 Component Weight (kg) 1 0.45 0.75 Composition Integrated 70% prim./30% second. Average Material Yield for Manufacturing Stage 65% 65% 96% Recovery and Recycling Rate (Post-use)39 90% 90% 0% • Assumes: Lifetime mileage: 160,000 km
Fuel consumption per marginal weight change: O.00004l/(kg km) Fuel consumed over vehicle lifetime: 71(kg. 38
JOM • April 1994
Ashby,36 an equivalent stiffness per weight of material is an appropriate measure for comparison:
constant = E1 /3/ P
where E is Young's modulus and p is density. This leads to a comparative measure of utility for the product system--component weight at equivalent performance for fabrication from each of the three materials. Substituting values for E and p (Table III), the substitution ratio is about 1 kg steel to 0.45 kg aluminum to 0.75 kg HDPE.
Vehicle and material assumptions for the analysis are given in Table III. Vehicle lifetime is assumed to be 160,000 km. Fuel consumption is based on the correlation between vehicle light weighting and fuel savings; several estimates are available in the literature, some conservative, some aggressive.37,38 The estimates vary according to the degree that secondary components are assumed to be redesigned or adjusted to account for light weighting. Here, a midrange value of 7 l/kg per lifetime has been used.37 The sources of material used in the manufacture of each component are automotive sheet product from an integrated steelmaker, aluminum containing 30% secondary aluminum, and average HDPE production parameters. The metal parts are assumed to be manufactured at 65% material utility; the HDPE part is assumed at 96%. Thus, 1.5 kg of steel, 0.69 kg of aluminum, and 0.78 kg of polymer are actually required; all prompt scrap is assumed to be recycled. Approximately 90% of used automobiles are recovered for part reuse and then shredded for recycling the ferrous an.d nonferrous metals.39 Currently, plastics and most other nonmetals end up as auto shredder residue "fluff" destined for a municipal landfill. The recycle rate of HDPE is therefore assumed to be zero.
The life-cycle profiles of the automobile component made from the three different materials are illustrated in Figures 7-9. The traditional material, steel, exhibits a profile that may be no surprise to the designer or materials engineer. The use stage is the most significant contributor to the GER and GWP simply because of the weight of the part. For use, the energy requirement and greenhouse gas emissions are directly proportional to each other and to gasoline consumption (according to Table I). The SWB occurs mostly at steel production, as mine wastes associated with iron ore and coal for coke. Solid wastes from part manufacture, use, and disposal are comparatively low.
The aluminum component profile, in comparison, exhibits a GER and GWP that are roughly balanced between the material production stage and the part use stage. This is explained by the significantly higher energy requirement and greenhouse gas emissions to produce the 70% primary aluminum content (Figures 4 and 5); these factors are offset by the lighter weight of the component during use. Red mud from Bayer processing contributes about half of the SWB. Raising the 30% secondary aluminum fraction in the component would significantly reduce the values of all three indicators.
Three-quarters of a kilogram of HDPE requires substantial energy in its production, but Significantly more energy is required because of the gasoline consumed during its use as a part. The GWP parallels energy consumption at the use stage. The SWB is high at the product disposal stage because all plastic is assumed to go to auto shredder residue and, hence, to landfill. Reinforcing the polymer could increase its EI13/p, reducing the use stage impacts; it would also affect burdens at other life-cycle stages.
IMPLICATIONS
This analysis illustrates the possibilities of LCA as applied to materials. Increasing vehicle lifetime mileage would favor the selection oflighter components; reducing the fuel consumption rate would reduce the calculated impact at the use stage; and changing design requirements would alter the substitution ratios between materials. Important materials factors include the source of steel (integrated or EAF); the secondary content of aluminum; the energy sources for smelting; and the physical properties of the alloy or polymer blend utilized in a specific application. Because goals and scope were not defined, no strong conclusions may be drawn about steel, aluminum, or HDPE, nor can they be made about the automobile component life cycle.
Indicators used to describe environmental impact are important. Here, only three bulk indicators were discussed. In a more complete LCA, impact consideration may also be given to toxicity and other less tangible factors; levels of impact, whether global or local; and the extent an explicit assessment is made using social values.
The strengths and weaknesses of LCA as a tool for environmental decision making relate to its broad coverage-across the life cycle and across many environmental issues. These considerations emphasize the necessity to develop clear goals and scope in a study. In the case where this is done carefully-if alternatives and issues are defined and evaluated in a specific application-LCA becomes a powerful mapping tool to identify selected environmental loadings, assist strategic decision making, and improve the environmental performance of a product over its entire life cycle.
ACKNOWLEDGEMENT
This work is part of an on-going project supported with funding from the Ontario Centre for Materials Research.
1994 April • JOM
24. I. Isaksen, Workshop all Atmospheric Effects, Origins, and Options for Control of Two Patent Greenhouse Gases: CF, and C,F, (Washington, D.C: U.s. EPA, April 1993). 25. Susan E. Olynyk, private communication, Dofasco, Hamilton, Canada (1 February 1994). 26. M. Greenfield, "The Reduction, Reuse and Recycle of Wastes Over the Lifecycle of Steel," Proceedillgs 32nd Allnual of Metallllrgists (Quebec City, Canada: CIM, 1992). 27. "Electrical Power Utilization, Annual Report for 1990" (London: International Primary Aluminum Institute, 1991). 28. D. Abrahamson, "Aluminium and Global Warming," Nature, 356 (1992), p. 484. 29. Workshop on Atmospheric Effects, Origins, and Options for Control of Two Potellt Greenhollse Gases: CF, and C,F, (Washington, D.C: U.S. EPA, April 1993). 30. N.E. Richards, in Ref. 29. 31. I. Boustead, Eco-Profiles of the European Plastics Industry, Reports 2 and 3 (Brussels, Belgium: European Centre for Plastics in the Environment, May 1993). 32. CR. FussIer and B. Krummenacher, "Ecobalances: A Key to Better Material Choices in Automobile Design," Materials and Desigll , 12 (3) (199)), 33. U.s. Congress, Office of Technology Assessment, Green Products by Design: Choices for a Cleaner Environment , or A-E-541 (Washington, D.C: U.S. Government Printing Office, October 1992). 34. Life Cycle Design Guidance Manual , Environmental Requirements and the Product System, EPA A600/ R-92 / 226 (Cincinnati, OH: U.S. EPA, lanuary 1993). 35. Desigll for Environment, CAN/CSA-Z 762 (Toronto, Canada: Canadian Standards Association, 1994). 36. M.F. Ashby, Materials Selection in Mechanical Design (Oxford, U.K: Pergamon Press, 1992). 37. Report to the National Academy of Sciences Committee on Fuel Economy of Automobiles and Light Trucks (Washington, D.C: Aluminum ASSOciation, 1991). 38. CL. Maggee, "The Role of Weight Reducing Materials in Automotive Fuel Savings," SAE Technical Paper Series, 820147 (1982). 39. Recycling Scrapped Automobiles, Quick Facts: Issues and Trends , A.D. Little for AISI Automotive Applications Committee, AUIO-OB01, 0292-lOM-VWA (Southfield, MI: AISI, 1992). 40. R.L. Ottinger et aI., Environmental Costs of Electricity (New York: Oceana Publications, 1990). 41. Canadian Energy Supply and Demand 1900-2010 (Calgary, Canada: National Energy Board, 1991). 42. G.P. Arron et aI., Environmental Evaluation of Coal, Oil, Natural Gas and Uranium Fuel Cycles: Comparison of Emissions, Wastes and Resources, Report no. 91-225-H (Toronto, Canada: Ontario Hydro Research Division, 199)), 43. KS. Yoshiki-Gravelsins, I.T. Toguri, and R.T.C Choo, "Metals Production, Energy, and the Environment-Part I: Energy Consumption," 10M, 45 (5) (1993), pp. 15-20. 44. KS. Yoshiki-Gravelsins, ).T. Toguri, and R.T.C Choo, "Metals Production, Energy, and the Environment-Part II: Environmental Impact," 10M, 45 (8) (1993), pp. 23-29. 45. P.R. Atkins, D. Willoughby, and H.I. Hittner, "Some Energy and Environmental Impacts of Aluminum Usage," Energy and the Environment in the 21st Century,ed. l.w. Tester et al. (Cambridge, MA: MIT Press, 199]), pp. 383-387. 46. P.D. Stobart, Centenary of the Hall & Heroult Processes: 1886-1986 (London: International Primary Aluminum Institute, 1986). 47. ).s. Speigel and T.K Pelis, "Regulations and Practices for the Disposal of Spent Potliner by the Aluminum Industry,: 10M, 42 (11) (1990), pp. 70-73. 48. S.B. Young, unpublished manuscript (University of Toronto, 1993). 49. Aluminum Standards and Data 1990, 12th edition (Washington, D.C: Aluminum Association, Inc. 1990). 50. "Encyclopedia '93," Modern Plastics, 69 (13) (1992), p. 262.
ABOUT THE AUTHORS
Steven B. Young earned his M.A.Sc. in metallurgy and materials science atthe University of Toronto in 1989. He is currently a Ph.D. student at that institution. Mr. Young is also a member of TMS.
Willem H. Vanderburg earned his Ph.D. in mechanical engineering at the University of Waterloo in 1973. He is currently director of the Centre for Technology and Social Development and is an associate professor at the University of Toronto.
For more Information, contact Steven B. Young, Department of Metallurgy and Materials Science, University of Toronto, Toronto, Ontario, Canada M5S 1A1.
27