Embed Size (px)
Citation preview

Applying and visualizing the FRAM for Arctic ship navigation
FRAMily 2017
Doug Smith
PhD Candidate
Faculty of Engineering and Applied Science
Memorial University of Newfoundland

Topics for today’s presentation3 Topics
• The application of FRAM as a safety assessment tool for Arctic ship navigation
• The practical collection of data to inform safety assessments in the maritime domain
• A FRAM visualization technique

Arctic ship navigation model as imagined
Arctic Navigation Model
• As Imagined >
• Spoke informally with ship navigators to inform a model as done

Arctic ship navigation model “as done”

Practical data collection
Planned experiment with a Canadian shipping company• Work with a single company (same ship, same crew, same operation, same safety
culture)
• An agreement was reached with the company on the type of “experiment”
• Completed an ethics application to get experiment approved
• As part of the ethics application and process of informed consent we had to list all potential risks to the participants
• One risk is that we could not control how their manager would react to something they said and it could potentially affect their job status
• We could anonymize the data but because of the small sample size (8 maximum) an informed reader could potentially infer their identity

Practical data collection
Two get experiment approved• Remove the manager from the recruitment process (It couldn’t seem like a work
directive – Participation had to completely voluntary)
• Deal directly with the ship by sending a recruitment letter
Results• No recruits (one captain was considering it)
• Potential reasons (did not see the value of FRAM, Did not have time (2 hours) or Did not want to accept potential risks)
• Were not required to give any reason for not participating
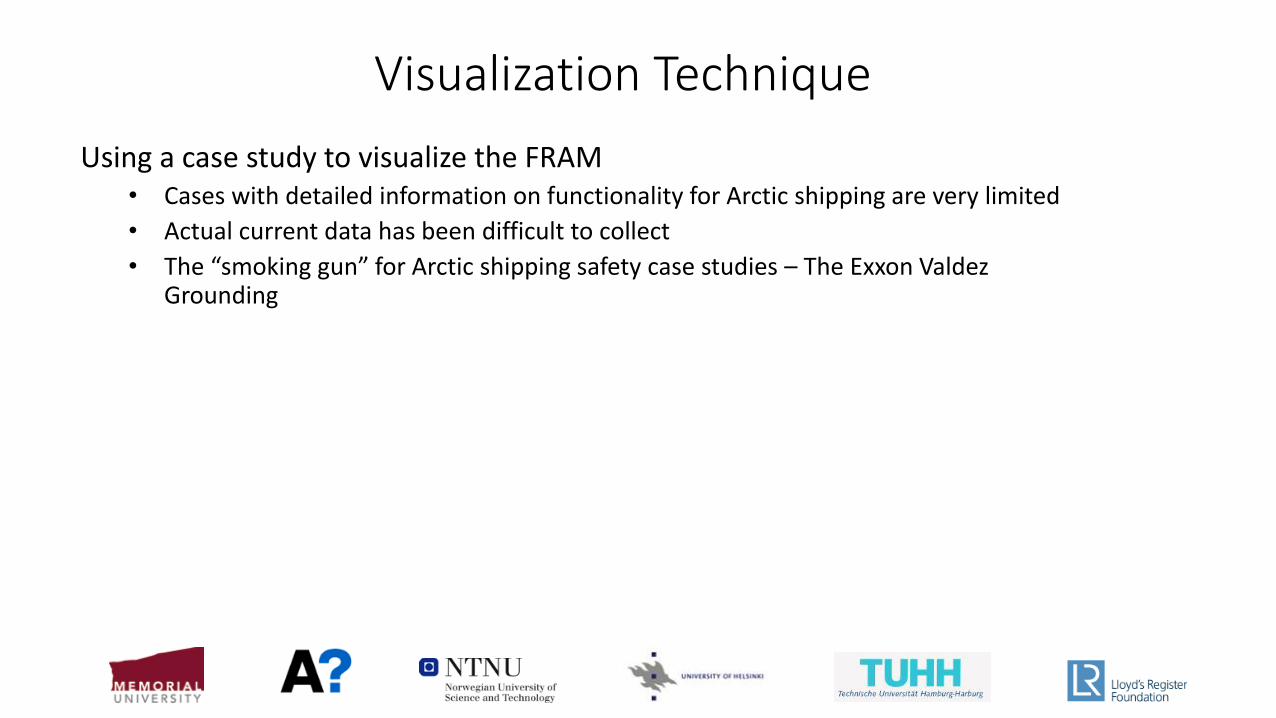
Visualization Technique
Using a case study to visualize the FRAM• Cases with detailed information on functionality for Arctic shipping are very limited
• Actual current data has been difficult to collect
• The “smoking gun” for Arctic shipping safety case studies – The Exxon Valdez Grounding

Visualization Technique

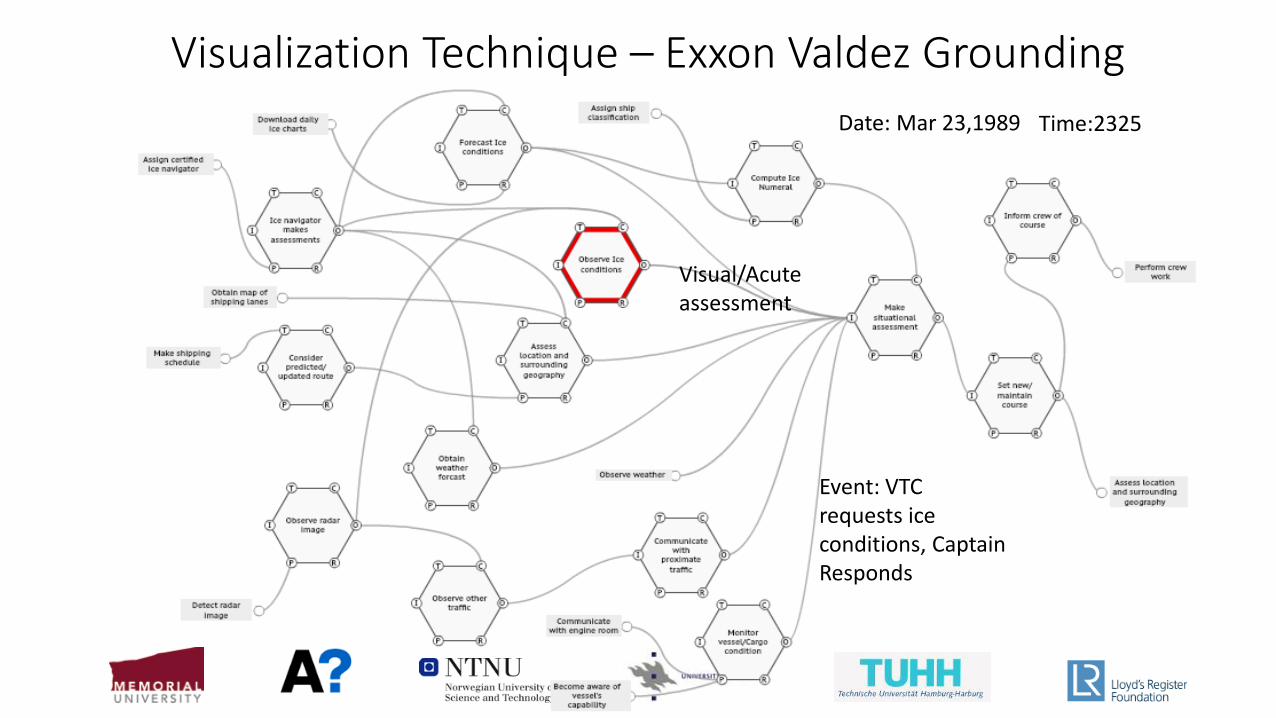
Visualization Technique – Exxon Valdez Grounding
Using Abeam landmarks
Following traffic lane
Event: Pilot ordered navigational commands -helmsman and the third mate logged time abeam of prominent landmarks.
Time:2121-2324Date: Mar 23,1989

Visualization Technique – Exxon Valdez Grounding
Description• “The third mate supervised the helmsman to ensure that all rudder orders from the
pilot were correctly followed and also monitored the vessel's progress by logging the time abeam of prominent landmarks and navigation aids.” - NTSB (1990), Grounding of the Exxon Valdez on Bligh Reef

Visualization Technique – Exxon Valdez Grounding
Using Abeam landmarks
Following traffic lane
Event: Pilot ordered course change for outbound shipping lane
Time:2121-2324Date: Mar 23,1989
219 deg heading ordered
Change course

Visualization Technique – Exxon Valdez Grounding
Using Abeam landmarks
Following traffic lane
Entire model variation: Naviational leadership switched from Pilot to Captain
Time:2121-2324Date: Mar 23,1989
219 deg heading ordered
Change course
Visualization Technique – Exxon Valdez Grounding
Event: VTC requests ice conditions, Captain Responds
Time:2325Date: Mar 23,1989
Visual/Acute assessment

Visualization Technique – Exxon Valdez Grounding
Event: VTC confirms no reported inbound traffic
Time:2326Date: Mar 23,1989
Visual/Acute assessment
Communicate with VTC
No traffic

Visualization Technique – Exxon Valdez Grounding
Event: Captain reports decision to change course
Time:2331Date: Mar 23,1989
Visual/Acute assessment
Communicate with VTC
No traffic
Approaching Glacial Ice
Heading changed, speed not changed

Visualization Technique – Exxon Valdez Grounding
Event: Third Mate said course change was made, but believed the engine speed was increasing
Time:2335Date: Mar 23,1989
Assess engine speed
Heading changed, Speed not as reported

Visualization Technique – Exxon Valdez Grounding
Event: Master ordered course change and a fix of vessel's position
Time:2339Date: Mar 23,1989
Fix to Busby Island while turning
Approaching Glacial Ice
Change Course

Visualization Technique – Exxon Valdez Grounding
Event: Master ordered heading 180 and set autopilotModel Var: AB’s crew change
Time:2343-2350Date: Mar 23,1989
Check course recorder
Course change needed
Course of 180 and engage autopilot

Visualization Technique – Exxon Valdez Grounding
Event: Third Mate learned about autopilot and stayed on shift after shift change
Time:2350Date: Mar 23,1989
Learned about autopilot

Visualization Technique – Exxon Valdez Grounding
Event: Third Mate assessed the situation for upcoming maneuver.Model Var: Master Left Bridge and left third mate in charge
Time:2352Date: Mar 23,1989
Learned about autopilot
Third mate assessment

Visualization Technique – Exxon Valdez Grounding
Event: Third mate disengages autopilot
Time:2352-2355Date: Mar 23,1989
Learned about autopilot
Third mate assessment
Disengage autopilot for upcoming turn

Visualization Technique – Exxon Valdez Grounding
Event: Third Mate fixes vessel position from radarandThird Mate fixes vessel position visually and with charts
Time:2355Date: Mar 23,1989
Assess landmarks on radar
O1: Predicts 0.9 miles from radarO2: Predicts 1.1 miles from chart
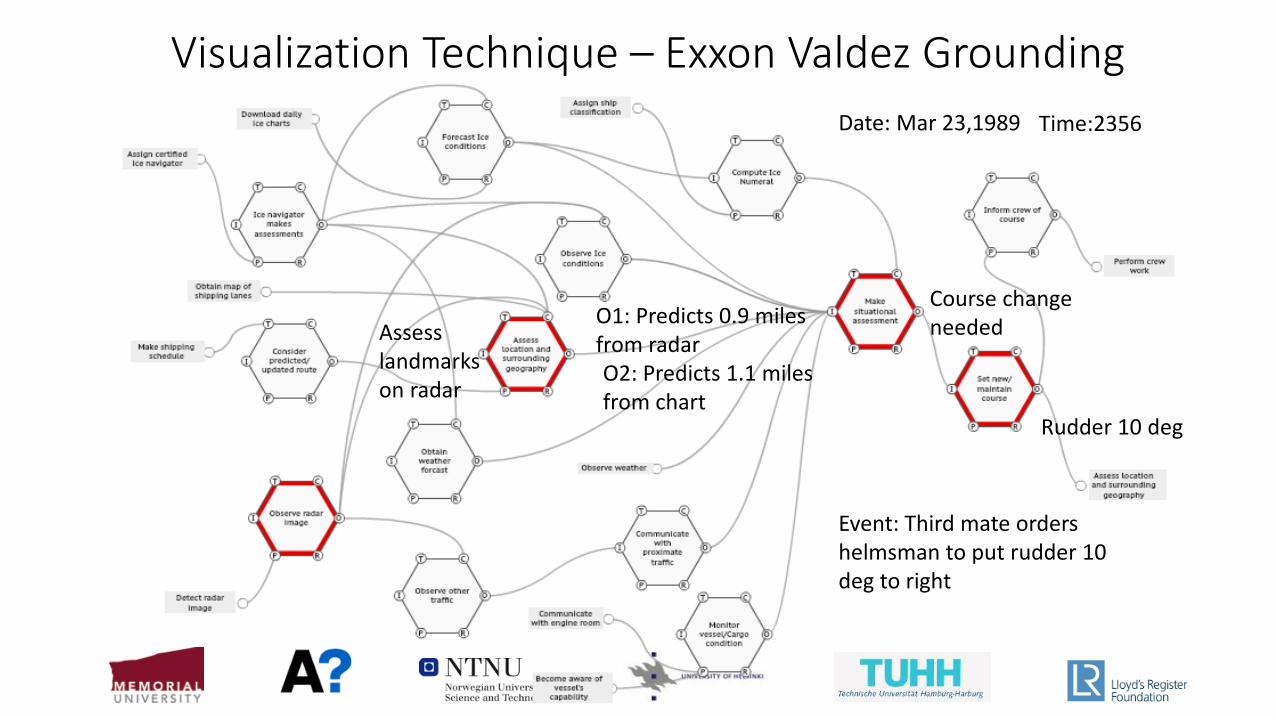
Visualization Technique – Exxon Valdez Grounding
Event: Third mate orders helmsman to put rudder 10 deg to right
Time:2356Date: Mar 23,1989
Assess landmarks on radar
O1: Predicts 0.9 miles from radarO2: Predicts 1.1 miles from chart
Course change needed
Rudder 10 deg

Visualization Technique – Exxon Valdez Grounding
Event: Third mate fixes vessel position using radarandThird Mate takes note of Bligh Reef Buoy
Time:2356-2358Date: Mar 23,1989
Assess vessel track line
O1: Track line had not changed from radarO2: Using Buoy Light to check position

Visualization Technique – Exxon Valdez Grounding
Event: Third Mate notices heading is not changing and orders rudder change to 20 deg
Time:2358Date: Mar 23,1989
Assess vessel track line
O1: Track line had not changed from radar
O2: Using Buoy Light to check position
Heading not changing
Rudder to 20 deg

Visualization Technique – Exxon Valdez Grounding
Event: Third Mate ordered hard right after noticing the vessel was still on 180 degtrack
Time: 0000Date: Mar 24,1989
Assess vessel track line
O1: Track line had not changed from radar
O2: Used navigation lights to assess location
Really close to bligh reef
Rudder hard right

Visualization Technique – Exxon Valdez Grounding
Event: The vessel grounded on Bligh Reef
Time: 0001Date: Mar 24,1989
Assess vessel track line
O1: Track line had not changed from radar
O2: Vessel swinging hard starboard
Abrupt Stop: Grounding
Can not move

Current and future work
• Measuring system performance for Arctic navigation
• Tracking functional signatures
• Trying to identify trends in functional signatures the promote high or low performance
Acknowledgements
• Lloyd’s Register Foundation for funding the research project
• Supervisory Committee for being supportive in the pursuit of this work

Discussion Questions
• Are there practical barriers that impede the collection of data to inform a FRAM?
• Do you think this is an effective visualization technique?


![FERROELECTRIC RAM [FRAM]](https://img.pdfslide.us/doc/110x75/56816799550346895ddcd567/ferroelectric-ram-fram.jpg)