Embed Size (px)
Citation preview

lable at ScienceDirect
Applied Thermal Engineering 91 (2015) 824e833
Contents lists avai
Applied Thermal Engineering
journal homepage: www.elsevier .com/locate/apthermeng
Research paper
3D CFD modeling of natural draft wet-cooling tower with flue gasinjection
Adam Klimanek a, *, Michał Cedzich b, Ryszard Białecki a
a Institute of Thermal Technology, Silesian University of Technology, Konarskiego 22, 44-100 Gliwice, Polandb SBB ENERGY S.A., Łowicka 1, 45-324 Opole, Poland
h i g h l i g h t s
* Corresponding author. Tel.: þ48 32 2372974; fax:E-mail address: [email protected] (A. Klima
http://dx.doi.org/10.1016/j.applthermaleng.2015.08.091359-4311/© 2015 Elsevier Ltd. All rights reserved.
g r a p h i c a l a b s t r a c t
� We developed a CFD model of anatural draft cooling tower with fluegas injection.
� The model was validated againstexperimental data.
� Influence of flue gas injection ontower performance was examined.
� The effect of crosswind on plume andtower performance was studied.
� Increased risk of tower shell corro-sion under crosswind was observed.
120m
25.8
6m
7m
95m
54.74mWet-cooling tower Crosswind effect on injected flue gas
a r t i c l e i n f o
Article history:Received 10 February 2015Accepted 31 August 2015Available online 9 September 2015
Keywords:Cooling towersNatural draftWet-cooling towerNDWCTFlue gas injectionHeat and mass transferNumerical modeling
a b s t r a c t
The paper presents a study on numerical modeling of a natural draft wet-cooling tower with flue gasinjection. A previously developed 3D CFD model of a natural draft wet-cooling tower is adopted to ac-count for the flue gas injection. The model is validated against experimental data and then applied toverify the effect of flue gas injection on the cooling tower performance. The effect of wind speed on therising plume and injected gas is also studied. It is concluded that the injected flue gas has insignificantinfluence on the cooled water temperature. The increasing wind speed is a reason of recirculation regionsformation near the tower outlet which leads to flue gas flow near the tower shell increasing the risk ofcorrosion.
© 2015 Elsevier Ltd. All rights reserved.
1. Introduction
Cooling towers are devices used to cool industrial water. Inpower plants, water cooling steam turbine condenser is introducedto the cooling towers and is cooled by atmospheric air flow. If theair is in direct contact with the water the cooling tower is called
þ48 32 2372872.nek).
5
wet-cooling tower. For dry-cooling towers the water flows throughan airewater heat exchanger [1]. Since the cooled water tempera-ture affects the efficiency of the power plants and thus the fuelconsumption and pollutant emissions, it is important to keep thetemperature low. The most frequently encountered natural draftcooling towers are large structures whose height reaches up to220 m [2]. In wet-cooling towers the water to be cooled is sprayedon the top of a heat and mass exchanger called a fill (packing) andflows downwards in a form of a film. Free-fall rain zone below thefill, allows airflow into the tower. Finally the droplets traveling
A. Klimanek et al. / Applied Thermal Engineering 91 (2015) 824e833 825
down the rain zone are collected in the water basin fromwhere thewater is pumped back to the condenser. Humidity and temperatureof the air inside the cooling tower increase and density decreases.The natural draft occurs due to the difference in the density be-tween the air inside and the ambient air outside the tower. Evap-oration and heat exchange between the water and the air areresponsible for the cooling effect.
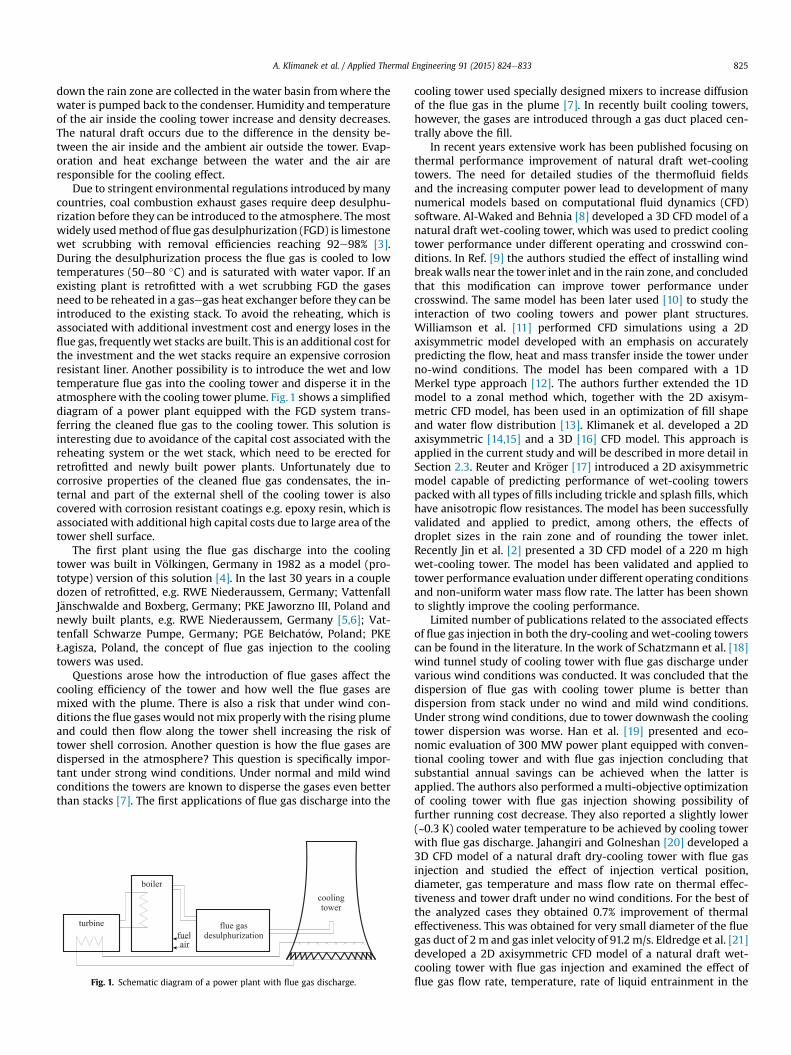
Due to stringent environmental regulations introduced bymanycountries, coal combustion exhaust gases require deep desulphu-rization before they can be introduced to the atmosphere. The mostwidely usedmethod of flue gas desulphurization (FGD) is limestonewet scrubbing with removal efficiencies reaching 92e98% [3].During the desulphurization process the flue gas is cooled to lowtemperatures (50e80 �C) and is saturated with water vapor. If anexisting plant is retrofitted with a wet scrubbing FGD the gasesneed to be reheated in a gasegas heat exchanger before they can beintroduced to the existing stack. To avoid the reheating, which isassociated with additional investment cost and energy loses in theflue gas, frequently wet stacks are built. This is an additional cost forthe investment and the wet stacks require an expensive corrosionresistant liner. Another possibility is to introduce the wet and lowtemperature flue gas into the cooling tower and disperse it in theatmosphere with the cooling tower plume. Fig. 1 shows a simplifieddiagram of a power plant equipped with the FGD system trans-ferring the cleaned flue gas to the cooling tower. This solution isinteresting due to avoidance of the capital cost associated with thereheating system or the wet stack, which need to be erected forretrofitted and newly built power plants. Unfortunately due tocorrosive properties of the cleaned flue gas condensates, the in-ternal and part of the external shell of the cooling tower is alsocovered with corrosion resistant coatings e.g. epoxy resin, which isassociated with additional high capital costs due to large area of thetower shell surface.
The first plant using the flue gas discharge into the coolingtower was built in V€olkingen, Germany in 1982 as a model (pro-totype) version of this solution [4]. In the last 30 years in a coupledozen of retrofitted, e.g. RWE Niederaussem, Germany; VattenfallJ€anschwalde and Boxberg, Germany; PKE Jaworzno III, Poland andnewly built plants, e.g. RWE Niederaussem, Germany [5,6]; Vat-tenfall Schwarze Pumpe, Germany; PGE Bełchat�ow, Poland; PKEŁagisza, Poland, the concept of flue gas injection to the coolingtowers was used.
Questions arose how the introduction of flue gases affect thecooling efficiency of the tower and how well the flue gases aremixed with the plume. There is also a risk that under wind con-ditions the flue gases would not mix properly with the rising plumeand could then flow along the tower shell increasing the risk oftower shell corrosion. Another question is how the flue gases aredispersed in the atmosphere? This question is specifically impor-tant under strong wind conditions. Under normal and mild windconditions the towers are known to disperse the gases even betterthan stacks [7]. The first applications of flue gas discharge into the
boiler
flue gasdesulphurization
turbine
coolingtower
airfuel
Fig. 1. Schematic diagram of a power plant with flue gas discharge.
cooling tower used specially designed mixers to increase diffusionof the flue gas in the plume [7]. In recently built cooling towers,however, the gases are introduced through a gas duct placed cen-trally above the fill.
In recent years extensive work has been published focusing onthermal performance improvement of natural draft wet-coolingtowers. The need for detailed studies of the thermofluid fieldsand the increasing computer power lead to development of manynumerical models based on computational fluid dynamics (CFD)software. Al-Waked and Behnia [8] developed a 3D CFD model of anatural draft wet-cooling tower, which was used to predict coolingtower performance under different operating and crosswind con-ditions. In Ref. [9] the authors studied the effect of installing windbreakwalls near the tower inlet and in the rain zone, and concludedthat this modification can improve tower performance undercrosswind. The same model has been later used [10] to study theinteraction of two cooling towers and power plant structures.Williamson et al. [11] performed CFD simulations using a 2Daxisymmetric model developed with an emphasis on accuratelypredicting the flow, heat and mass transfer inside the tower underno-wind conditions. The model has been compared with a 1DMerkel type approach [12]. The authors further extended the 1Dmodel to a zonal method which, together with the 2D axisym-metric CFD model, has been used in an optimization of fill shapeand water flow distribution [13]. Klimanek et al. developed a 2Daxisymmetric [14,15] and a 3D [16] CFD model. This approach isapplied in the current study and will be described in more detail inSection 2.3. Reuter and Kr€oger [17] introduced a 2D axisymmetricmodel capable of predicting performance of wet-cooling towerspacked with all types of fills including trickle and splash fills, whichhave anisotropic flow resistances. The model has been successfullyvalidated and applied to predict, among others, the effects ofdroplet sizes in the rain zone and of rounding the tower inlet.Recently Jin et al. [2] presented a 3D CFD model of a 220 m highwet-cooling tower. The model has been validated and applied totower performance evaluation under different operating conditionsand non-uniform water mass flow rate. The latter has been shownto slightly improve the cooling performance.
Limited number of publications related to the associated effectsof flue gas injection in both the dry-cooling and wet-cooling towerscan be found in the literature. In the work of Schatzmann et al. [18]wind tunnel study of cooling tower with flue gas discharge undervarious wind conditions was conducted. It was concluded that thedispersion of flue gas with cooling tower plume is better thandispersion from stack under no wind and mild wind conditions.Under strong wind conditions, due to tower downwash the coolingtower dispersion was worse. Han et al. [19] presented and eco-nomic evaluation of 300 MW power plant equipped with conven-tional cooling tower and with flue gas injection concluding thatsubstantial annual savings can be achieved when the latter isapplied. The authors also performed a multi-objective optimizationof cooling tower with flue gas injection showing possibility offurther running cost decrease. They also reported a slightly lower(~0.3 K) cooled water temperature to be achieved by cooling towerwith flue gas discharge. Jahangiri and Golneshan [20] developed a3D CFD model of a natural draft dry-cooling tower with flue gasinjection and studied the effect of injection vertical position,diameter, gas temperature and mass flow rate on thermal effec-tiveness and tower draft under no wind conditions. For the best ofthe analyzed cases they obtained 0.7% improvement of thermaleffectiveness. This was obtained for very small diameter of the fluegas duct of 2 m and gas inlet velocity of 91.2 m/s. Eldredge et al. [21]developed a 2D axisymmetric CFD model of a natural draft wet-cooling tower with flue gas injection and examined the effect offlue gas flow rate, temperature, rate of liquid entrainment in the
m
120m
25.8
6m
7m
95m
54.74m 200m
300m
outlet inlet
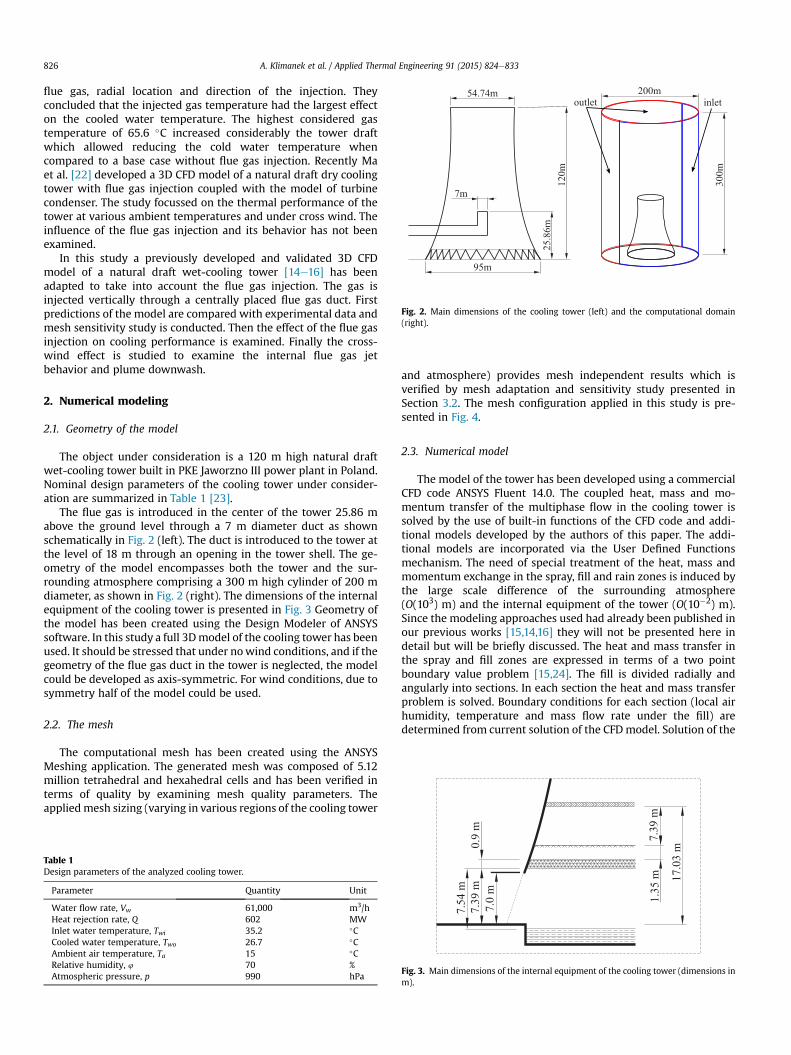
Fig. 2. Main dimensions of the cooling tower (left) and the computational domain(right).
A. Klimanek et al. / Applied Thermal Engineering 91 (2015) 824e833826
flue gas, radial location and direction of the injection. Theyconcluded that the injected gas temperature had the largest effecton the cooled water temperature. The highest considered gastemperature of 65.6 �C increased considerably the tower draftwhich allowed reducing the cold water temperature whencompared to a base case without flue gas injection. Recently Maet al. [22] developed a 3D CFD model of a natural draft dry coolingtower with flue gas injection coupled with the model of turbinecondenser. The study focussed on the thermal performance of thetower at various ambient temperatures and under cross wind. Theinfluence of the flue gas injection and its behavior has not beenexamined.
In this study a previously developed and validated 3D CFDmodel of a natural draft wet-cooling tower [14e16] has beenadapted to take into account the flue gas injection. The gas isinjected vertically through a centrally placed flue gas duct. Firstpredictions of the model are compared with experimental data andmesh sensitivity study is conducted. Then the effect of the flue gasinjection on cooling performance is examined. Finally the cross-wind effect is studied to examine the internal flue gas jetbehavior and plume downwash.
2. Numerical modeling
2.1. Geometry of the model
The object under consideration is a 120 m high natural draftwet-cooling tower built in PKE Jaworzno III power plant in Poland.Nominal design parameters of the cooling tower under consider-ation are summarized in Table 1 [23].
The flue gas is introduced in the center of the tower 25.86 mabove the ground level through a 7 m diameter duct as shownschematically in Fig. 2 (left). The duct is introduced to the tower atthe level of 18 m through an opening in the tower shell. The ge-ometry of the model encompasses both the tower and the sur-rounding atmosphere comprising a 300 m high cylinder of 200 mdiameter, as shown in Fig. 2 (right). The dimensions of the internalequipment of the cooling tower is presented in Fig. 3 Geometry ofthe model has been created using the Design Modeler of ANSYSsoftware. In this study a full 3Dmodel of the cooling tower has beenused. It should be stressed that under nowind conditions, and if thegeometry of the flue gas duct in the tower is neglected, the modelcould be developed as axis-symmetric. For wind conditions, due tosymmetry half of the model could be used.
2.2. The mesh
The computational mesh has been created using the ANSYSMeshing application. The generated mesh was composed of 5.12million tetrahedral and hexahedral cells and has been verified interms of quality by examining mesh quality parameters. Theappliedmesh sizing (varying in various regions of the cooling tower
Table 1Design parameters of the analyzed cooling tower.
Parameter Quantity Unit
Water flow rate, Vw 61,000 m3/hHeat rejection rate, Q 602 MWInlet water temperature, Twi 35.2 �CCooled water temperature, Two 26.7 �CAmbient air temperature, Ta 15 �CRelative humidity, 4 70 %Atmospheric pressure, p 990 hPa
and atmosphere) provides mesh independent results which isverified by mesh adaptation and sensitivity study presented inSection 3.2. The mesh configuration applied in this study is pre-sented in Fig. 4.
2.3. Numerical model
The model of the tower has been developed using a commercialCFD code ANSYS Fluent 14.0. The coupled heat, mass and mo-mentum transfer of the multiphase flow in the cooling tower issolved by the use of built-in functions of the CFD code and addi-tional models developed by the authors of this paper. The addi-tional models are incorporated via the User Defined Functionsmechanism. The need of special treatment of the heat, mass andmomentum exchange in the spray, fill and rain zones is induced bythe large scale difference of the surrounding atmosphere(O(103) m) and the internal equipment of the tower (O(10�2) m).Since the modeling approaches used had already been published inour previous works [15,14,16] they will not be presented here indetail but will be briefly discussed. The heat and mass transfer inthe spray and fill zones are expressed in terms of a two pointboundary value problem [15,24]. The fill is divided radially andangularly into sections. In each section the heat and mass transferproblem is solved. Boundary conditions for each section (local airhumidity, temperature and mass flow rate under the fill) aredetermined from current solution of the CFDmodel. Solution of the
0.9
m7.
39 m
7.39
1.
35 m 17
.03
m
7.0
m
7.54
m
Fig. 3. Main dimensions of the internal equipment of the cooling tower (dimensions inm).

Table 2Transport equations solved in ANSYS Fluent.
Equation No. of equations Applied to
Continuity 2 both phases e air and gas, liquid waterSpecies transport 4 primary phase e O2, CO2, SO2 and H2OMomentum 6 both phases e air and gas, liquid waterEnergy 2 both phases e air and gas, liquid waterTurbulence 2 primary phase e air and gas
Table 3Flue gas parameters.
A. Klimanek et al. / Applied Thermal Engineering 91 (2015) 824e833 827
governing equations of the heat and mass transfer model producesdistributions of mass and heat sources in each section of the fill andspray zones. These sources are plugged into appropriate transportequations (species transport and energy equations) of the CFD codeand the CFD solution is updated. This procedure is repeated untilconvergence is reached. Substantial acceleration of the computa-tions is achieved by employing a technique based on ProperOrthogonal Decomposition Radial Basis Function (POD-RBF)network [14,15]. The final result of this technique is a vector-matrixproduct defining the distribution of the heat and mass sources inthe fill and spray zones.
Temperature Tg, �C 70
Mass flow rate mg, kg/s 645.8Composition:O2 zO2
, mol/mol 0.06CO2 zCO2
, mol/mol 0.135H2O zH2O, mol/mol 0.08SO2 zSO2
, mol/mol 10�4
N2 zN2, mol/mol 0.7249
2.4. Transport equations
The equations solved in the CFD code are the mass, momentumand energy equations. Additionally species transport equations aresolved for O2, CO2, SO2 and H2 O (vapor). The concentration of N2 isinferred from the concentrations of the remaining species. Themultiphase flow in the rain zone of the cooling tower is solvedusing the EulereEuler approach. This requires solution of the mass,momentum and energy transport equations for the liquid phase aswell. The Realizable k�ε turbulence model is used to close thesystem of equations. The option Dispersed is used to account for theturbulence of the secondary phase. The governing equations aresolved in a steady statewith second order discretization schemes inspace. The governing equations are summarized in Table 2.
2.5. Momentum transfer in the fill, spray zone and drift eliminator
The pressure drop in the fill (fi), spray zone (sz) as well as in thedrift eliminator (de) was taken into account by introducing sourcesto themomentum equations using the built in porousmediamodel.
Fig. 4. The applied mesh configuration e cr
Themomentum source Si in zone i (pressure drop per unit length) isgiven in the form
Si ¼ Ci12ru2 (1)
where r and u are inflowing air density and velocity, respectivelyand Ci in m�1 for the fill zone is given by Ref. [25]
Cfi ¼ ð6:8þ 0:8GwÞ.Hfi (2)
and for the spray zone [26]
oss section in the cooling tower center.

Table 4Air and water parameters.
Parameter Symbol c1 c2 c3
Dry bulb airtemperature
Ta, �C 7.1 ± 0.4 9.2 ± 0.2 9.1 ± 0.4
Wet bulb airtemperature
Tawb, �C 3.4 ± 0.6 4.1 ± 0.4 4.1 ± 0.4
Atmosphericpressure
p, hPa 996.1 995.3 995.3
Wind speed(at z0 ¼ 2 m)
u0, m/s 1.60 1.49 1.55
Water massflow rate
mw, kg/s 14,876 ± 281 14,876 ± 281 14,876 ± 281
Hot watertemperature
Twh, �C 29.2 ± 0.2 30.0 ± 0.2 29.7 ± 0.2
Table 5Comparison of measured and predicted cold water temperatures.
Cold water temperature Symbol c1 c2 c3
Measured Twcm, �C 19.2 ± 0.2 19.9 ± 0.2 19.8 ± 0.2Computed Twcc, �C 19.8 20.0 19.9Absolute difference jDTwcj, �C 0.6 0.1 0.1
A. Klimanek et al. / Applied Thermal Engineering 91 (2015) 824e833828
Csz ¼ 0:52ðGa=GwÞ�1:32 (3)
where Ga and Gw are air and water mass fluxes in kg/m2s, respec-tively and Hfi ¼ 0.9 m is the fill depth. The loss coefficient for thedrift eliminator is [25] Cde ¼ 12.5 m�1.
2.6. The Merkel number in the fill and spray zones
A film fill of total area A ¼ 6400 m2 is installed in the tower. Themodified Poppe approach presented in Refs. [15,24] has beenadopted in this study to account for heat and mass transfer in thefill and the spray zones. The Merkel number according to theMerkel theory in the fill is given by [25]
Fig. 5. Contours of velocity magnitude (left) and temper
Mefi ¼ 1:5ðGa=GwÞ0:6 (4)
The Merkel number in the spray zone is [15].
Mesz ¼ 0:2HszðGa=GwÞ0:5 (5)
where Hsz ¼ 1.35 m is the spray zone depth. The same procedure asdescribed in Ref. [15] has been applied to account for the differ-ences of the Merkel number in the Merkel and Poppe approaches.
2.7. The rain zone
The rain zone is treated as multiphase region where theEulereEuler multiphasemodel is applied. The heat andmomentumtransfer between spherical water droplets and the air is modeledinternally within the multiphase model, where the correlation ofRanz and Marshal [27] is used to determine heat transfer and cor-relation of Schiller and Naumann [27] is used to determine the dragcoefficient. The mass transfer is determined applying analogy be-tween heat and mass transfer as described in Ref. [15]. A constantdroplet diameter in the rain zone of 5.5 mm, typical for film fills[28] has been assumed.
2.8. Boundary conditions
The calculations have been performed taking into account thewind. For validating computations the measured wind velocity hasbeen used to define the velocity profile of air in the atmosphere.The velocity profile in the atmosphere can be described by Ref.[29,30].
u ¼ u0ðz=z0Þm (6)
where u is the velocity at elevation z and u0 is the measured ve-locity at elevation z0. The index m varies during the day and theseason. A value ofm ¼ 0.1 has been used in all the calculations [29].The wind speed measurements were taken at z0 ¼ 2 m above theground level. The pressure outlet boundary condition has beenused at the top and at the outlet of the domain, as shown in Fig. 2.
ature (right) for case c3 (wind speed u0 ¼ 1.55 m/s).

−100 −50 0 50 1000
2
4
6
8
10
12
14
16
18
Radial distance, m
Vel
ocity
mag
nitu
de, m
/s
na − 30mad1 − 30mad2 − 30mna − 90mad1 − 90mad2 − 90mna − 150mad1 − 150mad2 − 150mna − 210mad1 − 210mad2 − 210mna − 270mad1 − 270mad2 − 270m
Fig. 6. Velocity magnitude profiles for the original mesh (na), single (ad1) and double(ad2) mesh adaptation at various elevations above the ground level for case c3.
Table 7Comparison of predicted cold water temperatures for cases with and without fluegas injection.
c3 c4 c5 c6
Flue gas injection Yes No Yes NoWind speed u0, m/s 1.55 1.55 0.0 0.0Cold water temperature, �C 19.89 19.90 19.41 19.43Flue gas mass flowrate, kg/s 645.8 0.0 645.8 0.0Total mass flowrate, kg/s 10096.1 9426.3 10404.7 9721.2
A. Klimanek et al. / Applied Thermal Engineering 91 (2015) 824e833 829
The atmosphere has been assumed to be isothermal. The velocityinlet boundary condition is used for the flue gas injection. It hasbeen assumed that the parameters of the injected flue gas are thesame in all analyzed cases. Summary of the input flue gas param-eters is presented in Table 3. As can be seen from Fig. 2 the shortestdistance from the boundary to the tower is 52.5 m, therefore in-fluence of the boundary conditions on the obtained results can beexpected. This effect has not been examined in this study.
3. Results and discussion
3.1. Validation of the model
In order to validate the developed model, cold water tempera-tures obtained from three experiments (c1, c2 and c3) [23] werecompared with cold water temperatures predicted by the model.The measured values obtained from the experiments are presentedin Tables 4 and 5. It can be seen that the experimental data vary justslightly, however due to large uncertainty in the measured watermass flow rates, all three cases (c1, c2 and c3) were used for thecomparison. The uncertainties given in Tables 4 and 5 are theexpanded uncertainties with a coverage factor of 2 providing a levelof confidence of 95.4%. The fact that only the cold water tempera-tures could be compared with the computations limits the credi-bility of the validation. These are however the only data available.The data presented in Table 4 were used as model inputs. In Table 5the measured and computed cold water temperatures are pre-sented along with the absolute difference between the measure-ments andmodel predictions. It can be seen that themodel predictssimilar cooled water temperatures to the measured values. In Fig. 5contours of velocity and temperature inside the cooling tower andin the surroundings for case c3 are presented. It is visible how therising plume is bent due to the wind and that the air under thetower is heated due to the water flow in the rain zone.
Table 6Comparison of mean cold water temperatures and total gas mass flow rates for casec3 with the original and adapted meshes.
Mesh adaptation No Single Double
Cold water temperature, �C 19.82 19.89 19.89Total mass flowrate, kg/s 10,134.6 10,096.1 10,086.5
3.2. Mesh sensitivity study
The applied mesh has been validated by conducting a sensitivitystudy. The influence of mesh density on the simulation results forcase c3 has been examined by double mesh adaptation and veri-fication of the results. The mesh has been adapted in regions of thehighest gas velocity gradients. The applied mesh adaptation strat-egy was that all cells with velocity gradient values higher than 10%of maximum gradient have been refined. The original mesh builtout of 5.12 million elements has at first been adapted to obtain 5.63million elements and then adapted further to obtain 6.68 millionelements. In Fig. 6 profiles of velocity magnitude for the threeanalyzed meshes are presented at various elevations above theground level. As can be seen the profiles coincide virtually at allpositions except for those near the tower shell regions and in thecenter of the rising plume at the lines placed 90 and 150 m abovethe ground level, where for the adapted meshes the predictedmaximum velocities were slightly higher. These discrepancies arehowever small and do not affect themean quantities likemean coldwater temperature and the total gas mass flow rate through thetower. The predicted cold water temperatures and total gas massflow rates through the tower obtained for the three meshes arepresented in Table 6. Due to small influence of mesh density on theresults, all results presented in this study stem from single meshadaptation.
3.3. Cooling improvement by flue gas injection
The model has then been used to verify the influence of the fluegas injection on cooled water temperature and air flow through thetower. For this purpose case c3 from Table 4 has been used asreference. Additional computations have been done for the samesettings as in c3 but without flue gas injection (case c4). Further-more cases c5 and c6 were considered inwhich no-wind conditionswere assumed. In case c5 the flue gas was introduced to the towerand in case c6 it was not. The predicted cooled water temperatureand air flow through the tower are presented in Table 7. As can beseen the cold water temperatures are virtually identical and nopositive effect of the flue gas injection is visible. The total massflowrate presented in Table 7 is composed of the air and flue gasmass flowrates. The air mass flowrate through the cooling toweroutlet is 9450.3 kg/s in case c3 and 9758.9 kg/s in case c5. Thisshows that the increase of air mass flow rate through the tower dueto flue gas injection is only 24.0 kg/s in case c3 and 37.7 kg/s in casec5. Nonetheless the injected flue gas is hot (70 �C) this is too little to
Table 8The effect of wind on cold water and air flow through the tower.
Wind speed, m/s 0 0.5 1.55 3.0 4.5
Total mass flowrate, kg/s 10404.7 10187.3 10096.1 9229.3 9070.8Cold water temperature:Rain zone inlet, �C 21.76 22.00 22.33 23.36 23.65Rain zone outlet, �C 19.41 19.63 19.89 20.75 20.80
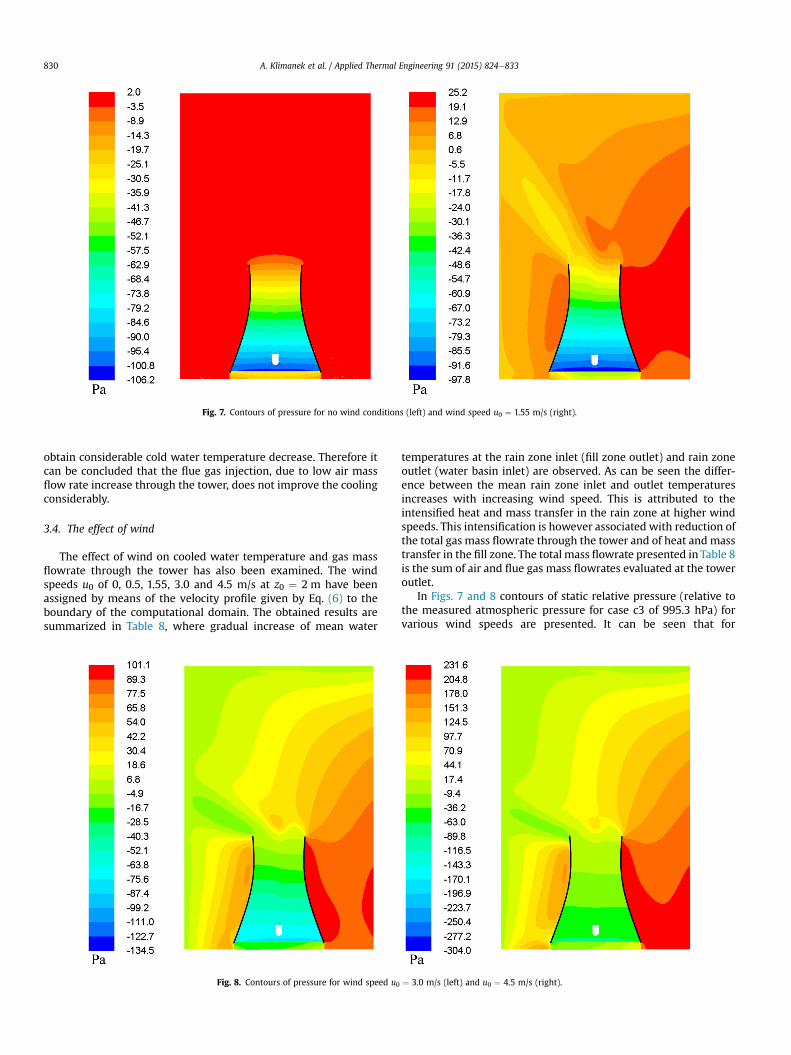
Fig. 7. Contours of pressure for no wind conditions (left) and wind speed u0 ¼ 1.55 m/s (right).
A. Klimanek et al. / Applied Thermal Engineering 91 (2015) 824e833830
obtain considerable cold water temperature decrease. Therefore itcan be concluded that the flue gas injection, due to low air massflow rate increase through the tower, does not improve the coolingconsiderably.
3.4. The effect of wind
The effect of wind on cooled water temperature and gas massflowrate through the tower has also been examined. The windspeeds u0 of 0, 0.5, 1.55, 3.0 and 4.5 m/s at z0 ¼ 2 m have beenassigned by means of the velocity profile given by Eq. (6) to theboundary of the computational domain. The obtained results aresummarized in Table 8, where gradual increase of mean water
Fig. 8. Contours of pressure for wind speed u0
temperatures at the rain zone inlet (fill zone outlet) and rain zoneoutlet (water basin inlet) are observed. As can be seen the differ-ence between the mean rain zone inlet and outlet temperaturesincreases with increasing wind speed. This is attributed to theintensified heat and mass transfer in the rain zone at higher windspeeds. This intensification is however associated with reduction ofthe total gas mass flowrate through the tower and of heat and masstransfer in the fill zone. The total mass flowrate presented in Table 8is the sum of air and flue gas mass flowrates evaluated at the toweroutlet.
In Figs. 7 and 8 contours of static relative pressure (relative tothe measured atmospheric pressure for case c3 of 995.3 hPa) forvarious wind speeds are presented. It can be seen that for
¼ 3.0 m/s (left) and u0 ¼ 4.5 m/s (right).
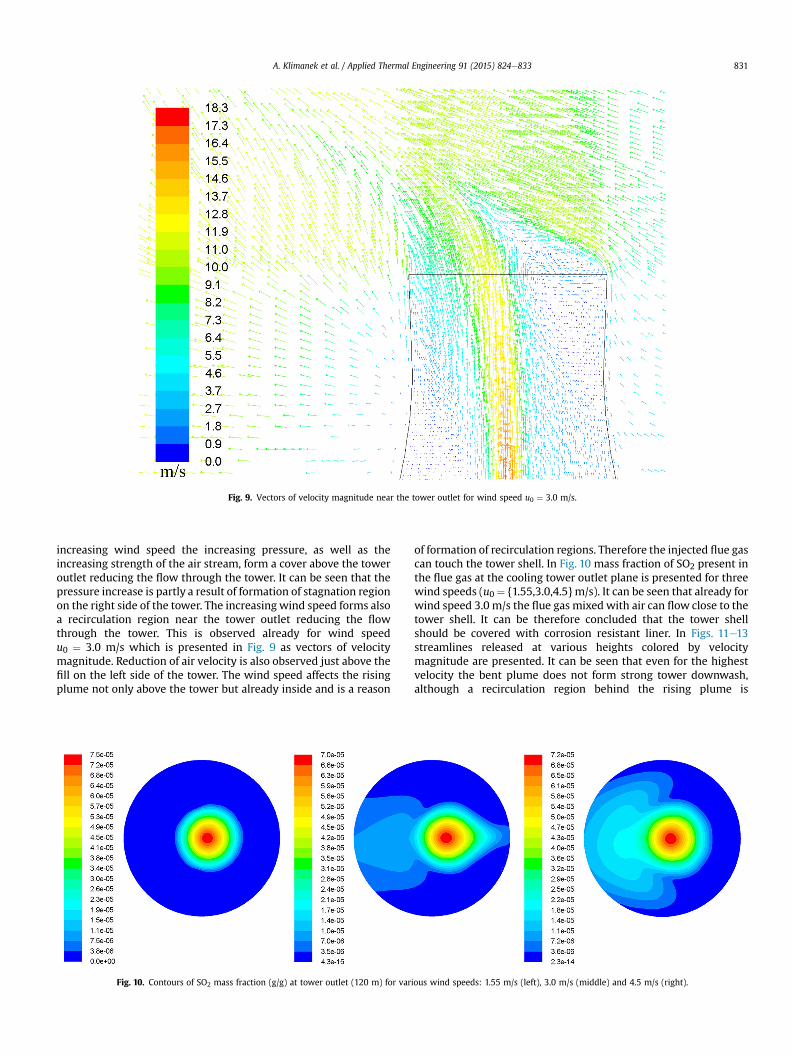
Fig. 9. Vectors of velocity magnitude near the tower outlet for wind speed u0 ¼ 3.0 m/s.
A. Klimanek et al. / Applied Thermal Engineering 91 (2015) 824e833 831
increasing wind speed the increasing pressure, as well as theincreasing strength of the air stream, form a cover above the toweroutlet reducing the flow through the tower. It can be seen that thepressure increase is partly a result of formation of stagnation regionon the right side of the tower. The increasing wind speed forms alsoa recirculation region near the tower outlet reducing the flowthrough the tower. This is observed already for wind speedu0 ¼ 3.0 m/s which is presented in Fig. 9 as vectors of velocitymagnitude. Reduction of air velocity is also observed just above thefill on the left side of the tower. The wind speed affects the risingplume not only above the tower but already inside and is a reason
Fig. 10. Contours of SO2 mass fraction (g/g) at tower outlet (120 m) for var
of formation of recirculation regions. Therefore the injected flue gascan touch the tower shell. In Fig. 10 mass fraction of SO2 present inthe flue gas at the cooling tower outlet plane is presented for threewind speeds (u0 ¼ {1.55,3.0,4.5} m/s). It can be seen that already forwind speed 3.0 m/s the flue gas mixed with air can flow close to thetower shell. It can be therefore concluded that the tower shellshould be covered with corrosion resistant liner. In Figs. 11e13streamlines released at various heights colored by velocitymagnitude are presented. It can be seen that even for the highestvelocity the bent plume does not form strong tower downwash,although a recirculation region behind the rising plume is
ious wind speeds: 1.55 m/s (left), 3.0 m/s (middle) and 4.5 m/s (right).

Fig. 11. Streamlines colored by velocity magnitude released at various elevations for u0 ¼ 1.55 m/s (left), u0 ¼ 3.0 m/s (middle) and u0 ¼ 4.5 m/s (right). (For interpretation of thereferences to colour in this figure legend, the reader is referred to the web version of this article.)
Fig. 12. Streamlines colored by velocity magnitude released at various elevations for u0 ¼ 1.55 m/s (left), u0 ¼ 3.0 m/s (middle) and u0 ¼ 4.5 m/s (right). (For interpretation of thereferences to colour in this figure legend, the reader is referred to the web version of this article.)
A. Klimanek et al. / Applied Thermal Engineering 91 (2015) 824e833832
observed. Increased downwind flue gas concentrations are also notobserved at elevations much lower than the tower outlet. Theincreasing wind velocity affects also the air flow through the rainzone and the amount of air sucked by the low pressure inside. It canbe seen in Figs. 12 and 13 that in all analyzed cases some of the air is
Fig. 13. Streamlines colored by velocity magnitude released at various positions 5 m above(For interpretation of the references to colour in this figure legend, the reader is referred t
sucked to the tower from the downwind region. This is specificallyvisible in Fig. 13, where the streamlines are released at various lo-cations 5 m above the ground level. This effect is howeverconsiderably reduced for the highest wind velocity. Trailingvortices are also formed on both sides at the top of the tower for
the ground level for u0 ¼ 1.55 m/s (left), u0 ¼ 3.0 m/s (middle) and u0 ¼ 4.5 m/s (right).o the web version of this article.)

A. Klimanek et al. / Applied Thermal Engineering 91 (2015) 824e833 833
u0 ¼ 3.0 and u0 ¼ 4.5 m/s. For the latter case, they are also observedat the bottom, where the air passing the rain zone leaves the towerand is sucked to the low pressure downwind region.
4. Conclusions
A previously developed CFD model of a natural draft wet-cooling tower has been adopted to account for flue gas injection.The adopted model has been validated against experimental data,however only the mean cooled water temperature could becompared. The predicted water temperatures agree well with themeasured values. The model has then been used to study the in-fluence of flue gas injection on cooled water temperature and airmass flowrate through the tower. It has been shown that the in-jection has positive, but insignificant effect on cooled water tem-perature due to a slight increase of air flow rate through the tower.Finally operation of the tower with flue gas injection under windconditions has been studied. The very well known effect of cooledwater temperature increase with increasing wind speed has beenconfirmed. It was also shown that under strong wind conditions,the centrally introduced flue gas can flow close to the tower shelldue to inflow of cold air and bending of the gas (air and flue gas)stream. This can increase the risk of corrosion of the tower shell andtherefore application of corrosion resistant liner is required.
Acknowledgements
This study has been supported by the statutory research fund ofthe Silesian University of Technology, Faculty of Energy and Envi-ronmental Engineering, Institute of Thermal Technology.
References
[1] D. Kr€oger, Air-cooled Heat Exchangers and Cooling Towers, Penn Well Cor-poration, Oklahoma, USA, 2004.
[2] T. Jin, L. Zhang, K. Luo, J. Fan, Three-dimensional numerical study on thermalperformance of a super large natural draft cooling tower of 220m height,J. Therm. Sci. 22 (3) (2013) 234e241.
[3] P. C�ordoba, Status of flue gas desulphurisation (FGD) systems from coal-firedpower plants: overview of the physic-chemical control processes of wetlimestone FGDs, Fuel 144 (2015) 274e286.
[4] G. Ernst, J. Leidinger, K. Natusch, H. Petzel, G. Scholl, R. 45, Kühlturm undRauchgasentschwefelungsanlage des Modellkraftwerkes V€olkingen, Fortschr.-Ber. VDI, vol. 15, VDI Verlag, Düsseldorf, Germany, 1986 (in German).
[5] D. Busch, R. Harteb, W. Kr€atzig, U. Montag, New natural draft cooling tower of200 m of height, Eng. Struct 24 (12) (2002) 1509e1521.
[6] M. Roth, R. Gerber, A. Niepel, Commissioning and operation of the world-widelargest natural draught wet cooling tower of a lignite-fired power plant withflue gas discharge, in: I. Mungan, U. Wittek (Eds.), Natural Draught CoolingTowers, Proceedings of the Fifth International Symposium on Natural DraughtCooling Towers, Istanbul, Turkey, 20e22 May 2004, CRC Press, London, UK,2004, pp. 73e78.
[7] H. Damjakob, G. Duddeck, H. W€ohler, Flue gas discharge via natural draughtcooling towers - a survey, in: U. Wittek, W. Kr€atzig (Eds.), Natural Draught
Cooling Towers, Proceedings of the 4th International Symposium of NaturalDraught Cooling Towers, Kaiserslautern, Germany, 29-31 May 1996, A.A.Balkema, Rotterdam, Netherlands, 1994, pp. 45e54.
[8] R. Al-Waked, M. Behnia, CFD simulation of wet cooling towers, Appl. Therm.Eng. 26 (2006) 382e395.
[9] R. Al-Waked, M. Behnia, Enhancing performance of wet cooling towers, En-ergy Convers. Manag. 48 (2007) 2638e2648.
[10] R. Al-Waked, Crosswinds effect on the performance of natural draft wetcooling towers, Int. J. Therm. Sci. 49 (2010) 218e224.
[11] N. Williamson, S. Armfield, M. Behnia, Numerical simulation of flow in anatural draft wet cooling tower - the effect of radial thermofluid fields, Appl.Therm. Eng. 28 (2008) 178e189.
[12] N. Williamson, M. Behnia, S. Armfield, Comparison of a 2D axisymmetric CFDmodel of a natural draft wet cooling tower and a 1D model, Int. J. Heat MassTransf. 51 (9e10) (2008) 2227e2236.
[13] N. Williamson, M. Behnia, S. Armfield, Thermal optimization of a natural draftwet cooling tower, Int. J. Energy Res. 32 (2008) 1349e1361.
[14] A. Klimanek, R. Białecki, Z. Ostrowski, CFD two scale model of a wet naturaldraft cooling tower, Numer. Heat. Transf. Part A Appl. 57 (2010) 119e137.
[15] A. Klimanek, Numerical modelling of natural draft wet-cooling towers, Arch.Comput. Methods Eng. 20 (1) (2013) 61e109.
[16] A. Klimanek, R. Białecki, A 3D CFD model of a natural draft wet-cooling tower,Arch. Thermodyn. 30 (4) (2009) 119e132.
[17] H. Reuter, D. Kr€oger, A new two-dimensional CFD model to predict the per-formance of natural draught wet-cooling towers packed with trickle or splashfills, in: 14th International Heat Transfer Conference, IHTC14, ASME, Wash-ington, DC, USA, 2010, pp. 589e598.
[18] M. Schatzmann, A. Lohmeyer, G. Ortner, Flue gas discharge from coolingtowers. wind tunnel investigation of building downwash effects on ground-level concentrations, Atmos. Environ. 21 (8) (1987) 1713e1724.
[19] Q. Han, D. Liu, F. Chen, Z. Yang, The energy-saving benefit and economicevaluation analysis of cooling tower with flue gas injection, in: Proceedings ofthe 1st International Conference on Sustainable Power Generation and Supply(SUPERGEN), Power Network Technology Press, Beijing, China, 2009.S08P0643.
[20] A. Jahangiri, A. Golneshan, Feasibility study of the thermal performanceimprovement of natural draft dry cooling towers due to flue gas injection,World Appl. Sci. J. 12 (4) (2001) 568e575.
[21] T. Eldredge, D. Benton, J. Hodgson, An investigation of the effects of flue gasinjection on natural draft cooling tower performance, J. Eng. Gas. TurbinesPower 119 (2) (1997) 478e484.
[22] H. Ma, F. Si, L. Li, W. Yan, K. Zhu, Effects of ambient temperature and cross-wind on thermo-flow performance of the tower under energy balance of theindirect dry cooling system, Appl. Therm. Eng. 78 (2015) 90e100.
[23] A. Drajczyk, E. Magiera, Report on Measurements of Cooling Tower No. 2 atJaworzno III S.a. Power Plant, vol. 20/99(04), Zakłady pomiarowo-badawczeenergetyki Energopomiar Sp, z o.o., Gliwice, Poland, 1999 (in Polish).
[24] A. Klimanek, R. Białecki, Solution of heat and mass transfer in counterflowwet-cooling tower fills, Int. Commun. Heat. Mass 36 (6) (2009) 547e553.
[25] A. Stechman, Procedures for Winter Operation of Wet-cooling Towers (PhDthesis), Faculty of Energy and Environmental Engineering, Silesian Universityof Technology, Gliwice, Poland, 2006 (in Polish).
[26] R. Rish, The design of a natural draught cooling tower, in: Proceedings of 2ndInternational Heat Transfer Conference, Boulder, Colorado, USA, 1961, pp.951e958.
[27] ANSYS FLUENT, Fluent 14.0 Theory Guide, ANSYS, Inc, 2011. Softwaredocumentation.
[28] R. Terblanche, H. Reuter, D. Kr€oger, Drop size distribution below differentwet-cooling tower fills, Appl. Therm. Eng. 29 (2009) 1552e1560.
[29] J. Juda, S. Chr�o�sciel, Air Protection, WNT, Warsaw, Poland, 1974 (in Polish).[30] R. Grybo�s, S. Tomaszek, Climate Change Processes above Industrialized Area,
Wydawnictwo Politechniki �Slaskiej, Gliwice, Poland, 1997 (in Polish).