Embed Size (px)
Citation preview
Lingnan University Matthieu Crozet
Applied Econometrics
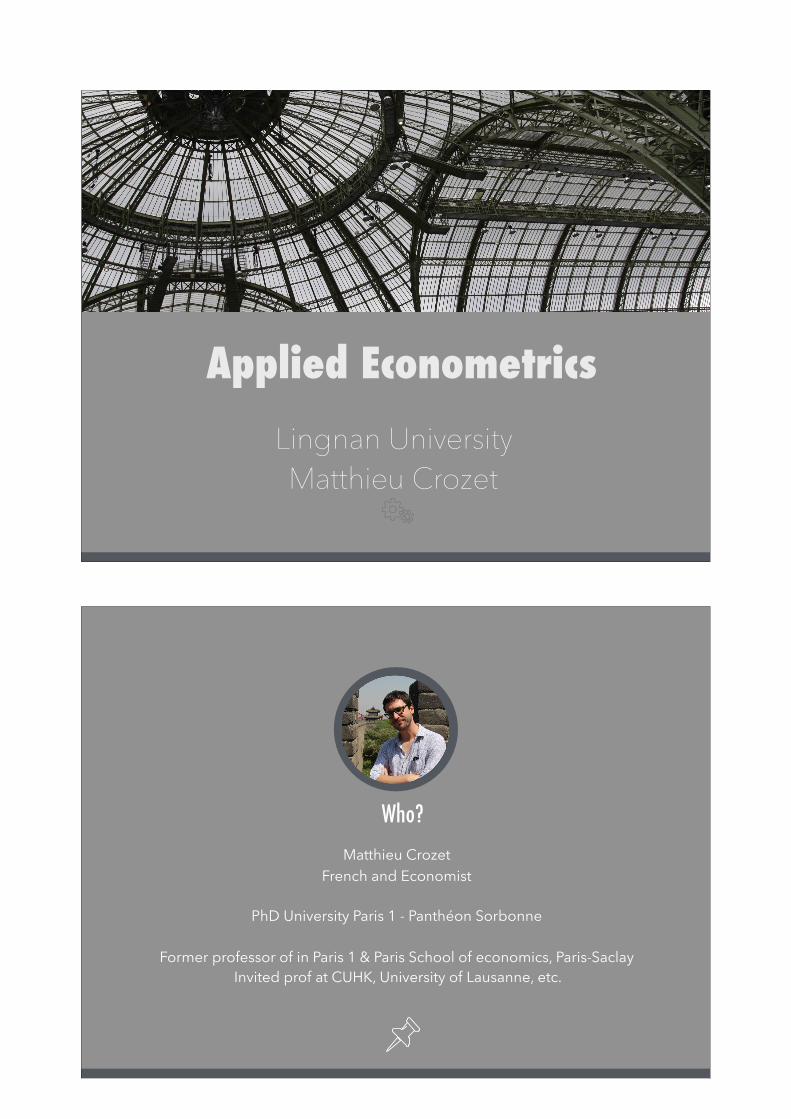
Who? Matthieu Crozet
French and Economist
PhD University Paris 1 - Panthéon Sorbonne
Former professor of in Paris 1 & Paris School of economics, Paris-Saclay Invited prof at CUHK, University of Lausanne, etc.
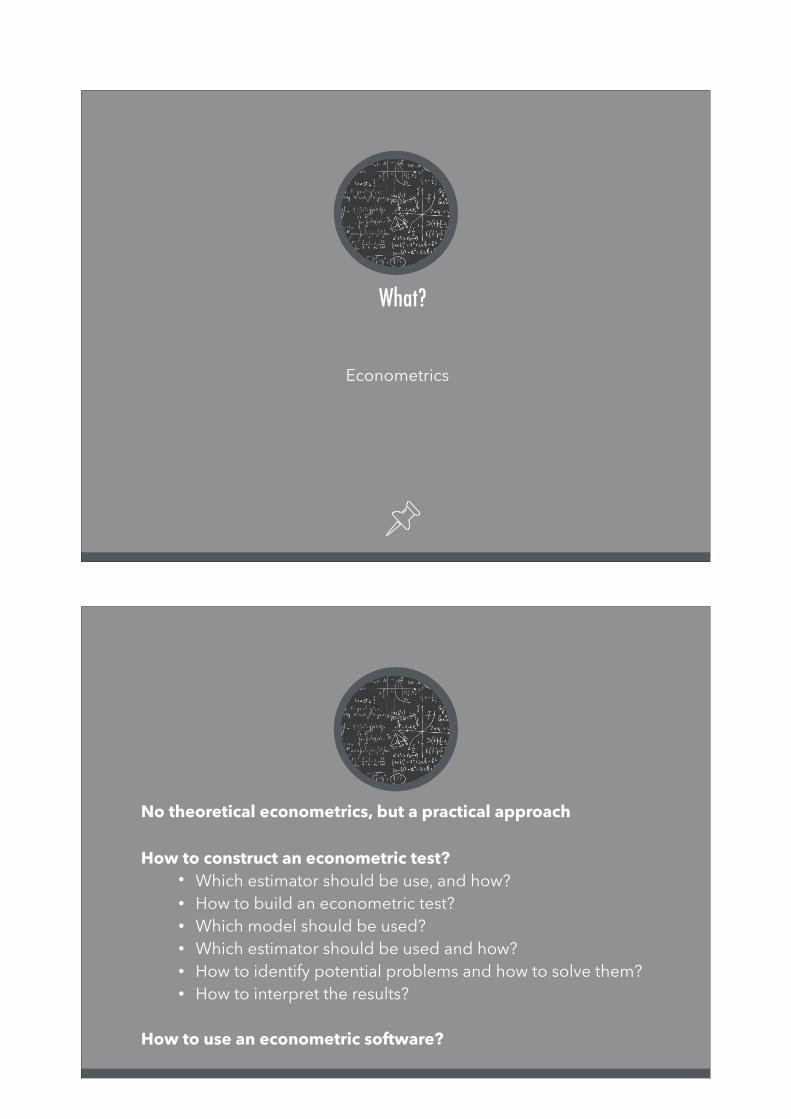
What?
Econometrics
No theoretical econometrics, but a practical approach
How to construct an econometric test? • Which estimator should be use, and how? • How to build an econometric test? • Which model should be used? • Which estimator should be used and how? • How to identify potential problems and how to solve them? • How to interpret the results?
How to use an econometric software?
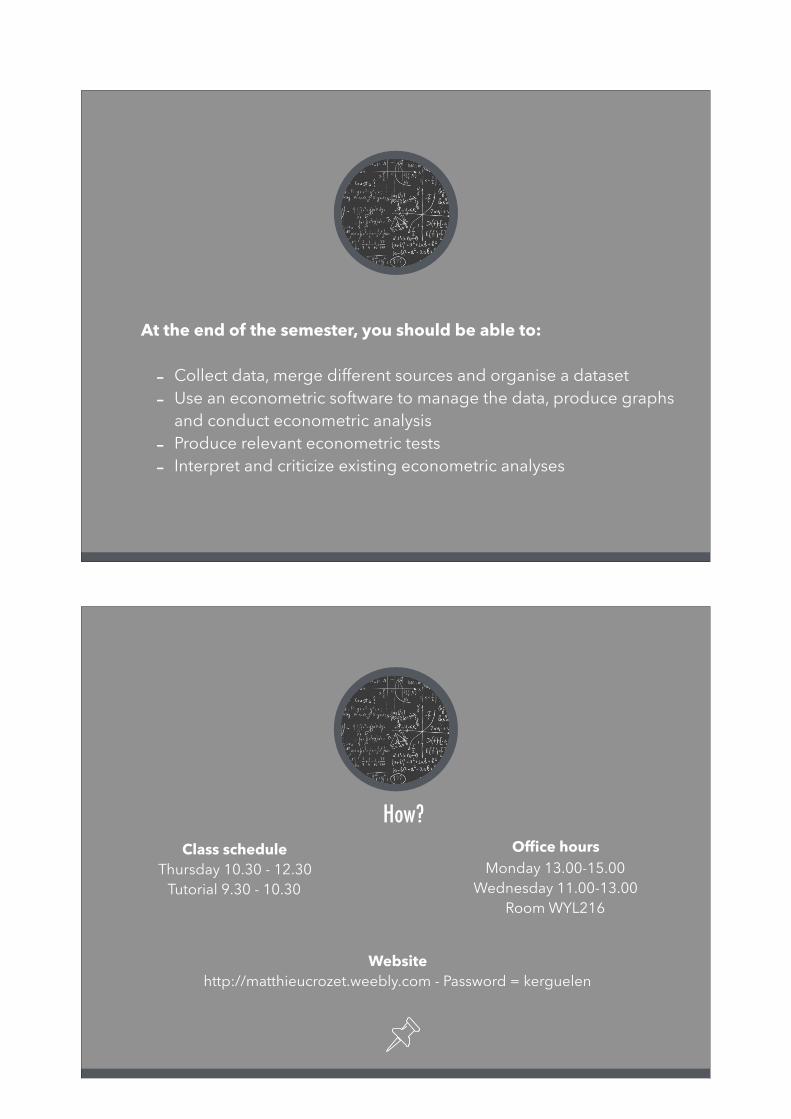
At the end of the semester, you should be able to:
- Collect data, merge different sources and organise a dataset - Use an econometric software to manage the data, produce graphs
and conduct econometric analysis - Produce relevant econometric tests - Interpret and criticize existing econometric analyses
How?
Website http://matthieucrozet.weebly.com - Password = kerguelen
Office hours Monday 13.00-15.00
Wednesday 11.00-13.00 Room WYL216
Class schedule Thursday 10.30 - 12.30
Tutorial 9.30 - 10.30
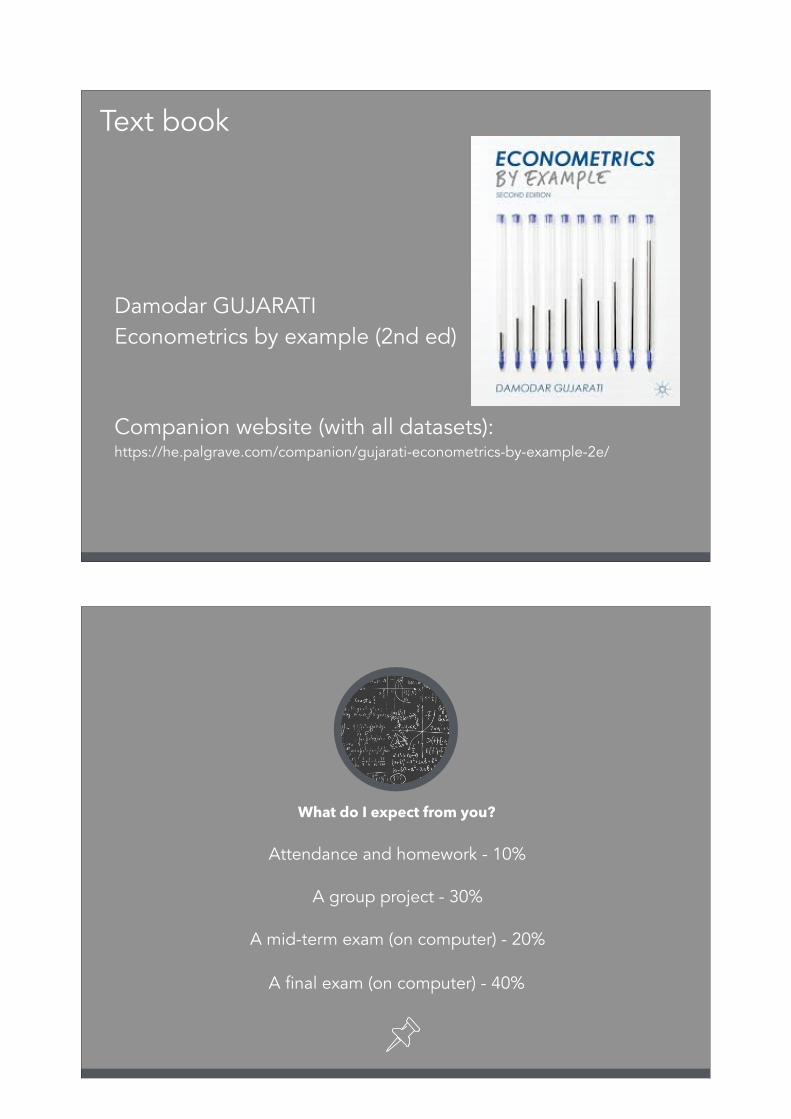
Text book
Damodar GUJARATI Econometrics by example (2nd ed)
Companion website (with all datasets): https://he.palgrave.com/companion/gujarati-econometrics-by-example-2e/
What do I expect from you?
Attendance and homework - 10%
A group project - 30%
A mid-term exam (on computer) - 20%
A final exam (on computer) - 40%
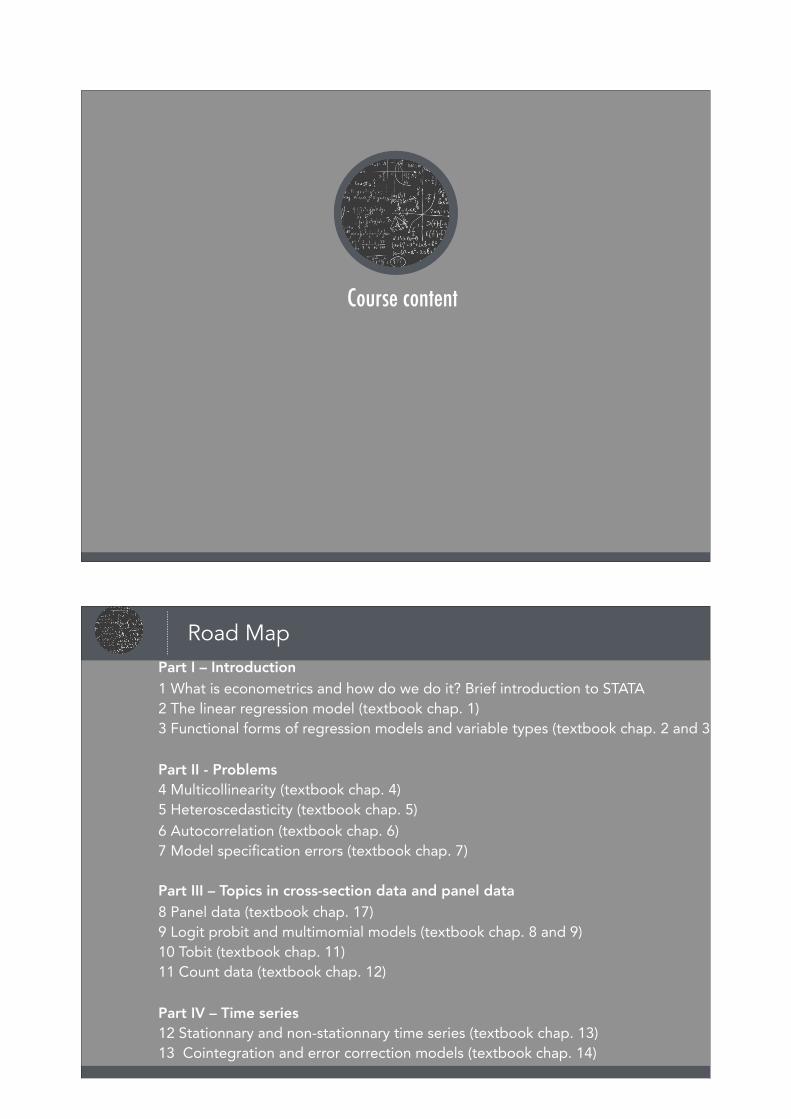
Course content
Road MapPart I – Introduction 1 What is econometrics and how do we do it? Brief introduction to STATA 2 The linear regression model (textbook chap. 1) 3 Functional forms of regression models and variable types (textbook chap. 2 and 3)
Part II - Problems 4 Multicollinearity (textbook chap. 4) 5 Heteroscedasticity (textbook chap. 5) 6 Autocorrelation (textbook chap. 6) 7 Model specification errors (textbook chap. 7)
Part III – Topics in cross-section data and panel data 8 Panel data (textbook chap. 17) 9 Logit probit and multimomial models (textbook chap. 8 and 9) 10 Tobit (textbook chap. 11) 11 Count data (textbook chap. 12)
Part IV – Time series 12 Stationnary and non-stationnary time series (textbook chap. 13) 13 Cointegration and error correction models (textbook chap. 14)
Chapter 1 What is econometrics and how do we do it?
Applied Econometrics
What is econometrics?
ECONOMETRICS
The branch of economics concerned with the use of mathematical methods (especially statistics) in describing economic systems (Oxford dictionary)
More generally (and more exactly): The branch of economics that applies statistical methods to the empirical study of economic theories and relationships
Applications go far beyond academic economic studies:
- All sciences (physics, medical studies, etc)
- Social sciences (sociology, psychology, political science, etc)
- Practical data analyses: Finance, Marketing, etc.
What is econometrics?
Why these statistical tools have been developed mainly for economics?
= Why econometrics is so important for social science?
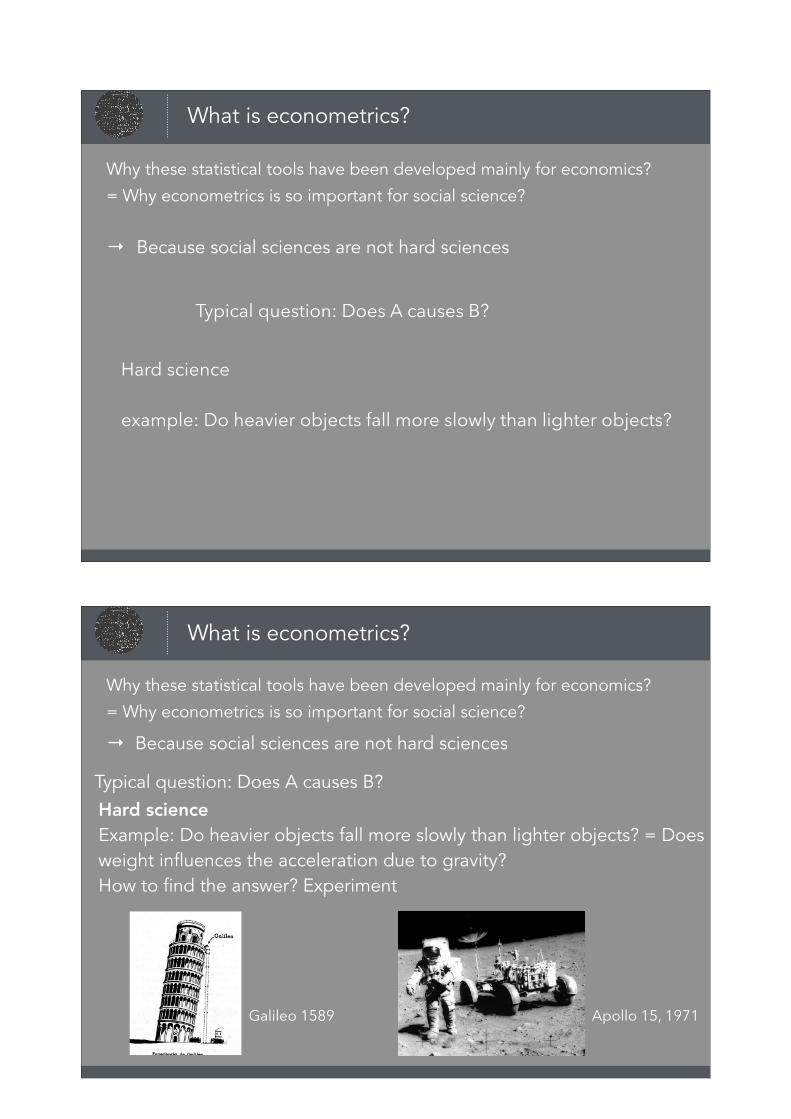
→ Because social sciences are not hard sciences
Typical question: Does A causes B?
Hard science
example: Do heavier objects fall more slowly than lighter objects?
What is econometrics?
Why these statistical tools have been developed mainly for economics?
= Why econometrics is so important for social science?
→ Because social sciences are not hard sciences
Typical question: Does A causes B? Hard science Example: Do heavier objects fall more slowly than lighter objects? = Does weight influences the acceleration due to gravity? How to find the answer? Experiment
Galileo 1589 Apollo 15, 1971
What is econometrics?
Why these statistical tools have been developed mainly for economics?
= Why econometrics is so important for social science?
→ Because social sciences are not hard sciences
Typical question: Does A causes B?
Social science Example 1: Does corruption causes underdevelopment? What should be the experiment?
- Pick at least two perfectly identical societies
- Choose randomly one and inoculate corruption
- Make sure that both societies are impacted by exactly identical shocks during, say, ten years
- Observe the results
What is econometrics?
Why these statistical tools have been developed mainly for economics?
= Why econometrics is so important for social science?
→ Because social sciences are not hard sciences
Typical question: Does A causes B?
Social science Example 2: Do people living in wealthier societies are happier? What should be the experiment?
- Pick at least two perfectly identical societies
- Choose randomly one and give loads of money
- Make sure that both groups are impacted by exactly identical shocks during, say, ten years
- Observe the results
What is econometrics?
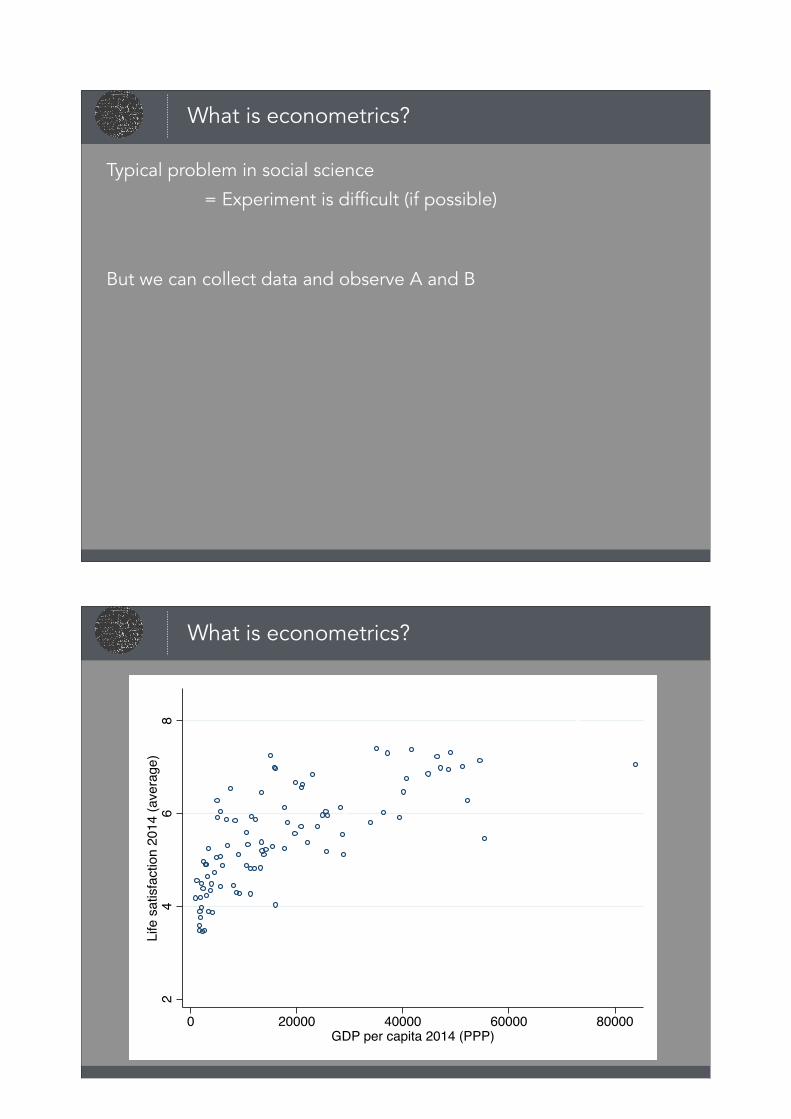
Typical problem in social science
= Experiment is difficult (if possible)
But we can collect data and observe A and B
What is econometrics?
24
68
Life
sat
isfa
ctio
n 20
14 (a
vera
ge)
0 20000 40000 60000 80000GDP per capita 2014 (PPP)
HKG
FRA
SGP
PER
24
68
Life
sat
isfa
ctio
n 20
14 (a
vera
ge)
0 20000 40000 60000 80000GDP per capita 2014 (PPP)
24
68
Life
sat
isfa
ctio
n 20
14 (a
vera
ge)
0 20000 40000 60000 80000GDP per capita 2014 (PPP)
What is econometrics?
24
68
Life
sat
isfa
ctio
n 20
14 (a
vera
ge)
0 20000 40000 60000 80000GDP per capita 2014 (PPP)
HKG
FRA
SGP
PER
24
68
Life
sat
isfa
ctio
n 20
14 (a
vera
ge)
0 20000 40000 60000 80000GDP per capita 2014 (PPP)
What is econometrics?
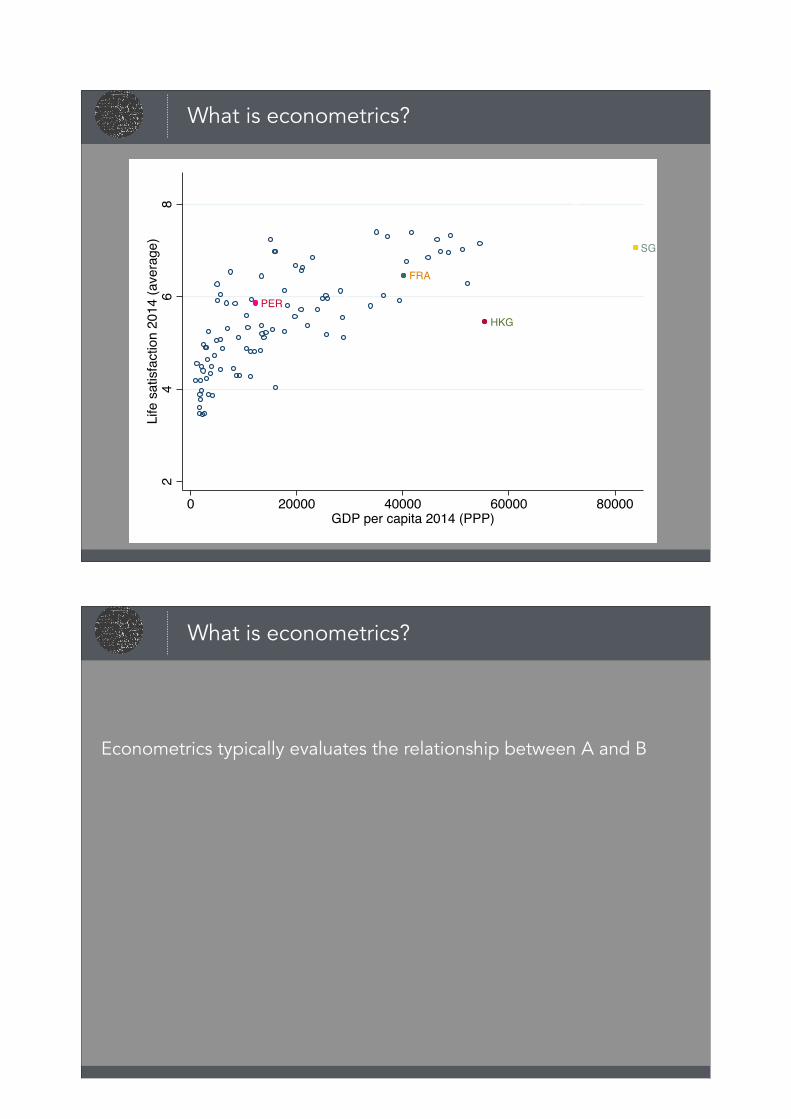
Econometrics typically evaluates the relationship between A and B
What is econometrics?
24
68
Life
sat
isfa
ctio
n 20
14 (a
vera
ge)
0 20000 40000 60000 80000GDP per capita 2014 (PPP)
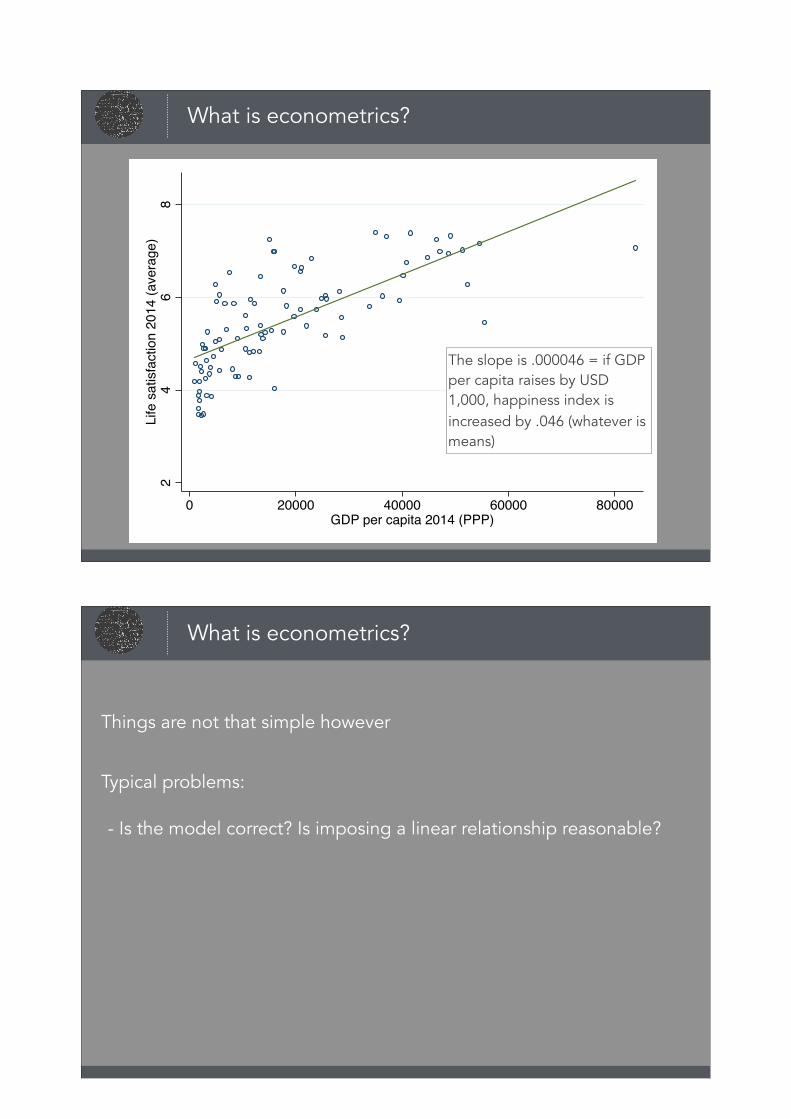
The slope is .000046 = if GDP per capita raises by USD 1,000, happiness index is increased by .046 (whatever is means)
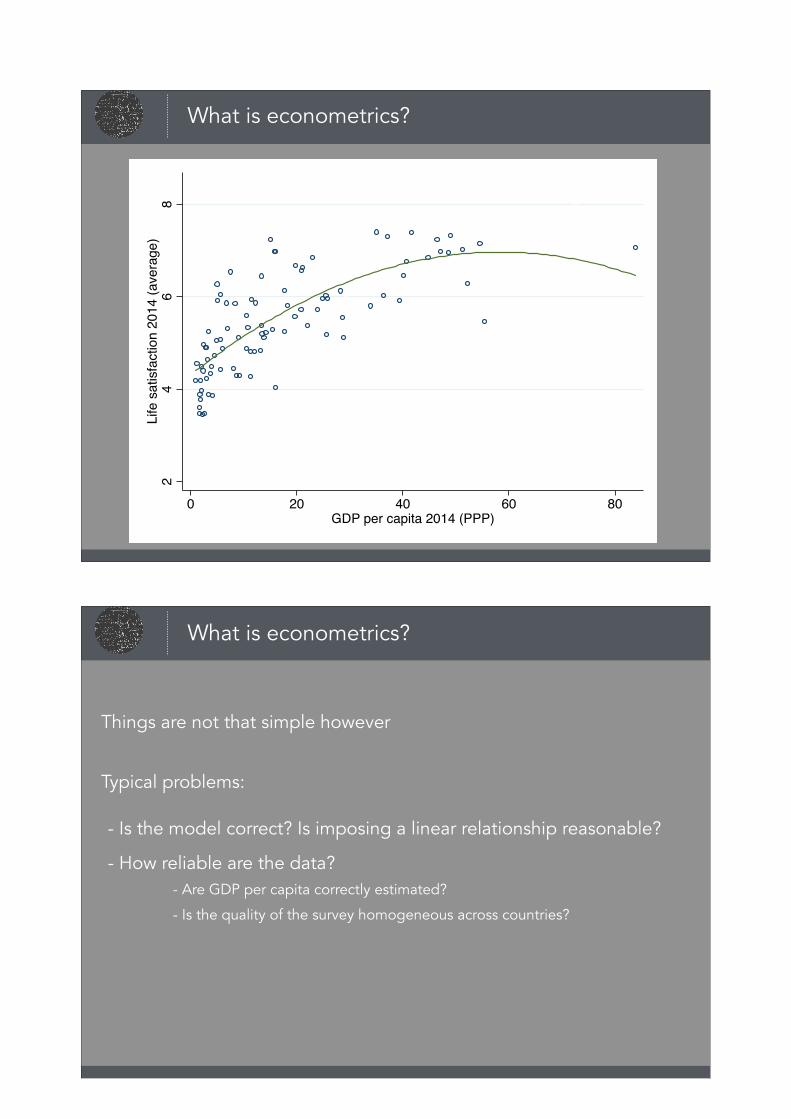
What is econometrics?
Things are not that simple however
Typical problems:
- Is the model correct? Is imposing a linear relationship reasonable?
What is econometrics?
24
68
Life
sat
isfa
ctio
n 20
14 (a
vera
ge)
0 20000 40000 60000 80000GDP per capita 2014 (PPP)
HKG
FRA
SGP
PER
24
68
Life
sat
isfa
ctio
n 20
14 (a
vera
ge)
0 20000 40000 60000 80000GDP per capita 2014 (PPP)
24
68
Life
sat
isfa
ctio
n 20
14 (a
vera
ge)
0 20000 40000 60000 80000GDP per capita 2014 (PPP)
24
68
Life
sat
isfa
ctio
n 20
14 (a
vera
ge)
0 20 40 60 80GDP per capita 2014 (PPP)
What is econometrics?
Things are not that simple however
Typical problems:
- Is the model correct? Is imposing a linear relationship reasonable?
- How reliable are the data? - Are GDP per capita correctly estimated?
- Is the quality of the survey homogeneous across countries?
What is econometrics?
Things are not that simple however
Typical problems:
- Is the model correct? Is imposing a linear relationship reasonable?
- How reliable are the data?
- How should we interpret the data? - Does GDP per capita really reflect wealth?
- How composition effects (due to social inequalities) influence the results?
- Is moving from a life satisfaction index of 2 to 3 the same thing than moving
from 6 to 7?
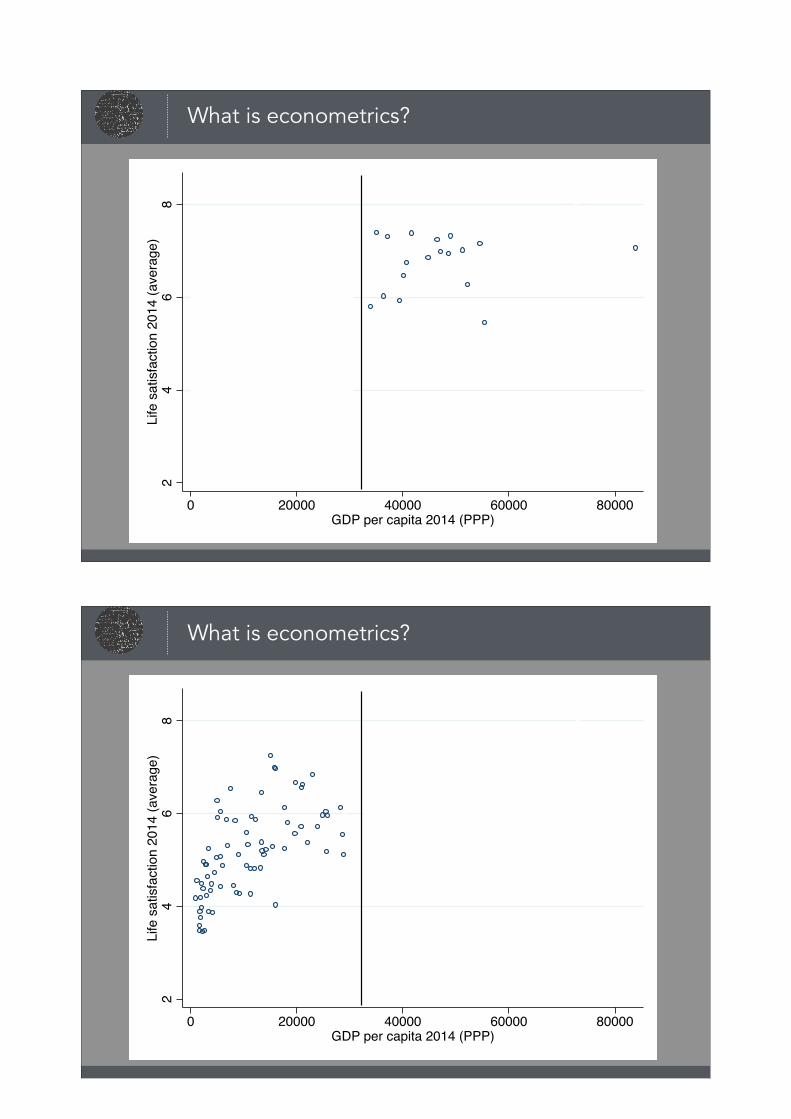
What is econometrics?
Things are not that simple however
Typical problems:
- Is the model correct? Is imposing a linear relationship reasonable?
- How reliable are the data?
- How should we interpret the data? - Are we sure that the sample is representative?
It might be different with more countries/regions, or in a different year
What is econometrics?
24
68
Life
sat
isfa
ctio
n 20
14 (a
vera
ge)
0 20000 40000 60000 80000GDP per capita 2014 (PPP)
HKG
FRA
SGP
PER
24
68
Life
sat
isfa
ctio
n 20
14 (a
vera
ge)
0 20000 40000 60000 80000GDP per capita 2014 (PPP)
24
68
Life
sat
isfa
ctio
n 20
14 (a
vera
ge)
0 20000 40000 60000 80000GDP per capita 2014 (PPP)
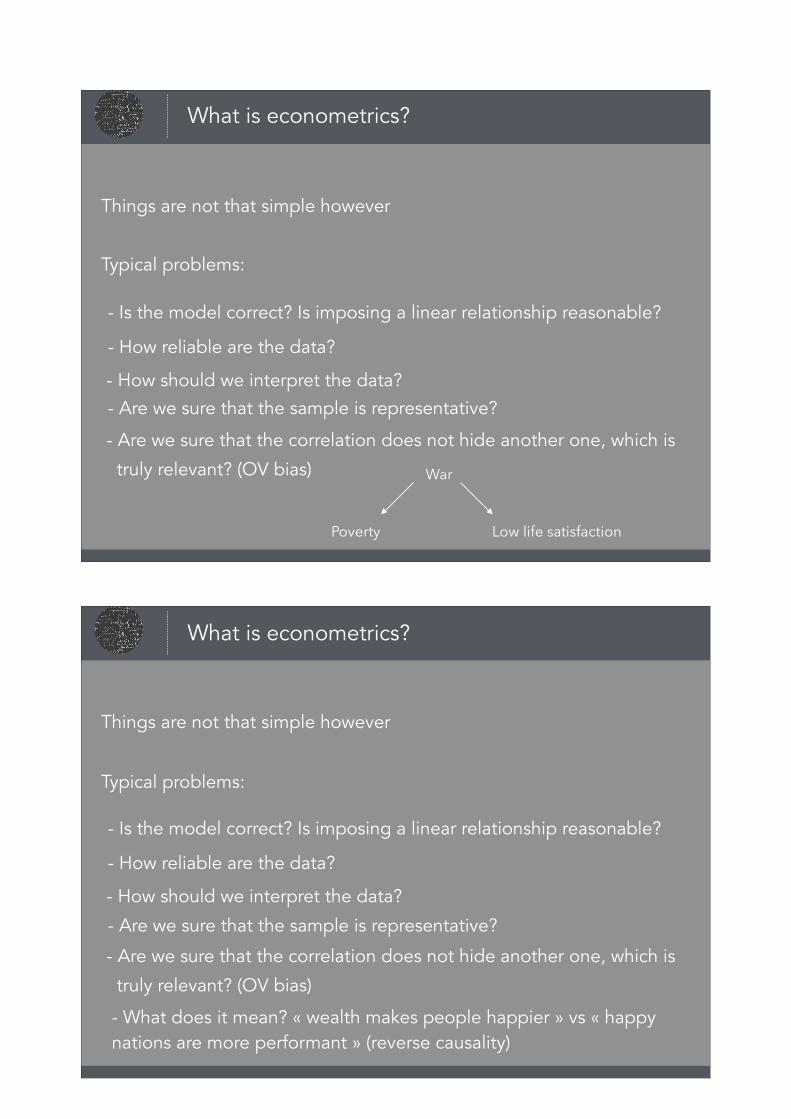
What is econometrics?
Things are not that simple however
Typical problems:
- Is the model correct? Is imposing a linear relationship reasonable?
- How reliable are the data?
- How should we interpret the data?
- Are we sure that the correlation does not hide another one, which is
truly relevant? (OV bias)
- Are we sure that the sample is representative?
War
Poverty Low life satisfaction
What is econometrics?
Things are not that simple however
Typical problems:
- Is the model correct? Is imposing a linear relationship reasonable?
- How reliable are the data?
- How should we interpret the data?
- Are we sure that the correlation does not hide another one, which is
truly relevant? (OV bias)
- Are we sure that the sample is representative?
- What does it mean? « wealth makes people happier » vs « happy nations are more performant » (reverse causality)
Econometrics softwares
Econometrics softwares
EViews
Pros: Very popular Super intuitive with explicit menus Quite good for time series Cheap
Cons: Limited / incomplete No data management
Econometrics softwares
SAS
Pros: Super powerful Data management Quite often used in some companies (manufacturing, finance) Good for super big datasets
Cons: Super expensive Quite heavy - sometimes slow Not flexible Limited for some complex econometric analysis
Econometrics softwares
STATA
Pros: Powerful Data management Very popular among economists (especially micro) Flexible (many packages and add-on available) Nice graphs
Cons: Expensive
Small version for students = USD 198 (USD 45 for 6 months)
Econometrics softwares
R
Pros: Powerful Data management Very popular in hard science, growing popularity in social science Flexible (many packages and add-on available) Nice graphs 100% Free!
Cons: None?
Econometrics softwares
We will use STATA because it is (still) the most popular among social scientists
Do not use EViews Because you have to learn the programming language of (at least) one econometric software
Anyone can use EViews.
Knowing the basis of coding in STATA or R is a specific knowledge = an additional line on your CV
Important: This is not a STATA class = I will not teach you STATA code = You will have to learn it by yourself (by doing)
I will just give you a brief introduction
Introduction to STATA
Download data on life satisfaction
http://matthieucrozet.weebly.com/uploads/6/0/2/7/60271695/introstata.zip
… And open STATA


![Matthieu Suiche matt[at]msuiche.net](https://img.pdfslide.us/doc/110x75/551b7124550346d6338b4e78/matthieu-suiche-mattatmsuichenet-httpwwwmsuichenet-httpwwwmoonsolscom.jpg)