Embed Size (px)
Citation preview
APPLICATIONS OF SPECTRUM ANALYSIS TO ONSTREAM CONDITION MONITORING AND MALFUNCTION
DIAGNOSIS OF PROCESS MACHINERY by
Jan E. Borhaug and John S. Mitchell Senior Consultants
Dow Industrial Service Turbomachinery Engineering Service
Pleasant Hill, California
Jan E. Borhaug is senior consult· ant with the DIS Turbomachinery Group, Pleasant Hill, California. He holds degrees in engineering from Schous Institute of Technology, Norway; University of Denver, Colorado; and a Ph.D. in mechanical engineering from Tulane University. He has several years of research and industrial experience and was most recently with Shell Development
Company, Emeryville, California. His research and consulting practice is centered on structural dynamics and stress analysis, mathematical modeling and acoustics, but has also included experimental work in the areas of heat transfer and fluid mechanics. Dr. Borhaug is a member of Tau Beta Pi, Sigma Xi, Norwegian Professional Engineers Association and ASME.
John S. Mitchell joined Dow Industrial Service in January 1971, to form a turbomachinery consulting organization. Since that time he has provided engineering consultation in the areas of vibration analysis and alignment on machinery ranging in size from 1,000 HP to 20,000 HP and in speed from 2,300 RPM to 45,000 RPM.
Prior to joining Dow, Mr. Mitchell was with Humble Oil and Refining Company. Beginning in January 1968, he had engineering responsibility for all the rotating machinery during construction, acceptance, startup, and operation of the new 72,000 BBLl day Benicia, California, Refinery. Major machinery totalled some 70,000 HP including four industrial gas turbines, three steam turbines, seven centrifugal and one axial flow compressor. In 1970, he u·as reassigned to head the Technical Service Section in the Refinery's Mechanical Engineering Department.
Mr. Mitchell received a B.S. degree in Engineering from the U. S. Naval Academy in 1959. During eight years in the Navy, he was primarily associated with operation, repair and maintenance of shipboard machinery. He served one year as Chief Engineer ab
.oard
a diesel electric submarine and two years as machznery officer aboard a nuclear submarine.
150
Mr. Mitchell has a patent pending for optical tooling scale fixtures and has authored articles on optical alignment and condition maintenance through predictive vibration analysis. He is a member of ASME.
ABSTRACT Recent experiences with frequency spectrum analy
sis for onstream evaluation of mechanical performance are reviewed from a user's standpoint. Current practices of transducer selection and positioning, data acquisition and interpretation are outlined as applied to both predictive and malfunction analysis work. Particular emphasis is placed on assessing the efficacy of these techniques by indepth reviews of case histories from recent field applications.
BACKGROUND AND INTRODUCTION
It is well known that the sound and vibration characteristics associated with operation of process machinery contain information which is indicative of mechanical condition. Specifically, in this regard, traditional methods of condition monitoring and machinery protection systems have utilized over-all, single valued vibration amplitudes as limiting criteria for years. More recent techniques of both condition monitoring and malfunction diagnosis have developed towards filtered vibration analysis concentrating on amplitude measurements of individual low frequency components. These higher resolution methods have been used successfully to diag· nose problems such as unbalance, misalignment and rotor bearing instability and their interpretation and function in machinery protection schemes are well understood.
In spite of the growing use of spectral vibration data of this type, the frequency regions of primary interest have remained low and centered around running speed. It is becoming increasingly clear, however, that the high frequency vibration characteristics emitted from operating machinery contain vital information which, with most contemporary techniques, remain outside of the analysis range. These high frequency com· ponents, normally associated with acoustic energy,
_contain the characteristics of rolling element bearing failures, gear mesh and tooth loading abnormalities and dynamic excitation of rotating and stationary com· ponents such as turbine nozzles, shrouds and blades.
There is one significant difference between low and high frequency vibration which should be brought out at this time. Low frequency vibration is always the
APPLICATION OF SPECTRL'M ANALYSIS TO ON-STREAM CONDITION MONITORING AND MALFUNCTION DIAGNOSIS OF PROCESS MACHINERY
151
manifestation of an existing problem. On the other hand, early symptoms of future failures may often ap· pear in the high frequency spectrum before the failure itself occurs to produce a change in low frequency vibration. For example, the characteristics of abnormal turbine blade excitation are usually found in the high frequency spectrum before a sudden increase in rotor unbalance signifies a fatigue failure. Thus, the high frequencies gain significance in predicting potential failures where the low frequencies are useful in evaluating the severity of existing problems.
The preceding strongly suggests that in order to obtain a truly representative picture of an operating machine's mechanical condition, it becomes necessary to examine both the low and high frequency vibration in detail. The instrumentation required to accomplish this task in a practical manner has become available over the past few years in form of swept filter and real time analyzers. Problems and malapplication associated with data acquisition, reduction and interpretation of this enormous amount and range of data, however, continue to be of concern to the industrial user. In recognition of the suhstantial current interest in machinery protec· tion and failure diagnostic techniques, the subsequent discussion attempts to cast some light on the current state of the art through a selection of case histories from applications of real time spectrum analysis in the field. In order to properly demonstrate the powers and limita· tions of these techniques, the case histories are preceded by material dealing with transducer selection, system design and resolution.
MACHINERY SIGNATURES When broken down into spectral components, the
complex waveforms, referred to as machinery vibration, may in general be defined as a sum of harmonic functions of discrete amplitudes and frequencies. This is often referred to as the "machine signature." For example, in the hypothetical case of an unbalanced shaft rotating at an angular velocity w, in a circular orbit with radius A, the vibration displacement signal may be represented by a single harmonic function:
X ( tt = A sinwt , (1) where t denotes time.
By differentiation, we have that the velocity and accelera· tion are given by:
and X ( tl A wcoswt (2 t .. X(tl - Aw� sinwt (3)
The preceding expressions ( 1 t, ( 2) , and ( 3) illustrate how velocity and acceleration components of a complex signal (and, thus, the signal itself) are dependent on the angular frequency w. The velocity increases in direct proportion to frequency while acceleration increases in proportion to frequency squared. For example, if displacement is held constant while frequency is doubled, velocity doubles and acceleration increases by a factor of-t..
It can be shown with a simplified model of a rotor element of mass m operating in bearings with spring co-efficient k and viscous damping factor c that the
total dynamic force during vibration may be represented by an expression of the form:
F ( t) = mX + eX + kX. (.tt
We here recognize the terms as those of inertia, damping and elastic forces respectively. By substitution of equa· tions ( 1 t, ( 2), and ( 3) into ( .t), we find that the rela· tive size of the elements of ( 4 t are dependent on fre· quency w. An important observation to be made at this point is that at high frequencies, the force com· ponent due to acceleration (or velocity) may dominate. Thus, it is entirely possible to have large forces acting even with unmeasureably low displacement amplitudes. It is indeed these high frequency components, which remain undetected by displacement criteria, that often cause sudden catastrophic fatigue failures.
One may conclude that displacement alone, as often applied, can be a poor measure of vibration severity since this should always be considered in conjunction with frequency. To overcome this particular difficulty, maximum velocity criteria have often been suggested in order to include the frequency parameter and total dynamic force concept into the measurement of machinery condition. The adequacy of even such criteria is, however, suspect since frequencies of interest in process machinery analysis form a wide, continuous spectrum from the sub-audio range of lO to 15 Hz through the ultrasonic range approaching 100 KHz. Within this spectrum are the subharmonic "whirl" frequencies from approximately 40 to 90 Hz, once per revolution frequen· cies from 60 to 700 Hz, centrifugal compressor vane passing frequencies from 2 to 5 KHz, turbine and gear passing frequencies from 5 to 30 KHz, and finally, anti· friction bearing characteristics from 20 to 100 KHz.
With this vast range and amount of data to be con· sidered, the problem facing the industrial user is one of how to acquire, reduce and present the information in a form conducive to effective and meaningful evalua· tion.
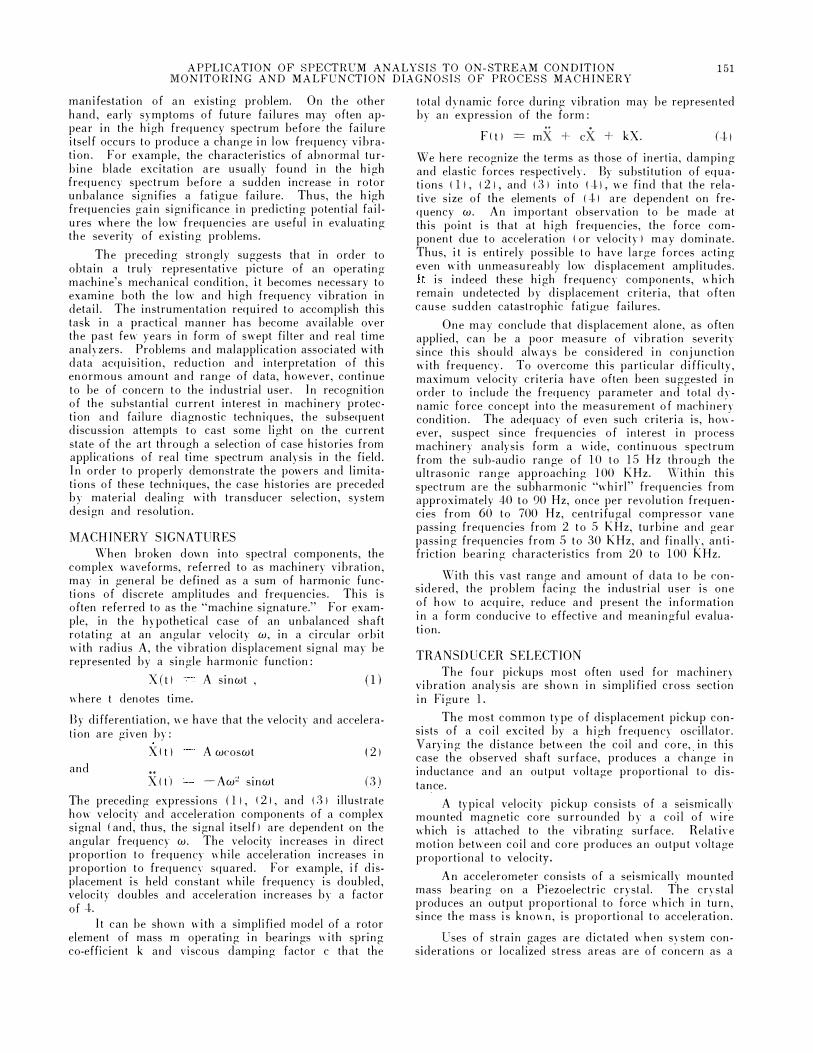
TRANSDUCER SELECTION The four pickups most often used for machinery
vibration analysis are shown in simplified cross section in Figure l.
The most common type of displacement pickup con· sists of a coil excited by a high frequency oscillator. Varying the distance between the coil and core, in this case the observed shaft surface, produces a change in inductance and an output voltage proportional to dis· tance.
A typical velocity pickup consists of a seismically mounted magnetic core surrounded by a coil of wire which is attached to the vibrating surface. Relath·e motion between coil and core produces an output voltage proportional to velocity.
An accelerometer consists of a seismically mounted mass bearing on a Piezoelectric crystal. The crystal produces an output proportional to force which in turn, since the mass is known, is proportional to acceleration.
Uses of strain gages are dictated when system considerations or localized stress areas are of concern as a
152 PROCEEDINGS OF THE FIRST TCRBOMACHINERY SYMPOSIUM
consequence of machinery vibration. rsed in conjunction with a balancing bridge circuit, the dynamic strain readings obtained from this variable resistor device are accurate and dependable under a wide range of environmental and geometric conditions. In contrast to the preceding devices, the strain gage is an in-plane dedce and usually measures local displacements in planes normal to the vibratory motion.
If any of the first three pickups are attached to a vibrating structure, each will produce an output signal proportional respectively to displacement, velocity or acceleration. Doubling displacement will correspondingly increase the output from each pickup by a factor of 2. If displacement is held constant, and frequency is doubled, output from the displacement pickup will remain unchanged-the velocity pickup output will double and the accelerometer output will increase by a factor of 4.
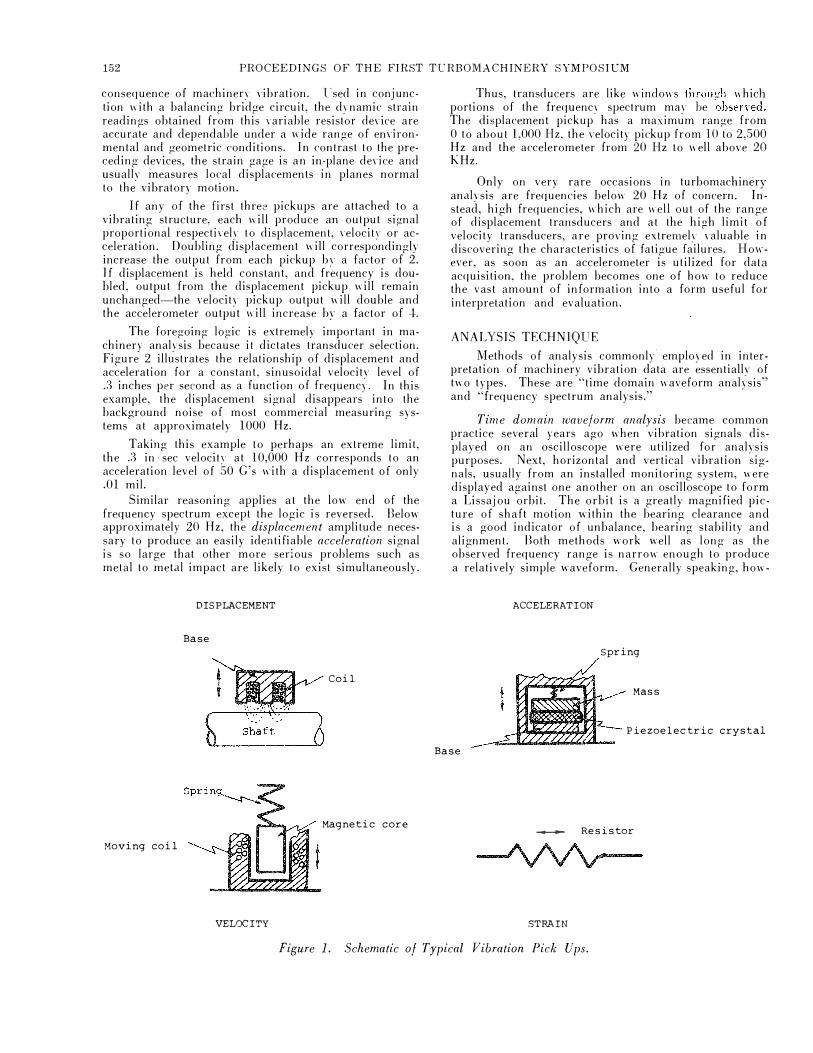
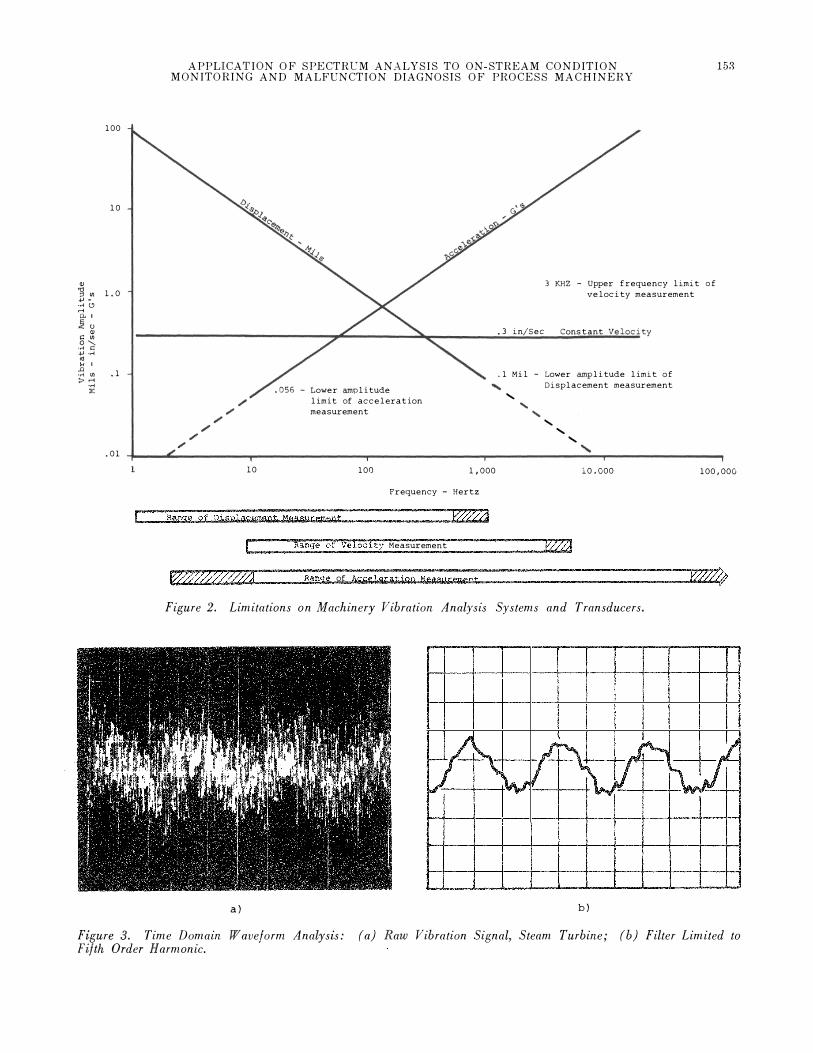
The foregoing logic is extremely important in machinery analysis because it dictates transducer selection. Figure 2 illustrates the relationship of displacement and acceleration for a constant, sinusoidal velocity level of .3 inches per second as a function of frequency. In this example, the displacement signal disappears into the background noise of most commercial measuring systems at approximately 1000 Hz.
Taking this example to perhaps an extreme limit, the .3 in/sec velocity at 10,000 Hz corresponds to an acceleration level of 50 G's with a displacement of only .01 mil.
Similar reasoning applies at the low end of the frequency spectrum except the logic is reversed. Below approximately 20 Hz, the displacement amplitude neces· sary to produce an easily identifiable acceleration signal is so large that other more serious problems such as metal to metal impact are likely to exist simultaneously.
DISPLACEMENT
Base
C oil
Magnetic core
Moving coil
VELOCITY
Thus, transducers are like windows through which portions of the frequency spectrum may be observed. The displacement pickup has a maximum range from 0 to about 1,000 Hz, the velocity pickup from lO to 2,500 Hz and the accelerometer from 20 Hz to well above 20 KHz.
Only on very rare occasions in turbomachinery analysis are frequencies below 20 Hz of concern. Instead, high frequencies, which are well out of the range of displacement transducers and at the high limit of velocity transducers, are proving extremely valuable in discovering the characteristics of fatigue failures. However, as soon as an accelerometer is utilized for data acquisition, the problem becomes one of how to reduce the vast amount of information into a form useful for interpretation and evaluation.
ANALYSIS TECHNIQUE Methods of analysis commonly' employed in inter
pretation of machinery vibration data are essentially of two types. These are "time domain waveform analysis" and "frequency spectrum analysis."
Time domain waveform analysis became common practice several years ago when vibration signals displayed on an oscilloscope were utilized for analysis purposes. Next, horizontal and vertical vibration signals, usually from an installed monitoring system, were displayed against one another on an oscilloscope to form a Lissajou orbit. The orbit is a greatly magnified picture of shaft motion within the bearing clearance and is a good indicator of unbalance, hearing stability and alignment. Both methods work well as long as the observed frequency range is narrow enough to produce a relatively simple waveform. Generally speaking, how-
Base
ACCELERATION
Spring
Mass
Piezoelectric crystal
- Resistor
STRAIN
Figure 1. Schematic of Typical Vibration Pick Ups.
100
10
41 "g., 1.0 ..... .... .., ..... Pol � 0 41 r:: ., 0'-. .... r:: .... .... "' .. I �., .1 > ..... ....
:E
.01
APPLICATION OF SPECTRL'M ANALYSIS TO ON-STREAM CONDITION MONITORING AND MALFUNCTION DIAGNOSIS OF PROCESS MACHINERY
- Lower amplitude limit of acceleration measurement
3 KHZ - Upper frequency limit of velocity measurement
. 3 in/Sec Constant Velocity
.1 Mil - Lower amplitude limit of
� Displacement measurement '
' '
' '
' '
153
10 100 1,000 10.000 100,000
Frequency - Hertz
Range of piaplassmcnt McoiHrement W//J Range of Veloc1ty Measurement ��
Ranae of Assslsrttigp Meo•uremept
Figure 2. Limitations on Machinery Vibration Analysis Systems and Transducers.
7 � �� � \.. �I' � � ,.. """
a) b)
L.
lUI .....
Figure 3. Time Domain Wave form Analysis: (a) Raw Vibration Signal, Steam Turbine; (b) Filter Limited to Fifth Order Harmonic.
154 PROCEEDINGS OF THE FmST Tt:RBOMAClUNEH.Y SYMPOSWM
ever, a complex waveform containing a fundamental and about five harmonics IS the limit. of unfiltered time domain analysis.
An oscilloscope trace of a steam turbine vibration signal limited to the fifth orrler harmonic with a lo;r pass filter is shown in Figure .')b. As mentioned earlier, a record of this type is useful for detecting the presence of vibration in the suLharmonie, once per revolution and low harmonic ranges. Figure :-;a shows the same signal with the filter removed. A compariso11 of the two signals .illustrates how the low frequency information is ohscured by the added complexity intr;.lduced by the presence of high frequency components. Thus, as the frequency range of inlerest broadens, it becomes hoth more difficult and time consum.ing to :min detailed information from an oscilloscope photograph of a widebrand vibration signal displayed in the time domain.
Analysis in the frequency domain is a technique where the vibration signals are resolved and displayed as narrow hand spectral C.(Jmponents. Here the fre· queney analyzer converts the complex vibration signal from the time to the frequeney domain producing a display of frequency versus Hmplitude. Jn its simplest form. a frequencv anahzer rnav he a manually tmwd filter
. slaved to a
.. plouei· l>ith f ;:equency and aJ�lplitude
positioning the x and y axe;; respectively. This method is far too slow and inaccurate for machinerY vibration analysis purposes, hovvevt>r, and ''hile a wa;e analyzer with 11utomatic programmed frequency :;can IS more ar:eurate, the analysis �>peed is still too low.
,75
.50
. 25
The real time frequency spectrum analyzer comhines ac:euraey with rapid analysis to produce an output whieh may be displayed on an oscilloscope. This instru· menl receives the complex analog vibration signal di" rectly or from magnetic tape and converts it to digital form. A time compression technique translates the digital repn��>entation to a high frequency where the signal is analvzed with a broadband filter.
The high frequency broac1band filter permits a rapid sean rate while producing a very good frequency resolution. Thus, dynamic dtanges in the frequeney domain such as beats
. and harmonics can he conveniently
observed as they occur.
The spectrum can he preserved either by directing the output to a plotter or by photographing the oscilloscope. In order to gain statistical accuracy and insure that the graphic speetral representation reflects an average rather than an instantaneous condition, a spectrum averager is usually utilized 11ith the analyzer in this mode.'
· .
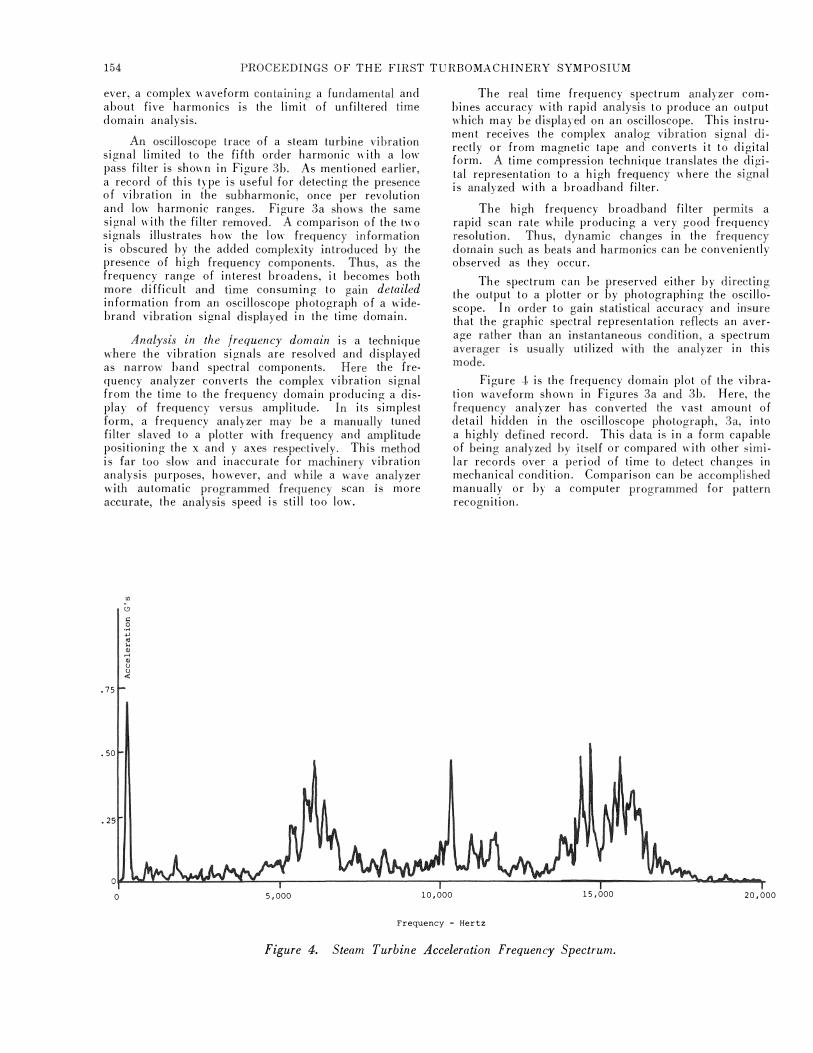
Figure J. is the frequency domain plot of the vibra· tion waveform show11 in Figures ::>a and ;:;b. Here, the frequency analyzer has converted the vast amount of detail hidden in the oscilloscope photograph, :�a, into a highly defined record. This data i� in a fontl capable of being analyzed hy itself or compared with other similar reeords over a period of time to detect change;,; in mechanical eondit.ion. Compari"'on can be accomplished manually or by a computer programmed for pattern recognition.
0 ��������--�L---r-----------------�----r-------------�--------F-----------���� .. �
0 5,000 10,000 15,000
Frequency - Hertz
Figure 4. Steam Turbine Acceleration Frequency Spectrum.
20,000
APPLICATION OF SPECTRCM ANALYSIS TO ON-STREAM CONDITION MONITORING AND MALFUNCTION DIAGNOSIS OF PROCESS MACHINERY
155
Accelerometers
Real Time
locitv probes Spectrum
I Analyzer Ve Plotter
-----....;... or
Pr•amolifi"'r I level recorder
Displace ment probes I I ' I I
I
icrophones I
M AM-FM
Tap:
Str ain gages
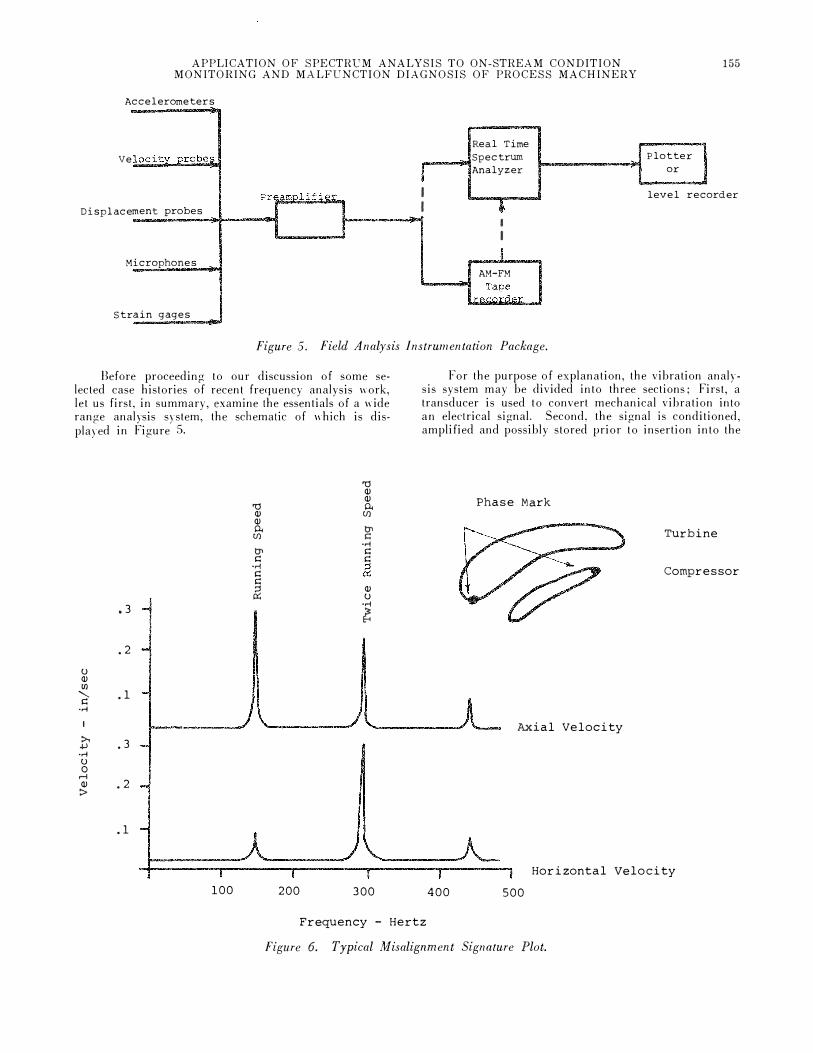
Figure 5. Field Analysis Instrumentation Package.
Before proceeding to our discussion of some selected case histories of recent frequency analysis work, let us first, in summary, examine the essentials of a wide range analysis system, the schematic of which is displayed in Figure 5.
'0 <U <U
'0 0.. <U en <U 0.. g' en
·.-I 0' s:: s:: s::
·.-I � s:: s:: � <U
u .3
·.-I ?. .2
u <U en
....... .1 s:: ·.-I
I
>. .3 .j.l •.-I u 0
.-j <U .2 >
.1
100 200 300
For the purpose of explanation, the vibration analysis system may be divided into three sections; First, a transducer is used to convert mechanical vibration into an electrical signal. Second, the signal is conditioned, amplified and possibly stored prior to insertion into the
Phase Mark
Turbine
Compressor
Axial Velocity
Horizontal Velocity
400 500
Frequency - Hertz
Figure 6. Typical Misalignment Signature Plot.
156 PROCEEDINGS OF THE FIRST TURBOMACHINERY SYMPOSIUM
analysis section. Finally, the analyzer reduces and dis· plays the vibration characteristics in an interpretable form on hard copies.
As indicated, signal conditioning and amplification of the transduced vibration signal is usually required to provide proper level and impedance matching. In this state, it may either be recorded on magnetic tape for later analysis or fed directly into an analyzer.
If the vibration signal is being recorded for later frequency analysis, it is extremely important to utilize a high quality, multi-channel instrumentation tape re· corder. The recorder should have a good signal to noise ratio to permit examining low level signals and a frequency response from DC to approximately 100 KHz. Perhaps most important from the aspect of fre· quency analysis is an accurate speed control system, usually servo-controlled, to insure that the reproduced frequencies are in the same relationship as the input.
To achieve the wide frequency range mentioned earlier, the recorder should contain provisions for both FM ( Frequency Modulated I and Direct (Amplitude Modulated I recording and reproduction. The FM mode is normally used for the lower frequencies with Direct used in high frequency ranges. Both the recorder mode and frequency response must be carefully matched to the transducer in order to avoid the loss of valuable information.
CASE HISTORIES The spectrum or signature plot displayed in Figure
3 becomes a powerful tool with which a large amount
4.
3.
2.
"' '"'
g � ... .. .... .. u �
5,000
of vibration data may be examined and evaluated quickly and accurately. In the following paragraph we shall briefly describe a number of case histories which may serve as a demonstration of the utility of these techniques.
Application in the low frequency region is displayed in Figure 6 showing symptoms of severe misalignment. This is an example of analysis made from a casing mounted velocity pickup and show the classical high twice per revolution radial vibration with accompanying high axial vibrations. The shaft orbits which existed at the same time are shown for comparison purpose. Worthy of note is the opposing phase marker 180° apart.
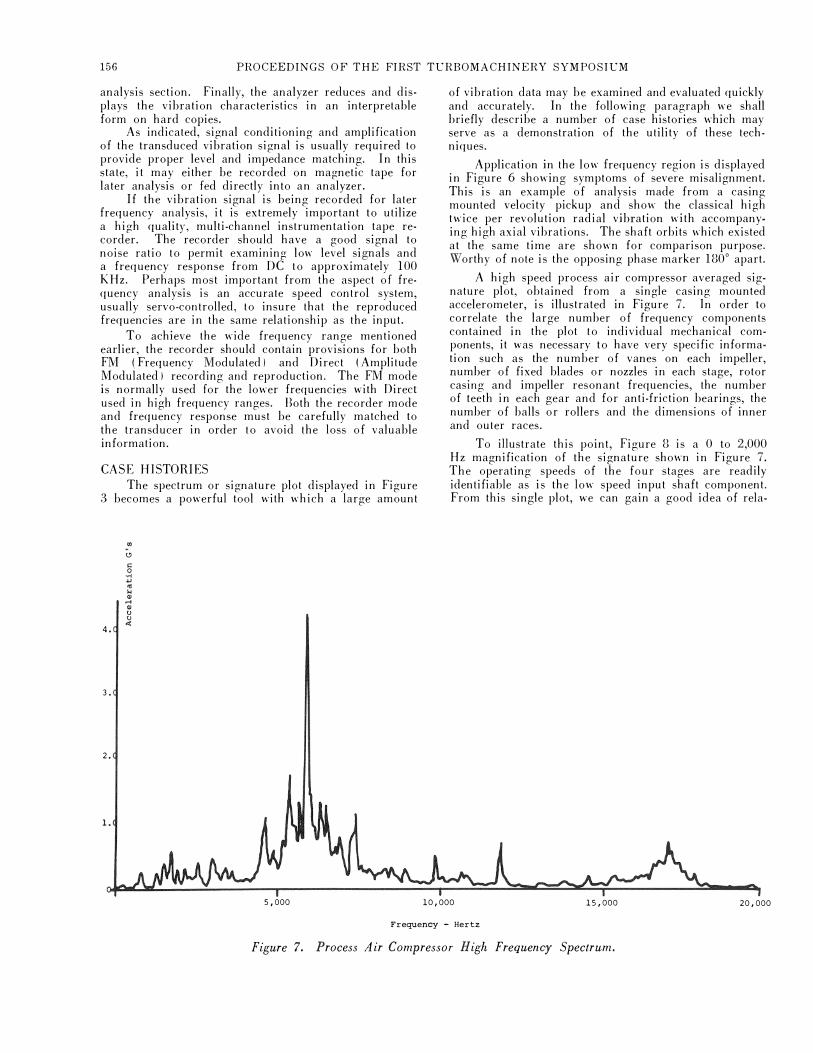
A high speed process air compressor averaged sig· nature plot, obtained from a single casing mounted accelerometer, is illustrated in Figure 7. In order to correlate the large number of frequency components contained in the plot to individual mechanical com· ponents, it was necessary to have very specific information such as the number of vanes on each impeller, number of fixed blades or nozzles in each stage, rotor casing and impeller resonant frequencies, the number of teeth in each gear and for anti-friction bearings, the number of balls or rollers and the dimensions of inner and outer races.
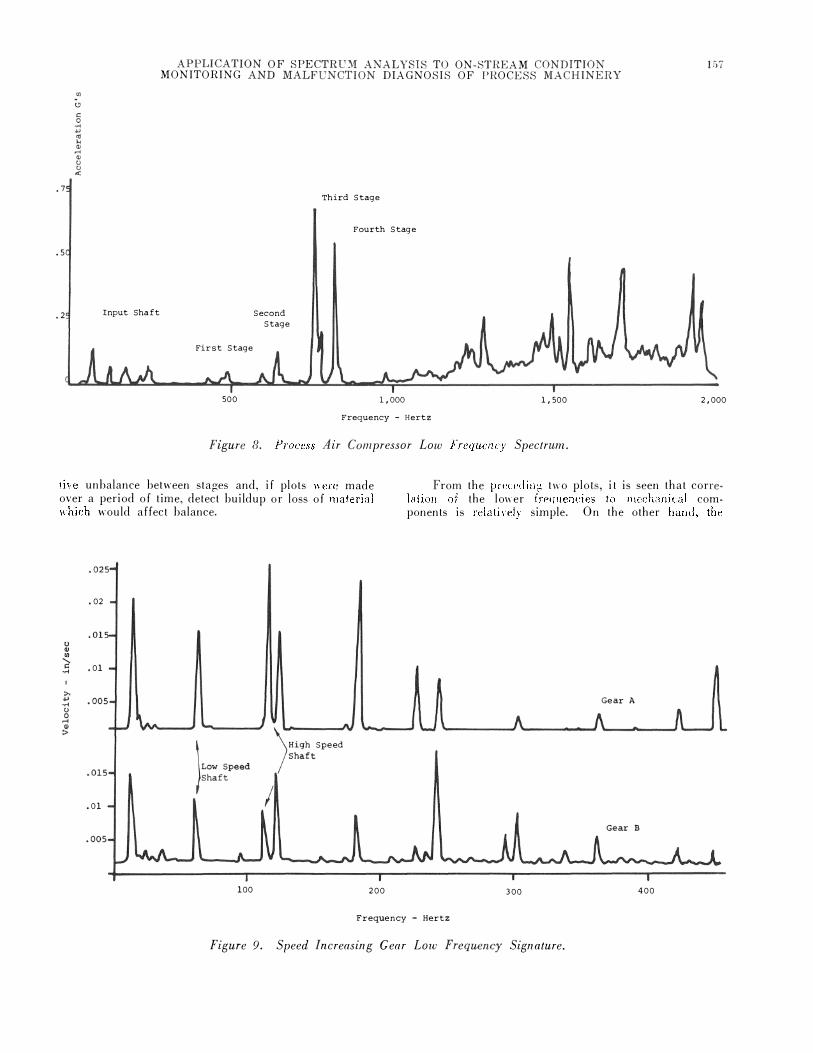
To illustrate this point, Figure 8 is a 0 to 2,000 Hz magnification of the signature shown in Figure 7. The operating speeds of the four stages are readily identifiable as is the low speed input shaft component. From this single plot, we can gain a good idea of rela-
10,000 15,000 20,000
Frequency - Hertz
Figure 7. Process Air Compressor High Frequency Spectrum.
.7
• 5
. 2 Input Shaft
APPLICATION OF SPECTIW:vi ANALYSIS TO ON-STHEAM CONDITION MONITORING AND MALFL'NCT!ON DIAGNOSIS OF PROCESS 11vL\CHINEitY
First Stage
500
Second Stage
Third Stage
Fourth Stage
l,OOO 1,500
Frequency - Eertz
f'lgurc 8� Process �4ir c·()!tlpressor Loo) Frequency SpectrU.t!L
2,000
live unbalance between stagf�s and, if plots 1n�re made over a period of ti.rne, detect buildup or loss of material which would affect balance.
Frorn the preceding two plob, it is seen that corn> la!ion of the lower frequencies lo rncchaniea! components i:; relatively simple. On the other hand. the
0 "' "' '-
.02
-� 01
.01
� )Low Speed
Shaft
100
I
\High Speed )shaft
I
200 300
Frequency - Hertz
Figure 9. Speed Increasing Gear Low Frequ�:ncy Signature.
Gear A
400
158 PROCEEDINGS OF THE FIRST TURBOMACHINERY SYMPOSIUM
extremely complex nature of modern machinery makes correlation of high frequencies a difficult task. Regardless of whether or not all observable frequencies can be correlated, however, the spectrum plot accurately represents a machine's mechanical performance at some defined point in time.
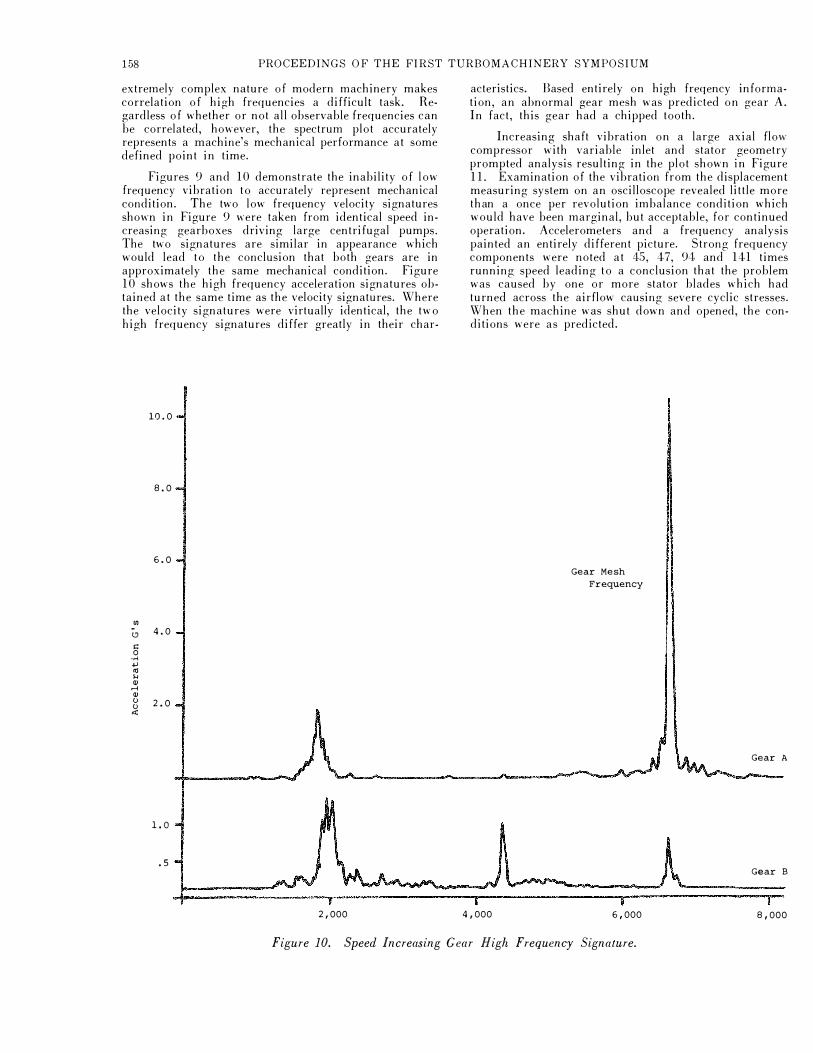
Figures 9 and 10 demonstrate the inability of low frequency vibration to accurately represent mechanical condition. The two low frequency velocity signatures shown in Figure 9 were taken from identical speed increasing gearboxes driving large centrifugal pumps. The two signatures are similar in appearance which would lead to the conclusion that both gears are in approximately the same mechanical condition. Figure 10 shows the high frequency acceleration signatures obtained at the same time as the velocity signatures. Where the velocity signatures were virtually identical, the two high frequency signatures differ greatly in their char-
10.0
8.0
6.0
.Ill 4.0 1.!1
s:: 0 ·.-I ... Ill ... cu � cu u 2.0 u .0:
l.O
.5
2,000
acteristics. Based entirely on high freqency information, an abnormal gear mesh was predicted on gear A. In fact, this gear had a chipped tooth.
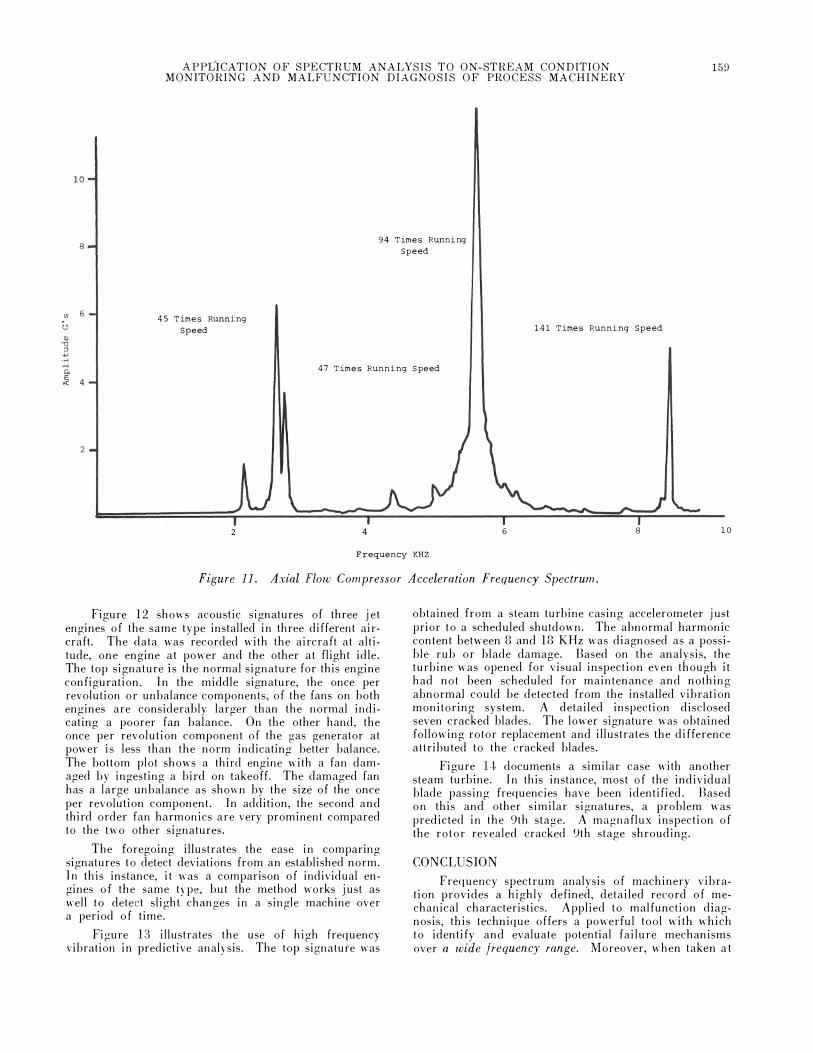
Increasing shaft vibration on a large axial flow compressor with variable inlet and stator geometry prompted analysis resulting in the plot shown in Figure 11. Examination of the vibration from the displacement measuring system on an oscilloscope revealed little more than a once per revolution imbalance condition which would have been marginal, but acceptable, for continued operation. Accelerometers and a frequency analysis painted an entirely different picture. Strong frequency components were noted at 45, 47, 94 and 141 times running speed leading to a conclusion that the problem was caused by one or more stator blades which had turned across the airflow causing severe cyclic stresses. When the machine was shut down and opened, the conditions were as predicted.
Gear Mesh Frequency
Gear A
Gear B
4,000 6,000 8,000
Figure 10. Speed Increasing Gear High Frequency Signature.
APPLICATION OF SPECTRUM ANALYSIS TO ON-STREAM CONDITION MONITORING AND MALFUNCTION DIAGNOSIS OF PROCESS MACHINERY
15!)
45 Times Running Speed
94 Times Running Speed
141 Times Running Speed
47 Times Running Speed
2 4 6 8 lO
Frequency KHZ
Figure 11. Axial Flow Compressor Acceleration Frequency Spectrum.
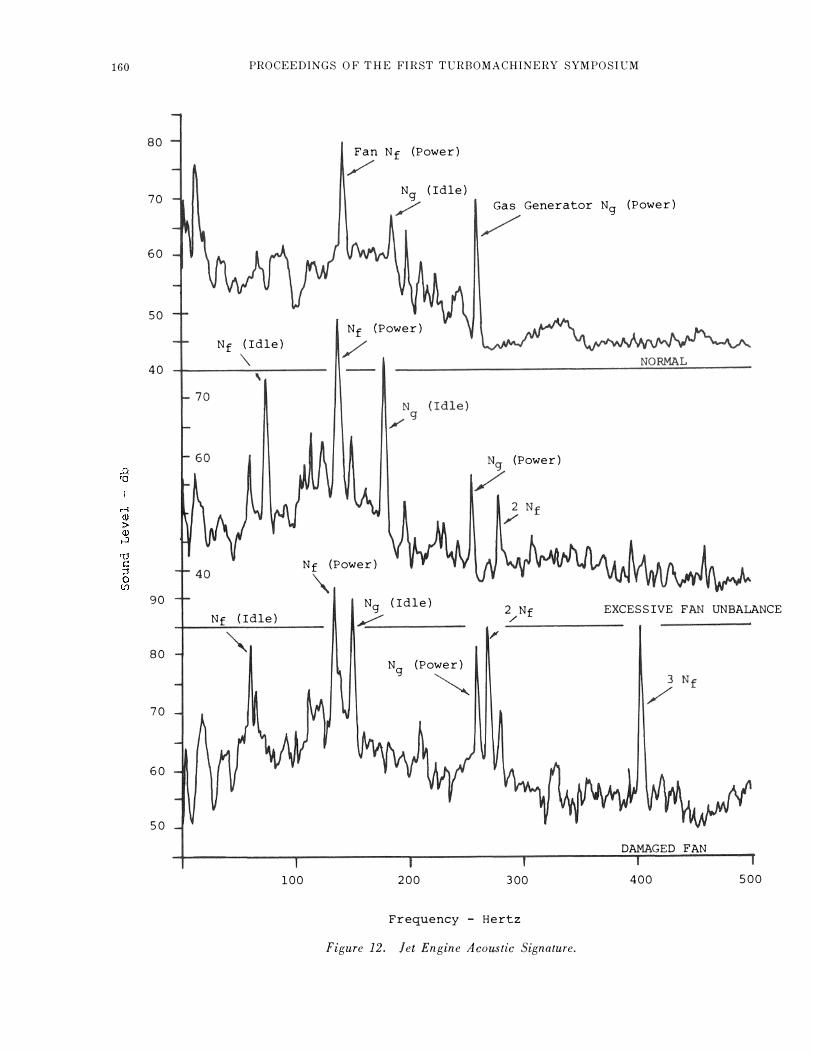
Figure 12 shows acoustic signatures of three jet engines of the same type installed in three different aircraft. The data was recorded with the aircraft at altitude, one engine at power and the other at flight idle. The top signature is the normal signature for this engine configuration. In the middle signature, the once per revolution or unbalance components, of the fans on both engines are considerably larger than the normal indicating a poorer fan balance. On the other hand, the once per revolution component of the gas generator at power is less than the norm indicating better balance. The bottom plot shows a third engine with a fan damaged by ingesting a bird on takeoff. The damaged fan has a large unbalance as shown by the size of the once per revolution component. In addition, the second and third order fan harmonics are very prominent compared to the two other signatures.
The foregoing illustrates the ease in comparing signatures to detect deviations from an established norm. In this instance, it was a comparison of individual engines of the same type, but the method works just as well to detect slight changes in a single machine over a period of time.
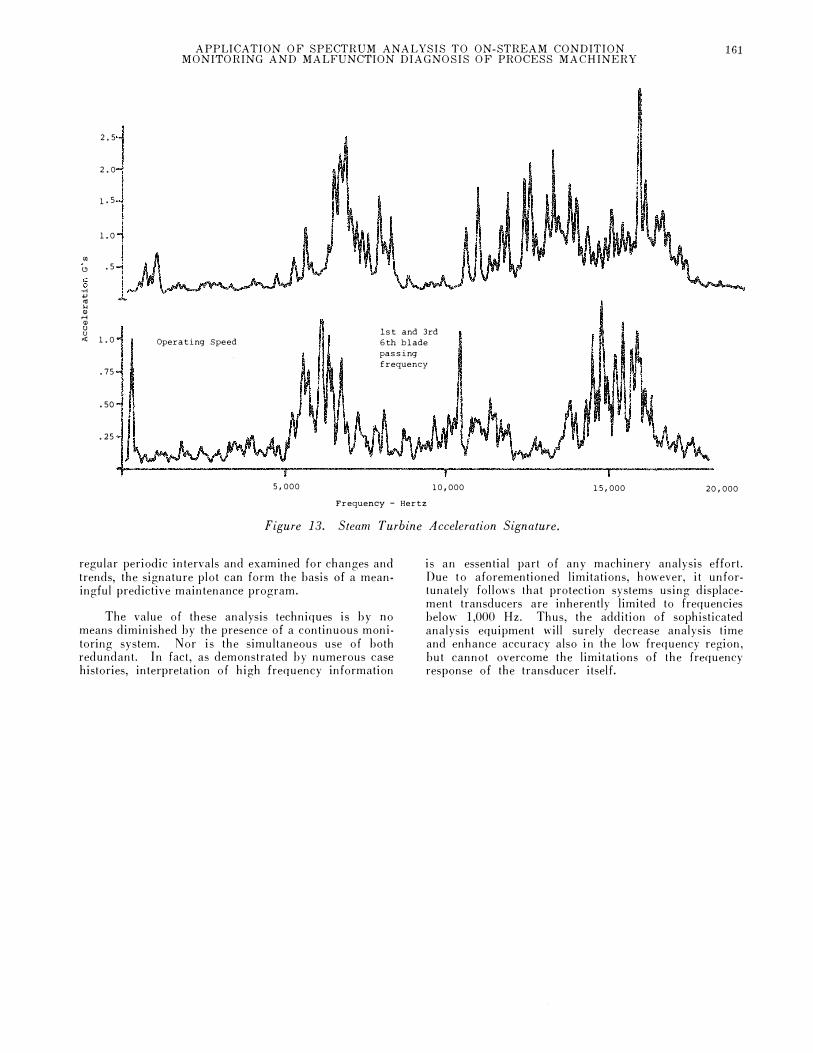
Figure 13 illustrates the use of high frequency vibration in predictive analysis. The top signature was
obtained from a steam turbine casing accelerometer just prior to a scheduled shutdown. The abnormal harmonic content between 8 and 18 KHz was diagnosed as a possible rub or blade damage. Based on the analysis, the turbine was opened for visual inspection even though it had not been scheduled for maintenance and nothing abnormal could be detected from the installed vibration monitoring system. A detailed inspection disclosed seven cracked blades. The lower signature was obtained following rotor replacement and illustrates the difference attributed to the cracked blades.
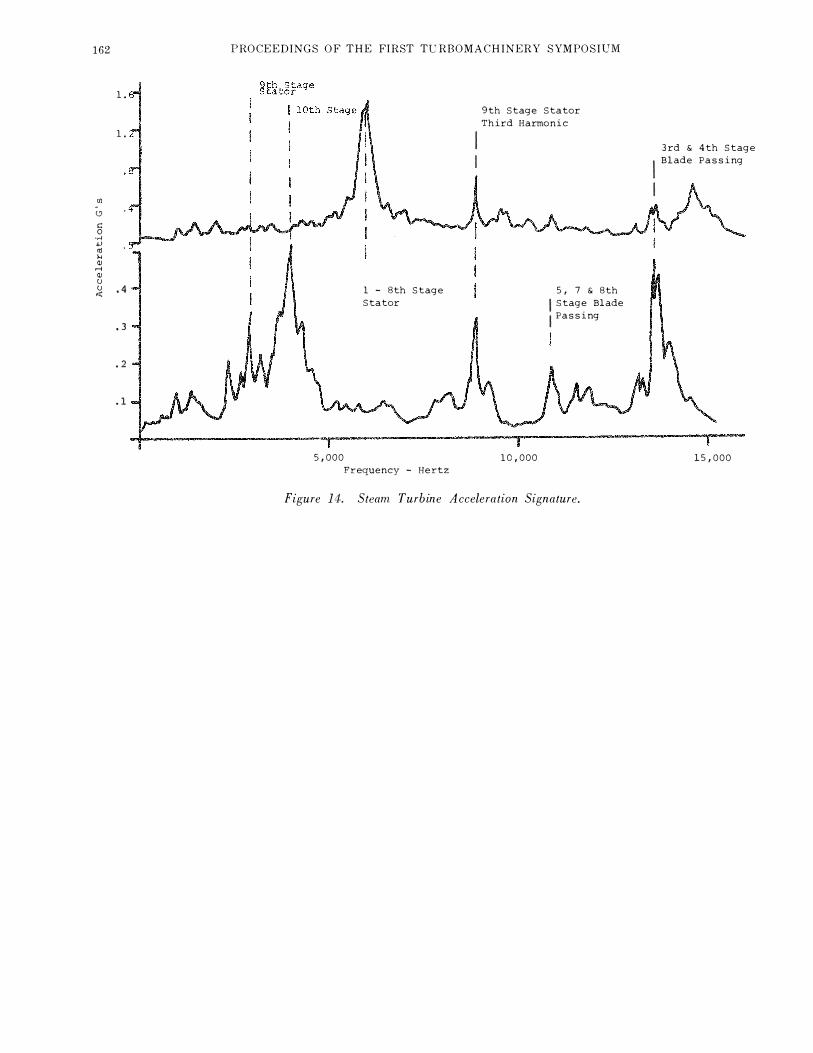
Figure U documents a similar case with another steam turbine. In this instance, most of the individual blade passing frequencies have been identified. Based on this and other similar signatures, a problem was predicted in the 9th stage. A magnaflux inspection of the rotor revealed cracked 9th stage shrouding.
CONCLUSION
Frequency spectrum analysis of machinery vibration provides a highly defined, detailed record of mechanical characteristics. Applied to malfunction diagnosis, this technique offers a powerful tool with which to identify and evaluate potential failure mechanisms over a wide frequency range. Moreover, when taken at
160
80
70
60
50
40
90
80
70
60
50
PROCEEDINGS OF THE FIRST TURBOMACHINERY SYMPOSIUM
Nf (Idle)
'\ '
Nf (Idle)
100
Fan Nf (Power)
/ Ng (Idle)
/ Gas Generator Ng (Power)
/
Nf (Power)
/
Nf (Power)
" Ng (Idle)
�
Ng (Power)
�
200
Ng (Power)
/
2 Nf /
3 00
Frequency - Hertz
Figure 12. let Engine Acoustic Signature.
EXCESSIVE FAN UNBALANCE
DAMAGED FAN
400 500
APPLICATION OF SPECTRUM ANALYSIS TO ON-STREAM CONDITION MONITORING AND MALFUNCTION DIAGNOSIS OF PROCESS MACHINERY
161
2.5
2.0
1·5
1.0
.. (!) .5
g .... ..., ., ... .. .... .. u 1st and 3rd 0 < 1.0 Operating Speed 6th blade
passing
.75 frequency
.so
.25
5,000 10,000 15,000 20,000
Frequency - Hertz
Figure 13. Steam Turbine Acceleration Signature.
regular periodic intervals and examined for changes and trends, the signature plot can form the basis of a mean· ingful predictive maintenance program.
The value of these analysis techniques is by no means diminished by the presence of a continuous moni· toring system. Nor is the simultaneous use of both redundant. In fact, as demonstrated by numerous case histories, interpretation of high frequency information
is an essential part of any machinery analysis effort. Due to aforementioned limitations, however, it unfortunately follows that protection systems using displace· ment transducers are inherently limited to frequencies below 1,000 Hz. Thus, the addition of sophisticated analysis equipment will surely decrease analysis time and enhance accuracy also in the low frequency region, but cannot overcome the limitations of the frequency response of the transducer itself.
162
1.
1.
Ul (.? s:: 0
·.-l +J .., 1-4 Ill .-t Ill 0 0 .4 ..:
• 3
. 2
.1
PROCEEDINGS OF THE FIRST TURBOMACHINERY SYMPOSIUM
5,000
1 - Bth Stage
Stator
Frequency - Hertz
I I
9th Stage Stator
Third Harmonic
10,000
5, 7 & Bth
1 Stage Blade
I Passing
Figure 14. Steam Turbine Acceleration Signature.
Jrd & 4th Stage 1 Blade Passing
I
15,000