Embed Size (px)
Citation preview

APPLICATIONS OF GEL ELECTROPHORESIS
IN QUANTUM DOT CONJUGATES’ SEPARATION AND PURIFICATION
A Thesis presented to the Faculty of the Graduate School
University of Missouri
In Partial Fulfillment
Of the Requirements for the Degree
Master of Science
By
LUXIN WANG
Dr. Xudong Fan and Dr. Azlin Mustapha, Thesis supervisors
JULY 2009

The undersigned, appointed by the Dean of the Graduate School, have examined the thesis entitled
APPLICATIONS OF GEL ELECTROPHORESIS
IN QUANTUM DOT CONJUGATES’ SEPARATION AND PURIFICATION
Presented by Luxin Wang
A candidate for the degree of Master of Science
And hereby certify that in their opinion it is worthy of acceptance.
Dr. Xudong Fan, Associate Professor, Biological Engineering
Dr. Azlin Mustapha, Associate Professor, Food Science
Dr. Fu-hung Hsieh, Professor, Biological Engineering

ii
ACKNOWLEDGEMENTS
My sincere thanks and appreciation go to Dr. Xudong Fan and Dr. Azlin
Mustapha, for their support and guidance to my Biological Engineering graduate
studies. Without their encouragement and assistance, I wouldn’t have finished my
research and course work on time.
Special THANKS to Dr. Mustapha, for her generous financial support
during my studies.
I would like to express my gratitude to Dr. Fu-hung Hsieh, for serving
as a committee member, providing suggestions and help during my studies.
At the same time, I gratefully acknowledge Jay Cupps, Chung-Shieh Wu,
Dr. Ya Guo and my other graduate friends for their friendship and help.
Finally, I am wholeheartedly grateful to my parents, for their love,
caring, and support.

iii
TABLE OF CONTENTS
ACKNOWLEDGEMENTS ............................................................................................... ii
LIST OF FIGURES ............................................................................................................v
LIST OF TABLES ........................................................................................................... vii
ABSTRACT .................................................................................................................... viii
Chapter
1. INTRODUCTION ..........................................................................................................1
1.1 Fabrication of quantum dots ..............................................................................1 1.1.1 Colloidal synthesis of quantum dots .......................................................3 1.1.2 The “TOP/TOPO” based synthesis method ....................................……6
1.2 Properties of quantum dots ………………………………………………………6 1.2.1 Optical properties of quantum dots ….........…………..……….………7 1.2.2 The core-shell structures of quantum dots….……… ..………............... 8
1.3 Application of quantum dots……………...………...…………….……........ 10 1.3.1 Quantum dots and in vivo imaging……….…………....…...….….......10
1.3.2 QD application in bacteria and DNA detection……...… .................. .11 1.4 Toxicity of quantum dots…..……………………………………...................13 1.5 Water soluble quantum dots…….………………………......………..…..…...........15 1.6 Bioconjugation techniques………………...………………………….............16
1.6.1 Zero-length crosslinkers……….………………….....……………….…..16 1.6.1.1 EDC…………………...........……………….………….………16
1.6.2 Avidin-biotin system…….....................................................................19 1.6.3 Protein A……………………...…..……………………………..……22 1.7 Antibody modification…………………………….. …………………............22 1.8 Application of labeled antibodies………..…………………....………………24 1.9 Gel electrophoresis…………………….……………………….……….….....24 1.10 E. coli O157:H7……………...…………………………………...………....25
2. MATERIALS AND METHODS……………….………………………………........27

iv
2.1 Property study of Quantum dots………………….…………………..………32 2.1.1 Calculation of quantum dot concentration…………………………..32 2.2 Surface modification of QDs…………………...……………………...…….33 2.3. Gel electrophoresis………………….…………………………….….……....34
2.4 QD protein A complex recollection from agarose gel .…….......….…..…….…..35 2.5 Cell based microarray……………..…………...……………………............37 3. RESULTS……..…………………………………………………………….………39
3.1 Gel electrophoresis application……………………………………………..41 3.2 QD EDC protein A complexes………………….…………….………..........41 3.3 QD protein A recollection from agarose gel………………………………..46 3.4 Biological property of QD protein A complex recovered from the gel…….46
4. CONCLUSIONS………………..………..………………………………….………51
5. REFERENCES…………………………………………………………………...…...53

v
LIST OF FIGURES
Figure Page
1.1 TM-APM image of GaAs QDs made by nanolithography .................2
1.2 Water beads spreadyed on glass surfaces . .........................................3
1.3 Colloidal synthetic scheme demonstration. ........................................5
1.4 Absorpthion spectra of different quantum dots ..................................7
1.5 The fluoresence/emission spectra of different quantum dots .............8
1.6 Chemical structure of EDC ...............................................................17
1.7 EDC crosslinker ................................................................................17
1.8 Chemical structures of CMC and DCC ............................................19
1.9 Chemical structures of biotin and biotein/avidin system ..................21
1.10 Fc region and antigen binding sites on antibodies ............................22
2.1 Scheme for synthesis QD core structures. ........................................29
2.2 Scheme for CdZe/ZnS core/shell structure synthesis. ......................30
2.3 Scheme for making water soluble QDs ............................................31
2.4 GeBaflex tube ....................................................................................35
2.5 Diagram for eulutin QD protein A complexes out of the gel ...........36
2.6 Glawss slide with circles on top........................................................37
2.7 Cell based microarray .......................................................................38
3.1 Fresh red quantum dots .....................................................................39
3.2 QD EDC protein A complexe structure ............................................42
3.3 Gel electrophoresis of QDs in different buffers ................................43
vi
3.4 Gel electrophoresis of QD EDC protein A complexes .....................44
3.5 Gel electrophoresis of QD EDC with various protein A amounts. ...45
3.6 Recollection of QD EDC protein A complexes from the gel. ..........47
3.7 Microarray study of eluted green QD EDC protein A complexes ....49
3.8 Microarray study of eluted red QD EDC protein A complexes........50

vii
LIST OF TABLES
Table Page
2.1 Chemicals used in QD synthesis .......................................................27
2.2 Different volume ratios of protein A and QDs .................................34
2.3 Chemical used in gel electrophresis ..................................................34

viii
APPLICATIONS OF GEL ELECTROPHORESIS
IN QUANTUM DOT CONJUGATES’ SEPARATION AND PURIFICATION
Luxin Wang
Dr. Xudong Fan and Dr. Azlin Mustapha, Thesis Supervisors
ABSTRACT
The objectives of this study were to build Quantum dot (QD) crosslinker
complexes for antibody conjugation usage, to purify QD crosslinker complexes by
gel electrophoresis and to check the biological functionalities of eluted QD
crosslinker complexes recovered from gel electrophoresis by cell based microarray.
Zero-length crosslinker 1-ethyl-3-(3-dimethylaminopropyl) carbodiimide
hydrochloride (EDC) was chosen to be the first crosslinkers, followed by the
conjugation with secondary crosslinker protein A. The purpose of adding secondary
crosslinkers was to make uniform QD crosslinker complexes. Due to the high
affinity between protein A and the Fc region of antibodies, QD EDC protein A
complexes were in uniform structures and all antigen binding sites faced outwardly.
Gel electrophoresis is a method used for separating DNA, RNA or proteins in
biological studies. In this study, gel electrophoresis was adopted to check the

ix
complete conjugation between QDs and protein A. In addition, it was successfully
used as a separation method for purifying conjugated QDs. GeBaflex tubes were used
to elute the conjugated QDs from the gel, these recovered QD EDC protein A
complexes showed their biological functionalities in following cell based microarray
studies. Fluorescence gave out by the cells labeled with QD antibody conjugates
successfully proved that gel electrophoresis can be used as an efficient separation and
purification method for QD crosslinker complexes. The recovered purified QD
crosslinker complexes keep their biological functionalities and can be used for future
antibody conjugation.

1
CHAPTER 1
INTRODUCTION
In 1932, Rocksby found that the red or yellow color of some silicate glasses
could be linked to microscopic inclusions of CdSe and CdS (Rocksby, 1932) and in 1985,
Ekimov and others discovered that these changes in color were linked to the energy states
determined by quantum confinement in CdSe or CdS “quantum dots”.
The term “quantum dots” (QDs) refers to crystal structures with extremely small
dimensions. Due to its small size, the electronic states begin to resemble and its
electronic characteristics and optical properties are changed (Woll and others, 2002).
Compared to bulk (three-dimensional) materials and quantum well (two-dimensional)
structures, QDs are zero-dimensional systems (Huang and others, 2002) and their
electronic states are fully quantized, which are similar to a single atom or atomic system.
This fully quantized system is stable against any thermal perturbation.
Due to those unique properties quantum dots have, considerable efforts have
been made to fabricate quantum dots and use QDs in different research fields. The desire
to identify, understand, and explore the size-dependent properties of QDs at the
nanometer scale has literally been simulated since 1985 and motivated quantum dots
research development.
1.1 Fabrication of Quantum dots
Techniques used to fabricate Quantum dots had been modified and optimized by
many scientists. At the beginning, techniques like lithographic patterning and quantum

2
well (QW) structure etching were used to make semiconductor hetero-structures, which
provided carrier confinement in all three directions and behaved as electronic quantum
dots (QDs). Unfortunately, the sizes of structures made by electron beam lithography or
focused ion beam lithography were larger than the desirable level and the distances
between QDs were large and generated additional emission from sidewalls and QW or
QWR structures (Lee, 2002). A picture of GaAs quantum dots made by a lithography
method is shown in Figure 1.1.
Figure 1.1 Tapping-mode atomic force microscope (TM-AFM) image of an array of GaAs quantum dots made by block copolymer nanolithography. (Adapted directly from: http://www.princeton.edu/~polymer/nano.html, Accessed on April 5, 2009)
Recently, quantum dots have been made through molecular beam epitaxy. In this
process, chemicals are evaporated and sprayed into small objects by condensing onto a
substrate surface (Molecular Beam Epitaxy, 2005). This process likes spraying water on
glass surfaces (Figure 1.2). When water falls onto glass surfaces, the water condenses

3
into many tiny water balls. As more layers are sprayed, the size of the balls starts to grow.
When the balls reach a specific size, they become quantum dots.
Figure 1.2 Water beads sprayed on glass surfaces. (Adapted from http://www.scienceimage.csiro.au/index.cfm?event=site.image.thumbnail&id=6202&viewfile=f&divid=BU, Accessed on April 5. 2009)
One drawback that both the lithographic method and epitaxy method could not
overcome is that quantum dots generated from these methods are hard to use. Because
those dots are attached to a substrate. Thus, a fabrication method which can make “free”,
uniform in composition, size, shape, internal structure, and surface chemistry QDs is
essential to further successfully understanding their size-dependent properties.
One method that is considered to be easier, cheaper, and shows good productivity
is the colloidal synthesis method. Due to the advantages of the colloidal method, it has
been widely used in industry and scientific research labs for routinely manufacture of
quantum dots.
1.1.1 Colloidal synthesis of quantum dots
The colloidal synthesis method is a process in which particles are made from
precursor compounds dissolved in solutions. There are three components in the system;
they are precursors, organic surfactants and solvents. When the reaction system is heated

4
to a sufficiently high temperature, the precursors will transform in to monomers
(Wikipedia.com, Accessed on July 29. 2008). A general scheme for preparing
monodisperse nanoparticles contains a single, temporally short nucleation event and a
slower growth period on existing nuclei. The nucleation process can be done by a rapid
injection of reagents in to reaction system containing hot solvent (Murray and others,
1993). A colloidal synthesis system setup sample is shown in Figure 1.3.
In the colloidal synthesis process, the temperature of the solution is the most
critical factor. First of all, this temperature needs to be high enough to decompose the
reagents, forming a supersaturation species in solution. These species will be used in
nucleation of quantum dots. After the nucleation process, the concentration of these
species in solution will drop below the critical concentrations for nucleation, thus further
materials will only be added to the existing nuclei (Murray and others, 2001). Secondly,
in order to realize the growth of the nuclei, the proper temperature needs to be adjusted
and maintained. The temperature needs to be low enough to promote further nuclei
growth.
In addition to the temperature, incubation time, concentrations of different
chemical compounds, and surfactants are also important factors that can contribute and
influence the quantum dot sizes. In general, quantum dots’ sizes increase with the
increasing of reaction time. The addition of more ingredients will increase the growth
rate of the existing nuclei.
During nanoparticles’ growth, the surfactants in solution can be adsorbed
reversibly to the surfaces of nanoparticles, providing dynamic organic shells (also called

5
capping layer). This capping layer can stabilize the nanoparticles in solution and control
their growth. Surfactants that bind to the core surfaces can slow down materials’ addition
rate to the core/nuclei surfaces, resulting in smaller sizes. After nanoparticles reach the
desired sizes, further growth can be stopped by cooling the solution (Murray and others,
2001). It has been found that colloidal semiconductor quantum dots can have a very
narrow size distribution (Parak and others, 2004) with the proper control of temperature,
time, concentrations and surfactants.
Figure 1.3 Colloidal synthetic scheme demonstration. (Adapted from Dr. Bawendi, M. website: http://nanocluster.mit.edu/research.php, Accessed on August 5. 2008)
Since colloidal nanocrystals are well dispersed in solution and not bound to any
solid support or surfaces, they can be produced in large quantities in a reaction flask and
be transferred as well as used in any solutions for various purposes. QDs produced by

6
colloidal method can be easily modified on their surfaces for adding biological molecules
or active crosslinkers for a variety of usage.
1.1.2 The “TOP/TOPO” based synthesis method
“TOP/TOPO” synthesis method is an organometallic approach to synthesizing
CdE (E = S, Se, Te) nanoparticles. The preparation method is based on the pyrolysis of
organometallic reagents (for example, dimethylcadmium and bis selenium) by injecting
them into the hot solvents (TOPO or TOP) (Matsumoto and others, 2004). This method
is widely used due to its versatility, reproducibility and high quality of the particles.
1.2 Properties of quantum dots
By shrinking the bulk material to a small quantum dot, the properties of quantum
dots become very different with three dimensional systems (bulk materials), two
dimensional systems and one dimensional systems (quantum wires). Being a zero
dimensional system, the charge carriers and excitations of QDs are confined in all three
dimensions. Quantum dots are smaller than the De Broglie wavelength; their properties
depend on their exact number of atoms. For large clusters or bulk materials, they have a
well-defined lattice; properties no longer depend on their exact number of atoms (Parak
and others, 2004). In addition, a quantum dot is a semiconductor. In semiconductors, the
electronic properties are directly related to the transitions between the edges of the
valence bands and the conduction bands. In a dot, the electrons have larger energies than
electrons in a bulk at the conduction bands, although those electrons are in ground states
(Parak and others, 2004).

7
1.2.1 Optical properties of quantum dots
The most striking effect in semiconductor nanoparticles is the widening of the gap
Eg between the highest occupied electronic states and the lowest unoccupied states
(Trindade and others, 2001). Eg is the minimum energy needed to create an electron-
hole pair, energy lower than Eg cannot be absorbed by quantum dots. Thus, different
quantum dots have different absorption spectra based on their different diameter and
sizes, because the band gaps depend on the sizes of QDs. Figure 1.4 shows the
absorption spectra of different sizes quantum dots.
Figure 1.4 Absorption spectra of different quantum dots. The bigger the quantum dots size the bigger absorption wavelength. (Adapted directly from Evident Tech website: http://www.evidenttech.com/products/evidots/evidot-specifications.html, Accessed on August 2008)
The fluorescence/emission wavelengths of Quantum dots are longer than those of
the absorbed light. In Figure 1.5, these are emission wavelengths of quantum dots. The
position of the luminescence peak depends on the average quantum dot sizes and its
width is correlated to the nanocrystals’ size distribution. By measuring the maximum of

8
emission spectra and their width, those peaks and their values can be used to estimate
the sizes or size distributions of quantum dots.
Figure 1.5 The fluorescence/ emission spectra of different quantum dots. (Adapted from website: http://cnmt.kist.re.kr/main/pr/newsletter/save/60/sub22-3.html, Accessed August 2008)
1.2.2 The Core-Shell structures of quantum dots
Coating a nanoparticle by anther material will generate the “core-shell”
nanoparticle structure. In “core-shell” structures, the cores are made from colloidal
process. They can be made by metal or other materials. The shell parts of the quantum
dots are made by organic materials. Usually, the core materials should be capped by
materials that have a larger band gap. The conduction band energy of capping material is
higher than that of the core material and the valence band energy of the capping material
is lower than that of the core material (EychmÜller, 2004). There are many core/shell

9
systems are available, like hydrophobic monolayers, positively or negatively charged
monolayers, or polymer layers (Katz and others, 2004).
One purpose of adding this capping layer is to prevent the excitons from
spreading over. By adding shell layers, the excitons are forced to recombine and
confined to the core. After adding the shell layer, the luminescence/fluorescence
efficiency will be changed. According to Banin and Millo (2004), although for InAs/InP
core/shell structures, the adding of shell leaded to the quenching of fluorescence, for
InAs/CdSe core/shell structures, the quantum yield (fluorescence strength) actually
increased up to a maximum value of 21% after the addition of shell layers (Banin and
Millo, 2004) .
Another reason to build the core/shell structure is to increase the stability of core
structures of quantum dots. Core/shell structures with a shell made of materials having a
larger band will provide protection and increased stability than just the core structure
itself. One experiment done by Banin and Millo in 2004 proved this hypothesis. The
stability of InAs core structures and InAs/CdSe core/shell structures was tested by
measuring their absorption and emission spectra after a long storage time (ten months)
under daylight. They found that the emission of InAs core structures was quenched by a
factor of 40 compared to the fresh cores. For the core/shell structures, there was only a
16% to 13% reduction in emission strength (Banin and Millo, 2004).
Last but not least, the core/shell structure can prevent the aggregation of the
nanoparticles into bulk materials and control the final dimensions of nanoparticles.

10
Colloidal CdSe/ZnS core-shell nanocrystals are one core/shell structure
nanoparticles. They have attracted great attention from scientists for long time. These
structures demonstrated high quantum yield and high photostability at room temperature
and made them promising emitters for quantum information and potential biological
applications (Alivisatos, 2004). Core/shell structures can also be used for devices like
thin-film LEDs or nanocrystal quantum dot (QD) lasers (Klimov and others, 2000 and
Mikhailovsky and others, 2002). CdSe/ZnS core/shell quantum dots have been the best
understood quantum dots and commonly used.
1.3 Applications of quantum dots
Quantum dots are emerging as a new class of fluorescent probes for biomolecular
and cellular imaging, target cells detection and DNA labeling dyes. They have unique
optical and electronic properties such as “size-tunable light emission, improved signal
brightness, resistant against photobleaching and simultaneous excitation of multiplex
fluorescence colors” (Gao and Dave, 2007). The following part will talk about the
application of quantum dots in biology and medical fields.
1.3.1 Quantum dots and in vivo imaging
Quantum dots have been widely tested for its application for in vivo imaging. In
1998, Chan and Nie demonstrated that QDs could be conjugated to a membrane-
translocating protein called transferrin. The QDs retained their bright fluorescence in
vivo after conjugation and were not noticeably toxic. This phenomenon revealed a
potential application of QDs as intracellular labels for living cell studies. Another

11
example, in one cell motility test experiment, cells migrated over a substrate covered with
silica-coated QDs, as the cells moved across the substrate; they got labeled with QDs,
causing an increase in fluorescence from cells and a nonfluoresent “dark” path in their
trails (Pellegrino and others, 2003). These phagokinetic tracks can be used to accurately
assess invasive potential of different types of cancer cells.
Quantum dots have also been used to image the vascular systems in various
animal models. In a report by Larson et al, the injected QDs could remain fluorescence
and detectable when they circulated into capillaries in adipose tissues and the skin of a
living mouse (Larson and others, 2003). The advantage to use quantum dots instead of
organic dye is that quantum dots demonstrated longer lifetime than organic dyes. The
circulation lifetime of an injected molecule depended on the size of the molecule and its
chemical properties. Organic dyes can be quickly eliminated from circulation minutes
after injection due to their small sizes and renal filtrations. QDs and other nanoparticles
are larger than dyes and won’t be cleared through the kidneys. Thus, quantum dots can
keep its viability, brightness after they were injected to live mouse bodies.
1.3.2 QD applications in bacteria and DNA detection
One of the most popular ways to use nanoparticles in bacteria or DNA detections
is to conjugate QDs to antibodies or complementary DNA bands, forming a fluorescence-
based reporting assay. Zhao and others (2004), used QD antibody conjugates to detect E.
coli O157:H7. In this study, nanoparticles of 60 nm in sizes were conjugated to
monoclonal antibodies that are specific to E. coli O157:H7. Those antibody nanoparticle
conjugates bound to antigens present on surfaces of E. coli. From that research, scientists

12
found that the signals produced by antibody nanoparticle conjugates are >1,000 times
greater than that produced by the dye molecule-labeled antibodies (Zhao and others,
2004).
In recent years, the development of new technologies, like microarrays and
Polymerase Chain Reaction (PCR), has provided powerful tools to help researchers
solving biological problems. Nanoparticles, with their advantage of intense fluorescence
signal, have been tried and tested their application in DNA based technologies, like in
DNA hybridization process. Those nanoparticles are used as reporter dyes for targets
detection and identification purpose.
In this DNA microarray study, the scheme includes three parts. They are 1. DNA
immobilization on glass surfaces, 2. DNA probes labeling by nanoparticles and 3. DNA
hybridization between the capture DNA and the probe DNA. One example, Rubpy-
doped silica nanoparticles have been used in “one color” microarray, this novel
microarray showed good correlation with the traditional phycoerythrin labeled method,
but with a 20 times lower detection limits (Zhou and Zhou, 2004).
The usage of nanoparticles in the detection of bacteria, DNA and other cells, have
been tested via different ways. Most of the studies showed promising results and
discoveries. Those exciting developments in nanoparticle applications stimulated the
further efforts on this area. Nanoparticles with their great potential as a better
replacement for current widely used organic dyes opened another door for biological
studies.

13
1.4 Toxicity of quantum dots
The potential toxic effects of semiconductor quantum dots have recently become
a topic of considerable importance and discussion. For potential application in vivo tests,
toxicity is the key factor to determine whether quantum dot imaging would be approved
by regulatory agency and used for human beings (Gao and Dave, 2007), especially QDs
have showed longer circulation time in living animals (Larson and others, 2003). The
law community and scientists are on opposite sides. One reason for this disagreement is
the lack of sufficient knowledge regarding different nanoparticles. Studies directly
related to toxicity analysis have only started to gather some information. Detailed
information about unwanted side effects in live cells is still needed, especially after hours
of continuous exposure.
Some studies showed that QDs with stable polymer coatings are nontoxic to
humans and animals (Dubertret and others, 2002; Gao and others, 2004; Lidke and
others, 2005; Larson and others, 2003; Ballour and others, 2004; Stroh and others, 2005;
Parungo and others, 2005; Jaiswal and others, 2003; Voura and others, 2004). But, very
little is known about the effects of long-term exposure of different nanoparticles of
different cell types and tissues. Surface modifications of nanoparticles have been thought
as a good way to keep the QDs’ stability and prevent the release of core/heavy metal
materials (Maysinger and Lovric, 2007).
The toxicity of quantum dots, when tested in vitro, depends on several factors,
like QD properties and cell status. From the QD’s perspective, the core structure, when
not protected, can gradually disintegrate and cause the release of toxic ions (like

14
cadmium ions) into to the medium (Derfus and others, 2004). Secondly, “the diffusion of
oxygen is facilitated by the loose shell around the core, this can cause electron or energy
transfer, which on the other hand, results in the formation of toxic reactive oxygen
species (ROS)” (Lovric and others, 2005; Ipe and others, 2005; Samia and others, 2003;
Green and Howman, 2005), leading to the cell damage or death (Ipe and others, 2005).
Nanoparticles can induce the generation of Reactive Ocygen Species (ROS) in the
cellular environment. Unfortunately, although it has been found that high levels of free
material ions leading to the formation of ROS and oxidative damage have been detected
in live cells that were exposed to the nanomaterials, the exact mechanisms for ROS
production are still not well understood (Maysinger and Lovric, 2007). More research
that includes in vivo long term exposure tests are needed.
In the mean time, the cellular environment and cell status play critical roles in
their response to quantum dots. For example, cells exposed to quantum dots are more
vulnerable when they don’t have enough nutrients or growth factors, whereas cells
cultured in the presence of serum are more resistant to QD induced cell death. One
hypothesis stated that Quantum dots can interact with serum and other biological fluid
components and change (reducing or increasing) their damaging effects on cells
(Maysinger and Lovric, 2007).
As mentioned in the previous paragraph, cells in serum demonstrated better
resistance to QD toxicity. “One of the best documented components used in cell culture
medium that can modify nanoparticles’ entry and the extent of nanoparticle-induced
cytotoxicity is serum albumin. This biomolecule can reduce the internalization of

15
quantum dots and delay or reduce cells’ death induced from the exposure to QDs”
(Maysinger and Lovric, 2007).
Although debate exists about the application of QDs in biological studies and its
toxicity, research related to its novel application is still going on. In the following part,
the methods used for QDs modification for potential biological application will be
discussed.
1.5 Water soluble quantum dots
Making the quantum dots water soluble is the first step for QD conjugation. As
cells can not survive in an organic solvent, water soluble quantum dots is the format that
can be used in biological related studies.
There are two general strategies for making water soluble quantum dots. One
approach is to exchange the hydrophobic monolayer of ligands on the QD surface with
hydrophilic ligands (Chan and Nie, 1998). Unfortunately, this method can cause particle
aggregation and decreases the fluorescent efficiency. In addition, possible desorption of
labile ligands from the QD surfaces can increase toxicity due to exposure of toxic QD
elements. The second method is that the native hydrophobic ligands will be retained on
the QD surfaces and rendered water-soluble through the adsorption of amphiphilic
polymers with hydrophobic segments. There are several polymers that have been
applied, octylamine-modified polyacrylic acid (Wu and others, 2003) and PEG-
deriveatized phospholipids (Dubertret and others, 2002). The hydrophobic domain can

16
interact with alkyl chains of the ligands present on the QD surfaces, whereas the
hydrophilic groups face outwards and make the QDs water soluble.
Once water soluble QDs are available, conjugation which can link the biological
compounds to QDs can be realized by the usage of various crosslinkers.
1.6 Bioconjugate techniques
In order to use the quantum dots, different crosslinkers have been tested and used
to conjugate the quantum dots to different biological functional groups. In this section,
three common bioconjugate techniques that have been widely proven to generate
promising results in biological studies will be introduced.
1.6.1 Zero-length crosslinkers
The smallest available reagent systems for bioconjugation are zero-length
crosslinkers. Those crosslinker compounds can realize the conjugation of two molecules
by forming a bond without adding a new atom in between.
1.6.1.1 EDC
EDC, short for 1-ethyl-3-(3-dimethylaminopropyl) carbodiimide hydrochloride, is
the most popular carbodiimide for use in conjugating biological substances. EDC is a
water soluble chemical, so it is easy to add EDC to any kind of reaction without
treatment. The structure of EDC is showing in the following picture, downloaded from
www.Wikipedia.com.

17
Figure 1.6 Chemical structure of EDC. Adapted from Wikipedia website on: http://upload.wikimedia.org/wikipedia/commons/8/87/EDC_Structure.png. Accessed on April 16, 2009.
EDC can cause a variety of chemical conjugation. It can link two molecules, one
containing an amine group and the other one containing a carboxylate group, together.
But, using EDC as a crosslinker has one drawback. That is the presence of both
carboxylates and amines on one molecule will result in self-polymerization. The scheme
of how an EDC crosslinker works is shown in Figure 1.7.
Figure 1.7 EDC reacts with carboxylic acids to create an active-ester intermediate. This intermediate can react with amine containing compounds to create conjugates. (Adapted from Hermanson, 1996).
The following EDC crosslinker advantages and applications were adapted from
www.piercenet.com Accessed on April 19, 2009.
Advantages of EDC crosslinkers
• Efficiency of EDC-mediated coupling is increased with the presence of Sulfo-
NHS
+ EDC

18
• Amide bonds formed with EDC crosslinking reaction can provide a neutral
linkage
• Excess reagent and crosslinking byproducts can be easily removed by washing
with water or diluted acid
• EDC is water soluble, so this crosslinking reaction can be done in physiologic
solutions without adding an organic solvent
• High purity, crystalline EDC can be used to create high-purity activated
derivatives
Applications of EDC
• Conjugate carboxyl to amine groups in peptides and proteins
• Convert carboxyls to amine-reactive Sulfo-NHS esters
• Crosslink proteins to carboxyl coated beads or surfaces
• Activate nanoparticles with amine-reactive Sulfo-NHS esters
• Couple haptens to carrier proteins (e.g. attach a peptide to KLH)
• DNA labeling through 5’ phosphate groups
There are other chemicals that can be used to build zero crosslinkers. For
example, CMC, 1-cyclohexyl-3-(2-morpholinoethyl) carbodiimide, is a water-soluble
reagent that can be used to form amide bonds between one molecule containing a
carboxylate and another molecule containing an amine group. Another example is DCC,
dicyclohexyl carbodiimide. DCC has been used for peptide synthesis and creating
peptide bonds (Sheehan and Hess, 1955; Barany and Merrifield, 1980). EDC, CMC,

19
DCC, DIC all belong to the carbodiimides group in the zero-length crosslinker. Other
zero-crosslinkers are like Wookward’s reagent K, N, N’-carbonyldiimidazole, etc.
Figure 1.8 Chemical structures of CMC and DCC. (Adapted from Hermanson, 1996).
1.6.2 Avidin-biotin systems
One of the popular methods for conjugation is to use natural strong binding of
avidin with a small molecule biotin. Modification reagents can add functional biotin
groups to proteins, nucleic acids and other molecules in different shapes and relativities.
Commercial kits are also available for adding biotin. The interaction between biotin and
avidin is among the strongest non-covalent affinities, with a dissociation constant of
approximately 1.3×10⁻¹⁵M. When the biotin is bound to avidin, the interaction promotes
great stability to the complex.
“Avidin is a glycoprotein found in egg whites that contains four identical subunits
of 16,400 Daltons each. The total molecular weight is approximately 66,000 Daltons”
(Green, 1975; Hermanson, 1996). Each avidin molecule can contain as many as four
biotin binding sites. Biotinylated molecules and avidin conjugates can find and bind to
each other under extreme conditions. The specificity of this binding is like antibody to
antigen. “The only disadvantage of using avidin is that avidin has the potential to bind
nonspecifically to components other than biotin due to its high pI and carbohydrate
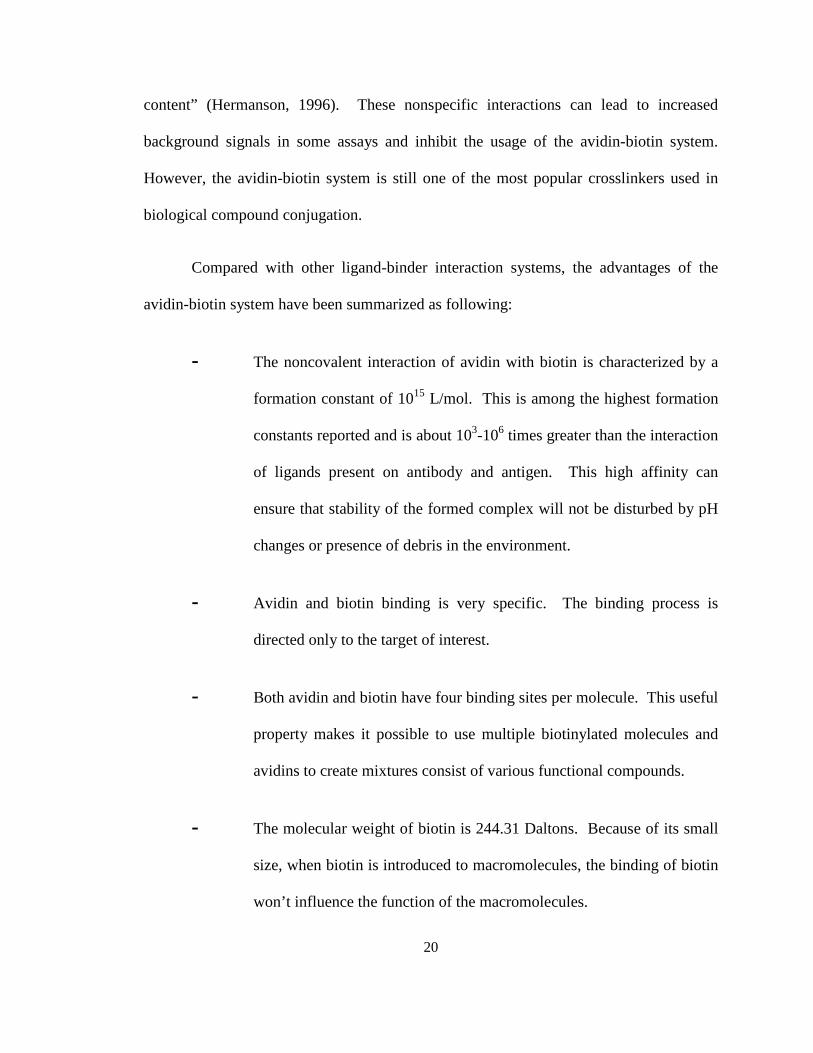
20
content” (Hermanson, 1996). These nonspecific interactions can lead to increased
background signals in some assays and inhibit the usage of the avidin-biotin system.
However, the avidin-biotin system is still one of the most popular crosslinkers used in
biological compound conjugation.
Compared with other ligand-binder interaction systems, the advantages of the
avidin-biotin system have been summarized as following:
- The noncovalent interaction of avidin with biotin is characterized by a
formation constant of 1015 L/mol. This is among the highest formation
constants reported and is about 103-106 times greater than the interaction
of ligands present on antibody and antigen. This high affinity can
ensure that stability of the formed complex will not be disturbed by pH
changes or presence of debris in the environment.
- Avidin and biotin binding is very specific. The binding process is
directed only to the target of interest.
- Both avidin and biotin have four binding sites per molecule. This useful
property makes it possible to use multiple biotinylated molecules and
avidins to create mixtures consist of various functional compounds.
- The molecular weight of biotin is 244.31 Daltons. Because of its small
size, when biotin is introduced to macromolecules, the binding of biotin
won’t influence the function of the macromolecules.
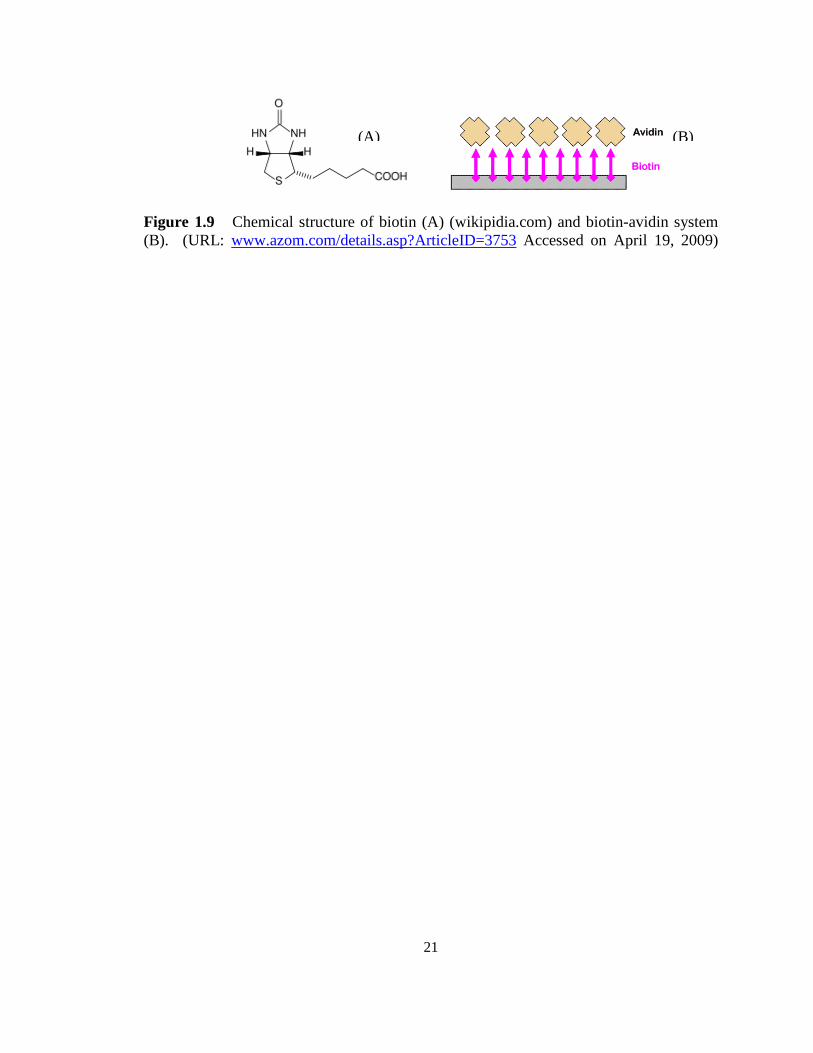
21
Figure 1.9 Chemical structure of biotin (A) (wikipidia.com) and biotin-avidin system (B). (URL: www.azom.com/details.asp?ArticleID=3753 Accessed on April 19, 2009)
(A) (B)

22
1.6.3 Protein A
Protein A is a 40-60 kDa surface protein originally found in the cell wall of the
bacteria Staphylococcus aureus. It is encoded by the spa gene. It has been widely used
in biochemical research because of its ability to bind immunoglobulins. It can bind
proteins from many mammalian species, most notably IgG. It binds with the Fc region of
immunoglobulins through interaction with the heavy chain. Because of this special
binding between protein A and the antibody, it makes the labeling of the antibody easier.
In Figure 1.10, there are pictures of the Fc region of the antibody and antigen binding site
on the antibody.
Figure 1.10 Fc region of antibodies and antigen binding sites on antibodies.
1.7 Antibody modification
Methods for antibody modification have been developed in many previous studies.
It is an important step for any further conjugation between antibodies and nanoparticles,
as well as future applications in biological researches. Site-specific delivery of drugs or
site-specific binding is established based on the successful conjugation.

23
In order to keep the functionality of the antibody after conjugation, modification
is needed to avoid the conjugation to the immunoglobulin fractions. The
Immunoglobulin G molecule is composed of two light and two heavy chains. The two
chains are held together by noncovalent interactions and disulfide bonds. The heavy
chains of immunoglobulin molecules are similar, with a molecular weight of subunits
from approximately 450 to 550 amino acids with three dimensional structures. Many
functional groups can be used for modification - for example - the Lysin ε-amine group,
N-terminal α-amine groups and carboxylate groups. “Although both amine and
carboxylate groups are as plentiful in antibodies as they are in most proteins, the
distribution of them within the three-dimensional structure of antibody is nearly uniform
throughout the surface topology. Due to this reason, the conjugation processes that use
these groups will crosslink randomly to nearly all parts of the antibody molecule, which
in turn, leads to a random orientation of the antibody within the conjugate structure”.
This randomly conjugation may block the antigen binding sites and prevent the binding
between antibodies and antigens (Hermanson, 1996).
Crosslinkers that can selectively react with antibodies attracted attentions. For
example, the disulfides in the hinge region that hold the heavy chains together have been
chosen and cleaved with a reducing agent (like MEA, DTT or TCEP, etc.) to create two
half-antibody molecules, with an antigen binding site on each of them. Then, these half
antibodies with disulfides will be labeled and used.

24
1.8 Applications of labeled antibodies
The successful developments of bioconjugation techniques accelerated the usage
of QD antibody conjugates, due to its high brightness and high resistance to
photobleaching. One of the most common applications of QD antibody conjugates is to
use them as secondary reporters to detect the presence of target pathogen from food or
environmental samples. The flow chart of pathogens detection from food was divided
into the following procedures: 1. Separation of target pathogens from food samples; 2.
Binding of QD antibody complexes to the surfaces of targets; 3. Fluorescence detection.
Quantum dot antibody conjugates have also been used in flow cytometry.
Quantum dots demonstrated greater thermal stability than traditional low molecular
weight phycobiliprotein fluorophores. Quantum dot antibody conjugates against
monocyte and T cell antigens retained most of their fluorescence under the high
temperature annealing step, allowing simultaneous fluorescent immunophenotyping and
telomere length measurement in flow cytomery. While the traditional fluorescent probes
are severely damaged at the 82°C hybridization step, making simultaneous
immunophenotyping difficult, QDs showed great potential to be the best replacement for
traditional fluorescent compounds (Kapoor and others, 2009).
1.9 Gel electrophoresis
Gel electrophoresis is a technique used for DNA, RNA and protein separation.
Based on the charges present on the molecules, loaded DNA, RNA and protein will move
toward the positive side at different speeds. The movement speed is based on the

25
molecular weights of segments; the smaller the molecule weight, the faster the movement
speed is.
Gel electrophoresis can be used as an analytical method for separation and
comparison of different size molecules. Agarose gel is a crosslinked polymer. The gels
used in separating proteins or small nucleic acids (DNA, RNA, or oligonucleotides) are
usually composed of different concentrations of acrylamide. When separating larger
nucleic acids (greater than a few hundred bases), purified agarose gives better results
(Wikipidia.com 2009).
In recent years, using the gel electrophoresis to analyze nanoparticles has been
tested and proven successful. It has been used to separate the QD-DNA conjugates (Fu
and others, 2004). Again, it was proven from these tests that gel electrophoresis can be
used for QDs and QD-biomolecules conjugate separation. By comparing the size of
different conjugates, complete conjugation and non-complete conjugation can be
separated.
One purpose of this study is to apply a gel electrophoresis related technique to
purify the QDs and QD protein A complexes that will be used to make QD antibody
conjugates used in foodborne pathogen detection. The target pathogen in this study is E.
coli O157:H7.
1.10 E. coli O157:H7
Escherichia coli is a large and diverse group of bacteria. Although most strains of
E. coli are harmless, approximately 10% to 15% of them can make you sick (Sojka and

26
Carnaghan, 1961; Gross, 1994; Horne and others, 2000). Some E. coli can cause diarrhea,
while others can cause urinary tract infections, respiratory illness and pneumonia, etc.
Some kinds of E. coli cause disease by making a toxin called the Shiga toxin. The
bacteria that make these toxins are called “Shiga toxin-producing” E. coli. E. coli
O157:H7 infection, which was first identified as a pathogen in 1982, remaining on the top
of the annual foodborne diseases list. Although the effective intervention methods have
decreased the outbreaks related to E. coli O157:H7, the number of people who got sick
by consuming E. coli O157:H7 contaminated foods still exist.
A more accurate, sensitive and portable detection device for foodborne pathogen
on-site checking is needed in order to develop efficient intervention methods to prevent
future outbreaks. We hope that, through this study, more reliable QD E. coli O157:H7
antibody conjugates can be made for future usage. By adopting the gel electrophoresis
method, purified conjugates can be available. All these will be the first step for the future
development of on-site detection devices.

27
CHAPTER 2
MATERIALS AND METHODS
Methods used to make water soluble quantum dots were adopted from Jay Cupps
(former Masters Student in Dr. Fan’s Lab at the University of Missouri ). Materials are
listed in the following table.
Table 2.1 Chemicals used in QD synthesis.
Chemicals Catalog No. Company
Dimethylcadmiun
48-5040
Strem Chemicals
Cadmium oxide (CdO) 244783 Sigma-Aldrich
Lauric acid L4250 Sigma-Aldrich
Trioctylphosphine oxide (99%) 223301 Sigma-Aldrich
Trioctylphosphine oxide (90%) 346187 Sigma-Aldrich
Hexadecylamine (HDA) H7408 Sigma-Aldrich
Trioctylphosphine (TOP) 117854 Sigma-Aldrich
Elemental selenium (Se) 229865 Sigma-Aldrich
Hexamethyldisilothioane ((TMS)2S) 52643 Sigma-Aldrich
Dimethylzinc 417246 Sigma-Aldrich
Zinc stearate 307564 Sigma-Aldrich
Anhydrous methanol 322415 Sigma-Aldrich
Methanol - ChemStores UMC1
Chloroform - ChemStores UMC1
Hexane - ChemStores UMC1
Toluene - ChemStores UMC1
1ChemStores is located at the Chemistry department at the University of Missouri.

28
The method used in this study is a modification of the method developed by
Hines and Guyot-Sionnest (1996). The schemes used to make quantum dot core CdSe
and core/shell structures are listed in Figure 2.1 and 2.2.
Special notes for making quantum dots:
• The bubbler should always be on while heating the system to prevent the buildup
of pressure.
• The flask should be turned off when purging the line to a storage tube.
• The bubbler has to be closed when escaping N2 is used to prevent air from
entering the system (for example: adding chemicals to the flask and using the
storage tubes)
• Toluene degrades the plunger of the syringe, so the plunger should be removed
and allowed to dry as quickly as possible to lessen this degradation
• When the contents in the flask are liquid, stir the mixture at maximum sustainable
speed
The usages of QDs usually begin with the fictionalizations of the QD surfaces.
One of the most common fictionalization of QDs is to make the QDs water soluble,
because most of the biological application of QDs requires water solubility. In our study,
we also used water soluble QDs. The scheme to make water soluble QDs in listed in
Figure 2.3.

29
Figure 2.1 Scheme for synthesis QDs core structure. (Adapted from Jay Cupp’s protocol).
STEP 1
STEP 2
STEP 3
STEP 4
STEP 5
STEP 6
STEP 7

30
Figure 2.2 Scheme for CdSe/ZnS Core/Shell structure synthesis.

31
Figure 2.3 Scheme for making water soluble QDs.

32
2.1 Property study of quantum dots
Instrumental Neutron Activation Analysis (INAA) is a method to determine the
concentration of trace and major elements in a variety of matrices. In INAA, the sample
is subjected to a neutron flux, thus radioactive nuclides are produced. As radioactive
nuclides decay, they emit gamma rays whose energies are specific for each nuclide. By
comparing the intensity of gamma rays emitted by the sample and the rays emitted by a
standard, the concentration of one particular element can be quantitatively measured.
In this study, the QDs synthesized were diluted and send to the chemistry
department located on the University of Missouri campus. The purpose was to check the
amount of end product of our QD synthesis procedure and calculated the synthesis
efficiency as well as the final product concentration. According to the process provided
by the chemistry department, 100 µg of liquid sample was pipetted onto 5 filter papers
and analyzed. The concentration of Selenium was reported.
2.1.1 Calculation of quantum dot concentration
CdSe quantum dots
3
34
QDrπ = V
r
CdSe

33
QDatomX
rPerQDN
QD
Se /43
3
3
==π
X=Lattice constant (6.050 Å at 300 k)
mlatomSeionConcentrat =)(
mlQD
PeQDNSeionConcentrat
Se
=)(
2.2 Surface modification of QDs
Quantum dots with a DHLA water soluble surface were modified with EDC for
further biological application. Ten milligrams of 1-Ethyl-3-(3-dimethylaminopropyl)
carbodiimide (EDC) (Sigma) was dissolved in 0.5 ml MES (2-(N-Morpholino)
ethanesulfonic acid) solution to make EDC stock solution. One hundred microliters of
QDs-DHLA were modified by adding 25~30 µl of EDC stock solution. After that,
different amounts of protein A were added and the mixtures were incubated in the cold
room (4oC) for 2 h to make QD protein A complex before the further conjugation with
antibodies.
Different amounts of protein A were tested to check the minimum amount protein
A that is needed for fully binding EDC on QD surfaces. The concentration of protein A
is 0.5 mg/ml.

34
Table 2.2 Different volume ratios of protein A and QDs were tested in this study.
QDs : Protein A (0.5mg/ml)
volume 1 µl : 3 µl 1 µl : 15 µl 1 µl : 30 µl 1 µl : 45 µl 1 µl : 60 µl
2.3 Gel electrophoresis
A10 X stock TAE buffer was made by adding 48.8 g of Tris-base, 10.9 g of
Glacial acetic acid, 2.92 g EDTA and 1 L of water (pH 8.18-8.29). A 1 X diluted TAE
buffer was used for making gel and served as the running buffer during electrophoresis.
Table 2.3 Chemicals used in gel electrophoresis.
Chemicals Catalog No. Company
Tris-base H5131 Promega
Glacial acetic acid A38-212 Fisher
EDTA BP120-500 Fisher
Agarose low EEO BP160-100 Fisher
Protein A P6031 Sigma
Load buffer (6X) N313-KIT Ameresco
Agarose gel (0.5%) was used for QDs, QD EDC and QD EDC protein A
electrophoresis. Two microliters of loading buffer (Envision™ DNA dye loading buffer
6× from Amersco®, Solon, Ohio) were mixed with 10 µl of QD samples and the
electrophoresis was done by Bio-rad electrophoresis unit under 100 V for 50 min.

35
2.4 QD protein A complex recollection from agarose gel
Gel electrophoresis showed its great potential in separating QDs and QD protein A
complexes, re-collecting the QD protein A complexes and QDs back from the gel would
make gel electrophoresis a potential purification method rather than just being a
separation method.
GeBAflex-tube is a tube that can be used to extract DNA or protein out of the gel.
The process of extracting QD protein A complexes out of the gel is shown in Figure 2.5.
Figure 2.4 GeBAflex tubes.
(http://www.bioxys.com/images/42843%20SIZE%20TUBES.jpg accessed on April 20.
2009).

36
Figure 2.5 Diagram for eluting QD protein A complexes out of the gel.

37
2.5 Cell based microarray
One glass slide was cleaned by plasma cleaner with oxygen flowing in the
machine. After the cleaning step, the glass slide was immersed in 1% 3-Aminopropyl-
trimethoxysilane (97%, APTS) for 6 h at room temperature on a shaker. The APS will be
washed off after 6 h with a water/ethanol mixture and baked in a 100oC oven for
overnight.
Figure 2.6 Glass slide was divided into two sides. Circles in 2 mm diameter were drawn by marker pen on the back of the slide. The glass slide was divided into two sides. Six circles were drawn on each side, as
shown in Figure 2.6. In each circle, 10 µl of freshly prepared EDC solution were added,
following by mixing another 10 µl of cells suspension. The slide was placed in a clean
petri dish and incubated in a cold room (4oC) for 2 h. During the 2 h incubation, the EDC
served as a crosslinker and bound the cells onto the slide surface.
Slides labeled with cells was washed by PBS to clean the excess unbound cells.
Ten microliters of QD protein A antibody conjugates were added into the circles and
were incubated in a cold room again for another 2 h. There are two sets of QD protein A
antibody conjugates, one used freshly prepared QD protein A complexs; while the other
one used QD protein A complex recollected after gel electrophoresis. After a 2 h
2 mm
38
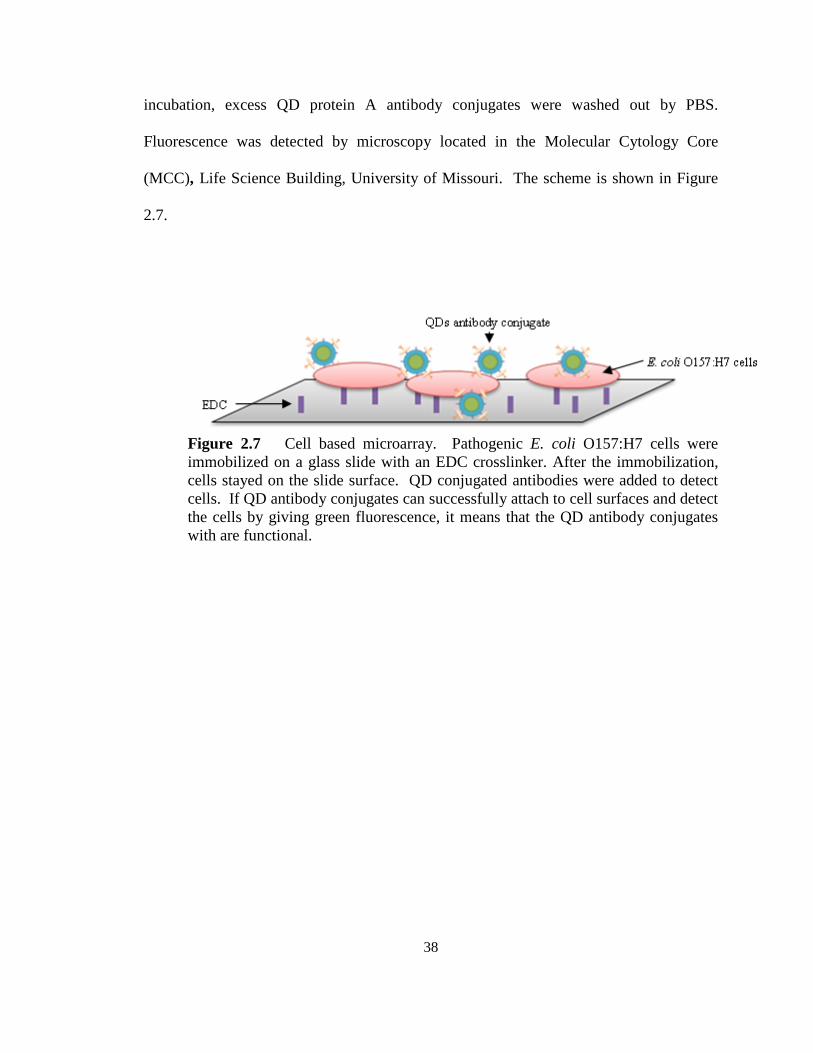
incubation, excess QD protein A antibody conjugates were washed out by PBS.
Fluorescence was detected by microscopy located in the Molecular Cytology Core
(MCC), Life Science Building, University of Missouri. The scheme is shown in Figure
2.7.
Figure 2.7 Cell based microarray. Pathogenic E. coli O157:H7 cells were immobilized on a glass slide with an EDC crosslinker. After the immobilization, cells stayed on the slide surface. QD conjugated antibodies were added to detect cells. If QD antibody conjugates can successfully attach to cell surfaces and detect the cells by giving green fluorescence, it means that the QD antibody conjugates with are functional.

39
CHAPTER 3
RESULTS
Green and red quantum dots were synthesized in Dr. Fan’s lab. Four grams of
99% TOPO, 4 g HDA, 30 mg CdO, 0.6 g Lauric Acid and 9 g of 90% TOPO were used
to make the quantum dots. By adjusting the temperature, quantum dots with different
colors were made (240oC for green, 300oC for red). Figure 3.1 shows the product
container part of the whole fabrication system.
(A) (B)
Figure 3.1 Fresh red quantum dots are made in the reaction flask. (A) Fresh red quantum dots in room light. (B) Fresh quantum dots under UV light. Core parts of quantum dots were made by Cd and Se. To determine the
concentration of water soluble QDs, 100g samples were sent to the Chemistry
Department at the University of Missouri to test the concentration of individual chemical
compounds by instrumental neutron activation analysis (INAA). In this project, INAA
was used to detect the concentration of Se. In order to calculate the concentration of QDs,
the absorbance wavelength and the diameter of QDs were also used. The formula used to
calculate the QD diameter was adopted from Yu and others (2003).

40
D= diameter λ=absorbance wavelength (Yu, et al. 2003)
The absorbance wavelength of the green quantum dots is 530 nm. Thus, by
plotting 530 nm in the equation above, the diameter of green quantum dots is
approximately 2.7 nm.
Results from the INAA analysis showed that the concentration of Se is 0.5097
PPM of the QD sample. By using the method provided in the following link, the
concentration of QDs was calculated.
(http://www.sos.siena.edu/Chemistry/files/doc/Exp_6_Number_of_Shells.doc)
l max= 530 nm(green) Diameter= 2.4 nm Cd-Se bond length 0.36 nm
Calculation of Formula units of CdSe across diameter of QD:
Diameter/CdSe bond length: 2.7nm/0.36 nm= 7.5 units
Calculation of # of CdSe units in a sphere of d=2.7 nm diameter:
(4/3)p(d/2)3=(4/3)(3.14)(7.5/2) 3 =220.78 units of CdSe in the Q.D.
Calculation of Molar Mass of QD:
(220.78 units of CdSe)(molar mass Cd 112.4118 + molar mass Se 78.96)=42,251
g/Mol, the molar mass of CdSe Q.D. that has a diameter of 2.7 nm.
Calculation of QD concentration:
57.414277.0)106242.1()106575.2()106122.1(: 233649 +−×+×−×= −−− λλλλDCdSe

41
(0.5097 milligram/L / 1000) / 42.251 g/mol = 1.2 ×10 -5 mol/L
As the sample was diluted by 10 times, the concentration of water soluble QDs is
1.2×10⁻⁴ mol/L.
3.1 Gel electrophoresis application
Five milliliters of QDs-DHLA and 25 ml of buffer (with various pH values from
pH 4 to pH 10) were mixed and stored in a cold room for two days. Ten millimeters of
mixture were loaded into 0.5% agarose gel. Comparing the gel picture to the one got
with fresh QDs-DHLA, we found that the QDs DHLA is stable in buffer with a pH from
6 to 8. When the pH values are 4, 5, 9, 10, the properties of QDs DHLA are changed by
showing slower movement speeds than those mixed with pH 6 to 8 buffers. One
potential reason might be the pH 4, 5, 9, 10 buffer changed the surface charges of QDs-
DHLA and thus they moved at different speeds. Another reason might be due to the
potential aggregation that happened between QDs in buffers with pH values of 4, 5, 9, 10,
their molecular weight increased following the aggregation. Figure 3.2 (a) and (b).
3.2 QD EDC protein A complexes
QDs were modified with EDC and protein A to build uniform complexes.

42
Figure 3.2 By adding protein A, the conjugates of antibodies and quantum dots are in uniform structures. (A) QD EDC antibody random conjugates; (B) QD EDC protein A antibody conjugates in uniform structures.
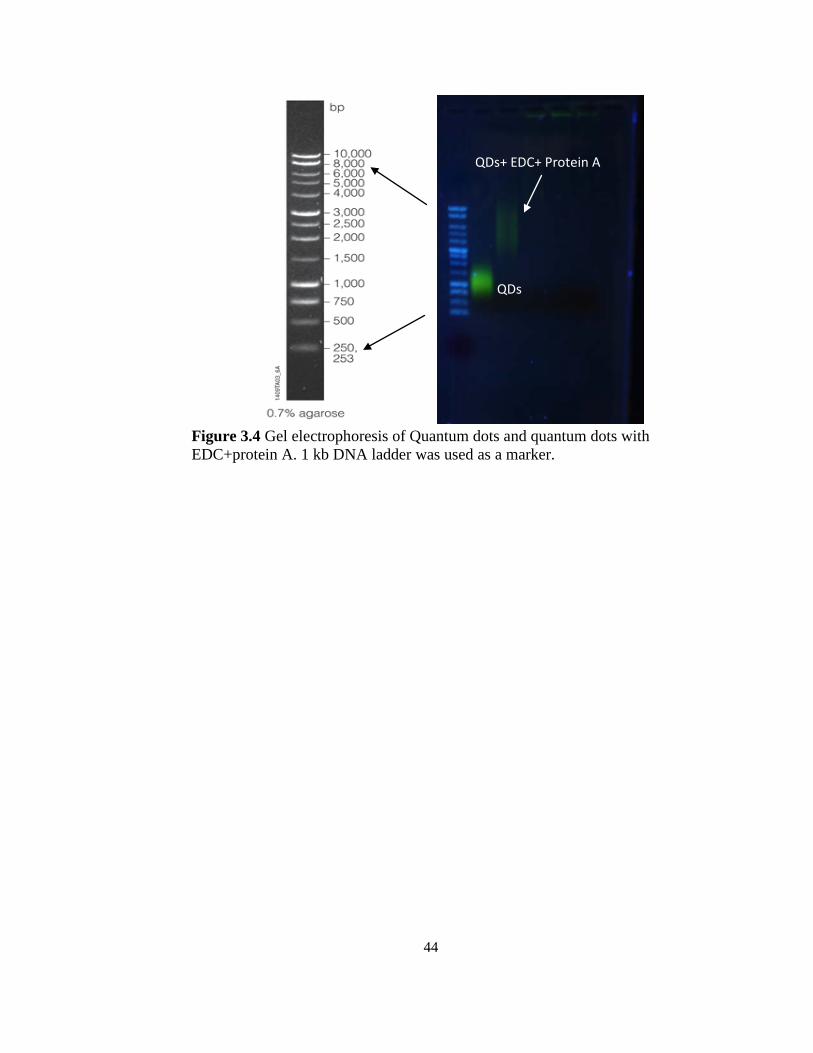
Gel electrophoresis was used to check the conjugation status between QDs EDC
and protein A. Agarose gel (0.5%) was used for electrophoresis. After running 50 min in
the gel under 100 V, QDs with EDC and protein A moved at different speeds due to
different molecular weights. As shown in Figure 3.3, adding protein A to the surfaces of
quantum dots intended quantum dots bigger molecular weight. The movement of
QD+EDC+protein A was slower in the gel.
To check the minimum amount of protein A needed for complete conjugation for
all EDC crosslinkers present on QDs surfaces, various amounts of protein A were added.
After a 2 h reaction, the conjugates were separated and checked on a 0.5% gel, as shown
in Figure 3.4. The concentration of protein A used was 0.5 mg/ml. The conjugation
process was done in PBS solution. Figure 3.4 shows that the v:v ratio of QDs and protein
A of 1:30 can ensure the complete binding of protein A to all potential EDC linkers.
Volume ratio less than 1:30 may have some unbounded EDC active linker left on the
surfaces of QDs, which may cause self-polymerization.

43
Figure 3.3 (a) gel electrophoresis picture of freshly mixed QDs DHLA in different buffers. From left to right, there are QDs DHLA in buffer 4, followed by pH 5 to pH 10. (b) gel electrophoresis picture of mixed QDs DHLA in buffers (2 days old). From left to right, there are molecular marker (1kb DNA ladder, Promega) and QDs DHLA in buffers (pH 4 to pH 10).
(a) (b)
pH 4 5 6 7 8 9 10 pH 4 5 6 7 8 9 10
44
Figure 3.4 Gel electrophoresis of Quantum dots and quantum dots with EDC+protein A. 1 kb DNA ladder was used as a marker.
QDs+ EDC+ Protein A
QDs + EDC QDs

45
Figure 3.5 Gel electrophoresis of Quantum dots and quantum dots with various EDC protein A crosslinker. (a) Lane 1, 1 kb DNA ladder (Promega); Lane 2, pure QDs with EDC linker; Lane 3, QDs with EDC and protein A (QDs:protein A= 1:3 (v:v)); Lane 4, QDs with EDC and protein A (QDs:protein A= 1:15 (v:v)); Lane 5, QDs with EDC and protein A (QDs:protein A= 1:30 (v:v)); Lane 6, QDs with EDC and protein A (QDs:protein A= 1:45 (v:v)); Lane 7, QDs with EDC and protein A (QDs:protein A= 1:60 (v:v)). (b) has the same arrangement as (a), except green QDs were used.
M 1 2 3 4 5 6 M 1 2 3 4 5 6
(a) (b)
46
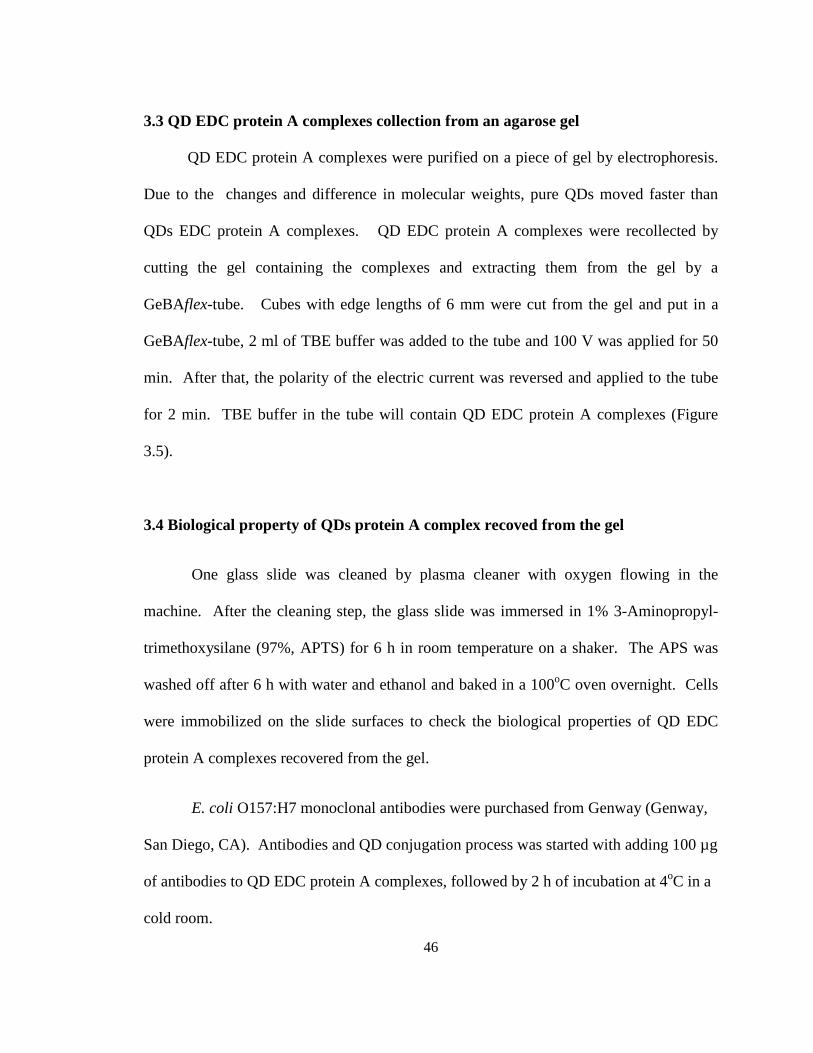
3.3 QD EDC protein A complexes collection from an agarose gel
QD EDC protein A complexes were purified on a piece of gel by electrophoresis.
Due to the changes and difference in molecular weights, pure QDs moved faster than
QDs EDC protein A complexes. QD EDC protein A complexes were recollected by
cutting the gel containing the complexes and extracting them from the gel by a
GeBAflex-tube. Cubes with edge lengths of 6 mm were cut from the gel and put in a
GeBAflex-tube, 2 ml of TBE buffer was added to the tube and 100 V was applied for 50
min. After that, the polarity of the electric current was reversed and applied to the tube
for 2 min. TBE buffer in the tube will contain QD EDC protein A complexes (Figure
3.5).
3.4 Biological property of QDs protein A complex recoved from the gel
One glass slide was cleaned by plasma cleaner with oxygen flowing in the
machine. After the cleaning step, the glass slide was immersed in 1% 3-Aminopropyl-
trimethoxysilane (97%, APTS) for 6 h in room temperature on a shaker. The APS was
washed off after 6 h with water and ethanol and baked in a 100oC oven overnight. Cells
were immobilized on the slide surfaces to check the biological properties of QD EDC
protein A complexes recovered from the gel.
E. coli O157:H7 monoclonal antibodies were purchased from Genway (Genway,
San Diego, CA). Antibodies and QD conjugation process was started with adding 100 µg
of antibodies to QD EDC protein A complexes, followed by 2 h of incubation at 4oC in a
cold room.

47
(i) (ii)

48
Ten microliters of QD protein A antibody conjugates were added to the circles on
a glass slide, which had E. coli O157:H7 cells labeled on top, and incubated in a cold
room for 2 h. Excess QD protein A antibody conjugates were washed off by PBS.
Fluorescence was detected by microscopy located in Molecular Cytology Core (MCC),
Life Science Building, University of Missouri. In Figure 3.6, it shows the principle of
testing biological properties of QDs, EDC and protein A recovered from gel
electrophoresis.
After washing off the excess QD antibody conjugates, the glass slide was checked
under microscopy. Figure 3.7 shows images from the microscopy. It proved that the QD
EDC protein A complexes recovered from the gel still kept their biological properties.
Protein A can bind to antibodies and the following QD antibody conjugates could be
successfully synthesized and used in cell detection.

49

50
51
CHAPTER 4
CONCLUSIONS
In this study, green QDs and orange QDs were synthesized using a Colloidal
method in Dr. Fan’s lab. The physical properties and concentrations of QDs were
analyzed and calculated. To investigate the application of QDs in biological studies, QDs
with different colors were modified to be water soluble by adding DHLA to their shell
structures. EDC crosslinkers were used to make QD EDC protein A complexes. These
QD EDC protein A complexes were used to make QD antibody conjugates. In order to
find out the proper amount of protein A needed for completely binding of all active EDC
active linkers, gel electrophoresis was used to check the molecular weight changes of the
complexes. GeBaflex tube is a tube that can be used to recollect DNA sequences from
the gel after electrophoresis. In this study, this tube was adopted to see if it can be used
for purification of QD EDC protein A complexes. After checking the biological activity
of QD EDC protein A complexes recovered from the gel by cell based microarray
method, the results showed that:
1. Gel electrophoresis can be used as a purification method to separate the
unbound QDs from the QD EDC protein A complexes.
2. The concentration of the QDs synthesized is approximately 120 nmol/L.
Volume ratio between QDs and protein A (0.5mg/ml) of 1:30 can realize
the complete binding of protein A to EDC linkers present on QDs.
3. GeBaflex tube can be used to extract QD EDC protein A complexes from
gel after electrophoresis and the QD EDC protein A complexes recovered

52
by GeBaflex tube kept their biological functions and can be used for
further studies.

53
REFERENCES
Alivisatos P. 2004. The use of nanocrystals in biological detection. Nat. biotech. 22: 47-52. Ballour B, Lagerholm BC, Ernst LA, Bruchez MP, Waggoner AS. 2004. Noninvasive imaging of quantum dots in mice. Bioconjug. Chem. 15(1): 79-86. Banin U, Millo O. 2004. Properties. Nanoparticles: from theory to application. Schmid G. (Editor). Wiley-VCH, Weinheim. Barany G, Merrifield RB. 1980. The peptides. Gross E, Meienhofer J. (Editors). Academic Press, New York. Chan WCW. 2007. Bio-application of nanoparticles. Series: Advances in experimental medicine and biology. V620. Chan WCW. (Editor). Springer, New York.
Chan WCW, Nie SM. 1998. Quantum dots bioconjugates for ultrasensitive nonisotopic detection. Science. 281(585): 2013-16.
Derfus AM, Chen WCW, Bhatia SN. 2004. Probing the cytotoxicity of semiconductor quantum dots. Nano lett. 4(1): 11-18. Diamandis EP, Christopoulos TK. 1991. The biotin-avidin system: principles and applications in biotechnology. Clin. Chem. 37(5): 625-36. Dubertret B, Skouride P, Norris DJ, Noreaux V, Brivanlou AH, Libchaer A. 2002. In vivo imaging of quantum dots encapsulated in phospholipid micelles. Science. 298(5599): 1759-62. Ekimov AI, Efros AL, and Onushchenko AA. 1985. Quantum size effect in semiconductor microcrystals. Sol. State. Comm. 56: 921-24. EychmÜller A. 2004. Syntheses and characterizations. Nanoparticles: from theory to application. Schmid G. (Editor). Wiley-VCH, Weinheim.
Fu A, Micheel CM, Cha J, Chang H, Yang H, Alivisatos AP. 2004. Discrete nanostructures of quantum dots/Au with DNA. J. Am. Chem. Soc. 126: 10832-33. Gao X, Dave SR. 2007. Quantum dots for cancer molecular imaging. Bio-application of nanoparticles. Series: Advances in experimental medicine and biology. V620. Chan WCW. (Editor). Springer, New York.

54
Gao XH, Gui YY, Levenson RM, Chung LW, Nie S. 2004. In vivo cancer targeting and imaging with semiconductor quantum dots. Nat. Biotechnol. 22(8): 969-76. Green M, Howman E. 2005. Semiconductor quantum dots and free radical induced DNA nicking. ChemComm. 1: 121-3. Green NM. 1975. Avidin. Adv. Protein Chem. 29: 85-133. Gross WG. 1994. Diseases due to Escherichia coli in poultry. In: Escherichia coli in domestic animals and humans. Gyles CL. (Editor). CAB international, Wallingford, UK. Hermanson GT. 1996. Bioconjugate techniques. Academic Press, New York. Hines MA, Guyot-Sionnest P. 1996. Synthesis and Characterization of Strongly Luminescing ZnS-Capped CdSe Nanocrystals. J. Phys. Chem. 100(2): 468-71. Huang D, Reshchikov MA, Morkoc H. 2002. Growth, structures and optical properties of III-nitride quantum dots. Int. J. High Speed Electron. Syst. 12(1): 79-110. Horne SM, Pfaff-McDonough SJ, Giddings CW, Nolan LK. 2000. Cloning and sequencing of the iss gene from a virulent avian Escherichia coli. Avian Dis. 44: 179-84. Ipe BI, Lehning M, Niemeyer CM. 2005. On the generation of free radical species from quantum dots. Small. 1(7): 706-9. Jaiswal JK, Mattoussi H, Mauro JM, Simon SM. 2003. Long-term multiple color imaging of live cells using quantum dot bioconjugates. Nat. biotechnol. 21(1): 47-51. Kapoor V, Hakim FT, Rehman N, Gress RE, Telford WG. 2009. Quantum dots thermal stability improves simultaneous phenotype-specific telomere length measurement by FISH-flow cytogmetry. J. Immunol. methods. Published online http://www.sciencedirect.com/science?_ob=ArticleURL&_udi=B6T2Y-4VS40FR-1&_user=3419478&_rdoc=1&_fmt=&_orig=search&_sort=d&view=c&_acct=C000049994&_version=1&_urlVersion=0&_userid=3419478&md5=39f0848142e8dcd06d931f8c1b66b790 Katz E, Shipway AN, Willner I. 2004. Biomaterial-Nanoparticle hybrid systems: Synthesis, properties and applications. Nanoparticles: from theory to application. Schmid G. (Editor). Wiley-VCH, Weinheim. Klimov VI, Mikhailovsky AA, McBranch DW, Leatherdale CA, Bawendi MG. 2000a. Quantization of multiparticle Auger rates in semiconductor quantum dots. Science. 287: 1011-3.

55
Klimov VI, Mikhailovsky AA, Xu S, Malko A, Hollingsworth JA, Leatherdale CA, Eisler H, Bawendi MG. 2000b. Optical gain and stimulated emission in nanocrystal quantum dots. Science. 290: 314-7. Larson DR, Zipfel WR, Williams R, Clark SW, Bruchez MP, Wise FW, Webb WW. 2003. Water soluble quantum dots for multiphoton fluorescence imaging in vivo. Science. 2(1): 50-64. Lee JS. 2002. Growth of self-organized quantum dots. Simiconductor quantum dots: physics, spectroscopy, and applications. Masumoto Y., Takagahara T. (Editors). Springer, New York. Lidke DS, Lidke KA, Rieger B, Jovin TM, Arndt-Jovin DJ. 2005. Reaching out for signals: filopodia sense EGF and respond by directed retrograde transport of activated receptors. J. cell Biol. 170(4): 882-5. Liu Y, Li, Y. 2006. Simultaneous detection of E. coli O157:H7 and Salmonella Typhimurium using quantum dots as fluorescence labels. Analyst. 131(3): 394-401. Lovric J, Cho SJ, Winnik FM, Maysinger D. 2005. Unmodified cadmium telluride quantum dots induce reactive oxygen species formation leading to multiple organelle damage and cell death. Chem. Biol. 12(11): 1227-34. Matsumoto T, Maenosono S, Yamaguchi Y. 2004. Organometallic synthesis of InP quantum dots using Tris (dimethylamino) phosphine as a phosphorus source. Chem. Lett. 33(11): 1492-3. Maysinger D, Lovrić, J. 2007. Quantum dots and other fluorescent nanoparticles: Quo Vadis in the cell? Bio-application of nanoparticles. Series: Advances in experimental medicine and biology. V620. Chan WCW. (Editor). Springer, New York. Mikhailovsky AA, Malko AV, Hoollingsworth JA, Bawendi MG, Klimov VI. 2002. Multiparticle interactions and stimulated emission in chemically synthesized quantum dots. Appl. Phys. Lett. 80: 2380-2. Molecular beam epitaxy. 2005. Accessed on July 14, 2008, from Wikipedia: the Free Encyclopedia Web site: http://en.wikipedia.org/wiki/Molecular_beam_epitaxy. Murray CB, Norris DJ, Bawendi MG. 1993. Synthesis and Characterization of Nearly Monodisperse CdE (E = S, Se, Te) Semiconductor Nanocrystallites. J. Amer. Chem. Soc. 115: 8706–15. Murray CB, Sun S, Gaschler W, Doyle H, Betley TA, Kagan CR. 2001. Colloidal synthesis of nanocrystals and nanocrystal superlattices. IBM J. Res. & Dev. 45(1): 47-56.

56
Parak WJ, Manna L, Simmel FC, Gerion D, Alivisatos P. 2004. Quantum dots. Bio-application of nanoparticles. Series: Advances in experimental medicine and biology. V620. Chan WCW. (Editor). Springer, New York. Parak WJ, Boudreau R, Le Gros M, Gerion D, Zanchet D, Micheel CM, Williams SC, Alivisatos AP, Larabell C. 2002. Cell motility and betastatic potential studies based on quantum dot imaging of phagokinetic tracks. Adv. Mater. 14(12): 882-5. Parungo CP, Ohnishi S, Kim SW, Laurence RG, Soltesz EG, Chen FY, Colson YL, Cohn LH, Bawendi MG, Frangioni JV. 2005. Intraoperative identification of expphageal sentinel lymph nodes with near-infrared fluorescence imaging. J. Thorac. Cardiovasc. Surg. 129 (4): 844-50. Pellegrino T, Parak W, Boudreau R, Le Gros MA, Gerion D, Alivisatos AP, Larabell CA. 2003. Quantum dot based cell motility assay. Differentiation. 71(9-10): 542-8. Rocksby HP. 1932. J. Soc. Glass Tech. 16, 171. Samia AC, Chen X, Burda C. 2003. Semiconductor quantum dots for photodynamic therapy. J. Am. Chem. Soc. 125(51): 15736-7. Sheehan JC, Hess GP. 1955. A new method of forming peptide bonds. J. Am. Chem. Soc. 77: 1067-8. Sojka WJ, Carnaghan RBA. 1961. Escherichia coli infection in poultry. Res. Vet. Sci. 2: 340-52. Stroh M, Zimmer JP, Duda DG, Levchenko TS, Cohen KS, Brown EB, Scadden DT, Torchilin VP, Bawendi MG, Fukumura D, Jain RK. 2005. Quantum dots spectrally distinguish multiple species within the tumor milieu in vivo. Nat. Med. 11(6): 678-82. Trindade T, O’Brian P, Pickett NL. 2001. Nanocrystalline Semiconductors: Synthesis, Properties, and Perspectives. Mater. Chem. 13: 3843-58. Voura E, Jaiswal J, Mattoussi H, Simon SM. 2004. Tracking metastatic tumor cell extravasation with quantum dot nanocrystals and fluorescence emission-scanning microscopy. Nat. Med. 10(9): 993-8. Wikipedia.com. 2008. Accessed on July 29, 2008. From Free encyclopedia Web site: http://en.wikipedia.org/wiki/Quantum_dot . Woll AR, Rugheimer P, Lagally MG. 2002. Self-organized quantum dots. Int. J. High Speed Electron. Syst. 12(1): 45-78.
57
Wu XY, Liu HJ, Liu JQ, Haley KN, Treadway JA, Larson JP, Ge N, Peale F, Bruchez MP. 2003. Immunofluorescent labeling of cancer marker Her2 and other cellular targets with semiconductor quantum dots. Nat. Biotechnol. 21(1): 41-6. Yu W, Qu L, Guo W, Peng X. 2003. Experimental Determination of Extinction Coefficient of CdTe, CdSe, and CdS Nanocrystals. Chem. Mater. 15 (14): 2854-60. Zhao W, Wang L, Tan W. 2007. Fluorescent nanoparticle for bacteria and DNA detection. Bio-application of nanoparticles. Series: Advances in experimental medicine and biology. V620. Chan WCW. (Editor). Springer, New York. Zhao X, Hilliard LR, Mechery SJ, Wang Y, Bagwe RP, Jin S, Tan W. 2004. A rapid bioassay for single bacterial cell quantitation using bioconjugated nanoparticles. Proc. Natl. Acad. Sci. USA. 101: 15, 027-32. Zhou X, Zhou J. 2004. Improving the signal sensitivity and photostability of DNA hybridization on microarrays by using dye-doped core shell silica nanoparticles. Amal Chem. 18: 5302-12.