Embed Size (px)
Citation preview
page 1
Making Geologic Maps
with
TNTmips®
GEOLOGIC
MAPS
MakingGeologic Maps
MakingGeologic Maps
N
Applications
page 2
Making Geologic Maps
Before Getting Started
You can print or read this booklet in color from MicroImages’ Web site. TheWeb site is also your source for the newest Getting Started booklets on othertopics. You can download an installation guide, sample data, and the latestversion of TNTmips.
http://www.microimages.com
TNTmips provides a variety of tools for working with geologic data and makinggeologic maps that can be printed or distributed as an electronic atlas. Thisbooklet is intended as a general guide to making geologic maps in TNTmips.Using a sample geologic map layout, it discusses how the different data layerswere prepared and assembled, and illustrates the type of results you can achievewith your own data using TNTmips.
Prerequisite Skills This booklet assumes that you have completed the exercisesin the tutorial booklets Displaying Geospatial Data and TNT Product Concepts.Those exercises introduce essential skills and basic techniques that are not cov-ered again here. Please consult those booklets for any review you need.
Sample Data The data used to prepare the map shown in this booklet are distrib-uted as sample data with the TNT products. Although this booklet does notinclude exercises with step-by-step instructions on how to use this data, you maywish to view the different data layers and experiment with them before you beginworking with your own geologic map data. In particular, this booklet refers tosample files in the GEOLMAP data collection.
More Documentation This booklet is intended only as an overview of usefulstrategies for preparing and assembling geospatial data layers to make geologicmaps. As different tasks and procedures are discussed in the text, references areprovided to appropriate tutorial booklets that provide exercises introducing thetools for performing those tasks in TNTmips.
TNTmips® Pro and TNTmips Free TNTmips (the Map and Image ProcessingSystem) comes in three versions: the professional version of TNTmips (TNTmipsPro), the low-cost TNTmips Basic version, and the TNTmips Free version. Allversions run exactly the same code from the TNT products DVD and have nearlythe same features. If you did not purchase the professional version (which re-quires a software license key) or TNTmips Basic, then TNTmips operates inTNTmips Free mode.
All of the objects in the sample MIDMAP Project File are useable in TNTmips Free.
Randall B. Smith, Ph.D., 4 January 2012©MicroImages, Inc., 2002-2012
page 3
Making Geologic Maps
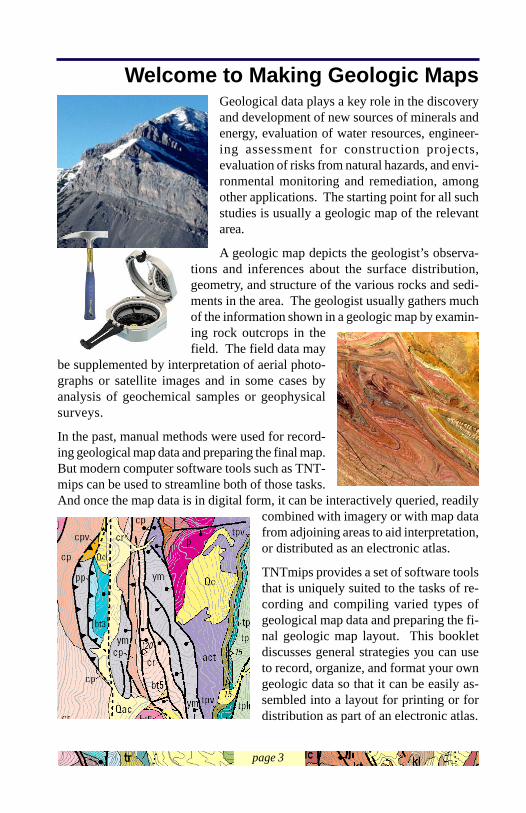
Welcome to Making Geologic MapsGeological data plays a key role in the discoveryand development of new sources of minerals andenergy, evaluation of water resources, engineer-ing assessment for construction projects,evaluation of risks from natural hazards, and envi-ronmental monitoring and remediation, amongother applications. The starting point for all suchstudies is usually a geologic map of the relevantarea.
A geologic map depicts the geologist’s observa-tions and inferences about the surface distribution,geometry, and structure of the various rocks and sedi-ments in the area. The geologist usually gathers muchof the information shown in a geologic map by examin-ing rock outcrops in thefield. The field data may
be supplemented by interpretation of aerial photo-graphs or satellite images and in some cases byanalysis of geochemical samples or geophysicalsurveys.
In the past, manual methods were used for record-ing geological map data and preparing the final map.But modern computer software tools such as TNT-mips can be used to streamline both of those tasks.And once the map data is in digital form, it can be interactively queried, readily
combined with imagery or with map datafrom adjoining areas to aid interpretation,or distributed as an electronic atlas.
TNTmips provides a set of software toolsthat is uniquely suited to the tasks of re-cording and compiling varied types ofgeological map data and preparing the fi-nal geologic map layout. This bookletdiscusses general strategies you can useto record, organize, and format your owngeologic data so that it can be easily as-sembled into a layout for printing or fordistribution as part of an electronic atlas.
page 4
Making Geologic Maps
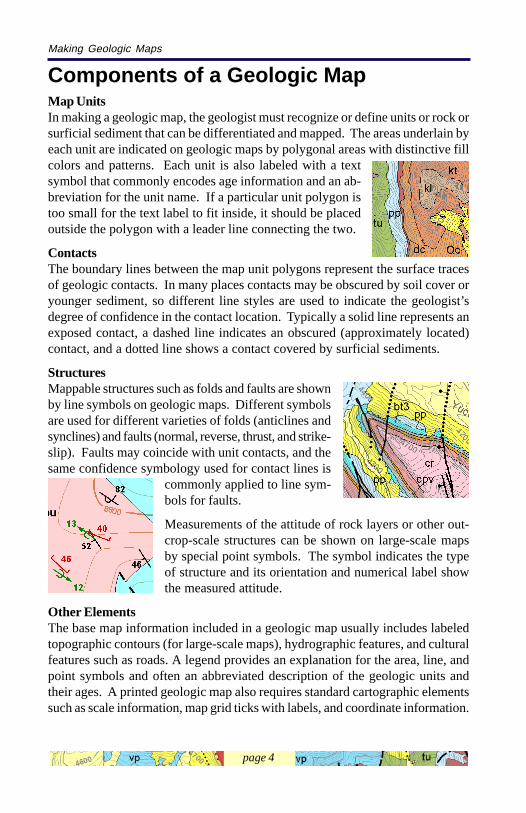
Map UnitsIn making a geologic map, the geologist must recognize or define units or rock orsurficial sediment that can be differentiated and mapped. The areas underlain byeach unit are indicated on geologic maps by polygonal areas with distinctive fillcolors and patterns. Each unit is also labeled with a textsymbol that commonly encodes age information and an ab-breviation for the unit name. If a particular unit polygon istoo small for the text label to fit inside, it should be placedoutside the polygon with a leader line connecting the two.
ContactsThe boundary lines between the map unit polygons represent the surface tracesof geologic contacts. In many places contacts may be obscured by soil cover oryounger sediment, so different line styles are used to indicate the geologist’sdegree of confidence in the contact location. Typically a solid line represents anexposed contact, a dashed line indicates an obscured (approximately located)contact, and a dotted line shows a contact covered by surficial sediments.
StructuresMappable structures such as folds and faults are shownby line symbols on geologic maps. Different symbolsare used for different varieties of folds (anticlines andsynclines) and faults (normal, reverse, thrust, and strike-slip). Faults may coincide with unit contacts, and thesame confidence symbology used for contact lines is
commonly applied to line sym-bols for faults.
Measurements of the attitude of rock layers or other out-crop-scale structures can be shown on large-scale mapsby special point symbols. The symbol indicates the typeof structure and its orientation and numerical label showthe measured attitude.
Other ElementsThe base map information included in a geologic map usually includes labeledtopographic contours (for large-scale maps), hydrographic features, and culturalfeatures such as roads. A legend provides an explanation for the area, line, andpoint symbols and often an abbreviated description of the geologic units andtheir ages. A printed geologic map also requires standard cartographic elementssuch as scale information, map grid ticks with labels, and coordinate information.
Components of a Geologic Map
page 5
Making Geologic Maps
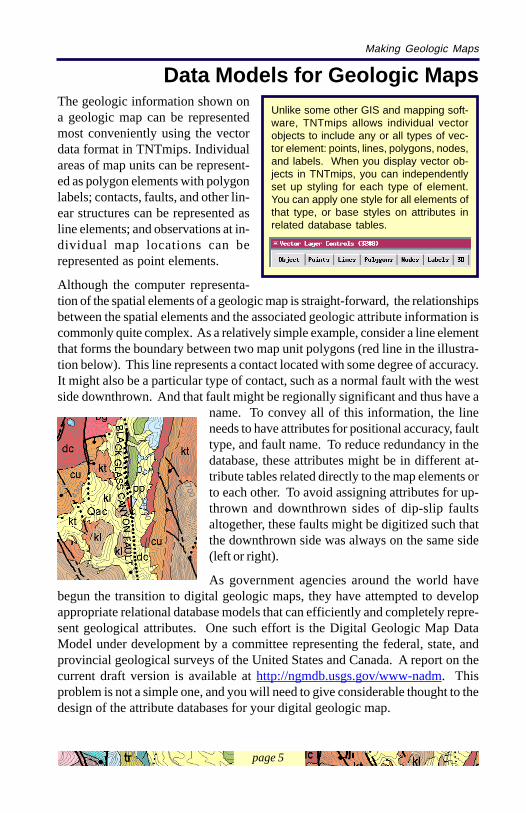
Data Models for Geologic MapsThe geologic information shown ona geologic map can be representedmost conveniently using the vectordata format in TNTmips. Individualareas of map units can be represent-ed as polygon elements with polygonlabels; contacts, faults, and other lin-ear structures can be represented asline elements; and observations at in-dividual map locations can berepresented as point elements.
Although the computer representa-tion of the spatial elements of a geologic map is straight-forward, the relationshipsbetween the spatial elements and the associated geologic attribute information iscommonly quite complex. As a relatively simple example, consider a line elementthat forms the boundary between two map unit polygons (red line in the illustra-tion below). This line represents a contact located with some degree of accuracy.It might also be a particular type of contact, such as a normal fault with the westside downthrown. And that fault might be regionally significant and thus have a
name. To convey all of this information, the lineneeds to have attributes for positional accuracy, faulttype, and fault name. To reduce redundancy in thedatabase, these attributes might be in different at-tribute tables related directly to the map elements orto each other. To avoid assigning attributes for up-thrown and downthrown sides of dip-slip faultsaltogether, these faults might be digitized such thatthe downthrown side was always on the same side(left or right).
As government agencies around the world havebegun the transition to digital geologic maps, they have attempted to developappropriate relational database models that can efficiently and completely repre-sent geological attributes. One such effort is the Digital Geologic Map DataModel under development by a committee representing the federal, state, andprovincial geological surveys of the United States and Canada. A report on thecurrent draft version is available at http://ngmdb.usgs.gov/www-nadm. Thisproblem is not a simple one, and you will need to give considerable thought to thedesign of the attribute databases for your digital geologic map.
Unlike some other GIS and mapping soft-ware, TNTmips allows individual vectorobjects to include any or all types of vec-tor element: points, lines, polygons, nodes,and labels. When you display vector ob-jects in TNTmips, you can independentlyset up styling for each type of element.You can apply one style for all elements ofthat type, or base styles on attributes inrelated database tables.
page 6
Making Geologic Maps
Digitizing Your Field Map
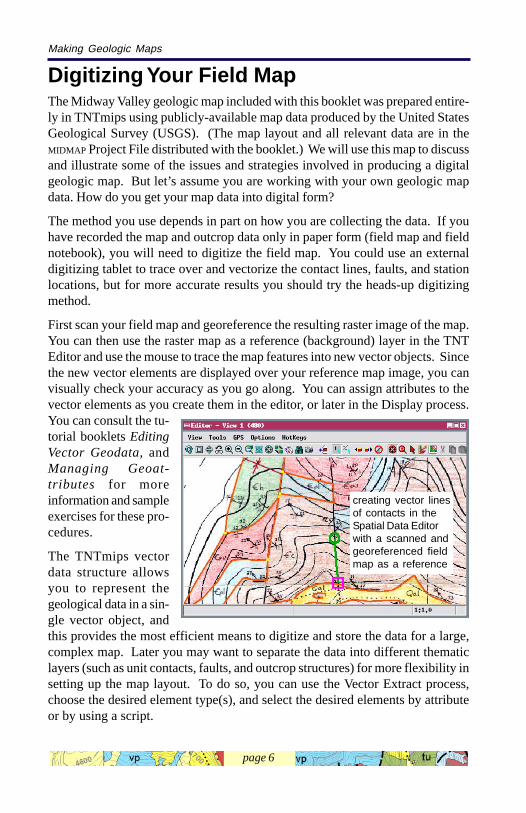
creating vector linesof contacts in theSpatial Data Editorwith a scanned andgeoreferenced fieldmap as a reference
The Midway Valley geologic map included with this booklet was prepared entire-ly in TNTmips using publicly-available map data produced by the United StatesGeological Survey (USGS). (The map layout and all relevant data are in theMIDMAP Project File distributed with the booklet.) We will use this map to discussand illustrate some of the issues and strategies involved in producing a digitalgeologic map. But let’s assume you are working with your own geologic mapdata. How do you get your map data into digital form?
The method you use depends in part on how you are collecting the data. If youhave recorded the map and outcrop data only in paper form (field map and fieldnotebook), you will need to digitize the field map. You could use an externaldigitizing tablet to trace over and vectorize the contact lines, faults, and stationlocations, but for more accurate results you should try the heads-up digitizingmethod.
First scan your field map and georeference the resulting raster image of the map.You can then use the raster map as a reference (background) layer in the TNTEditor and use the mouse to trace the map features into new vector objects. Sincethe new vector elements are displayed over your reference map image, you canvisually check your accuracy as you go along. You can assign attributes to thevector elements as you create them in the editor, or later in the Display process.You can consult the tu-torial booklets EditingVector Geodata, andManaging Geoat-tributes for moreinformation and sampleexercises for these pro-cedures.
The TNTmips vectordata structure allowsyou to represent thegeological data in a sin-gle vector object, andthis provides the most efficient means to digitize and store the data for a large,complex map. Later you may want to separate the data into different thematiclayers (such as unit contacts, faults, and outcrop structures) for more flexibility insetting up the map layout. To do so, you can use the Vector Extract process,choose the desired element type(s), and select the desired elements by attributeor by using a script.
page 7
Making Geologic Maps
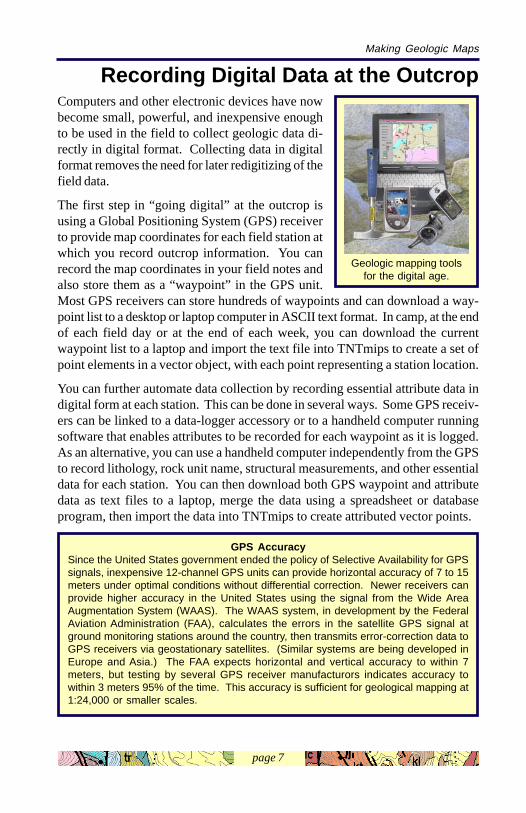
Recording Digital Data at the OutcropComputers and other electronic devices have nowbecome small, powerful, and inexpensive enoughto be used in the field to collect geologic data di-rectly in digital format. Collecting data in digitalformat removes the need for later redigitizing of thefield data.
The first step in “going digital” at the outcrop isusing a Global Positioning System (GPS) receiverto provide map coordinates for each field station atwhich you record outcrop information. You canrecord the map coordinates in your field notes andalso store them as a “waypoint” in the GPS unit.Most GPS receivers can store hundreds of waypoints and can download a way-point list to a desktop or laptop computer in ASCII text format. In camp, at the endof each field day or at the end of each week, you can download the currentwaypoint list to a laptop and import the text file into TNTmips to create a set ofpoint elements in a vector object, with each point representing a station location.
You can further automate data collection by recording essential attribute data indigital form at each station. This can be done in several ways. Some GPS receiv-ers can be linked to a data-logger accessory or to a handheld computer runningsoftware that enables attributes to be recorded for each waypoint as it is logged.As an alternative, you can use a handheld computer independently from the GPSto record lithology, rock unit name, structural measurements, and other essentialdata for each station. You can then download both GPS waypoint and attributedata as text files to a laptop, merge the data using a spreadsheet or databaseprogram, then import the data into TNTmips to create attributed vector points.
GPS AccuracySince the United States government ended the policy of Selective Availability for GPSsignals, inexpensive 12-channel GPS units can provide horizontal accuracy of 7 to 15meters under optimal conditions without differential correction. Newer receivers canprovide higher accuracy in the United States using the signal from the Wide AreaAugmentation System (WAAS). The WAAS system, in development by the FederalAviation Administration (FAA), calculates the errors in the satellite GPS signal atground monitoring stations around the country, then transmits error-correction data toGPS receivers via geostationary satellites. (Similar systems are being developed inEurope and Asia.) The FAA expects horizontal and vertical accuracy to within 7meters, but testing by several GPS receiver manufacturors indicates accuracy towithin 3 meters 95% of the time. This accuracy is sufficient for geological mapping at1:24,000 or smaller scales.
Geologic mapping toolsfor the digital age.
page 8
Making Geologic Maps
Making Your Digital Map in the FieldYou may also want to try creating your digital geo-logic map in the field using TNTmips running on aruggedized laptop computer. View windows in TNT-mips can read positions from a GPS receiver and placea location symbol in the view. (You can connect ahandheld GPS receiver to the laptop via a serial cableor use a GPS PCMCIA card.) You can use this GPSinput when you add elements to vector objects with the Editor, such as points toa vector with station locations and lines to a vector with contact lines. (TheEditor lets you have several objects open for editing at the same time.) As youwalk along a contact, the Editor can track the changing GPS position and add linevertices automatically, or you can add a new position only when you choose.More information on using GPS with TNTmips is available in the tutorial bookletOperating with a GPS Unit.
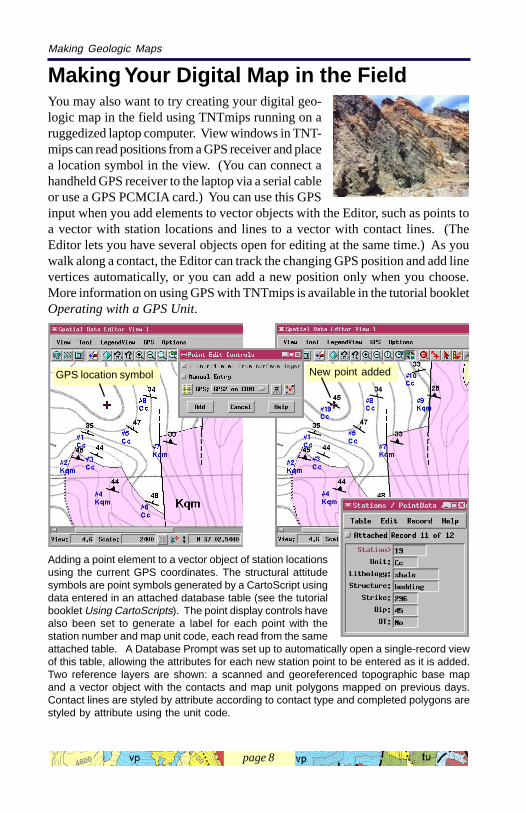
Adding a point element to a vector object of station locationsusing the current GPS coordinates. The structural attitudesymbols are point symbols generated by a CartoScript usingdata entered in an attached database table (see the tutorialbooklet Using CartoScripts). The point display controls havealso been set to generate a label for each point with thestation number and map unit code, each read from the sameattached table. A Database Prompt was set up to automatically open a single-record viewof this table, allowing the attributes for each new station point to be entered as it is added.Two reference layers are shown: a scanned and georeferenced topographic base mapand a vector object with the contacts and map unit polygons mapped on previous days.Contact lines are styled by attribute according to contact type and completed polygons arestyled by attribute using the unit code.
GPS location symbol New point added
page 9
Making Geologic Maps
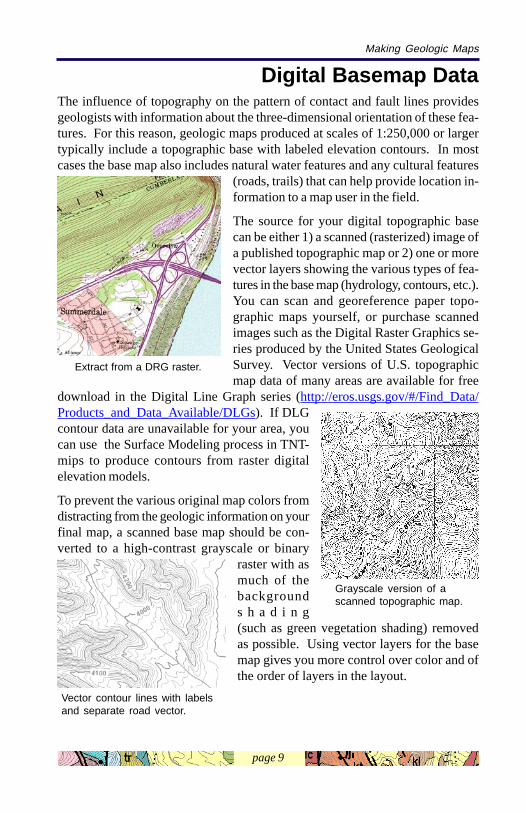
Digital Basemap DataThe influence of topography on the pattern of contact and fault lines providesgeologists with information about the three-dimensional orientation of these fea-tures. For this reason, geologic maps produced at scales of 1:250,000 or largertypically include a topographic base with labeled elevation contours. In mostcases the base map also includes natural water features and any cultural features
(roads, trails) that can help provide location in-formation to a map user in the field.
The source for your digital topographic basecan be either 1) a scanned (rasterized) image ofa published topographic map or 2) one or morevector layers showing the various types of fea-tures in the base map (hydrology, contours, etc.).You can scan and georeference paper topo-graphic maps yourself, or purchase scannedimages such as the Digital Raster Graphics se-ries produced by the United States GeologicalSurvey. Vector versions of U.S. topographicmap data of many areas are available for free
download in the Digital Line Graph series (http://eros.usgs.gov/#/Find_Data/Products_and_Data_Available/DLGs). If DLGcontour data are unavailable for your area, youcan use the Surface Modeling process in TNT-mips to produce contours from raster digitalelevation models.
To prevent the various original map colors fromdistracting from the geologic information on yourfinal map, a scanned base map should be con-verted to a high-contrast grayscale or binary
raster with asmuch of thebackgrounds h a d i n g(such as green vegetation shading) removedas possible. Using vector layers for the basemap gives you more control over color and ofthe order of layers in the layout.
Extract from a DRG raster.
Vector contour lines with labelsand separate road vector.
Grayscale version of ascanned topographic map.
page 10
Making Geologic Maps
Map Layers in the Midway Geologic Map
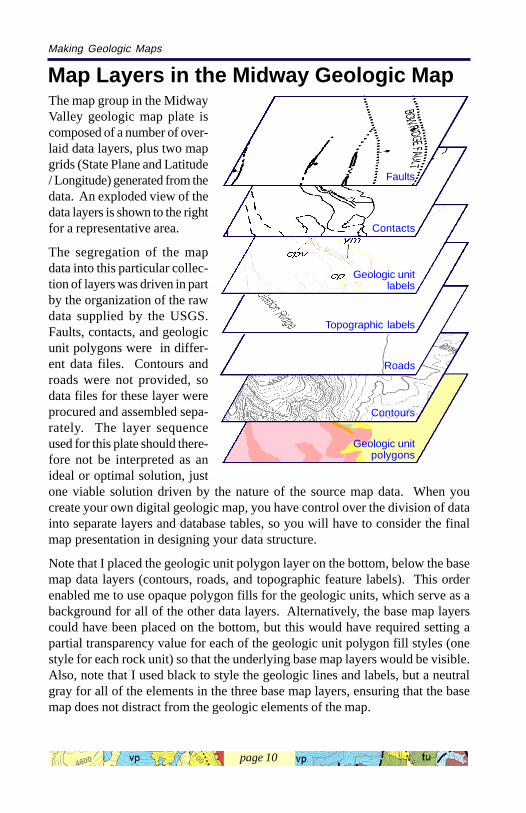
Geologic unitpolygons
Contours
Roads
Topographic labels
Geologic unitlabels
Contacts
Faults
The map group in the MidwayValley geologic map plate iscomposed of a number of over-laid data layers, plus two mapgrids (State Plane and Latitude/ Longitude) generated from thedata. An exploded view of thedata layers is shown to the rightfor a representative area.
The segregation of the mapdata into this particular collec-tion of layers was driven in partby the organization of the rawdata supplied by the USGS.Faults, contacts, and geologicunit polygons were in differ-ent data files. Contours androads were not provided, sodata files for these layer wereprocured and assembled sepa-rately. The layer sequenceused for this plate should there-fore not be interpreted as anideal or optimal solution, justone viable solution driven by the nature of the source map data. When youcreate your own digital geologic map, you have control over the division of datainto separate layers and database tables, so you will have to consider the finalmap presentation in designing your data structure.
Note that I placed the geologic unit polygon layer on the bottom, below the basemap data layers (contours, roads, and topographic feature labels). This orderenabled me to use opaque polygon fills for the geologic units, which serve as abackground for all of the other data layers. Alternatively, the base map layerscould have been placed on the bottom, but this would have required setting apartial transparency value for each of the geologic unit polygon fill styles (onestyle for each rock unit) so that the underlying base map layers would be visible.Also, note that I used black to style the geologic lines and labels, but a neutralgray for all of the elements in the three base map layers, ensuring that the basemap does not distract from the geologic elements of the map.
page 11
Making Geologic Maps
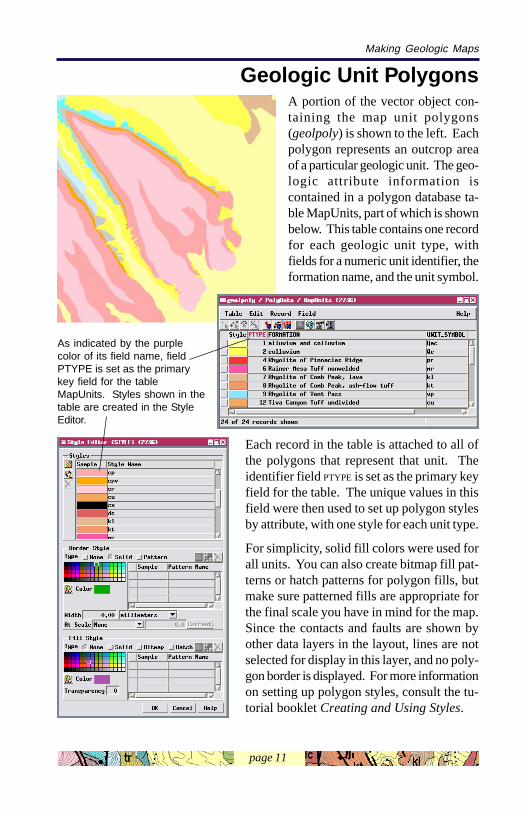
Geologic Unit PolygonsA portion of the vector object con-taining the map unit polygons(geolpoly) is shown to the left. Eachpolygon represents an outcrop areaof a particular geologic unit. The geo-logic attribute information iscontained in a polygon database ta-ble MapUnits, part of which is shownbelow. This table contains one recordfor each geologic unit type, withfields for a numeric unit identifier, theformation name, and the unit symbol.
Each record in the table is attached to all ofthe polygons that represent that unit. Theidentifier field PTYPE is set as the primary keyfield for the table. The unique values in thisfield were then used to set up polygon stylesby attribute, with one style for each unit type.
For simplicity, solid fill colors were used forall units. You can also create bitmap fill pat-terns or hatch patterns for polygon fills, butmake sure patterned fills are appropriate forthe final scale you have in mind for the map.Since the contacts and faults are shown byother data layers in the layout, lines are notselected for display in this layer, and no poly-gon border is displayed. For more informationon setting up polygon styles, consult the tu-torial booklet Creating and Using Styles.
As indicated by the purplecolor of its field name, fieldPTYPE is set as the primarykey field for the tableMapUnits. Styles shown in thetable are created in the StyleEditor.
page 12
Making Geologic Maps
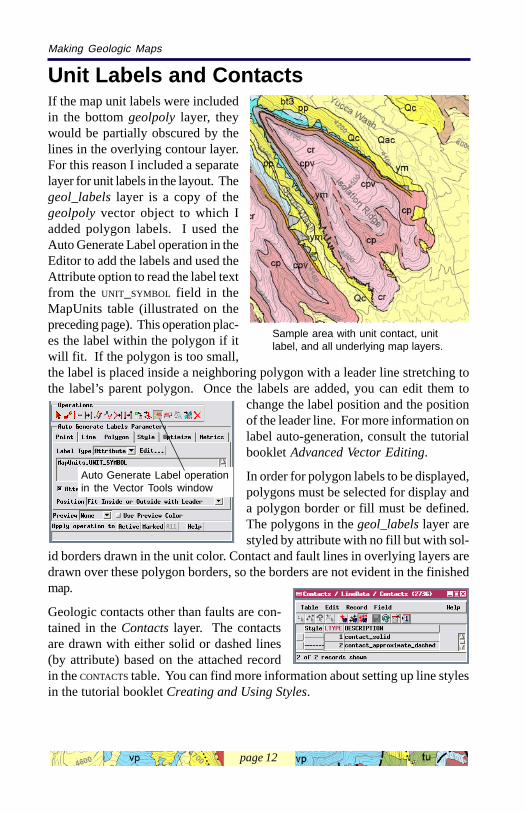
Unit Labels and ContactsIf the map unit labels were includedin the bottom geolpoly layer, theywould be partially obscured by thelines in the overlying contour layer.For this reason I included a separatelayer for unit labels in the layout. Thegeol_labels layer is a copy of thegeolpoly vector object to which Iadded polygon labels. I used theAuto Generate Label operation in theEditor to add the labels and used theAttribute option to read the label textfrom the UNIT_SYMBOL field in theMapUnits table (illustrated on thepreceding page). This operation plac-es the label within the polygon if itwill fit. If the polygon is too small,the label is placed inside a neighboring polygon with a leader line stretching tothe label’s parent polygon. Once the labels are added, you can edit them to
change the label position and the positionof the leader line. For more information onlabel auto-generation, consult the tutorialbooklet Advanced Vector Editing.
In order for polygon labels to be displayed,polygons must be selected for display anda polygon border or fill must be defined.The polygons in the geol_labels layer arestyled by attribute with no fill but with sol-
id borders drawn in the unit color. Contact and fault lines in overlying layers aredrawn over these polygon borders, so the borders are not evident in the finishedmap.
Geologic contacts other than faults are con-tained in the Contacts layer. The contactsare drawn with either solid or dashed lines(by attribute) based on the attached recordin the CONTACTS table. You can find more information about setting up line stylesin the tutorial booklet Creating and Using Styles.
Auto Generate Label operationin the Vector Tools window
Sample area with unit contact, unitlabel, and all underlying map layers.
page 13
Making Geologic Maps
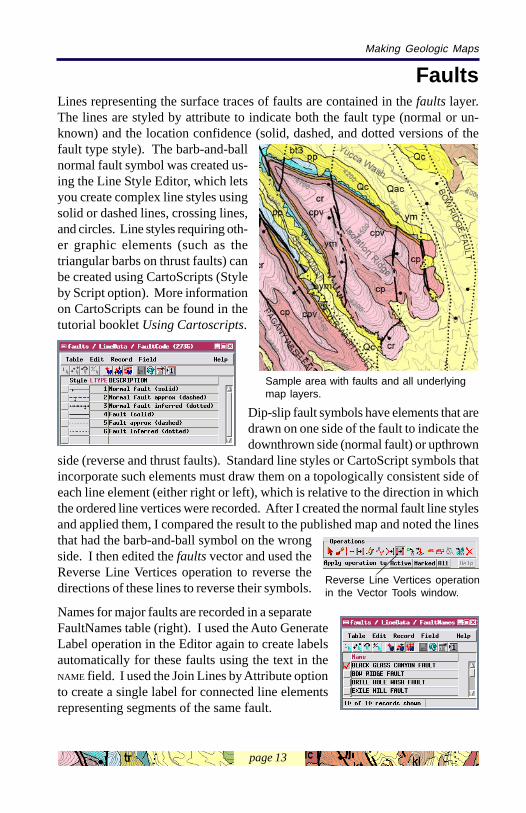
FaultsLines representing the surface traces of faults are contained in the faults layer.The lines are styled by attribute to indicate both the fault type (normal or un-known) and the location confidence (solid, dashed, and dotted versions of thefault type style). The barb-and-ballnormal fault symbol was created us-ing the Line Style Editor, which letsyou create complex line styles usingsolid or dashed lines, crossing lines,and circles. Line styles requiring oth-er graphic elements (such as thetriangular barbs on thrust faults) canbe created using CartoScripts (Styleby Script option). More informationon CartoScripts can be found in thetutorial booklet Using Cartoscripts.
Dip-slip fault symbols have elements that aredrawn on one side of the fault to indicate thedownthrown side (normal fault) or upthrown
side (reverse and thrust faults). Standard line styles or CartoScript symbols thatincorporate such elements must draw them on a topologically consistent side ofeach line element (either right or left), which is relative to the direction in whichthe ordered line vertices were recorded. After I created the normal fault line stylesand applied them, I compared the result to the published map and noted the linesthat had the barb-and-ball symbol on the wrongside. I then edited the faults vector and used theReverse Line Vertices operation to reverse thedirections of these lines to reverse their symbols.
Names for major faults are recorded in a separateFaultNames table (right). I used the Auto GenerateLabel operation in the Editor again to create labelsautomatically for these faults using the text in theNAME field. I used the Join Lines by Attribute optionto create a single label for connected line elementsrepresenting segments of the same fault.
Sample area with faults and all underlyingmap layers.
Reverse Line Vertices operationin the Vector Tools window.
page 14
Making Geologic Maps
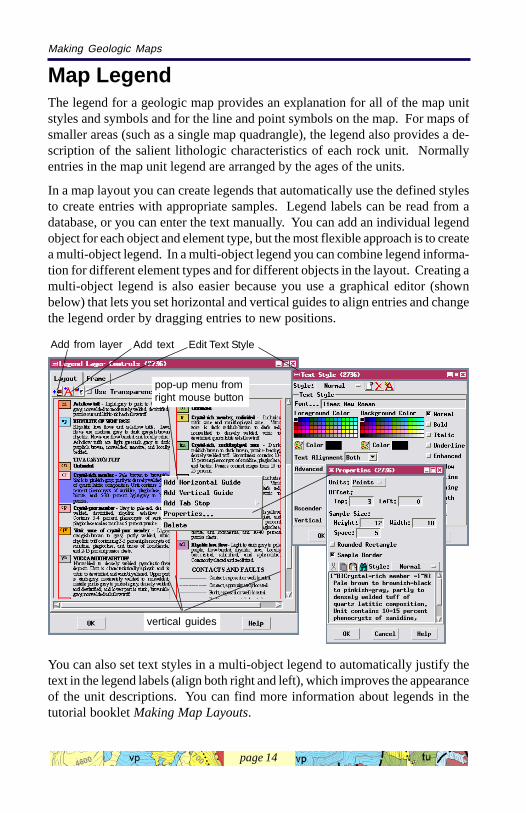
Map LegendThe legend for a geologic map provides an explanation for all of the map unitstyles and symbols and for the line and point symbols on the map. For maps ofsmaller areas (such as a single map quadrangle), the legend also provides a de-scription of the salient lithologic characteristics of each rock unit. Normallyentries in the map unit legend are arranged by the ages of the units.
In a map layout you can create legends that automatically use the defined stylesto create entries with appropriate samples. Legend labels can be read from adatabase, or you can enter the text manually. You can add an individual legendobject for each object and element type, but the most flexible approach is to createa multi-object legend. In a multi-object legend you can combine legend informa-tion for different element types and for different objects in the layout. Creating amulti-object legend is also easier because you use a graphical editor (shownbelow) that lets you set horizontal and vertical guides to align entries and changethe legend order by dragging entries to new positions.
Edit Text Style
pop-up menu fromright mouse button
You can also set text styles in a multi-object legend to automatically justify thetext in the legend labels (align both right and left), which improves the appearanceof the unit descriptions. You can find more information about legends in thetutorial booklet Making Map Layouts.
vertical guides
Add from layer Add text
page 15
Making Geologic Maps
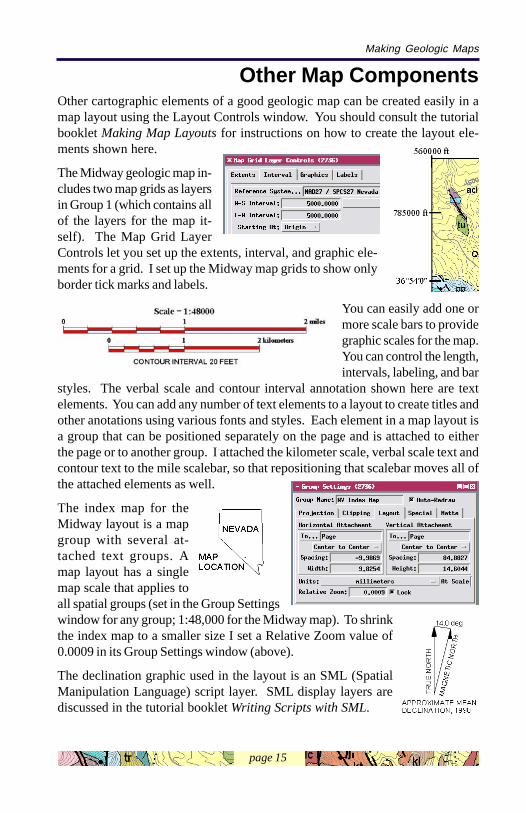
Other Map ComponentsOther cartographic elements of a good geologic map can be created easily in amap layout using the Layout Controls window. You should consult the tutorialbooklet Making Map Layouts for instructions on how to create the layout ele-ments shown here.
The Midway geologic map in-cludes two map grids as layersin Group 1 (which contains allof the layers for the map it-self). The Map Grid LayerControls let you set up the extents, interval, and graphic ele-ments for a grid. I set up the Midway map grids to show onlyborder tick marks and labels.
You can easily add one ormore scale bars to providegraphic scales for the map.You can control the length,intervals, labeling, and bar
styles. The verbal scale and contour interval annotation shown here are textelements. You can add any number of text elements to a layout to create titles andother anotations using various fonts and styles. Each element in a map layout isa group that can be positioned separately on the page and is attached to eitherthe page or to another group. I attached the kilometer scale, verbal scale text andcontour text to the mile scalebar, so that repositioning that scalebar moves all ofthe attached elements as well.
The index map for theMidway layout is a mapgroup with several at-tached text groups. Amap layout has a singlemap scale that applies toall spatial groups (set in the Group Settingswindow for any group; 1:48,000 for the Midway map). To shrinkthe index map to a smaller size I set a Relative Zoom value of0.0009 in its Group Settings window (above).
The declination graphic used in the layout is an SML (SpatialManipulation Language) script layer. SML display layers arediscussed in the tutorial booklet Writing Scripts with SML.
page 16
Making Geologic MapsAdvanced Software for Geospatial Analysis
MicroImages, Inc.
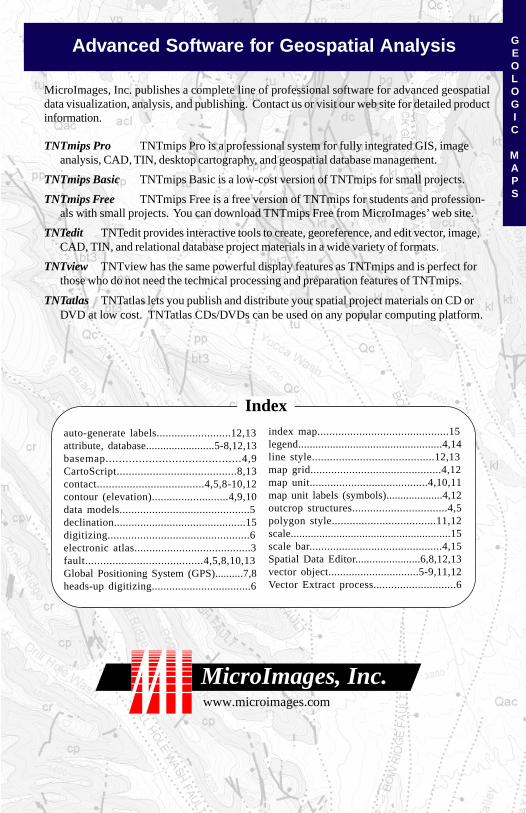
MicroImages, Inc. publishes a complete line of professional software for advanced geospatialdata visualization, analysis, and publishing. Contact us or visit our web site for detailed productinformation.
TNTmips Pro TNTmips Pro is a professional system for fully integrated GIS, imageanalysis, CAD, TIN, desktop cartography, and geospatial database management.
TNTmips Basic TNTmips Basic is a low-cost version of TNTmips for small projects.
TNTmips Free TNTmips Free is a free version of TNTmips for students and profession-als with small projects. You can download TNTmips Free from MicroImages’ web site.
TNTedit TNTedit provides interactive tools to create, georeference, and edit vector, image,CAD, TIN, and relational database project materials in a wide variety of formats.
TNTview TNTview has the same powerful display features as TNTmips and is perfect forthose who do not need the technical processing and preparation features of TNTmips.
TNTatlas TNTatlas lets you publish and distribute your spatial project materials on CD orDVD at low cost. TNTatlas CDs/DVDs can be used on any popular computing platform.
Index
auto-generate labels.........................12,13attribute, database........................5-8,12,13basemap.........................................4,9CartoScript........................................8,13contact....................................4,5,8-10,12contour (elevation)..........................4,9,10data models............................................5declination.............................................15digitizing................................................6electronic atlas.......................................3fault.......................................4,5,8,10,13Global Positioning System (GPS)..........7,8heads-up digitizing..................................6
index map............................................15legend..................................................4,14line style.........................................12,13map grid............................................4,12map unit........................................4,10,11map unit labels (symbols)....................4,12outcrop structures................................4,5polygon style...................................11,12scale........................................................15scale bar.............................................4,15Spatial Data Editor.......................6,8,12,13vector object...............................5-9,11,12Vector Extract process............................6
GEOLOGIC
MAPS
3500
3700
3700
3800
3900
4000
4100
4200
4300
4400
4500
4600 5000
4300
5000
4900
4700
4500
4200
4300
4400
4000
4200
4500
3900
3600
4000
3800
3800
4300
4100
4100
4800
4500
47004800
4300
3800
3600
3900
4600
4200
4500
4900
4300
4700
4400
4400
4100
4200
4600
4500
4900
3700
4300
4000
4500
4500
4500
4200
44004100
4400
4100
4400
4700
4800
4200
4700
4500
4300
4700
4400
5200 4600
4500
4200
40004400
4500
4700
4000
3700
3600
3600
3800
4000
4400
4800
Mid
way
Val
ley
Yucca Wash
Ron R
idge
Jake Ridge
Joey Ridge
Bleach Bone Ridge Isolation Ridge
Tonsil Ridge
Azreal R
idgeDrill Hole Wash
Antler Ridge
Split Wash
Sever Wash
Pogonip Wash
Exi
le H
ill
Qc
cr
cp
cpcr
Qc
pptu
tu
tukl
pp
kt
ktkl
pp
Qc
pp
cu
kl
Qc
acl
tu
pp
Qac
kt
pp
klkt
acl
tukl
cu
kt
cu
dc
tu
pp
Qc
dc
act
acl
kt
tuvp
bg
dc
cucu
kt
kl
kl
pr
Qc
tu
pp
kl
kl
Qc
tu
dc
vp
acl
vp
tu
tu
pp
tr
tp
bt3
pp
tu
acl
act
acl
Qccr
cp
cp
cp
Qc
cr
cr
cr
cp
cr
cr
cr
cp
cr
cr
cr
cr
Qc
mr
cp
crQc
Qac
Qc
Qc
Qac
Qac
cr
cp
cp
Qc
pp
act
act
tu
Qc
dc
dc
kl kt
kt
bt2
dc
bt3
pp
cp
cpv
ym
bt3
ym
cpv
cpv
ym
pp
ym
Qc
cp
cpv
ym
tr
Qc
cr
Qc
cr
Qc
cr
cr
Qc
Qc
Qc
Qc
cp
pp
cu
kl
dc
Qc
kt
actacl
Qc
Qc
act
prpp
bg
ktQac
Qac
Qac
pp
act
kt
dc
kt
kl
cpv
cp
cp
cr
cr
cp
trn
BLA
CK
GL A
SS
CA
NY
ON
FA
ULT
EX
ILE
HIL
L F
AU
LT
BO
W R
IDG
E FA
ULT
BO
W R
IDG
E F
AU
LTB
OW
RID
GE
FA
ULTD
RILL HO
LE WASH
FAULT
PAGAN
Y WASH FAULT
MID
WA
Y V
ALL
EY
FA
ULT
PA
INTB
RU
SH
CA
NY
ON
FA
ULT
PA
INTB
RU
SH
CA
NY
ON
FAU
LT
SEVER WASH FAULT
336°52'0"
336°54'0"
11116°26'0" 11116°24'0"
336°52'0"
336°54'0"
11116°26'0" 11116°24'0"
760000 ft
765000
770000
775000
780000
785000 ft
565000 570000 575000 580000 ft
765000
770000
775000
780000
785000 ft
560000 ft 565000 570000 575000 580000 ft
0 1 2 miles
0 1 2 kilometers
Scale = 1:48000
CONTOUR INTERVAL 20 FEET
14.0 deg
MA
GN
ETI
C N
OR
TH
TR
UE
NO
RT
H
5,000-ft grid ticks based on the Nevada State Plane CoordinateSystem, Central Zone, 1927 North American datum.
APPROXIMATE MEANDECLINATION, 1998
NEVADA
MAPLOCATION
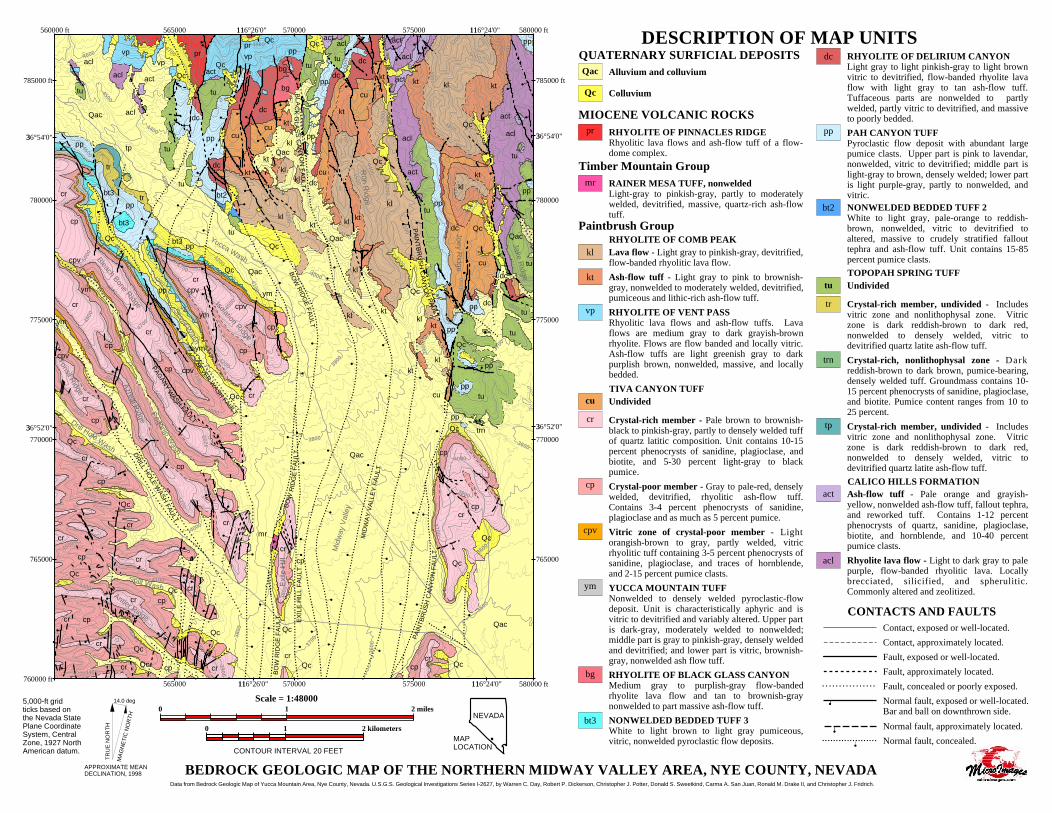
BEDROCK GEOLOGIC MAP OF THE NORTHERN MIDWAY VALLEY AREA, NYE COUNTY, NEVADAData from Bedrock Geologic Map of Yucca Mountain Area, Nye County, Nevada. U.S.G.S. Geological Investigations Series I-2627, by Warren C. Day, Robert P. Dickerson, Christopher J. Potter, Donald S. Sweetkind, Carma A. San Juan, Ronald M. Drake II, and Christopher J. Fridrich.
DESCRIPTION OF MAP UNITSQUATERNARY SURFICIAL DEPOSITSQac Alluvium and colluvium
Qc Colluvium
MIOCENE VOLCANIC ROCKSpr RHYOLITE OF PINNACLES RIDGE
Rhyolitic lava flows and ash-flow tuff of a flow-dome complex.
Timber Mountain Groupmr RAINER MESA TUFF, nonwelded
Light-gray to pinkish-gray, partly to moderatelywelded, devitrified, massive, quartz-rich ash-flowtuff.
Paintbrush GroupRHYOLITE OF COMB PEAK
kl Lava flow - Light gray to pinkish-gray, devitrified,flow-banded rhyolitic lava flow.
kt Ash-flow tuff - Light gray to pink to brownish-gray, nonwelded to moderately welded, devitrified,pumiceous and lithic-rich ash-flow tuff.
vp RHYOLITE OF VENT PASSRhyolitic lava flows and ash-flow tuffs. Lavaflows are medium gray to dark grayish-brownrhyolite. Flows are flow banded and locally vitric.Ash-flow tuffs are light greenish gray to darkpurplish brown, nonwelded, massive, and locallybedded.
TIVA CANYON TUFFcu Undivided
cr Crystal-rich member - Pale brown to brownish-black to pinkish-gray, partly to densely welded tuffof quartz latitic composition. Unit contains 10-15percent phenocrysts of sanidine, plagioclase, andbiotite, and 5-30 percent light-gray to blackpumice.
cp Crystal-poor member - Gray to pale-red, denselywelded, devitrified, rhyolitic ash-flow tuff.Contains 3-4 percent phenocrysts of sanidine,plagioclase and as much as 5 percent pumice.
cpv Vitric zone of crystal-poor member - Lightorangish-brown to gray, partly welded, vitricrhyolitic tuff containing 3-5 percent phenocrysts ofsanidine, plagioclase, and traces of hornblende,and 2-15 percent pumice clasts.
ym YUCCA MOUNTAIN TUFFNonwelded to densely welded pyroclastic-flowdeposit. Unit is characteristically aphyric and isvitric to devitrified and variably altered. Upper partis dark-gray, moderately welded to nonwelded;middle part is gray to pinkish-gray, densely weldedand devitrified; and lower part is vitric, brownish-gray, nonwelded ash flow tuff.
bg RHYOLITE OF BLACK GLASS CANYONMedium gray to purplish-gray flow-bandedrhyolite lava flow and tan to brownish-graynonwelded to part massive ash-flow tuff.
bt3 NONWELDED BEDDED TUFF 3White to light brown to light gray pumiceous,vitric, nonwelded pyroclastic flow deposits.
dc RHYOLITE OF DELIRIUM CANYONLight gray to light pinkish-gray to light brownvitric to devitrified, flow-banded rhyolite lavaflow with light gray to tan ash-flow tuff.Tuffaceous parts are nonwelded to partlywelded, partly vitric to devitrified, and massiveto poorly bedded.
pp PAH CANYON TUFFPyroclastic flow deposit with abundant largepumice clasts. Upper part is pink to lavendar,nonwelded, vitric to devitrified; middle part islight-gray to brown, densely welded; lower partis light purple-gray, partly to nonwelded, andvitric.
bt2 NONWELDED BEDDED TUFF 2White to light gray, pale-orange to reddish-brown, nonwelded, vitric to devitrified toaltered, massive to crudely stratified fallouttephra and ash-flow tuff. Unit contains 15-85percent pumice clasts.TOPOPAH SPRING TUFF
tu Undivided
tr Crystal-rich member, undivided - Includesvitric zone and nonlithophysal zone. Vitriczone is dark reddish-brown to dark red,nonwelded to densely welded, vitric todevitrified quartz latite ash-flow tuff.
trn Crystal-rich, nonlithophysal zone - Darkreddish-brown to dark brown, pumice-bearing,densely welded tuff. Groundmass contains 10-15 percent phenocrysts of sanidine, plagioclase,and biotite. Pumice content ranges from 10 to25 percent.
tp Crystal-rich member, undivided - Includesvitric zone and nonlithophysal zone. Vitriczone is dark reddish-brown to dark red,nonwelded to densely welded, vitric todevitrified quartz latite ash-flow tuff.CALICO HILLS FORMATION
act Ash-flow tuff - Pale orange and grayish-yellow, nonwelded ash-flow tuff, fallout tephra,and reworked tuff. Contains 1-12 percentphenocrysts of quartz, sanidine, plagioclase,biotite, and hornblende, and 10-40 percentpumice clasts.
acl Rhyolite lava flow - Light to dark gray to palepurple, flow-banded rhyolitic lava. Locallybrecciated, silicified, and spherulitic.Commonly altered and zeolitized.
CONTACTS AND FAULTSContact, exposed or well-located.
Contact, approximately located.
Fault, exposed or well-located.
Fault, approximately located.
Fault, concealed or poorly exposed.
Normal fault, exposed or well-located.Bar and ball on downthrown side.
Normal fault, approximately located.
Normal fault, concealed.