Embed Size (px)
Citation preview
Applications and Research UsingRemote Sensing for Rangeland ManagementE. Raymond Hunt, Jr., James H. Everitt, Jerry C. Ritchie, M. Susan Moran, D. Terrance Booth, Gerald L. Anderson,
Patrick E. Clark, and Mark S. Seyfried
AbstractRangelands are grasslands, shrublands, and savannas usedby wildlife for habitat and livestock in order to producefood and fiber. Assessment and monitoring of rangelandsare currently based on comparing the plant species presentin relation to an expected successional end-state defined bythe ecological site. In the future, assessment and monitoringmay be based on indicators of ecosystem health, includingsustainability of soil, sustainability of plant production,and presence of invasive weed species. USDA AgriculturalResearch Service (ARS) scientists are actively engaged indeveloping quantitative, repeatable, and low-cost methodsto measure indicators of ecosystem health using remotesensing. Noxious weed infestations can be determined bycareful selection of the spatial resolution, spectral bands,and timing of image acquisition. Rangeland productivitycan be estimated with either Landsat or Advanced VeryHigh Resolution Radiometer data using models of grossprimary production based on radiation use efficiency. Lidarmeasurements are useful for canopy structure and soilroughness, indicating susceptibility to erosion. The valueof remote sensing for rangeland management depends inpart on combining the imagery with other spatial datawithin geographic information systems. Finally, ARS scien-tists are developing the knowledge on which future range-land assessment and monitoring tools will be developed.
IntroductionRangelands are a type of land resource, which is character-ized by non-forest, native vegetation (NRCS, 1997). Land-cover types of rangelands are grasslands, shrublands, andsavannas, which are determined by climate. Generally, largeyear-to-year variability of precipitation make rangelandsunsuitable for crop production, and livestock grazing pre-sents a sustainable means of food and fiber production.
Drought conditions, which often last years, may drasticallyaffect plant community composition and may make range-lands more susceptible to diseases, insect pests, weed in-vasions, and overgrazing. Healthy rangelands are a nationalresource that will sustain soil quality, enhance the avail-ability of clean water, sequester excess carbon dioxide, main-tain plant and animal diversity, and support a myriad ofother non-agricultural uses (Follett et al., 2001).
The extent of rangelands is large, both for the UnitedStates and for the world. Different authors use differentcriteria for determining these areas. The Natural ResourcesInventory (NRCS, 1994) estimates the extent of privatelyowned rangeland in the United States to be 1.62 � 106 km2
for about 21 percent of the total area. Using Landsat The-matic Mapper data, Vogelmann et al. (2001) determined thatshrublands and grasslands are 34 percent of the total areain the conterminous USA. Monitoring such large areas atlow cost is the forte of remote sensing.
So why isn’t remote sensing currently applied for range-land management? Since the beginning of remote sensingas a discipline, scientists have been studying potentialapplications (Tueller, 1982; Carneggie et al., 1983; Tueller,1989; Tueller, 1992; Tueller, 1995). As discussed in thenext section, there is a mismatch between the informationwanted by range managers and the information provided byremote sensing. This situation is changing; a report by theNational Research Council suggests that criteria for man-agement should be related to ecosystem health (NRC, 1994).With the recent availability of a wide variety of sensors andplatforms, there is considerable research in remote sensingthat is being applied to rangelands. It is the purpose of thisreview to show how USDA-ARS research in the field of re-mote sensing can be used to provide important informationrelated to ecosystem health for monitoring rangelands.
Rangeland Management and the Potential of Remote SensingAt the beginning of the 20th Century, studies on plant suc-cession, the gradual, progressive change of communitytypes from initial colonizers to climax vegetation, formedone of the theoretical bases of plant ecology as a scientificdiscipline (Clements, 1916; Sampson, 1919). The climaxplant community, determined by climate, was supposed tohave the highest sustainable productivity, to be the mostresistant to weed establishment, and to provide the bestprotection against soil erosion. Overgrazing reverses thedirection of plant succession from climax to earlier succes-sional stages (Sampson, 1919).
The first practical methodology for rangeland monitor-ing was developed by Dyksterhuis (1949). Basically, theweight or cover of each species in a plot was determined
P H O T O G R A M M E T R I C E N G I N E E R I N G & R E M O T E S E N S I N G
Photogrammetric Engineering & Remote SensingVol. 69, No. 6, June 2003, pp. 675–693.
0099-1112/03/6906–675$3.00/0© 2003 American Society for Photogrammetry
and Remote Sensing
E.R. Hunt, Jr., and J.C. Ritchie are with the Hydrology andRemote Sensing Laboratory, USDA Agricultural ResearchService, Building 007, Room 104, 10300 Baltimore Ave.,Beltsville, MD 20705 ([email protected]).J.H. Everitt is with the Kika de la Garza Subtropical Agri-cultural Research Center, USDA Agricultural Research Ser-vice, 2413 E. Highway 83, Weslaco, TX 78596.M.S. Moran is with the Southwest Watershed ResearchCenter, USDA Agricultural Research Service, 2000 E. AllenRd., Tucson, AZ 85719.D.T. Booth is with the High Plains Grasslands ResearchStation, USDA Agricultural Research Service, 8408 HildrethRd., Cheyenne, WY 82009.G.L. Anderson is with the Northern Plains Agricultural Re-search Laboratory, USDA Agricultural Research Service,1500 North Central Ave., Sidney, MT 59270.P.E. Clark and M.S. Seyfried are with the Northwest Water-shed Research Center, USDA Agricultural Research Service,800 Park Blvd., Suite 105, Boise, ID 83712.
IPC_Grams_03-906 4/12/03 5:04 AM Page 1
J u n e 2 0 0 3 675
P H O T O G R A M M E T R I C E N G I N E E R I N G & R E M O T E S E N S I N G
and classified as climax species or not. Range “condition” iscalculated from the percent climax vegetation present: 76 to100 percent climax vegetation is excellent, 51 to 75 percentis good, 26 to 50 percent is fair, and 0 to 25 percent is poor.This method, with minor modifications, was used by theNatural Resource Conservation Service (NRCS) for privategrazing lands, and by the Bureau of Land Management (BLM)and the Forest Service (FS) for federally owned grazing lands.
The current theory on succession for range managementhas changed from a single climax community to multipleend-state communities with “State and Transition Models”(Friedel, 1991; Laycock, 1991). Furthermore, each part of thelandscape is no longer compared to the same climax; “eco-logical sites,” which are defined by different potentials forplant production, are delineated on the basis of soils, topo-graphy, hydrology, and other factors (SRM, 1995). Whereasthe NRCS and other agencies consider the assessment ofrangeland health to be important and are working on a ratingsystem, the methodology of comparing the species presentwith the presumed successional end-state for a given eco-logical site (termed a similarity index) is the current basisof rangeland assessment (NRCS, 1997).
Therefore, many rangeland managers want some methodusing remote sensing that would classify an area based onthe successional status of the species present, not a generalland-cover classification. Interpretation of large-scale aerialphotography allows many species to be identified by thepatterns and shapes of the plant clumps and crowns, butcomputer algorithms do not yet have the ability to recognizethe different complex patterns. Digital image processing ofsatellite data, even with small pixel sizes, can determineland cover but not individual plant species. The reflectancespectrum from remotely sensed vegetation contains infor-mation on the chlorophyll content, water content, and leafand canopy structure (Gates et al., 1965; Knipling, 1970).There is no spectral signature for successional status, andit is unlikely that satellite data will ever provide managerswith rangeland “condition,” or other indices based onplant succession.
Another basis for assessment is rangeland ecosystemhealth, which is defined “as the degree to which the in-tegrity of the soil and the ecological processes of rangelandecosystems are sustained” (NRC, 1994). The amount andtype of soil erosion are one set of indicators on the degreeof rangeland health; the amount of plant production andplant residue are other indicators of a healthy ecosystem(Pellant et al., 2000). More recently, there is an awarenessthat presence of noxious invasive species may be an indica-tor of poor ecosystem health (Vitousek et al., 1996; Sheleyand Petroff, 1999, Pellant et al., 2000). There are valid con-cerns about how the various potential indicators are quan-tified and weighted into an overall estimate of ecosystemhealth (West and Smith, 1997). In a comparison of 149 in-ventory points in western Colorado, Spaeth et al. (1999)found no significant correlation between similarity indexand 17 different indicators of rangeland health. However,the costs for this survey suggest that assessment for ecosys-tem health, on the ground, for one randomly selected loca-tion, would be about $500 (Pellant et al., 1999), so a statis-tically accurate rangeland survey for the United Stateswould cost on the order of ten million dollars.
The challenge remains to define cost-effective indicatorsand methods for rangeland assessment and monitoring. Re-mote sensing can provide direct estimates for many of theindicators proposed for ecosystem health at lower cost.USDA-ARS scientists involved with remote sensing are ac-tively conducting research using proven and new technolo-gies, capable of monitoring key indicators of ecosystemhealth, over the vast extent of rangelands.
Remote Sensing of Noxious Rangeland Plant SpeciesNoxious brush and weeds dominate the vegetation of manyrangeland plant communities and frequently pose the pri-mary deterrent to effective management of these areas(Scifres, 1980). Rangeland areas are generally extensiveand inaccessible; consequently, determining the distribu-tion and extent of infestations or botanical characteristicsby ground surveys is difficult. More accurate measurementsof area infested and canopy cover are essential to estimat-ing the amount of damage or ecological impact caused byinvading brush and weeds. Remote sensing techniquesoffer rapid acquisition of data with generally short turn-around time at costs lower than ground surveys (Tueller,1982; Everitt et al., 1992).
The value of remote sensing for distinguishing someplant species and communities on rangelands is well estab-lished (Carneggie et al., 1983; Tueller, 1989; Everitt et al.,1995; Driscoll et al., 1997; Everitt et al., 2001a). Field re-flectance measurements have been used to distinguish nox-ious plant species (Gausman et al., 1977a; Everitt et al.,1987; Lass and Callihan, 1997). Likewise, aerial photogra-phy, airborne videography and digital imagery, and satel-lite data have been used to remotely detect brush and weedson rangelands (Gausman et al., 1977b; Richardson et al.,1981; Carneggie et al., 1983; Strong et al., 1985; Everitt et al.,1994; Lass et al., 1996; Lass and Callihan, 1997; Everittet al., 2001a).
Over the past decade remote sensing, geographic infor-mation system (GIS), and Global Positioning System (GPS)technologies have been integrated for detecting and map-ping the distribution of noxious rangeland plants (Deweyet al., 1991; Anderson et al., 1996; Everitt et al., 1996;Everitt et al., 2001a). Remote observations in georeferencedformats help to assess the extent of infestations, trackchanges, develop management strategies, and evaluate con-trol measures on noxious plant populations.
Airborne Methods for Noxious Weed DetectionScientists at the ARS Kika de la Garza Subtropical Agricul-tural Research Center (Weslaco, Texas) have conducted ex-tensive research on using remote sensing technology fordistinguishing noxious plant species on rangelands. Re-search has focused on describing the light reflectance char-acteristics of weed and brush species and utilizing remotelysensed imagery for their detection. Aerial photography hasbeen the most used remote sensing technique for detectingplant species. Aerial photographs provide the finest spatialresolution and capture the spatial and textural essence ofthe scene with greater fidelity than any other procedure(Tueller, 1989).
Initial research at Weslaco on the utilization of remotesensing technology for detecting noxious plants was con-ducted by Gausman et al. (1977b). They described the lightreflectance of silverleaf sunflower [Helianthus argophyllusTorr. & A. Gray] and demonstrated that aerial color-infrared(CIR) (0.50- to 0.90-�m) photography could be used to dis-tinguish this annual weed on south Texas rangelands. Theability to remotely distinguish silverleaf sunflower wasattributed to its white pubescent foliage that gave it highervisible (0.45- to 0.75-mm) reflectance than did other associ-ated species.
The study on silverleaf sunflower stimulated furtherresearch using CIR aerial photography to detect falsebroomweed [Xylothamia palmeri (A. Gray) G. L. Nesom],broom snakeweed [Gutierrezia sarothrae (Pursh.) Britton &Rusby], and spiny aster [Chloracantha spinosa (Benth.) G. L.Nesom] (Everitt et al., 1984; Everitt et al., 1987; Andersonet al., 1993). These three weedy sub-shrubs have erec-tophile (erect-leaf) canopy structures that produce various
IPC_Grams_03-906 4/12/03 5:04 AM Page 2
676 J u n e 2 0 0 3
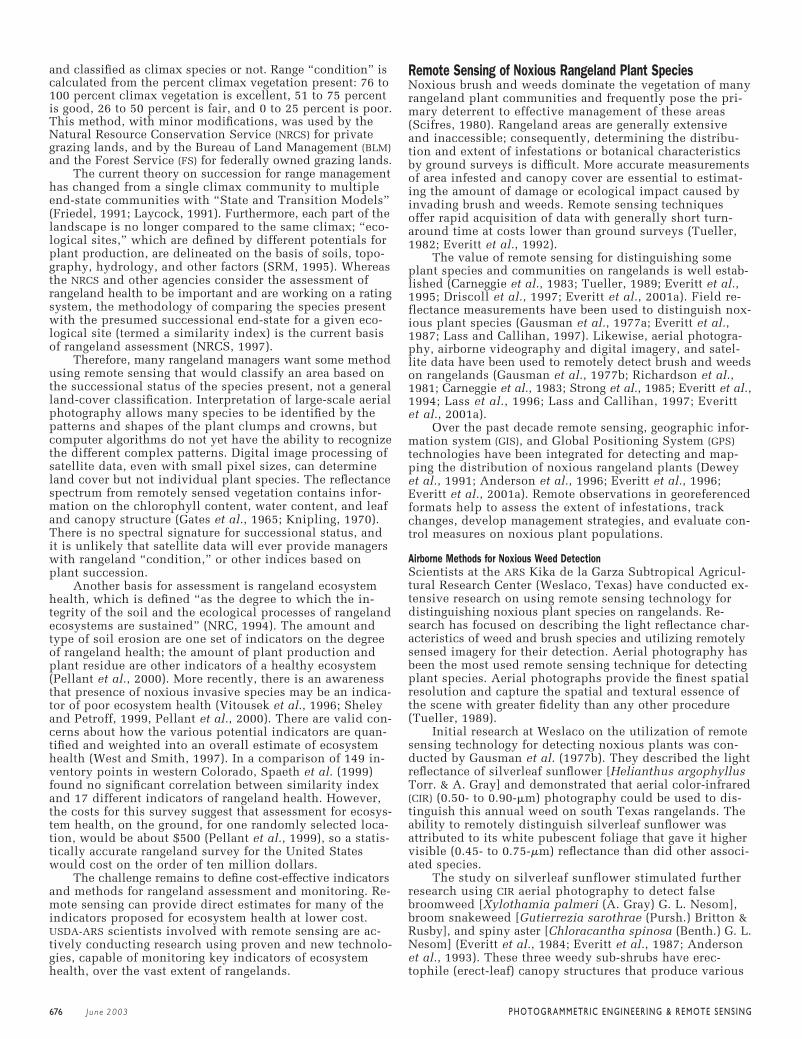
dark brown to black image responses on CIR photographsthat can be distinguished from the various shades of ma-genta, red, and light brown of other plant species (Plate 1).Figure 1 shows canopy reflectance data obtained for broomsnakeweed and eight associated plant species and mixturesover the 0.45- to 0.90-mm spectral region. The visible (0.4-to 0.7-mm) reflectance of broom snakeweed was similar tothat of several other associated species, but its near-infrared(NIR; 0.77- to 0.90-mm) reflectance was lower than that ofthe other species. The low NIR reflectance of broom snake-weed was due to it erectophile canopy structure (Everittet al., 1987).
One of the most important factors for distinguishingnoxious species is obtaining the aerial photographs at theproper phenological stage, usual during flowering. Black-brush [Acacia rigidula Benth.] and huisache [Acacia farne-siana (L.) Willd.] are two woody legumes that often createbrush problems on Texas rangelands (Scifres, 1980). Bothblackbrush and huisache flower concurrently in late Febru-ary or March, producing a profusion of small cream to lightyellow flowers and orange-yellow flowers, respectively, thatencompass their entire canopies, giving each species astriking appearance. Aerial conventional color (0.40- to0.70-mm) photography was used to distinguish blackbrushand huisache infestations. Plant canopy reflectance mea-surements on flowering blackbrush and huisache showedthat they had higher visible reflectance than did other asso-ciated species (Everitt, 1985; Everitt and Villarreal, 1987).Conventional color photography has also been used suc-cessfully to distinguish common goldenweed [Isocomacoronopifolia (A. Gray) Greene] and Drummond golden-weed [Isocoma drummondii (T. & G.) Greene] during theirflowering stages in the fall (Everitt et al., 1992). These twoweedy shrubs infest rangelands in southern Texas andnortheast Mexico (Mayeux and Scifres, 1978; Mayeux andScifres, 1981).
More recent research at Weslaco has shown that somenoxious rangeland species can be remotely distinguishedbest in winter. Redberry juniper [Juniperus pinchotii Sudw.]
is a troublesome evergreen shrub or small tree that invadesrangelands in the southwestern United States. Everitt et al.(2001b) used CIR aerial photography for distinguishing red-berry juniper infestations on the Texas Rolling Plains inwinter due to its evergreen foliage. Other associated speciesthat are confused with redberry juniper during the growingseason are dormant in winter. Ground reflectance measure-ments supported these findings. Computer image analysesof a CIR photograph showed that redberry juniper infesta-tions could be quantified, and an accuracy assessment ofthe classification had an overall accuracy of 89 percent.
In the past several years, videography has emerged asa remote sensing tool for natural resource assessment(Mausel, 1995; King, 1995). Videography has many attrib-
P H O T O G R A M M E T R I C E N G I N E E R I N G & R E M O T E S E N S I N G
Plate 1. Color-infared photograph (original scale1:10,000) of broom snakeweed near Tatum, New Mex-ico, in August 1984. The arrow points to the typicaldark brown to black image of broom snakeweed.
Figure 1. Field reflectance over the 0.45- to 0.90-mmwaveband interval for broom snakeweed and eight otherassociated rangeland species or mixtures on southTexas rangelands in August 1984.
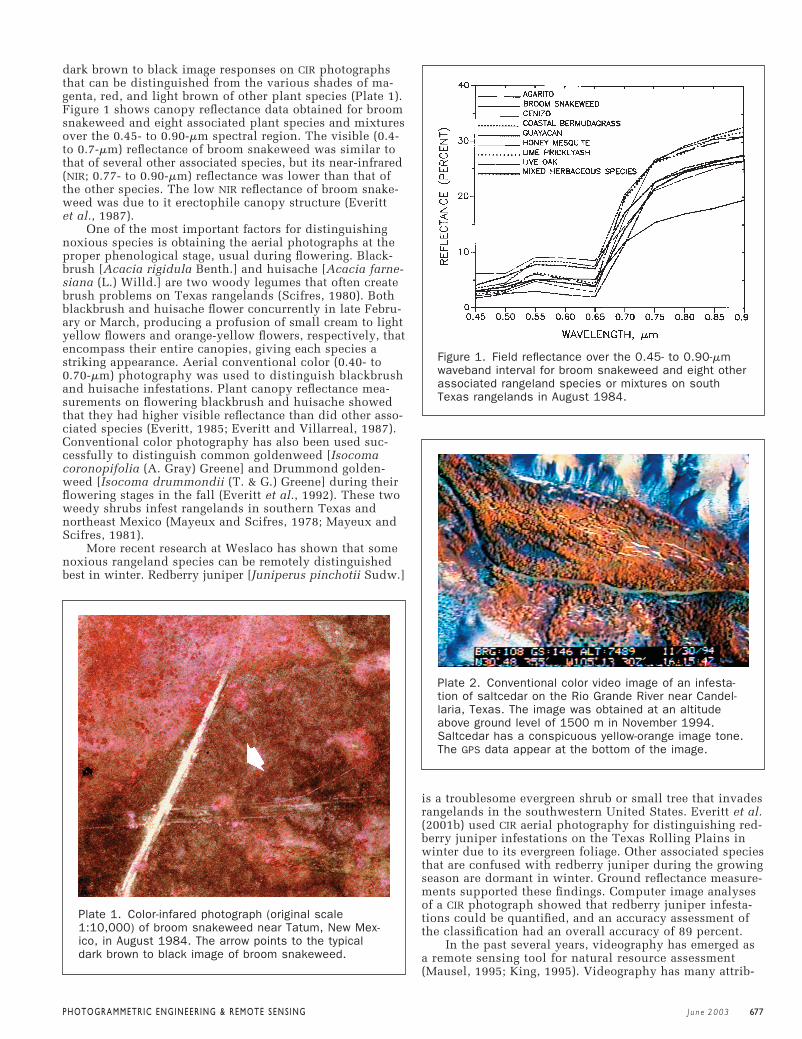
Plate 2. Conventional color video image of an infesta-tion of saltcedar on the Rio Grande River near Candel-laria, Texas. The image was obtained at an altitudeabove ground level of 1500 m in November 1994.Saltcedar has a conspicuous yellow-orange image tone.The GPS data appear at the bottom of the image.
IPC_Grams_03-906 4/12/03 5:04 AM Page 3
J u n e 2 0 0 3 677
P H O T O G R A M M E T R I C E N G I N E E R I N G & R E M O T E S E N S I N G
utes that are attractive for remote sensing, including thetimely availability of imagery, its electronic format thatallows for the digital processing of the signal and its inte-gration with GPS devices, and its low cost (Everitt et al.,1995b). The main disadvantage of video is its low resolutionrelative to aerial photographs.
Researchers at Weslaco have focused on the integrationof aerial video, GPS, and GIS technologies for detecting andmapping noxious rangeland plant species. Initial researchin this area was on the woody legumes blackbrush andhuisache (Everitt et al., 1993b). Conventional color video-graphy was used to detect blackbrush and huisache duringtheir flowering stages in March. The GPS latitude-longitudedata provided on the video imagery was integrated withGIS technology to georeference populations of blackbrushand huisache on a regional map of south Texas.
Airborne multispectral video, GPS, and GIS technologieshave also been integrated to detect and map Big Bend lo-coweed [Astragalus mollissimus var. earlei (Greene x Rydb.)Tidestr.] populations on west Texas rangelands (Everittet al., 1994). Big Bend locoweed is a toxic, perennial weedthat causes widespread poisoning of cattle, horses, andsheep (Sperry et al., 1964; James et al., 1980). This toxicweed could be easily detected on CIR and black-and-whiteNIR video imagery.
Weslaco scientists conducted a project using conven-tional color videography, GPS, and GIS technologies to de-tect and map saltcedar [Tamarix chinensis Lour.] infesta-tions in the southwestern United States (Everitt et al., 1996).Saltcedar, also known as Chinese tamarisk, is an invader ofriparian areas in the southwestern United States and north-ern Mexico. Plate 2 shows a conventional color videoimage of a saltcedar infestation along the Rio Grande riverin west Texas. The GPS data appear on the bottom of theimage. Saltcedar has a conspicuous orange-brown imagethat is easily distinguished from other associated vegetation,soils, and water. The distinct signature of saltcedar wasdue to its foliage turning a yellow-orange to orange-browncolor in late fall prior to leaf drop.
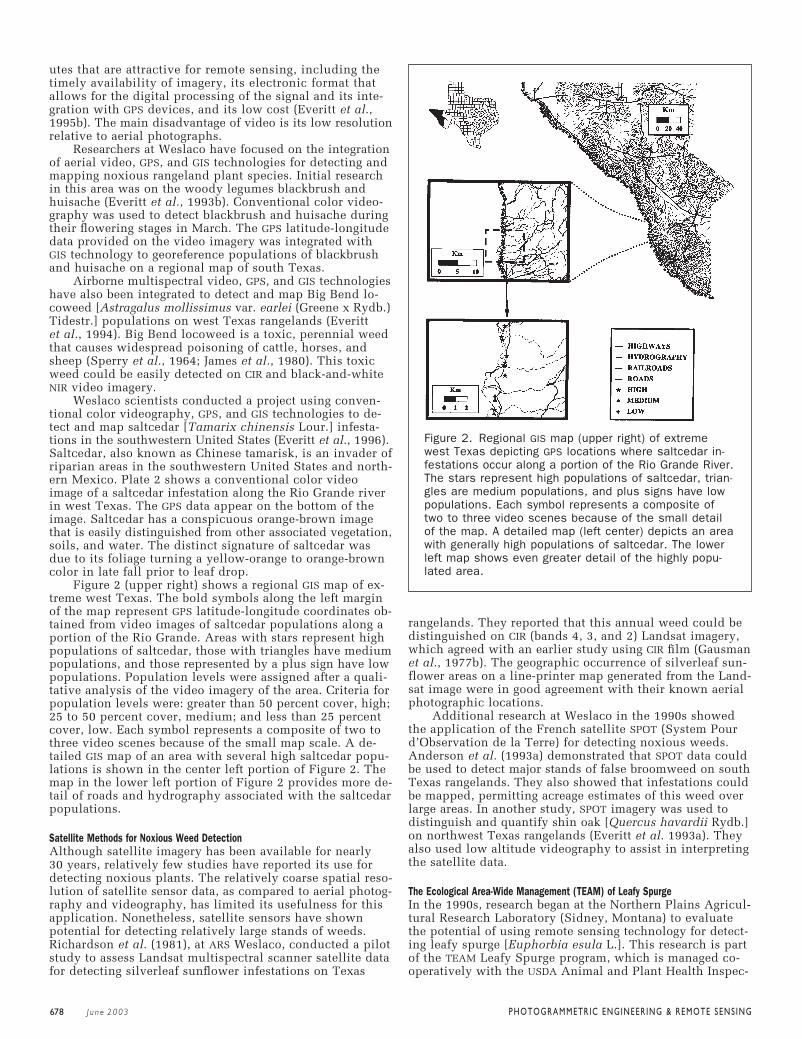
Figure 2 (upper right) shows a regional GIS map of ex-treme west Texas. The bold symbols along the left marginof the map represent GPS latitude-longitude coordinates ob-tained from video images of saltcedar populations along aportion of the Rio Grande. Areas with stars represent highpopulations of saltcedar, those with triangles have mediumpopulations, and those represented by a plus sign have lowpopulations. Population levels were assigned after a quali-tative analysis of the video imagery of the area. Criteria forpopulation levels were: greater than 50 percent cover, high;25 to 50 percent cover, medium; and less than 25 percentcover, low. Each symbol represents a composite of two tothree video scenes because of the small map scale. A de-tailed GIS map of an area with several high saltcedar popu-lations is shown in the center left portion of Figure 2. Themap in the lower left portion of Figure 2 provides more de-tail of roads and hydrography associated with the saltcedarpopulations.
Satellite Methods for Noxious Weed DetectionAlthough satellite imagery has been available for nearly30 years, relatively few studies have reported its use fordetecting noxious plants. The relatively coarse spatial reso-lution of satellite sensor data, as compared to aerial photog-raphy and videography, has limited its usefulness for thisapplication. Nonetheless, satellite sensors have shownpotential for detecting relatively large stands of weeds.Richardson et al. (1981), at ARS Weslaco, conducted a pilotstudy to assess Landsat multispectral scanner satellite datafor detecting silverleaf sunflower infestations on Texas
rangelands. They reported that this annual weed could bedistinguished on CIR (bands 4, 3, and 2) Landsat imagery,which agreed with an earlier study using CIR film (Gausmanet al., 1977b). The geographic occurrence of silverleaf sun-flower areas on a line-printer map generated from the Land-sat image were in good agreement with their known aerialphotographic locations.
Additional research at Weslaco in the 1990s showedthe application of the French satellite SPOT (System Pourd’Observation de la Terre) for detecting noxious weeds.Anderson et al. (1993a) demonstrated that SPOT data couldbe used to detect major stands of false broomweed on southTexas rangelands. They also showed that infestations couldbe mapped, permitting acreage estimates of this weed overlarge areas. In another study, SPOT imagery was used todistinguish and quantify shin oak [Quercus havardii Rydb.]on northwest Texas rangelands (Everitt et al. 1993a). Theyalso used low altitude videography to assist in interpretingthe satellite data.
The Ecological Area-Wide Management (TEAM) of Leafy Spurge In the 1990s, research began at the Northern Plains Agricul-tural Research Laboratory (Sidney, Montana) to evaluatethe potential of using remote sensing technology for detect-ing leafy spurge [Euphorbia esula L.]. This research is partof the TEAM Leafy Spurge program, which is managed co-operatively with the USDA Animal and Plant Health Inspec-
Figure 2. Regional GIS map (upper right) of extremewest Texas depicting GPS locations where saltcedar in-festations occur along a portion of the Rio Grande River.The stars represent high populations of saltcedar, trian-gles are medium populations, and plus signs have lowpopulations. Each symbol represents a composite oftwo to three video scenes because of the small detailof the map. A detailed map (left center) depicts an areawith generally high populations of saltcedar. The lowerleft map shows even greater detail of the highly popu-lated area.
IPC_Grams_03-906 4/12/03 5:04 AM Page 4
678 J u n e 2 0 0 3
P H O T O G R A M M E T R I C E N G I N E E R I N G & R E M O T E S E N S I N G
tion Service (APHIS). Leafy spurge is an exotic weed thathas created a severe range management problem in theNorthern Great Plains of the United States and in the PrairieProvinces of Canada (Rees and Spencer, 1991). It infestsapproximately two million hectares of land in North Amer-ica (Quimby and Wendel, 1997; Anderson et al., 2003).
Initial research established that leafy spurge had highervisible reflectance than other associated species in earlysummer when it develops conspicuous yellow-green bracts.Leafy spurge could be remotely distinguished on both con-ventional color and CIR aerial photographs during this phe-nological stage (Everitt et al., 1995a). Anderson et al. (1996)used high altitude conventional color aerial photographyand GIS to map and quantify the extent of leafy spurgewithin the South Unit of Theodore Roosevelt National Parkin southwestern North Dakota. The joint use of GIS and re-mote sensing provided previously unavailable informationabout the extent and spatial dynamics of leafy spurge withinthe park. More recently, Anderson et al. (1999) used aerialphotography and GIS technologies to map and quantify theextent, distribution, and spatial-temporal dynamics of leafyspurge within a portion of the South Unit of TheodoreRoosevelt National Park between 1993 and 1998. Andersonet al. (1999) found that leafy spurge had doubled in extentin five years, and the spatial distribution of the invasionover the landscape was highly predictable.
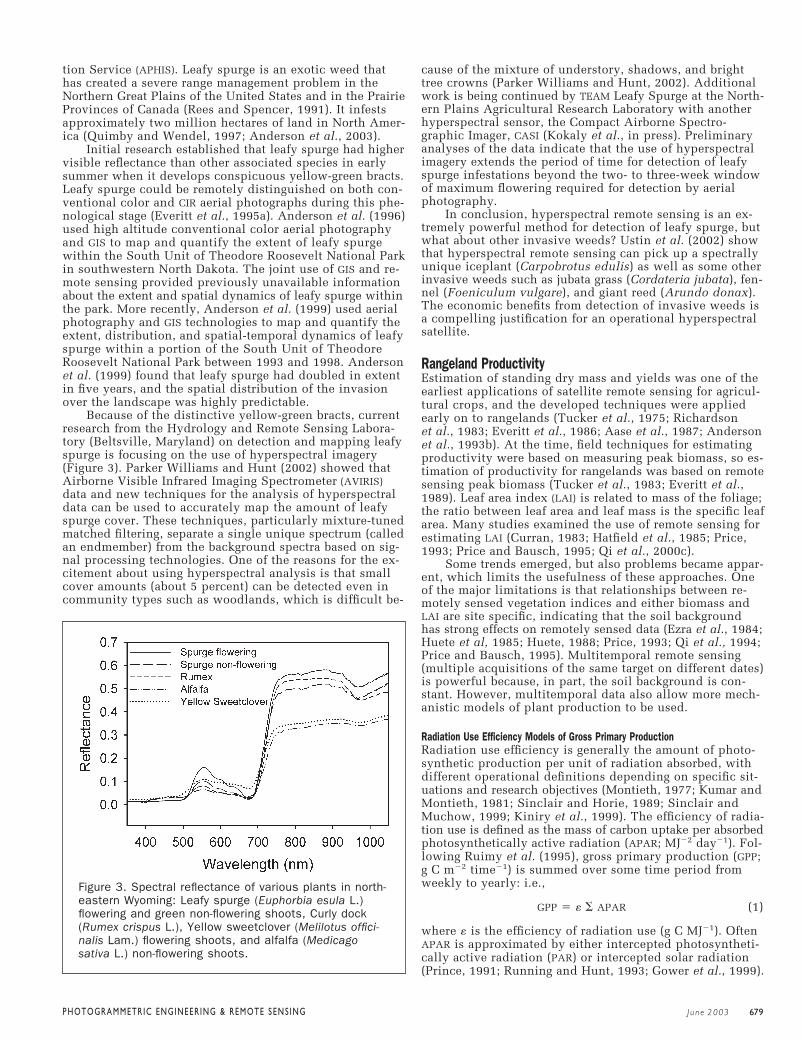
Because of the distinctive yellow-green bracts, currentresearch from the Hydrology and Remote Sensing Labora-tory (Beltsville, Maryland) on detection and mapping leafyspurge is focusing on the use of hyperspectral imagery(Figure 3). Parker Williams and Hunt (2002) showed thatAirborne Visible Infrared Imaging Spectrometer (AVIRIS)data and new techniques for the analysis of hyperspectraldata can be used to accurately map the amount of leafyspurge cover. These techniques, particularly mixture-tunedmatched filtering, separate a single unique spectrum (calledan endmember) from the background spectra based on sig-nal processing technologies. One of the reasons for the ex-citement about using hyperspectral analysis is that smallcover amounts (about 5 percent) can be detected even incommunity types such as woodlands, which is difficult be-
cause of the mixture of understory, shadows, and brighttree crowns (Parker Williams and Hunt, 2002). Additionalwork is being continued by TEAM Leafy Spurge at the North-ern Plains Agricultural Research Laboratory with anotherhyperspectral sensor, the Compact Airborne Spectro-graphic Imager, CASI (Kokaly et al., in press). Preliminaryanalyses of the data indicate that the use of hyperspectralimagery extends the period of time for detection of leafyspurge infestations beyond the two- to three-week windowof maximum flowering required for detection by aerialphotography.
In conclusion, hyperspectral remote sensing is an ex-tremely powerful method for detection of leafy spurge, butwhat about other invasive weeds? Ustin et al. (2002) showthat hyperspectral remote sensing can pick up a spectrallyunique iceplant (Carpobrotus edulis) as well as some otherinvasive weeds such as jubata grass (Cordateria jubata), fen-nel (Foeniculum vulgare), and giant reed (Arundo donax).The economic benefits from detection of invasive weeds isa compelling justification for an operational hyperspectralsatellite.
Rangeland ProductivityEstimation of standing dry mass and yields was one of theearliest applications of satellite remote sensing for agricul-tural crops, and the developed techniques were appliedearly on to rangelands (Tucker et al., 1975; Richardsonet al., 1983; Everitt et al., 1986; Aase et al., 1987; Andersonet al., 1993b). At the time, field techniques for estimatingproductivity were based on measuring peak biomass, so es-timation of productivity for rangelands was based on remotesensing peak biomass (Tucker et al., 1983; Everitt et al.,1989). Leaf area index (LAI) is related to mass of the foliage;the ratio between leaf area and leaf mass is the specific leafarea. Many studies examined the use of remote sensing forestimating LAI (Curran, 1983; Hatfield et al., 1985; Price,1993; Price and Bausch, 1995; Qi et al., 2000c).
Some trends emerged, but also problems became appar-ent, which limits the usefulness of these approaches. Oneof the major limitations is that relationships between re-motely sensed vegetation indices and either biomass andLAI are site specific, indicating that the soil backgroundhas strong effects on remotely sensed data (Ezra et al., 1984;Huete et al, 1985; Huete, 1988; Price, 1993; Qi et al., 1994;Price and Bausch, 1995). Multitemporal remote sensing(multiple acquisitions of the same target on different dates)is powerful because, in part, the soil background is con-stant. However, multitemporal data also allow more mech-anistic models of plant production to be used.
Radiation Use Efficiency Models of Gross Primary ProductionRadiation use efficiency is generally the amount of photo-synthetic production per unit of radiation absorbed, withdifferent operational definitions depending on specific sit-uations and research objectives (Montieth, 1977; Kumar andMontieth, 1981; Sinclair and Horie, 1989; Sinclair andMuchow, 1999; Kiniry et al., 1999). The efficiency of radia-tion use is defined as the mass of carbon uptake per absorbedphotosynthetically active radiation (APAR; MJ�2 day�1). Fol-lowing Ruimy et al. (1995), gross primary production (GPP;g C m�2 time�1) is summed over some time period fromweekly to yearly: i.e.,
GPP � � � APAR (1)
where � is the efficiency of radiation use (g C MJ�1). OftenAPAR is approximated by either intercepted photosyntheti-cally active radiation (PAR) or intercepted solar radiation(Prince, 1991; Running and Hunt, 1993; Gower et al., 1999).
Figure 3. Spectral reflectance of various plants in north-eastern Wyoming: Leafy spurge (Euphorbia esula L.)flowering and green non-flowering shoots, Curly dock(Rumex crispus L.), Yellow sweetclover (Melilotus offici-nalis Lam.) flowering shoots, and alfalfa (Medicagosativa L.) non-flowering shoots.
IPC_Grams_03-906 4/12/03 5:04 AM Page 5
J u n e 2 0 0 3 679
P H O T O G R A M M E T R I C E N G I N E E R I N G & R E M O T E S E N S I N G
Frequently, radiation use efficiency may be defined usingthe mass of dry matter rather than the mass of carbon, in-corporating ash weight into the value of �. Furthermore,radiation use efficiency is often determined using either netprimary production (NPP) or above-ground net primary pro-duction (ANPP); thus, autotrophic respiration and carbonallocation are incorporated in the value of � (Prince, 1991;Hunt and Running, 1992; Running and Hunt, 1993; Hunt,1994; Ruimy et al., 1994; Gower et al., 1999; Goetz andPrince, 1999).
For ideal growth conditions, differences of � will berelated to the maximum photosynthetic rates of vegetation,which can be estimated from land-cover type. For actualgrowth conditions, � will be reduced from the maximumbecause (1) stomatal closure caused by drought, high vaporpressure differences between leaf and air, night-time tem-peratures falling below freezing, and ozone pollution; and(2) stresses affecting photosynthetic rate. Furthermore,Ruimy et al. (1995) concluded that � is reduced, usually byabout 50 percent, from the photosynthetic capacity of thefoliage being light saturated (cf. Goetz and Prince, 1999).
The direct physical quantity estimated from the nor-malized difference vegetation index (NDVI) is the fraction ofabsorbed to incident photosynthetically active radiation(fAPAR, dimensionless). The NDVI is defined as
NDVI � (NIR � Red)/(NIR � Red) (2)
where NIR is the spectral radiance from a near-infrared bandand Red is the spectral radiance from a red band. Origi-nally, NDVI was developed to enhance the signal from veg-etation and to reduce the effects of atmospheric transmit-tance, topography, and solar elevation and azimuth (Rouseet al., 1974). Subsequently, Asrar et al. (1984), Hatfieldet al. (1984), and others showed that NDVI was approxi-mately equal to fAPAR, so APAR is estimated by the productof NDVI and daily incident PAR. Corrections are made tomore accurately estimate fAPAR from NDVI (Goward andHuemmrich, 1992; Myneni and Williams, 1994).
Advanced Very High Resolution Radiometer (AVHRR)NDVI are most often used because these data are collecteddaily and composited over a short period, weekly or bi-weekly, to generate a mostly cloud-free image, so the changein fAPAR over a season may be determined. AVHRR NDVIshows the spatial distribution of vegetation response tochanges in precipitation over large areas (Millington et al.,1994; Liu and Kogan, 1996; Yang et al., 1998). With thelaunches of the National Aeronautics and Space Administra-tion’s (NASA) Terra satellite in December 1999 and Aquasatellite in May 2002, the Moderate-Resolution ImagingSpectroradiometer (MODIS) is now providing improved esti-mates of fAPAR (Reeves et al., 2001). More importantly,AVHRR data have been archived for a long period by theUnited States Geological Survey EROS Data Center (SiouxFalls, South Dakota), so the effects of the large year-to-yearvariability of rainfall can be averaged.
Scientists with the Hydrology and Remote SensingLaboratory (Beltsville, Maryland) have shown that AVHRRNDVI data are useful for policy and economic analyses, be-cause large areas are covered with large 1-km2 pixels. Onthe other hand, these data are at too coarse a scale for stock-ing individual grazing allotments. Scientists with the South-west Watershed Research Center (Tucson, Arizona) are ap-plying radiation use efficiency models with Landsat ThematicMapper data (30-m by 30-m pixels) for site-specific or pre-cision ranching.
Estimation of Stocking Rate from High-Temporal-Resolution SatellitesOne of the most important decisions of rangeland managersis setting the stocking rate for various kinds of livestock
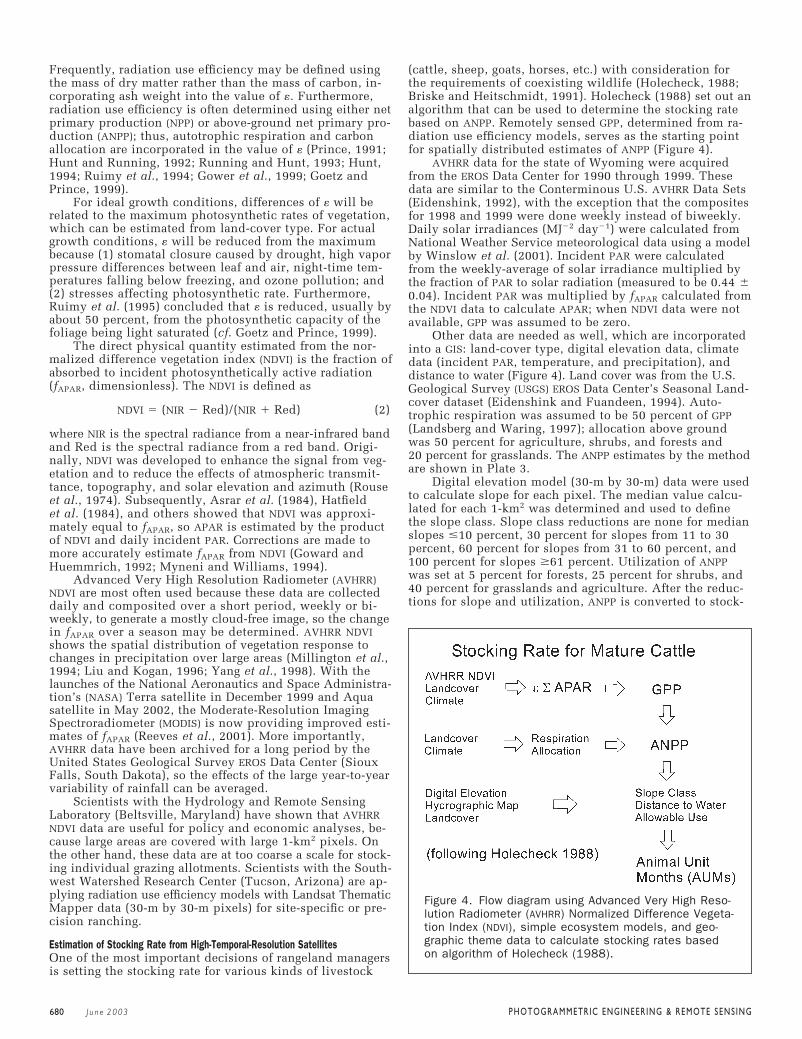
(cattle, sheep, goats, horses, etc.) with consideration forthe requirements of coexisting wildlife (Holecheck, 1988;Briske and Heitschmidt, 1991). Holecheck (1988) set out analgorithm that can be used to determine the stocking ratebased on ANPP. Remotely sensed GPP, determined from ra-diation use efficiency models, serves as the starting pointfor spatially distributed estimates of ANPP (Figure 4).
AVHRR data for the state of Wyoming were acquiredfrom the EROS Data Center for 1990 through 1999. Thesedata are similar to the Conterminous U.S. AVHRR Data Sets(Eidenshink, 1992), with the exception that the compositesfor 1998 and 1999 were done weekly instead of biweekly.Daily solar irradiances (MJ�2 day�1) were calculated fromNational Weather Service meteorological data using a modelby Winslow et al. (2001). Incident PAR were calculatedfrom the weekly-average of solar irradiance multiplied bythe fraction of PAR to solar radiation (measured to be 0.44 �0.04). Incident PAR was multiplied by fAPAR calculated fromthe NDVI data to calculate APAR; when NDVI data were notavailable, GPP was assumed to be zero.
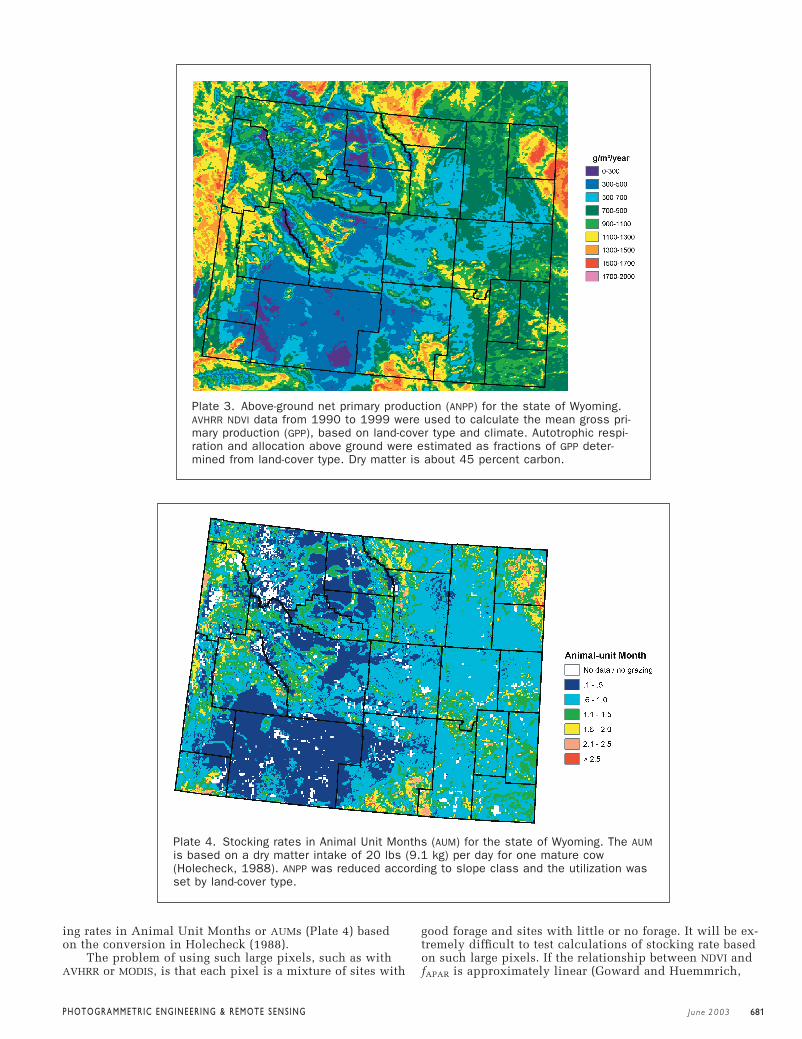
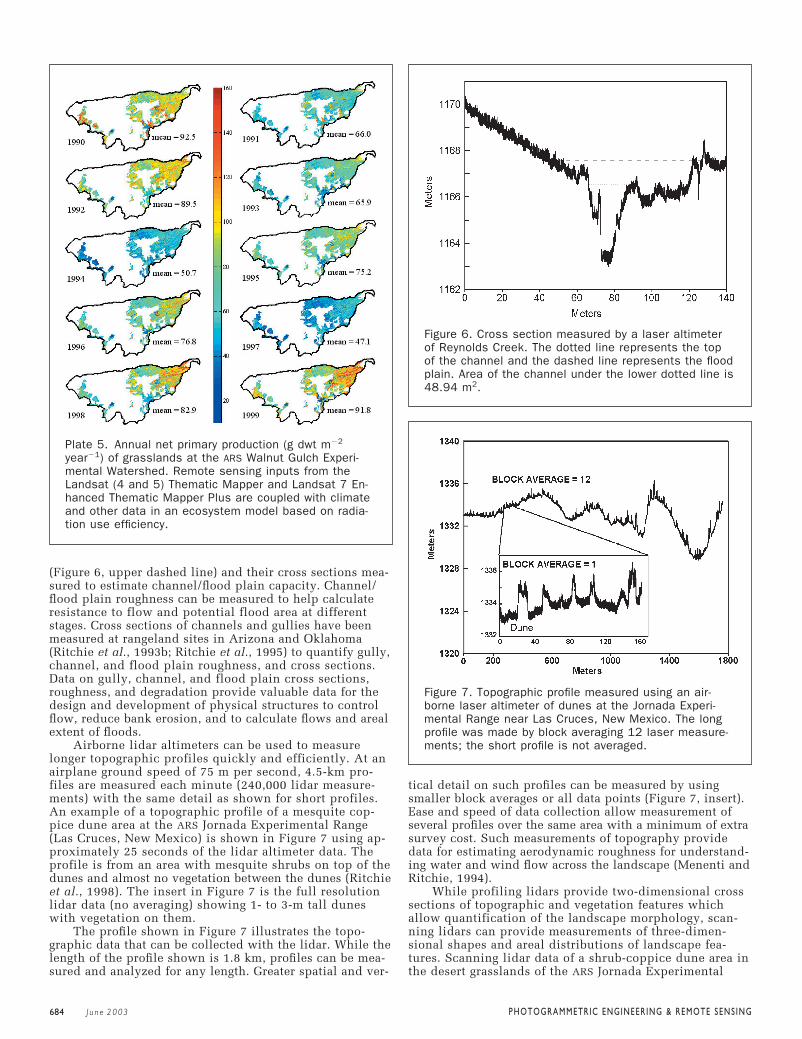
Other data are needed as well, which are incorporatedinto a GIS: land-cover type, digital elevation data, climatedata (incident PAR, temperature, and precipitation), anddistance to water (Figure 4). Land cover was from the U.S.Geological Survey (USGS) EROS Data Center’s Seasonal Land-cover dataset (Eidenshink and Fuandeen, 1994). Auto-trophic respiration was assumed to be 50 percent of GPP(Landsberg and Waring, 1997); allocation above groundwas 50 percent for agriculture, shrubs, and forests and20 percent for grasslands. The ANPP estimates by the methodare shown in Plate 3.
Digital elevation model (30-m by 30-m) data were usedto calculate slope for each pixel. The median value calcu-lated for each 1-km2 was determined and used to definethe slope class. Slope class reductions are none for medianslopes 10 percent, 30 percent for slopes from 11 to 30percent, 60 percent for slopes from 31 to 60 percent, and100 percent for slopes 61 percent. Utilization of ANPPwas set at 5 percent for forests, 25 percent for shrubs, and40 percent for grasslands and agriculture. After the reduc-tions for slope and utilization, ANPP is converted to stock-
Figure 4. Flow diagram using Advanced Very High Reso-lution Radiometer (AVHRR) Normalized Difference Vegeta-tion Index (NDVI), simple ecosystem models, and geo-graphic theme data to calculate stocking rates basedon algorithm of Holecheck (1988).
IPC_Grams_03-906 4/12/03 5:04 AM Page 6
680 J u n e 2 0 0 3
P H O T O G R A M M E T R I C E N G I N E E R I N G & R E M O T E S E N S I N G
ing rates in Animal Unit Months or AUMs (Plate 4) basedon the conversion in Holecheck (1988).
The problem of using such large pixels, such as withAVHRR or MODIS, is that each pixel is a mixture of sites with
good forage and sites with little or no forage. It will be ex-tremely difficult to test calculations of stocking rate basedon such large pixels. If the relationship between NDVI andfAPAR is approximately linear (Goward and Huemmrich,
Plate 3. Above-ground net primary production (ANPP) for the state of Wyoming.AVHRR NDVI data from 1990 to 1999 were used to calculate the mean gross pri-mary production (GPP), based on land-cover type and climate. Autotrophic respi-ration and allocation above ground were estimated as fractions of GPP deter-mined from land-cover type. Dry matter is about 45 percent carbon.
Plate 4. Stocking rates in Animal Unit Months (AUM) for the state of Wyoming. The AUMis based on a dry matter intake of 20 lbs (9.1 kg) per day for one mature cow(Holecheck, 1988). ANPP was reduced according to slope class and the utilization wasset by land-cover type.
IPC_Grams_03-906 4/12/03 5:04 AM Page 7
J u n e 2 0 0 3 681
P H O T O G R A M M E T R I C E N G I N E E R I N G & R E M O T E S E N S I N G
available forage within pasture boundaries or polygons ofinterest to plan the intensity and timing of grazing. If thereis sufficient interest, a second layer of data could be pro-vided just before the next summer rainy season to estimateutilization.
The primary technical problem RANGES faced was thedifficulty of estimating the biomass of senescent grass. Im-ages collected during the summer rainy season are oftenobscured by clouds, and the grasses senesce soon after therains stop. A normalized difference senescent vegetationindex, or NDSVI, was developed that used a shortwave-infrared band rather than NIR as in the NDVI (Qi et al., 2000a).Canopy cover is calculated from NDVI (Qi et al., 2000b).Empirical relationships based on field data are used to esti-mate height and to adjust biomass estimates made by multi-plying the cover and the height. To date, the focus of theproject has been on grasslands, but methods of estimatingforage in areas with significant shrub or tree canopies arealso needed. Commercialization of the RANGES productswill depend on demand; the cost of the products wouldvary on the order of 5 to 10 cents per hectare in 2002.
Airborne Lidar Technology for Measuring Rangeland Properties Land surface features (i.e., vegetation, topography, surfaceroughness) influence the functions of rangeland landscapes.Measuring these features and their spatial distribution usingconventional ground-based technologies provides limitedtemporal and spatial data. Lidar technology from airborneplatforms provides rapid and accurate data of land surfacetopography, roughness, vegetation features, and patterns.Airborne lidar has been used to measure vegetation proper-ties (Ritchie et al., 1992; Ritchie et al., 1993a), erosion fea-tures (Ritchie et al., 1993b), topography (Krabill et al., 1984),and aerodynamic roughness (Menenti and Ritchie, 1994).
Airborne lidar data have been collected over rangelandsin the western United States by the Hydrology and RemoteSensing Laboratory (Beltsville, Maryland), in cooperationwith ARS rangeland research locations and various Long-Term Ecological Research (LTER) research sites (Ritchie et al.,2001). Examples are given of applications of airborne lidardata for measuring rangeland properties.
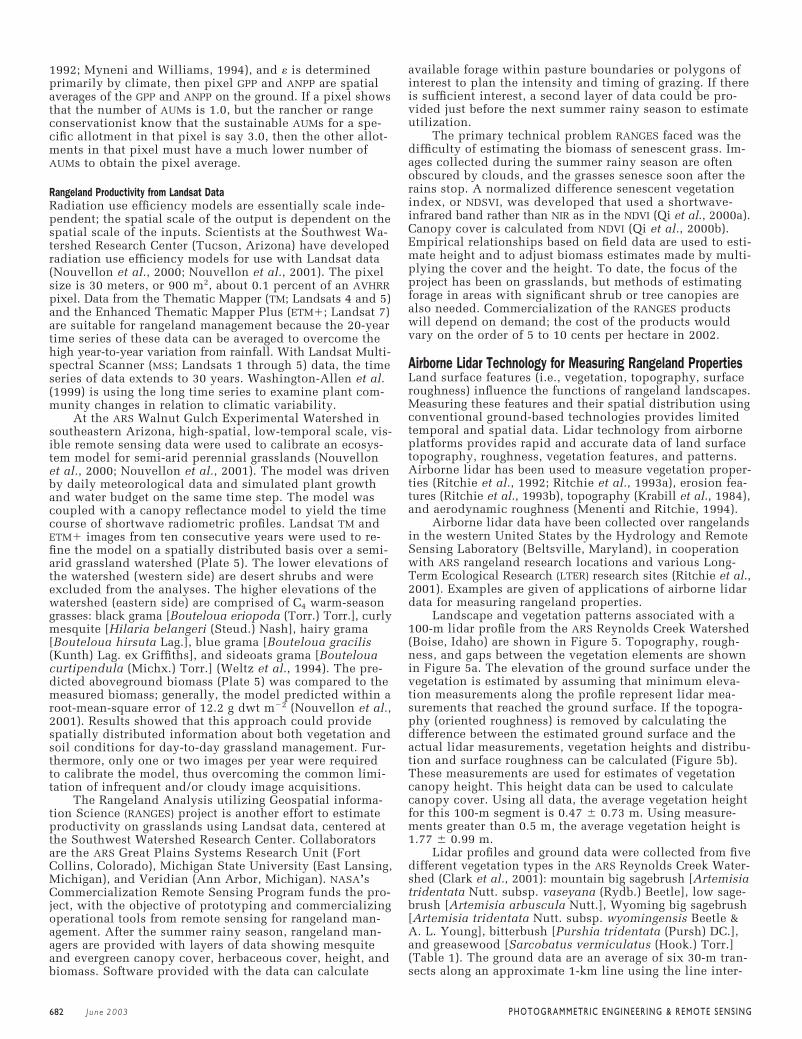
Landscape and vegetation patterns associated with a100-m lidar profile from the ARS Reynolds Creek Watershed(Boise, Idaho) are shown in Figure 5. Topography, rough-ness, and gaps between the vegetation elements are shownin Figure 5a. The elevation of the ground surface under thevegetation is estimated by assuming that minimum eleva-tion measurements along the profile represent lidar mea-surements that reached the ground surface. If the topogra-phy (oriented roughness) is removed by calculating thedifference between the estimated ground surface and theactual lidar measurements, vegetation heights and distribu-tion and surface roughness can be calculated (Figure 5b).These measurements are used for estimates of vegetationcanopy height. This height data can be used to calculatecanopy cover. Using all data, the average vegetation heightfor this 100-m segment is 0.47 � 0.73 m. Using measure-ments greater than 0.5 m, the average vegetation height is1.77 � 0.99 m.
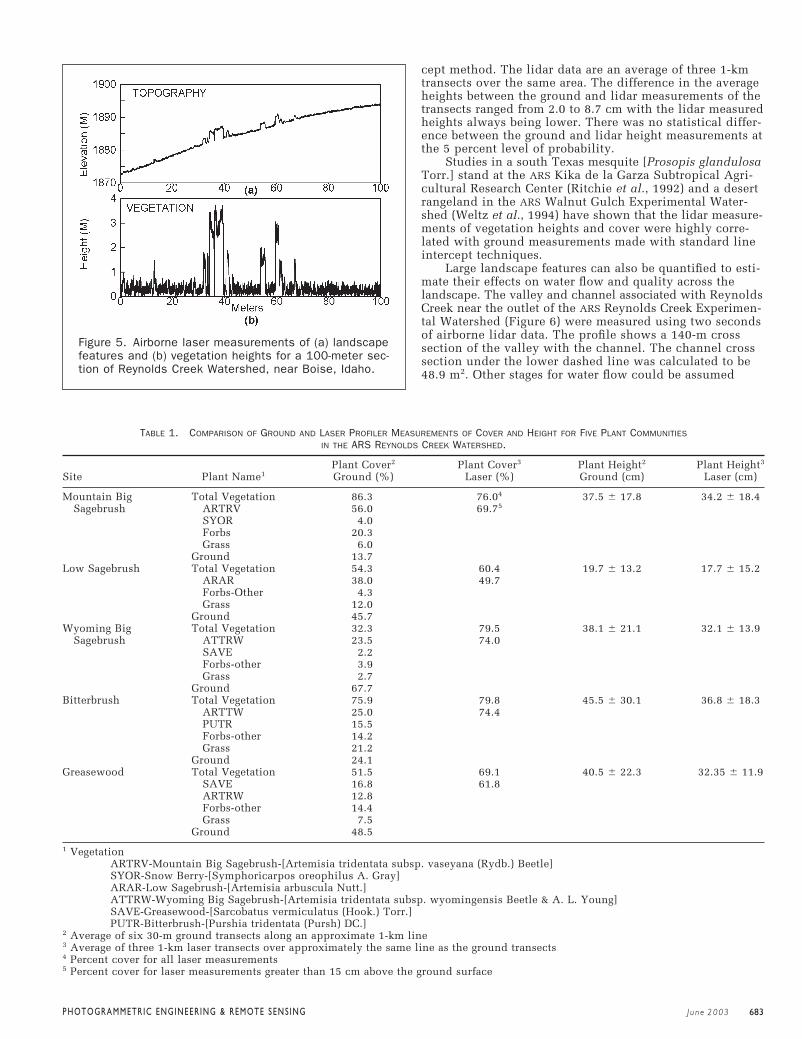
Lidar profiles and ground data were collected from fivedifferent vegetation types in the ARS Reynolds Creek Water-shed (Clark et al., 2001): mountain big sagebrush [Artemisiatridentata Nutt. subsp. vaseyana (Rydb.) Beetle], low sage-brush [Artemisia arbuscula Nutt.], Wyoming big sagebrush[Artemisia tridentata Nutt. subsp. wyomingensis Beetle &A. L. Young], bitterbush [Purshia tridentata (Pursh) DC.],and greasewood [Sarcobatus vermiculatus (Hook.) Torr.](Table 1). The ground data are an average of six 30-m tran-sects along an approximate 1-km line using the line inter-
1992; Myneni and Williams, 1994), and � is determinedprimarily by climate, then pixel GPP and ANPP are spatialaverages of the GPP and ANPP on the ground. If a pixel showsthat the number of AUMs is 1.0, but the rancher or rangeconservationist know that the sustainable AUMs for a spe-cific allotment in that pixel is say 3.0, then the other allot-ments in that pixel must have a much lower number ofAUMs to obtain the pixel average.
Rangeland Productivity from Landsat DataRadiation use efficiency models are essentially scale inde-pendent; the spatial scale of the output is dependent on thespatial scale of the inputs. Scientists at the Southwest Wa-tershed Research Center (Tucson, Arizona) have developedradiation use efficiency models for use with Landsat data(Nouvellon et al., 2000; Nouvellon et al., 2001). The pixelsize is 30 meters, or 900 m2, about 0.1 percent of an AVHRRpixel. Data from the Thematic Mapper (TM; Landsats 4 and 5)and the Enhanced Thematic Mapper Plus (ETM�; Landsat 7)are suitable for rangeland management because the 20-yeartime series of these data can be averaged to overcome thehigh year-to-year variation from rainfall. With Landsat Multi-spectral Scanner (MSS; Landsats 1 through 5) data, the timeseries of data extends to 30 years. Washington-Allen et al.(1999) is using the long time series to examine plant com-munity changes in relation to climatic variability.
At the ARS Walnut Gulch Experimental Watershed insoutheastern Arizona, high-spatial, low-temporal scale, vis-ible remote sensing data were used to calibrate an ecosys-tem model for semi-arid perennial grasslands (Nouvellonet al., 2000; Nouvellon et al., 2001). The model was drivenby daily meteorological data and simulated plant growthand water budget on the same time step. The model wascoupled with a canopy reflectance model to yield the timecourse of shortwave radiometric profiles. Landsat TM andETM� images from ten consecutive years were used to re-fine the model on a spatially distributed basis over a semi-arid grassland watershed (Plate 5). The lower elevations ofthe watershed (western side) are desert shrubs and wereexcluded from the analyses. The higher elevations of thewatershed (eastern side) are comprised of C4 warm-seasongrasses: black grama [Bouteloua eriopoda (Torr.) Torr.], curlymesquite [Hilaria belangeri (Steud.) Nash], hairy grama[Bouteloua hirsuta Lag.], blue grama [Bouteloua gracilis(Kunth) Lag. ex Griffiths], and sideoats grama [Boutelouacurtipendula (Michx.) Torr.] (Weltz et al., 1994). The pre-dicted aboveground biomass (Plate 5) was compared to themeasured biomass; generally, the model predicted within aroot-mean-square error of 12.2 g dwt m�2 (Nouvellon et al.,2001). Results showed that this approach could providespatially distributed information about both vegetation andsoil conditions for day-to-day grassland management. Fur-thermore, only one or two images per year were requiredto calibrate the model, thus overcoming the common limi-tation of infrequent and/or cloudy image acquisitions.
The Rangeland Analysis utilizing Geospatial informa-tion Science (RANGES) project is another effort to estimateproductivity on grasslands using Landsat data, centered atthe Southwest Watershed Research Center. Collaboratorsare the ARS Great Plains Systems Research Unit (FortCollins, Colorado), Michigan State University (East Lansing,Michigan), and Veridian (Ann Arbor, Michigan). NASA’sCommercialization Remote Sensing Program funds the pro-ject, with the objective of prototyping and commercializingoperational tools from remote sensing for rangeland man-agement. After the summer rainy season, rangeland man-agers are provided with layers of data showing mesquiteand evergreen canopy cover, herbaceous cover, height, andbiomass. Software provided with the data can calculate
IPC_Grams_03-906 4/12/03 5:04 AM Page 8
682 J u n e 2 0 0 3
P H O T O G R A M M E T R I C E N G I N E E R I N G & R E M O T E S E N S I N G
cept method. The lidar data are an average of three 1-kmtransects over the same area. The difference in the averageheights between the ground and lidar measurements of thetransects ranged from 2.0 to 8.7 cm with the lidar measuredheights always being lower. There was no statistical differ-ence between the ground and lidar height measurements atthe 5 percent level of probability.
Studies in a south Texas mesquite [Prosopis glandulosaTorr.] stand at the ARS Kika de la Garza Subtropical Agri-cultural Research Center (Ritchie et al., 1992) and a desertrangeland in the ARS Walnut Gulch Experimental Water-shed (Weltz et al., 1994) have shown that the lidar measure-ments of vegetation heights and cover were highly corre-lated with ground measurements made with standard lineintercept techniques.
Large landscape features can also be quantified to esti-mate their effects on water flow and quality across thelandscape. The valley and channel associated with ReynoldsCreek near the outlet of the ARS Reynolds Creek Experimen-tal Watershed (Figure 6) were measured using two secondsof airborne lidar data. The profile shows a 140-m crosssection of the valley with the channel. The channel crosssection under the lower dashed line was calculated to be48.9 m2. Other stages for water flow could be assumed
Figure 5. Airborne laser measurements of (a) landscapefeatures and (b) vegetation heights for a 100-meter sec-tion of Reynolds Creek Watershed, near Boise, Idaho.
TABLE 1. COMPARISON OF GROUND AND LASER PROFILER MEASUREMENTS OF COVER AND HEIGHT FOR FIVE PLANT COMMUNITIES
IN THE ARS REYNOLDS CREEK WATERSHED.
Plant Cover2 Plant Cover3 Plant Height2 Plant Height3
Site Plant Name1 Ground (%) Laser (%) Ground (cm) Laser (cm)
Mountain Big Total Vegetation 86.3 76.04 37.5 � 17.8 34.2 � 18.4Sagebrush ARTRV 56.0 69.75
SYOR 4.0Forbs 20.3Grass 6.0
Ground 13.7Low Sagebrush Total Vegetation 54.3 60.4 19.7 � 13.2 17.7 � 15.2
ARAR 38.0 49.7Forbs-Other 4.3Grass 12.0
Ground 45.7Wyoming Big Total Vegetation 32.3 79.5 38.1 � 21.1 32.1 � 13.9
Sagebrush ATTRW 23.5 74.0SAVE 2.2Forbs-other 3.9Grass 2.7
Ground 67.7Bitterbrush Total Vegetation 75.9 79.8 45.5 � 30.1 36.8 � 18.3
ARTTW 25.0 74.4PUTR 15.5Forbs-other 14.2Grass 21.2
Ground 24.1Greasewood Total Vegetation 51.5 69.1 40.5 � 22.3 32.35 � 11.9
SAVE 16.8 61.8ARTRW 12.8Forbs-other 14.4Grass 7.5
Ground 48.5
1 VegetationARTRV-Mountain Big Sagebrush-[Artemisia tridentata subsp. vaseyana (Rydb.) Beetle] SYOR-Snow Berry-[Symphoricarpos oreophilus A. Gray] ARAR-Low Sagebrush-[Artemisia arbuscula Nutt.] ATTRW-Wyoming Big Sagebrush-[Artemisia tridentata subsp. wyomingensis Beetle & A. L. Young] SAVE-Greasewood-[Sarcobatus vermiculatus (Hook.) Torr.] PUTR-Bitterbrush-[Purshia tridentata (Pursh) DC.]
2 Average of six 30-m ground transects along an approximate 1-km line3 Average of three 1-km laser transects over approximately the same line as the ground transects4 Percent cover for all laser measurements5 Percent cover for laser measurements greater than 15 cm above the ground surface
IPC_Grams_03-906 4/12/03 5:04 AM Page 9
J u n e 2 0 0 3 683
P H O T O G R A M M E T R I C E N G I N E E R I N G & R E M O T E S E N S I N G
(Figure 6, upper dashed line) and their cross sections mea-sured to estimate channel/flood plain capacity. Channel/flood plain roughness can be measured to help calculateresistance to flow and potential flood area at differentstages. Cross sections of channels and gullies have beenmeasured at rangeland sites in Arizona and Oklahoma(Ritchie et al., 1993b; Ritchie et al., 1995) to quantify gully,channel, and flood plain roughness, and cross sections.Data on gully, channel, and flood plain cross sections,roughness, and degradation provide valuable data for thedesign and development of physical structures to controlflow, reduce bank erosion, and to calculate flows and arealextent of floods.
Airborne lidar altimeters can be used to measurelonger topographic profiles quickly and efficiently. At anairplane ground speed of 75 m per second, 4.5-km pro-files are measured each minute (240,000 lidar measure-ments) with the same detail as shown for short profiles.An example of a topographic profile of a mesquite cop-pice dune area at the ARS Jornada Experimental Range(Las Cruces, New Mexico) is shown in Figure 7 using ap-proximately 25 seconds of the lidar altimeter data. Theprofile is from an area with mesquite shrubs on top of thedunes and almost no vegetation between the dunes (Ritchieet al., 1998). The insert in Figure 7 is the full resolutionlidar data (no averaging) showing 1- to 3-m tall duneswith vegetation on them.
The profile shown in Figure 7 illustrates the topo-graphic data that can be collected with the lidar. While thelength of the profile shown is 1.8 km, profiles can be mea-sured and analyzed for any length. Greater spatial and ver-
tical detail on such profiles can be measured by usingsmaller block averages or all data points (Figure 7, insert).Ease and speed of data collection allow measurement ofseveral profiles over the same area with a minimum of extrasurvey cost. Such measurements of topography providedata for estimating aerodynamic roughness for understand-ing water and wind flow across the landscape (Menenti andRitchie, 1994).
While profiling lidars provide two-dimensional crosssections of topographic and vegetation features whichallow quantification of the landscape morphology, scan-ning lidars can provide measurements of three-dimen-sional shapes and areal distributions of landscape fea-tures. Scanning lidar data of a shrub-coppice dune area inthe desert grasslands of the ARS Jornada Experimental
Figure 6. Cross section measured by a laser altimeterof Reynolds Creek. The dotted line represents the topof the channel and the dashed line represents the floodplain. Area of the channel under the lower dotted line is48.94 m2.
Figure 7. Topographic profile measured using an air-borne laser altimeter of dunes at the Jornada Experi-mental Range near Las Cruces, New Mexico. The longprofile was made by block averaging 12 laser measure-ments; the short profile is not averaged.
Plate 5. Annual net primary production (g dwt m�2
year�1) of grasslands at the ARS Walnut Gulch Experi-mental Watershed. Remote sensing inputs from theLandsat (4 and 5) Thematic Mapper and Landsat 7 En-hanced Thematic Mapper Plus are coupled with climateand other data in an ecosystem model based on radia-tion use efficiency.
IPC_Grams_03-906 4/12/03 5:04 AM Page 10
684 J u n e 2 0 0 3
P H O T O G R A M M E T R I C E N G I N E E R I N G & R E M O T E S E N S I N G
Range was used to measure the morphological characteris-tics (height, perimeter, distribution) of coppice duneswith acceptable accuracy and precision for a range ofuses. Comparable ground-based measurements would betime-consuming if not impossible to collect. Scanninglidar data used in conjunction with land-cover classifica-tion from multispectral aerial videography or spectralscanners provide improved information on both the arealand the vertical variability of these dunes. The use ofsuch systems together is highly synergistic (Rango et al.,2000), and provides data on the spatial distribution of thedunes that is necessary for understanding the patterns ofdune development and movement.
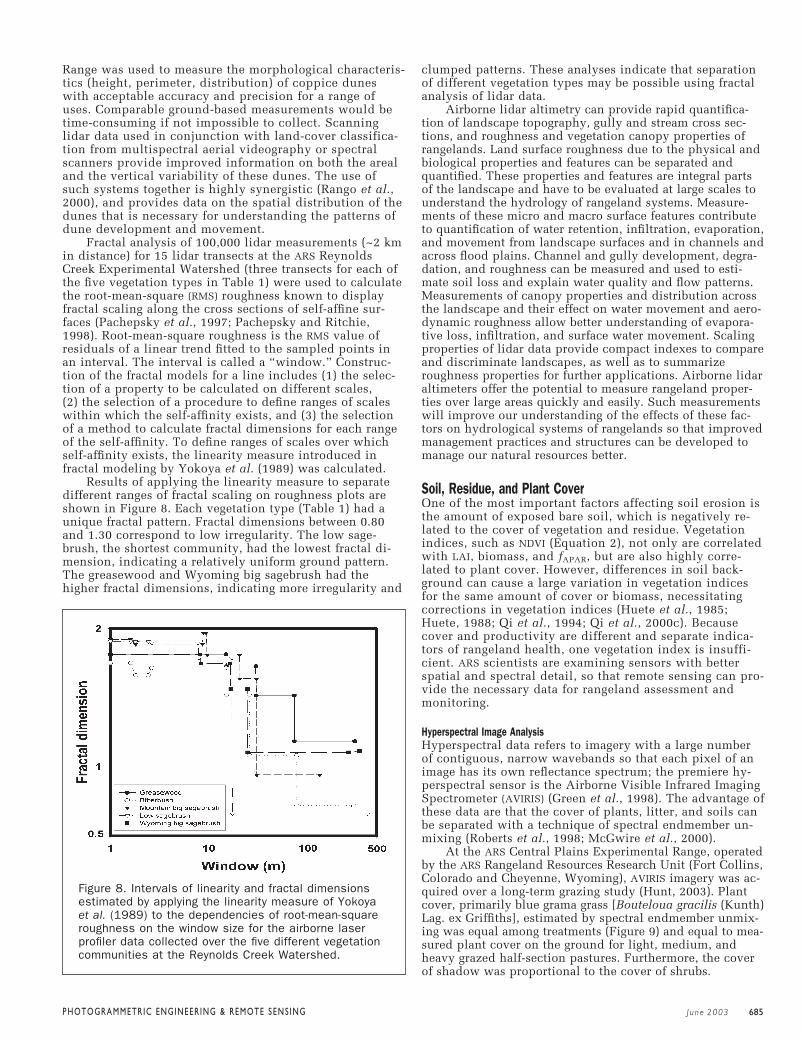
Fractal analysis of 100,000 lidar measurements (~2 kmin distance) for 15 lidar transects at the ARS ReynoldsCreek Experimental Watershed (three transects for each ofthe five vegetation types in Table 1) were used to calculatethe root-mean-square (RMS) roughness known to displayfractal scaling along the cross sections of self-affine sur-faces (Pachepsky et al., 1997; Pachepsky and Ritchie,1998). Root-mean-square roughness is the RMS value ofresiduals of a linear trend fitted to the sampled points inan interval. The interval is called a “window.” Construc-tion of the fractal models for a line includes (1) the selec-tion of a property to be calculated on different scales,(2) the selection of a procedure to define ranges of scaleswithin which the self-affinity exists, and (3) the selectionof a method to calculate fractal dimensions for each rangeof the self-affinity. To define ranges of scales over whichself-affinity exists, the linearity measure introduced infractal modeling by Yokoya et al. (1989) was calculated.
Results of applying the linearity measure to separatedifferent ranges of fractal scaling on roughness plots areshown in Figure 8. Each vegetation type (Table 1) had aunique fractal pattern. Fractal dimensions between 0.80and 1.30 correspond to low irregularity. The low sage-brush, the shortest community, had the lowest fractal di-mension, indicating a relatively uniform ground pattern.The greasewood and Wyoming big sagebrush had thehigher fractal dimensions, indicating more irregularity and
clumped patterns. These analyses indicate that separationof different vegetation types may be possible using fractalanalysis of lidar data.
Airborne lidar altimetry can provide rapid quantifica-tion of landscape topography, gully and stream cross sec-tions, and roughness and vegetation canopy properties ofrangelands. Land surface roughness due to the physical andbiological properties and features can be separated andquantified. These properties and features are integral partsof the landscape and have to be evaluated at large scales tounderstand the hydrology of rangeland systems. Measure-ments of these micro and macro surface features contributeto quantification of water retention, infiltration, evaporation,and movement from landscape surfaces and in channels andacross flood plains. Channel and gully development, degra-dation, and roughness can be measured and used to esti-mate soil loss and explain water quality and flow patterns.Measurements of canopy properties and distribution acrossthe landscape and their effect on water movement and aero-dynamic roughness allow better understanding of evapora-tive loss, infiltration, and surface water movement. Scalingproperties of lidar data provide compact indexes to compareand discriminate landscapes, as well as to summarizeroughness properties for further applications. Airborne lidaraltimeters offer the potential to measure rangeland proper-ties over large areas quickly and easily. Such measurementswill improve our understanding of the effects of these fac-tors on hydrological systems of rangelands so that improvedmanagement practices and structures can be developed tomanage our natural resources better.
Soil, Residue, and Plant CoverOne of the most important factors affecting soil erosion isthe amount of exposed bare soil, which is negatively re-lated to the cover of vegetation and residue. Vegetationindices, such as NDVI (Equation 2), not only are correlatedwith LAI, biomass, and fAPAR, but are also highly corre-lated to plant cover. However, differences in soil back-ground can cause a large variation in vegetation indicesfor the same amount of cover or biomass, necessitatingcorrections in vegetation indices (Huete et al., 1985;Huete, 1988; Qi et al., 1994; Qi et al., 2000c). Becausecover and productivity are different and separate indica-tors of rangeland health, one vegetation index is insuffi-cient. ARS scientists are examining sensors with betterspatial and spectral detail, so that remote sensing can pro-vide the necessary data for rangeland assessment andmonitoring.
Hyperspectral Image AnalysisHyperspectral data refers to imagery with a large numberof contiguous, narrow wavebands so that each pixel of animage has its own reflectance spectrum; the premiere hy-perspectral sensor is the Airborne Visible Infrared ImagingSpectrometer (AVIRIS) (Green et al., 1998). The advantage ofthese data are that the cover of plants, litter, and soils canbe separated with a technique of spectral endmember un-mixing (Roberts et al., 1998; McGwire et al., 2000).
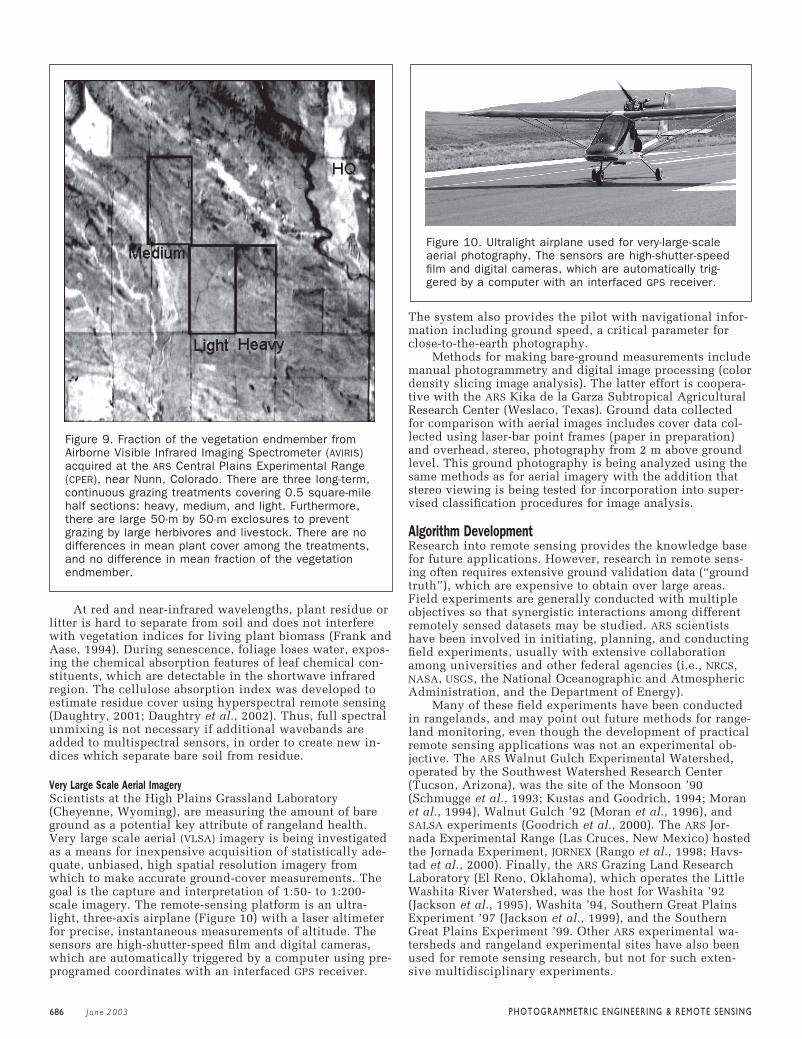
At the ARS Central Plains Experimental Range, operatedby the ARS Rangeland Resources Research Unit (Fort Collins,Colorado and Cheyenne, Wyoming), AVIRIS imagery was ac-quired over a long-term grazing study (Hunt, 2003). Plantcover, primarily blue grama grass [Bouteloua gracilis (Kunth)Lag. ex Griffiths], estimated by spectral endmember unmix-ing was equal among treatments (Figure 9) and equal to mea-sured plant cover on the ground for light, medium, andheavy grazed half-section pastures. Furthermore, the coverof shadow was proportional to the cover of shrubs.
Figure 8. Intervals of linearity and fractal dimensionsestimated by applying the linearity measure of Yokoyaet al. (1989) to the dependencies of root-mean-squareroughness on the window size for the airborne laserprofiler data collected over the five different vegetationcommunities at the Reynolds Creek Watershed.
IPC_Grams_03-906 4/12/03 5:04 AM Page 11
J u n e 2 0 0 3 685
P H O T O G R A M M E T R I C E N G I N E E R I N G & R E M O T E S E N S I N G
At red and near-infrared wavelengths, plant residue orlitter is hard to separate from soil and does not interferewith vegetation indices for living plant biomass (Frank andAase, 1994). During senescence, foliage loses water, expos-ing the chemical absorption features of leaf chemical con-stituents, which are detectable in the shortwave infraredregion. The cellulose absorption index was developed toestimate residue cover using hyperspectral remote sensing(Daughtry, 2001; Daughtry et al., 2002). Thus, full spectralunmixing is not necessary if additional wavebands areadded to multispectral sensors, in order to create new in-dices which separate bare soil from residue.
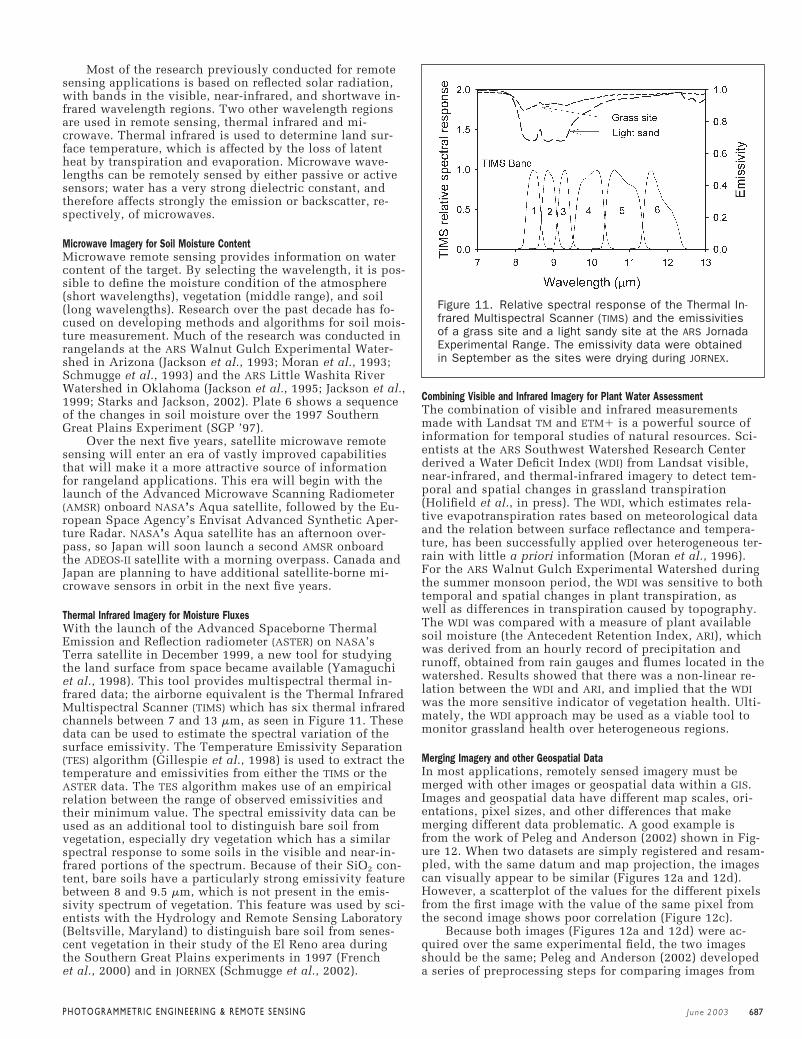
Very Large Scale Aerial ImageryScientists at the High Plains Grassland Laboratory(Cheyenne, Wyoming), are measuring the amount of bareground as a potential key attribute of rangeland health.Very large scale aerial (VLSA) imagery is being investigatedas a means for inexpensive acquisition of statistically ade-quate, unbiased, high spatial resolution imagery fromwhich to make accurate ground-cover measurements. Thegoal is the capture and interpretation of 1:50- to 1:200-scale imagery. The remote-sensing platform is an ultra-light, three-axis airplane (Figure 10) with a laser altimeterfor precise, instantaneous measurements of altitude. Thesensors are high-shutter-speed film and digital cameras,which are automatically triggered by a computer using pre-programed coordinates with an interfaced GPS receiver.
The system also provides the pilot with navigational infor-mation including ground speed, a critical parameter forclose-to-the-earth photography.
Methods for making bare-ground measurements includemanual photogrammetry and digital image processing (colordensity slicing image analysis). The latter effort is coopera-tive with the ARS Kika de la Garza Subtropical AgriculturalResearch Center (Weslaco, Texas). Ground data collectedfor comparison with aerial images includes cover data col-lected using laser-bar point frames (paper in preparation)and overhead, stereo, photography from 2 m above groundlevel. This ground photography is being analyzed using thesame methods as for aerial imagery with the addition thatstereo viewing is being tested for incorporation into super-vised classification procedures for image analysis.
Algorithm Development Research into remote sensing provides the knowledge basefor future applications. However, research in remote sens-ing often requires extensive ground validation data (“groundtruth”), which are expensive to obtain over large areas.Field experiments are generally conducted with multipleobjectives so that synergistic interactions among differentremotely sensed datasets may be studied. ARS scientistshave been involved in initiating, planning, and conductingfield experiments, usually with extensive collaborationamong universities and other federal agencies (i.e., NRCS,NASA, USGS, the National Oceanographic and AtmosphericAdministration, and the Department of Energy).
Many of these field experiments have been conductedin rangelands, and may point out future methods for range-land monitoring, even though the development of practicalremote sensing applications was not an experimental ob-jective. The ARS Walnut Gulch Experimental Watershed,operated by the Southwest Watershed Research Center(Tucson, Arizona), was the site of the Monsoon ’90(Schmugge et al., 1993; Kustas and Goodrich, 1994; Moranet al., 1994), Walnut Gulch ’92 (Moran et al., 1996), andSALSA experiments (Goodrich et al., 2000). The ARS Jor-nada Experimental Range (Las Cruces, New Mexico) hostedthe Jornada Experiment, JORNEX (Rango et al., 1998; Havs-tad et al., 2000). Finally, the ARS Grazing Land ResearchLaboratory (El Reno, Oklahoma), which operates the LittleWashita River Watershed, was the host for Washita ’92(Jackson et al., 1995), Washita ’94, Southern Great PlainsExperiment ’97 (Jackson et al., 1999), and the SouthernGreat Plains Experiment ’99. Other ARS experimental wa-tersheds and rangeland experimental sites have also beenused for remote sensing research, but not for such exten-sive multidisciplinary experiments.
Figure 9. Fraction of the vegetation endmember fromAirborne Visible Infrared Imaging Spectrometer (AVIRIS)acquired at the ARS Central Plains Experimental Range(CPER), near Nunn, Colorado. There are three long-term,continuous grazing treatments covering 0.5 square-milehalf sections: heavy, medium, and light. Furthermore,there are large 50-m by 50-m exclosures to preventgrazing by large herbivores and livestock. There are nodifferences in mean plant cover among the treatments,and no difference in mean fraction of the vegetationendmember.
Figure 10. Ultralight airplane used for very-large-scaleaerial photography. The sensors are high-shutter-speedfilm and digital cameras, which are automatically trig-gered by a computer with an interfaced GPS receiver.
IPC_Grams_03-906 4/12/03 5:04 AM Page 12
686 J u n e 2 0 0 3
P H O T O G R A M M E T R I C E N G I N E E R I N G & R E M O T E S E N S I N G
Most of the research previously conducted for remotesensing applications is based on reflected solar radiation,with bands in the visible, near-infrared, and shortwave in-frared wavelength regions. Two other wavelength regionsare used in remote sensing, thermal infrared and mi-crowave. Thermal infrared is used to determine land sur-face temperature, which is affected by the loss of latentheat by transpiration and evaporation. Microwave wave-lengths can be remotely sensed by either passive or activesensors; water has a very strong dielectric constant, andtherefore affects strongly the emission or backscatter, re-spectively, of microwaves.
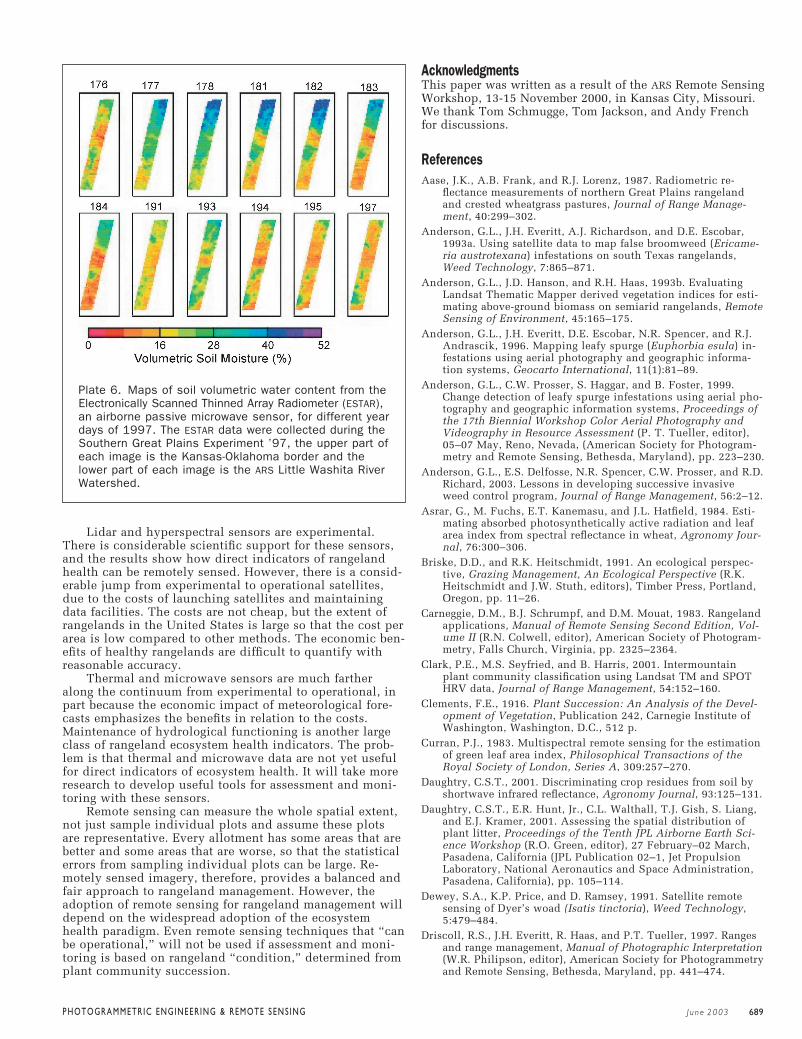
Microwave Imagery for Soil Moisture ContentMicrowave remote sensing provides information on watercontent of the target. By selecting the wavelength, it is pos-sible to define the moisture condition of the atmosphere(short wavelengths), vegetation (middle range), and soil(long wavelengths). Research over the past decade has fo-cused on developing methods and algorithms for soil mois-ture measurement. Much of the research was conducted inrangelands at the ARS Walnut Gulch Experimental Water-shed in Arizona (Jackson et al., 1993; Moran et al., 1993;Schmugge et al., 1993) and the ARS Little Washita RiverWatershed in Oklahoma (Jackson et al., 1995; Jackson et al.,1999; Starks and Jackson, 2002). Plate 6 shows a sequenceof the changes in soil moisture over the 1997 SouthernGreat Plains Experiment (SGP ’97).
Over the next five years, satellite microwave remotesensing will enter an era of vastly improved capabilitiesthat will make it a more attractive source of informationfor rangeland applications. This era will begin with thelaunch of the Advanced Microwave Scanning Radiometer(AMSR) onboard NASA’s Aqua satellite, followed by the Eu-ropean Space Agency’s Envisat Advanced Synthetic Aper-ture Radar. NASA’s Aqua satellite has an afternoon over-pass, so Japan will soon launch a second AMSR onboardthe ADEOS-II satellite with a morning overpass. Canada andJapan are planning to have additional satellite-borne mi-crowave sensors in orbit in the next five years.
Thermal Infrared Imagery for Moisture FluxesWith the launch of the Advanced Spaceborne ThermalEmission and Reflection radiometer (ASTER) on NASA’sTerra satellite in December 1999, a new tool for studyingthe land surface from space became available (Yamaguchiet al., 1998). This tool provides multispectral thermal in-frared data; the airborne equivalent is the Thermal InfraredMultispectral Scanner (TIMS) which has six thermal infraredchannels between 7 and 13 mm, as seen in Figure 11. Thesedata can be used to estimate the spectral variation of thesurface emissivity. The Temperature Emissivity Separation(TES) algorithm (Gillespie et al., 1998) is used to extract thetemperature and emissivities from either the TIMS or theASTER data. The TES algorithm makes use of an empiricalrelation between the range of observed emissivities andtheir minimum value. The spectral emissivity data can beused as an additional tool to distinguish bare soil fromvegetation, especially dry vegetation which has a similarspectral response to some soils in the visible and near-in-frared portions of the spectrum. Because of their SiO2 con-tent, bare soils have a particularly strong emissivity featurebetween 8 and 9.5 mm, which is not present in the emis-sivity spectrum of vegetation. This feature was used by sci-entists with the Hydrology and Remote Sensing Laboratory(Beltsville, Maryland) to distinguish bare soil from senes-cent vegetation in their study of the El Reno area duringthe Southern Great Plains experiments in 1997 (Frenchet al., 2000) and in JORNEX (Schmugge et al., 2002).
Combining Visible and Infrared Imagery for Plant Water AssessmentThe combination of visible and infrared measurementsmade with Landsat TM and ETM� is a powerful source ofinformation for temporal studies of natural resources. Sci-entists at the ARS Southwest Watershed Research Centerderived a Water Deficit Index (WDI) from Landsat visible,near-infrared, and thermal-infrared imagery to detect tem-poral and spatial changes in grassland transpiration(Holifield et al., in press). The WDI, which estimates rela-tive evapotranspiration rates based on meteorological dataand the relation between surface reflectance and tempera-ture, has been successfully applied over heterogeneous ter-rain with little a priori information (Moran et al., 1996).For the ARS Walnut Gulch Experimental Watershed duringthe summer monsoon period, the WDI was sensitive to bothtemporal and spatial changes in plant transpiration, aswell as differences in transpiration caused by topography.The WDI was compared with a measure of plant availablesoil moisture (the Antecedent Retention Index, ARI), whichwas derived from an hourly record of precipitation andrunoff, obtained from rain gauges and flumes located in thewatershed. Results showed that there was a non-linear re-lation between the WDI and ARI, and implied that the WDIwas the more sensitive indicator of vegetation health. Ulti-mately, the WDI approach may be used as a viable tool tomonitor grassland health over heterogeneous regions.
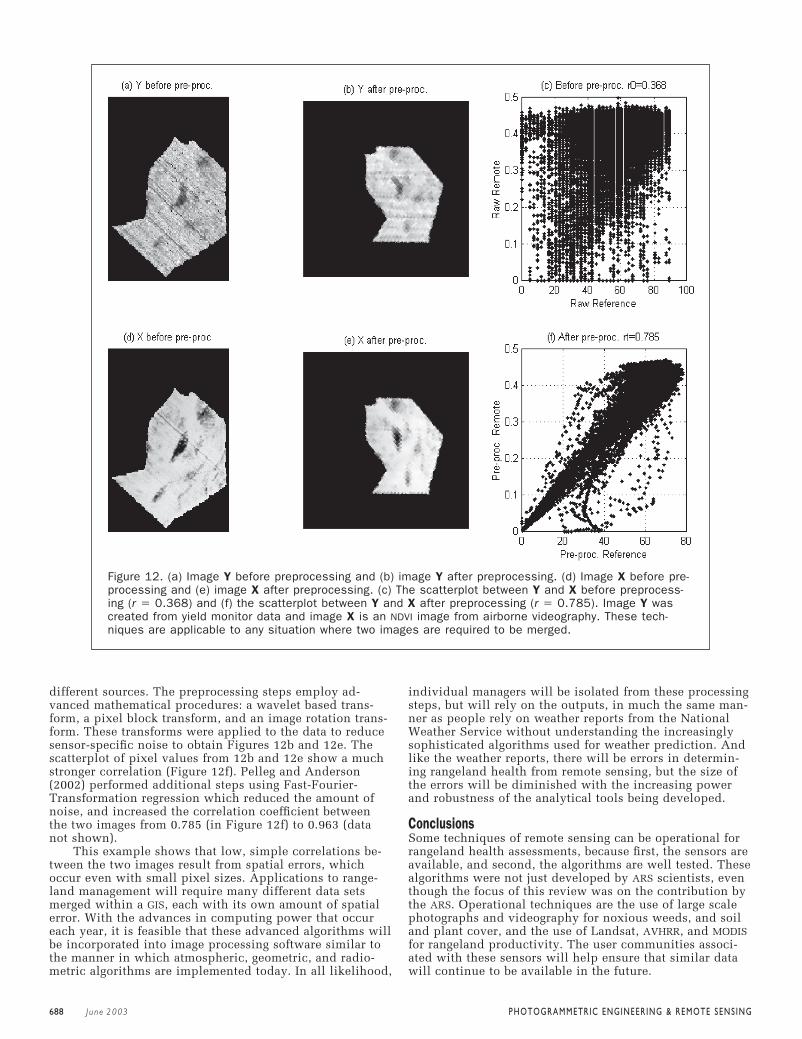
Merging Imagery and other Geospatial DataIn most applications, remotely sensed imagery must bemerged with other images or geospatial data within a GIS.Images and geospatial data have different map scales, ori-entations, pixel sizes, and other differences that makemerging different data problematic. A good example isfrom the work of Peleg and Anderson (2002) shown in Fig-ure 12. When two datasets are simply registered and resam-pled, with the same datum and map projection, the imagescan visually appear to be similar (Figures 12a and 12d).However, a scatterplot of the values for the different pixelsfrom the first image with the value of the same pixel fromthe second image shows poor correlation (Figure 12c).
Because both images (Figures 12a and 12d) were ac-quired over the same experimental field, the two imagesshould be the same; Peleg and Anderson (2002) developeda series of preprocessing steps for comparing images from
Figure 11. Relative spectral response of the Thermal In-frared Multispectral Scanner (TIMS) and the emissivitiesof a grass site and a light sandy site at the ARS JornadaExperimental Range. The emissivity data were obtainedin September as the sites were drying during JORNEX.
IPC_Grams_03-906 4/12/03 5:04 AM Page 13
J u n e 2 0 0 3 687
P H O T O G R A M M E T R I C E N G I N E E R I N G & R E M O T E S E N S I N G
different sources. The preprocessing steps employ ad-vanced mathematical procedures: a wavelet based trans-form, a pixel block transform, and an image rotation trans-form. These transforms were applied to the data to reducesensor-specific noise to obtain Figures 12b and 12e. Thescatterplot of pixel values from 12b and 12e show a muchstronger correlation (Figure 12f). Pelleg and Anderson(2002) performed additional steps using Fast-Fourier-Transformation regression which reduced the amount ofnoise, and increased the correlation coefficient betweenthe two images from 0.785 (in Figure 12f) to 0.963 (datanot shown).
This example shows that low, simple correlations be-tween the two images result from spatial errors, whichoccur even with small pixel sizes. Applications to range-land management will require many different data setsmerged within a GIS, each with its own amount of spatialerror. With the advances in computing power that occureach year, it is feasible that these advanced algorithms willbe incorporated into image processing software similar tothe manner in which atmospheric, geometric, and radio-metric algorithms are implemented today. In all likelihood,
individual managers will be isolated from these processingsteps, but will rely on the outputs, in much the same man-ner as people rely on weather reports from the NationalWeather Service without understanding the increasinglysophisticated algorithms used for weather prediction. Andlike the weather reports, there will be errors in determin-ing rangeland health from remote sensing, but the size ofthe errors will be diminished with the increasing powerand robustness of the analytical tools being developed.
ConclusionsSome techniques of remote sensing can be operational forrangeland health assessments, because first, the sensors areavailable, and second, the algorithms are well tested. Thesealgorithms were not just developed by ARS scientists, eventhough the focus of this review was on the contribution bythe ARS. Operational techniques are the use of large scalephotographs and videography for noxious weeds, and soiland plant cover, and the use of Landsat, AVHRR, and MODISfor rangeland productivity. The user communities associ-ated with these sensors will help ensure that similar datawill continue to be available in the future.
Figure 12. (a) Image Y before preprocessing and (b) image Y after preprocessing. (d) Image X before pre-processing and (e) image X after preprocessing. (c) The scatterplot between Y and X before preprocess-ing (r � 0.368) and (f) the scatterplot between Y and X after preprocessing (r � 0.785). Image Y wascreated from yield monitor data and image X is an NDVI image from airborne videography. These tech-niques are applicable to any situation where two images are required to be merged.
IPC_Grams_03-906 4/12/03 5:04 AM Page 14
688 J u n e 2 0 0 3
P H O T O G R A M M E T R I C E N G I N E E R I N G & R E M O T E S E N S I N G
Lidar and hyperspectral sensors are experimental.There is considerable scientific support for these sensors,and the results show how direct indicators of rangelandhealth can be remotely sensed. However, there is a consid-erable jump from experimental to operational satellites,due to the costs of launching satellites and maintainingdata facilities. The costs are not cheap, but the extent ofrangelands in the United States is large so that the cost perarea is low compared to other methods. The economic ben-efits of healthy rangelands are difficult to quantify withreasonable accuracy.
Thermal and microwave sensors are much fartheralong the continuum from experimental to operational, inpart because the economic impact of meteorological fore-casts emphasizes the benefits in relation to the costs.Maintenance of hydrological functioning is another largeclass of rangeland ecosystem health indicators. The prob-lem is that thermal and microwave data are not yet usefulfor direct indicators of ecosystem health. It will take moreresearch to develop useful tools for assessment and moni-toring with these sensors.
Remote sensing can measure the whole spatial extent,not just sample individual plots and assume these plotsare representative. Every allotment has some areas that arebetter and some areas that are worse, so that the statisticalerrors from sampling individual plots can be large. Re-motely sensed imagery, therefore, provides a balanced andfair approach to rangeland management. However, theadoption of remote sensing for rangeland management willdepend on the widespread adoption of the ecosystemhealth paradigm. Even remote sensing techniques that “canbe operational,” will not be used if assessment and moni-toring is based on rangeland “condition,” determined fromplant community succession.
AcknowledgmentsThis paper was written as a result of the ARS Remote SensingWorkshop, 13-15 November 2000, in Kansas City, Missouri.We thank Tom Schmugge, Tom Jackson, and Andy Frenchfor discussions.
ReferencesAase, J.K., A.B. Frank, and R.J. Lorenz, 1987. Radiometric re-
flectance measurements of northern Great Plains rangelandand crested wheatgrass pastures, Journal of Range Manage-ment, 40:299–302.
Anderson, G.L., J.H. Everitt, A.J. Richardson, and D.E. Escobar,1993a. Using satellite data to map false broomweed (Ericame-ria austrotexana) infestations on south Texas rangelands,Weed Technology, 7:865–871.
Anderson, G.L., J.D. Hanson, and R.H. Haas, 1993b. EvaluatingLandsat Thematic Mapper derived vegetation indices for esti-mating above-ground biomass on semiarid rangelands, RemoteSensing of Environment, 45:165–175.
Anderson, G.L., J.H. Everitt, D.E. Escobar, N.R. Spencer, and R.J.Andrascik, 1996. Mapping leafy spurge (Euphorbia esula) in-festations using aerial photography and geographic informa-tion systems, Geocarto International, 11(1):81–89.
Anderson, G.L., C.W. Prosser, S. Haggar, and B. Foster, 1999.Change detection of leafy spurge infestations using aerial pho-tography and geographic information systems, Proceedings ofthe 17th Biennial Workshop Color Aerial Photography andVideography in Resource Assessment (P. T. Tueller, editor),05–07 May, Reno, Nevada, (American Society for Photogram-metry and Remote Sensing, Bethesda, Maryland), pp. 223–230.
Anderson, G.L., E.S. Delfosse, N.R. Spencer, C.W. Prosser, and R.D.Richard, 2003. Lessons in developing successive invasiveweed control program, Journal of Range Management, 56:2–12.
Asrar, G., M. Fuchs, E.T. Kanemasu, and J.L. Hatfield, 1984. Esti-mating absorbed photosynthetically active radiation and leafarea index from spectral reflectance in wheat, Agronomy Jour-nal, 76:300–306.
Briske, D.D., and R.K. Heitschmidt, 1991. An ecological perspec-tive, Grazing Management, An Ecological Perspective (R.K.Heitschmidt and J.W. Stuth, editors), Timber Press, Portland,Oregon, pp. 11–26.
Carneggie, D.M., B.J. Schrumpf, and D.M. Mouat, 1983. Rangelandapplications, Manual of Remote Sensing Second Edition, Vol-ume II (R.N. Colwell, editor), American Society of Photogram-metry, Falls Church, Virginia, pp. 2325–2364.
Clark, P.E., M.S. Seyfried, and B. Harris, 2001. Intermountainplant community classification using Landsat TM and SPOTHRV data, Journal of Range Management, 54:152–160.
Clements, F.E., 1916. Plant Succession: An Analysis of the Devel-opment of Vegetation, Publication 242, Carnegie Institute ofWashington, Washington, D.C., 512 p.
Curran, P.J., 1983. Multispectral remote sensing for the estimationof green leaf area index, Philosophical Transactions of theRoyal Society of London, Series A, 309:257–270.
Daughtry, C.S.T., 2001. Discriminating crop residues from soil byshortwave infrared reflectance, Agronomy Journal, 93:125–131.
Daughtry, C.S.T., E.R. Hunt, Jr., C.L. Walthall, T.J. Gish, S. Liang,and E.J. Kramer, 2001. Assessing the spatial distribution ofplant litter, Proceedings of the Tenth JPL Airborne Earth Sci-ence Workshop (R.O. Green, editor), 27 February–02 March,Pasadena, California (JPL Publication 02–1, Jet PropulsionLaboratory, National Aeronautics and Space Administration,Pasadena, California), pp. 105–114.
Dewey, S.A., K.P. Price, and D. Ramsey, 1991. Satellite remotesensing of Dyer’s woad (Isatis tinctoria), Weed Technology,5:479–484.
Driscoll, R.S., J.H. Everitt, R. Haas, and P.T. Tueller, 1997. Rangesand range management, Manual of Photographic Interpretation(W.R. Philipson, editor), American Society for Photogrammetryand Remote Sensing, Bethesda, Maryland, pp. 441–474.
Plate 6. Maps of soil volumetric water content from theElectronically Scanned Thinned Array Radiometer (ESTAR),an airborne passive microwave sensor, for different yeardays of 1997. The ESTAR data were collected during theSouthern Great Plains Experiment ’97, the upper part ofeach image is the Kansas-Oklahoma border and thelower part of each image is the ARS Little Washita RiverWatershed.
IPC_Grams_03-906 4/12/03 5:04 AM Page 15
J u n e 2 0 0 3 689
P H O T O G R A M M E T R I C E N G I N E E R I N G & R E M O T E S E N S I N G
Dyksterhuis, E.J., 1949. Condition and management of range landbased on quantitative ecology, Journal of Range Management,2:104–115.
Eidenshink, J.C., 1992. The 1990 Conterminous U. S. AVHRR dataset, Photogrammetric Engineering & Remote Sensing, 58:809–813.
Eidenshink, J.E., and J.L. Fuandeen, 1994. The 1-km AVHRRglobal land data set: first stages in implementation, Interna-tional Journal of Remote Sensing, 15:3443–3462.
Everitt, J.H., 1985. Using aerial photography for detecting black-brush (Acacia rigidula) on south Texas rangelands, Journal ofRange Management, 38:228–231.
Everitt, J.H., S.J. Ingle, H.W. Gausman, and H.S. Mayeux, Jr., 1984.Detection of false broomweed (Ericameria austrotexana) byaerial photography, Weed Science, 32:621–624.
Everitt, J.H., M.A. Hussey, D.E. Escobar, P.R. Nixon, and B. Pinker-ton, 1986. Assessment of grassland phytomass with airbornevideo imagery, Remote Sensing of Environment, 20:299–306.
Everitt, J.H., R.D. Pettit, and M.A. Alaniz, 1987. Remote sensing ofbroom snakeweed (Gutierrezia sarothrae) and spiny aster(Aster spinosus), Weed Science, 35:295–302.
Everitt, J.H., and R. Villarreal, 1987. Detecting huisache (Acaciafarnesiana) and Mexican palo-verde (Parkinsonia aculeata) byaerial photography, Weed Science, 35:427–432.
Everitt, J.H., D.E. Escobar, and A.J. Richardson, 1989. Estimatinggrassland phytomass production with near-infrared and mid-infrared spectral variables, Remote Sensing of Environment,30:257–261.
Everitt, J.H., M.A. Alaniz, D.E. Escobar, and M.R. Davis, 1992.Using remote sensing to distinguish common (Isocomacoronopifolia) and Drummond goldenweed (Isocoma drum-mondii), Weed Science, 40:621–628.
Everitt, J.H., D.E. Escobar, R. Villarreal, M.A. Alaniz, and M.R.Davis, 1993a. Canopy light reflectance and remote sensing ofshin oak (Quercus havardii) and associated vegetation, WeedScience, 41:291–297.
———, 1993b. Integration of airborne video, global positioningsystem, and geographic information system technologies fordetecting and mapping two woody legumes on rangelands,Weed Technology, 7:981–987.
Everitt, J.H., J.V. Richerson, M.A. Alaniz, D.E. Escobar, R. Villar-real, and M.R. Davis, 1994. Light reflectance characteristicsand remote sensing of Big Bend loco (Astragalus mollissimusvar. earlei) and Wooton loco (Astragalus wootonii), Weed Sci-ence, 42:115–122.
Everitt, J.H., G.L. Anderson, D.E. Escobar, M.R. Davis, N.R.Spencer, and R.J. Andrascik, 1995a. Using remote sensing fordetecting and mapping leafy spurge (Euphorbia esula), WeedTechnology, 9:599–609.
Everitt, J.H., D.E. Escobar, and M.R. Davis, 1995b. Using remotesensing for detecting and mapping noxious plants, Weed Ab-stracts, 44:639–649.
Everitt, J.H., D.E. Escobar, M.A. Alaniz, M.R. Davis, and J.V. Rich-erson, 1996. Using spatial information technologies to mapChinese tamarisk, Weed Science, 44:194–201.
Everitt, J.H., D.E. Escobar, and M.R. Davis, 2001a. Reflectance andimage characteristics of selected noxious rangeland species,Journal of Range Management, 54(suppl):A106–A120.
Everitt, J.H., C. Yang, B.J. Racher, C.M. Briton, and M.R. Davis,2001b. Remote sensing of redberry juniper in the TexasRolling Plains, Journal of Range Management, 54:254–259.
Ezra, C.E., L.R. Tinney, and R.D. Jackson, 1984. Effect of soil back-ground on vegetation discrimination using Landsat data, Re-mote Sensing of Environment, 16:233–242.
Follett, R.F., J.M. Kimble, and R. Lal (editors), 2001. The Potential ofU.S. Grazing Lands to Sequester Carbon and Mitigate the Green-house Effect, Lewis Publishers, Boca Raton, Florida, 442 p.
Frank, A.B., and J.K. Aase, 1994. Residue effects on radiometricreflectance measurements of northern Great Plains rangelands,Remote Sensing of Environment, 49:195–199.
French, A.N., T.J. Schmugge, and W.P. Kustas, 2000. Discrimina-tion of senescent vegetation using thermal emissivity contrast,Remote Sensing of Environment, 74(2):249–254.
Friedel, M.H., 1991. Range condition assessment and the conceptof thresholds: A viewpoint, Journal of Range Management,44:422–426.
Gates, D.M., H.J. Keegan, J.C. Schleter, and V.R. Weidner, 1965.Spectral properties of plants, Applied Optics, 4:11–20.
Gausman, H.W., J.H. Everitt, A.H. Gerbermann, and R.L. Bowen,1977a. Canopy reflectance and film image relations amongthree south Texas rangeland plants, Journal of Range Manage-ment, 30:449–450.
Gausman, H.W., R.M. Menges, D.E. Escobar, J.H. Everitt, and R.L.Bowen, 1977b. Pubescence affects spectra and imagery of sil-verleaf sunflower (Helianthus argophyllus), Weed Science,25:437–440.
Gillespie, A.S. Rokugawa, T. Matsunaga, J.S. Cothern, S. Hook,and A.B. Kahle, 1998. A temperature and emissivity separa-tion algorithm for Advanced Spaceborne Thermal Emissionand Reflection Radiometer (ASTER) images, IEEE Transactionson Geoscience and Remote Sensing, 36:1113–1126.
Goetz, S.J., and S.D. Prince, 1999. Modelling terrestrial carbon ex-change and storage: Evidence and implications of functionalconvergence in light-use efficiency, Advances in EcologicalResearch, 28:57–92.
Goodrich, D.C., A. Chehbouni, B. Goff, B. MacNish, T. Maddock,S. Moran, and 63 additional authors, 2000. Preface paper tothe semi-arid land-surface-atmosphere (SALSA) program spe-cial issue, Agricultural and Forest Meteorology, 105:3–20.
Goward, S.N., and K.F. Huemmrich, 1992. Vegetation canopyIPAR absorptance and the normalized difference vegetationindex: An assessment using the SAIL model, Remote Sensingof Environment, 39:119–140.
Gower, S.T., C.J. Kucharik, and J.M. Norman, 1999. Direct and in-direct estimation of leaf area index, fapar, and net primary pro-duction of terrestrial ecosystems, Remote Sensing of Environ-ment, 70:29–51.
Green, R.O., M.L. Eastwood, and O. Williams, 1998. Imaging Spec-troscopy and the Airborne Visible Infrared Imaging Spectrom-eter (AVIRIS), Remote Sensing of Environment, 65:227–248.
Hatfield, J.L., G. Asrar, and E.T. Kanemasu, 1984. Intercepted pho-tosynthetically active radiation estimated by spectral re-flectance, Remote Sensing of Environment, 14:65–75.
Hatfield, J.L., E.T. Kanemasu, G. Asrar, R.D. Jackson, P.J. Pinter,Jr., R.J. Reginato, and S.B. Idso, 1985. Leaf-area estimates fromspectral measurements over various planting dates of wheat,International Journal of Remote Sensing, 6:167–175.
Havstad, K.M., W.P. Kustas, A. Rango, J.C. Ritchie, and T.J.Schmugge, 2000. Jornada Experimental Range: A unique aridland location for experiments to validate satellite systems andto understand effects of climate change, Remote Sensing ofEnvironment, 74:13–25.
Holecheck, J.L., 1988. An approach for setting the stocking rate,Rangelands, 10(1):10–14.
Holifield, C.D., S. McElroy, M.S. Moran, R. Bryant, and T. Miura,in press. Temporal and spatial changes in grassland transpira-tion detected using Landsat TM and ETM� Imagery, Cana-dian Journal of Remote Sensing.
Huete, A.R., 1988. A soil-adjusted vegetation index (SAVI), Re-mote Sensing of Environment, 25:295–309.
Huete, A.R., R.D. Jackson, and D.F. Post, 1985. Spectral responseof a plant canopy with different soil backgrounds, RemoteSensing of Environment, 17:37–53.
Hunt, E.R., Jr., 1994. Relationship between woody biomass andPAR conversion efficiency for estimating net primary produc-tion from NDVI, International Journal of Remote Sensing,15:1725–1730.
———, 2003. Leaf area index and cover of shortgrass steppeusing AVIRIS imagery, Proceedings of the Eleventh JPL Air-borne Earth Science Workshop (R.O. Green, editor), 05-08March 2002, Pasadena, California (Jet Propulsion Laboratory,National Aeronautics and Space Administration, Pasadena,California).
Hunt, E.R., Jr., and S.W. Running, 1992. Simulated dry matteryields for aspen and spruce stands in the North American bo-real forest, Canadian Journal of Remote Sensing, 18:126–133.
IPC_Grams_03-906 4/12/03 5:04 AM Page 16
690 J u n e 2 0 0 3
P H O T O G R A M M E T R I C E N G I N E E R I N G & R E M O T E S E N S I N G
Jackson, T.J., D.M. Le Vine, A.J. Griffis, D.C. Goodrich, T.J.Schmugge, C.T. Swift, and P.E. O’Neill, 1993. Soil moistureand rainfall estimation over a semiarid environment with theESTAR microwave radiometer, IEEE Transactions on Geo-science and Remote Sensing, 31:836–841.
Jackson, T.J., D.M. Le Vine, C.T. Swift, T.J. Schmugge, and F.R.Schiebe, 1995. Large scale mapping of soil moisture using theESTAR passive microwave radiometer in Washita ’92, RemoteSensing of Environment, 53:27–37.
Jackson, T.J., D.M. Le Vine, A.Y. Hsu, A. Oldak, P.J. Starks, C.T.Swift, J.D. Isham, and M. Haken, 1999. Soil moisture mappingat regional scales: The Southern Great Plains Hydrology Ex-periment, IEEE Transactions on Geoscience and Remote Sens-ing, 37:2136–2151.
James, L.F., R.F. Keeler, A.E. Johnson, M.C. Williams, E.M.Cronin, and J.D. Olsen, 1980. Plants Poisonous to Livestock inthe Western United States, Agricultural Information Bulletin415, U.S. Department of Agriculture, Washington, D.C., 90 p.
Kiniry, J.R., C.R. Tischler, and G.A. Van Esbroeck, 1999. Radiationuse efficiency and leaf CO2 exchange for diverse C4 grasses,Biomass and Bioenergy, 17:95–112.
King, D., 1995. Airborne multispectral digital camera and videosensors, Canadian Journal of Remote Sensing, 21:245–273.
Knipling, E.B., 1970. Physical and physiological basis for the re-flectance of visible and near-infrared radiation from vegeta-tion, Remote Sensing of Environment, 1:155–159.
Kokaly, R.F., R.R. Root, K. Brown, G.L. Anderson, and S. Hager, inpress. Calibration of Compact Airborne Spectrographic Imager(CASI) data to surface reflectance at Theodore Roosevelt Na-tional Park for mapping invasive species, International Jour-nal of Remote Sensing.
Krabill, W.B., J.G. Collins, L.E. Link, R.N. Swift, and M.L. Butler,1984. Airborne laser topographic mapping results, Photogram-metry Engineering & Remote Sensing, 50:685–694.
Kumar, M., and J.L. Monteith, 1981. Remote sensing of cropgrowth, Plants and the Daylight Spectrum (H. Smith, editor),Academic Press, London, United Kingdom, pp. 133–144.
Kustas, W.P., and D.C. Goodrich, 1994. Preface MONSOON ’90Multidisciplinary Experiment, Water Resources Research,30:1211–1225.
Landsberg, J.J., and R.H. Waring, 1997. A generalised model of for-est productivity using simplified concepts of radiation-use ef-ficiency, carbon balance and partitioning, Forest Ecology andManagement, 95:209–228.
Lass, L.W., and R.H. Callihan, 1997. The effect of phenological stageon detectability of yellow hawkweed (Heiracium pratense) andoxeye daisy (Chrysanthemum leucanthemum) with remote mul-tispectral digital imagery, Weed Technology, 11:248–256.
Lass, L.W., H.W. Carson, and R.H. Callihan, 1996. Detection ofyellow starthistle (Centaurea solstitialis) and common St.Johnswort (Hypericum perforatum) with multispectral digitalimagery, Weed Technology, 10:466–474.
Laycock, W.A., 1991. Stable states and thresholds of range condi-tion on North American rangelands: A viewpoint, Journal ofRange Management, 44:427–433.
Liu, W.T., and F.N. Kogan, 1996. Monitoring regional droughtusing the Vegetation Condition Index, International Journal ofRemote Sensing, 17:2761–2782.
Mausel, P.W. (editor), 1995. Proceedings 15th Biennial Workshopon Videography and Color Photography in Resource Assess-ment, 01–03 May, Terre Haute, Indiana (American Society ofPhotogrammetry and Remote Sensing, Bethesda, Maryland),372 p.
Mayeux, H.S., Jr., and C.J. Scifres, 1978. Goldenweeds-New peren-nial range weed problems, Rangelands, 5:91–93.
———, 1981. Drummond’s goldenweed and its control with herbi-cides, Journal of Range Management, 34:98–101.
McGwire, K., T. Minor, and L. Fenstermaker, 2000. Hyperspectralmixture modeling for quantifying sparse vegetation cover in aridenvironments, Remote Sensing of Environment, 72:360–374.
Menenti, M., and J.C. Ritchie, 1994. Estimation of effective aerody-namic roughness of Walnut Gulch watershed with laser altime-ter measurements, Water Resources Research, 30(5):1329–1337.
Millington, A.C., J. Wellens, J.J. Settle, and R.J. Saull, 1994. Ex-plaining and monitoring land cover dynamics in drylandsusing multitemporal analysis of NOAA AVHRR imagery, Envi-ronmental Remote Sensing from Regional to Global Scales (G.Foody and P. Curran, editors), John Wiley & Sons, Chichester,United Kingdom, pp. 16–43.
Monteith, J.L., 1977. Climate and the efficiency of crop productionin Britain, Philosophical Transactions of the Royal Society ofLondon, Series B, 281:277–294.
Moran, M.S., D.C. Hymer, J. Qi, and E.E. Sano, 1993. Soil moistureevaluation using Synthetic Aperture Radar (SAR) and opticalremote sensing in semiarid rangeland, Agricultural and ForestMeteorology, 105:69–80.
Moran, M.S., T.R. Clarke, W.P. Kustas, M. Weltz, S.A. Amer, andA.R. Huete, 1994. Evaluation of hydrologic parameters insemi-arid rangeland using remotely sensed spectral data,Water Resources Research, 30:1287–1297.
Moran, M.S., A.F. Rahman, J.C. Washburne, D.C. Goodrich, M.A.Weltz, and W.P. Kustas, 1996. Combining the Penman-Monteithequation with measurements of surface temperature and re-flectance to map regional evaporation rates, Agricultural andForest Meteorology, 80:87–109.
Myneni, R.B., and D.L. Williams, 1994. On the relationship be-tween FAPAR and NDVI, Remote Sensing of Environment,49:200–211.
Nouvellon, Y., D. Lo Seen, S. Rambal, A. Bégué, M.S. Moran, Y.Kerr, and J. Qi, 2000. Time course of radiation use efficiencyin a shortgrass ecosystem: Consequences for remotely sensedestimation of primary production, Remote Sensing of Environ-ment, 71:43–55.
Nouvellon, Y., M.S. Moran, D. Lo Seen, R. Bryant, S. Rambal, W.Ni, A. Bégué, A. Chehbouni, W.E. Emmerich, P. Heilman, andJ. Qi, 2001. Coupling a grassland ecosystem model with Land-sat imagery for a 10-year simulation of carbon and water bud-gets, Remote Sensing of Environment, 78:131–149.
NRC, 1994. Rangeland Health, New Methods to Classify, Inventoryand Monitor Rangelands, National Research Council, NationalAcademy Press, Washington, D.C., 180 p.
NRCS, 1994. National Resources Inventory Highlights, Natural Re-sources Conservation Service, United States Department ofAgriculture, Washington, D.C., 4 p.
———, 1997. National Range and Pasture Handbook, GrazingLands Technology Institute, Natural Resource ConservationService, United States Department of Agriculture, Washington,D.C., 448 p.
Pachepsky, Y.A., J.C. Ritchie, and D. Gimenez, 1997. Fractal mod-eling of airborne laser altimetry data, Remote Sensing of Envi-ronment, 61:150–161.
Pachepsky, Y.A., and J.C. Ritchie, 1998. Seasonal changes in frac-tal landscape surface roughness estimated from airborne laseraltimetry data, International Journal of Remote Sensing,19(13):2509–2516.
Parker Williams, A., and E.R. Hunt, Jr., 2002. Estimation of leafyspurge cover from hyperspectral imagery using mixture-tunedmatched filtering, Remote Sensing of Environment, 82:446–456.
Peleg, K., and G.L. Anderson, 2002. FFT regression and cross-noise reduction for comparing images in remote sensing, In-ternational Journal of Remote Sensing, 23:2097–2124.
Pellant, M., P. Shaver, and K. Spaeth, 1999. Field test of a proto-type rangeland inventory procedure in the western USA, Pro-ceedings of the VI International Rangeland Congress, Peopleand Rangelands, Building the Future, Volume 2 (D. Eldridgeand D. Freudenberger, editors), 19-23 July, Townsville, Aus-tralia (VI International Rangeland Congress, Aitkenvale,Queensland, Australia), pp. 766–767.
Pellant, M., P. Shaver, D.A. Pyke, and J.E. Herrick, 2000. Interpret-ing Indicators of Rangeland Health (Version 3), Technical Ref-erence 1734-6, National Science and Technology Center, Bu-reau of Land Management, United States Department ofInterior, Denver, Colorado, 130 p.
Price, J.C., 1993. Estimating leaf area index from satellite data,IEEE Transactions on Geoscience and Remote Sensing,31:727–734.
IPC_Grams_03-906 4/12/03 5:04 AM Page 17
J u n e 2 0 0 3 691
P H O T O G R A M M E T R I C E N G I N E E R I N G & R E M O T E S E N S I N G
Price, J.C., and W.C. Bausch, 1995. Leaf area index estimationfrom visible and near-infrared reflectance data, Remote Sens-ing of Environment, 52:55–65.
Prince, S.D., 1991. A model of regional primary production for usewith coarse resolution satellite data, International Journal ofRemote Sensing, 12:1313–1330.
Prince, S.D., and S.N. Goward, 1995. Global primary production: aremote sensing approach, Journal of Biogeography, 22:815-835.
Qi, J., A. Chehbouni, A.R. Huete, Y.H. Kerr, and S. Sorooshian,1994. A modified soil adjusted vegetation index, Remote Sens-ing of Environment, 48:119–126.
Qi, J., R.C. Marsett, and P. Heilman, 2000a. Rangeland vegetationcover estimation from remotely sensed data, Proceedings of theSecond International Conference on Geospatial Informationin Agriculture and Forestry, 10–12 January, Lake Buena Vista,Florida (ERIM International, Ann Arbor, Michigan), 2:243–252.
Qi, J., R.C. Marsett, M.S. Moran, D.C. Goodrich, P. Heilman, Y.H.Kerr, G. Dedieu, A. Chehbouni, and X.X. Zhang, 2000b. Spa-tial and temporal dynamics of vegetation in the San PedroRiver Basin Area, Agricultural and Forest Meteorology,105:55–68.
Qi, J., Y.H. Kerr, M.S. Moran, M. Weltz, A.R. Huete, S.Sorooshian, and R. Bryant, 2000c. Leaf area index estimatesusing remotely sensed data and BRDF models in a semiaridregion, Remote Sensing of Environment, 73:18–30.
Quimby, P.C., Jr., and L. Wendel, 1997. The Ecological Area-WideManagement (TEAM) - Leafy Spurge, USDA Agricultural Re-search Service, Sidney, Montana, 51 p.
Rango, A., J.C. Ritchie, W.P. Kustas, T.J. Schmugge, K.S. Humes,L.E. Hipps, J.H. Prueger, and K.M. Havstad, 1998. JORNEX: Amultidisciplinary remote sensing campaign to quantify plantcommunity/atmospheric interactions in the northern Chi-huahuan desert of New Mexico, Hydrology in a Changing En-vironment (H. Wheater and C. Kirby, editors), John Wiley,London, United Kingdom, pp. 585–590.
Rango, A., M.J. Chopping, J.C. Ritchie, K.M. Havstad, W.P. Kustas,and T.J. Schmugge, 2000. Morphological characteristics ofshrub-coppice dunes in desert grasslands of southern NewMexico derived from scanning lidar, Remote Sensing of Envi-ronment, 74:26–44.
Rees, N.E., and N.R. Spencer, 1991. Biological control of leafyspurge, Noxious Range Weeds, (L.F. James, J.O. Evans, M.H.Ralphs, and R.D. Child, editors), Westview Press, Boulder,Colorado, pp. 182–192.
Reeves, M.C., J.C. Winslow, and S.W. Running, 2001. Mappingweekly rangeland vegetation productivity, Journal of RangeManagement, 54(suppl):A90–A105.
Richardson, A.J., D.E. Escobar, H.W. Gausman, and J.H. Everitt,1981. Use of Landsat-2 data technique to estimate silverleafsunflower infestation, Proceedings of Machine Processing ofRemotely Sensed Data Symposium, 23–26 June, Purdue Uni-versity, West Lafayette, Indiana, pp. 676–683.
Richardson, A.J., J.H. Everitt, and H.W. Gausman, 1983. Radiomet-ric estimation of biomass and nitrogen content of Alicia grass,Remote Sensing of Environment, 13:179–184.
Ritchie, J.C., J.H. Everitt, D.E. Escobar, T.J. Jackson, and M.R.Davis, 1992. Airborne laser measurements of rangelandcanopy cover, Journal of Range Management, 45(2):189–193.
Ritchie, J.C., D.L. Evans, D.M., Jacobs, J.H. Everitt, and M.A.Weltz, 1993a. Measuring canopy structure with an airbornelaser altimeter, Transactions of the American Society of Agri-cultural Engineers, 36(4):1235–1238.
Ritchie, J.C., T.J. Jackson, E.H. Grissinger, J.B. Murphey, J.D. Gar-brecht, J.H. Everitt, D.E. Escobar, M.R. Davis, and M.A. Weltz,1993b. Airborne altimeter measurements of landscape proper-ties, Hydrological Sciences Journal, 38(3):403–416.
Ritchie, J.C., K.S. Humes, and M.A. Weltz, 1995. Laser altimetermeasurements at Walnut Gulch Watershed, Arizona, Journalof Soil and Water Conservation, 50:440–442.
Ritchie, J.C., A. Rango, W.P. Kustas, T.J. Schmugge, K.M. Havstad,J.H. Everitt, L.E. Hipps, and K. Ramalingham, 1998. JORNEX:A remote sensing campaign to study plant community re-sponse to hydrologic fluxes in desert grasslands, Rangeland
Management and Water Resources (D.F. Potts, editor), Ameri-can Water Resources Society, Herndon, Virginia, pp. 65–74.
Ritchie, J.C., M.S. Seyfried, M.J. Chopping, and Y. Pachepsky,2001. Airborne laser technology for measuring rangeland con-ditions, Journal of Range Management, 54(suppl):A8–A21.
Roberts, D.A., M. Gardner, R. Church, S. Ustin, G. Scheer, andR.O. Green, 1998. Mapping chaparral in the Santa Monicamountains using multiple endmember spectral models, Re-mote Sensing of Environment, 65:267–279.
Rouse, J.W., R.H. Haas, J.A. Schell, and D.W. Deering, 1974. Moni-toring vegetation systems in the Great Plains with ERTS,Third Earth Resources Technology Satellite–1 Symposium.Volume I: Technical Presentations (S.C. Freden, E.P. Mercanti,M. Becker, editors), 10–14 December 1973, Washington, D.C.(NASA SP-351, National Aeronautics and Space Administra-tion, Washington, D.C.), pp. 309–317.
Ruimy, A., G. Dedieu, and B. Saugier, 1994. Methodology for theestimation of terrestrial net primary production from remotelysensed data, Journal of Geophysical Research, 99:5263–5283.
Ruimy, A., P.G. Jarvis, D.D. Baldocchi, and B. Saugier, 1995. CO2fluxes over plant canopies and solar radiation: A review, Ad-vances of Ecological Research, 26:1–66.
Running, S.W., and E.R. Hunt, Jr., 1993. Generalization of a forestecosystem process model for other biomes, BIOME-BGC, andan application for global-scale models, Scaling PhysiologicalProcesses: Leaf to Globe (J.R. Ehleringer and C. Field, editors),Academic Press, San Diego, California, pp. 141–158.
Sampson, A.W., 1919. Plant Succession Relation to Range Man-agement, USDA Technical Bulletin No. 791, United States De-partment of Agriculture, Washington, D.C., 76 p.
Schmugge, T.J., T.J. Jackson, W.P. Kustas, and J.R. Wang, 1992.Passive microwave remote sensing of soil moisture: Resultsfrom HAPEX, FIFE and MONSOON 90, ISPRS Journal of Pho-togrammetry and Remote Sensing, 47:127–143.
Schmugge, T., A. French, J.C. Ritchie, A. Rango, and H. Pelgrum,2002. Temperature and emissivity separation from multispec-tral thermal infrared observations, Remote Sensing of Environ-ment, 79:189–198.
Scifres, C.J., 1980. Brush Management, Texas A & M UniversityPress, College Station, Texas, 360 p.
Sheley, R.L., and J.K. Petroff (editors), 1999. Biology and Manage-ment of Noxious Rangeland Weeds, Oregon State UniversityPress, Corvallis, Oregon, 438 p.
Sinclair, T.R., and T. Horie, 1989. Leaf nitrogen, photosynthesis,and crop radiation use efficiency: A review, Crop Science,29:90–98.
Sinclair, T.R., and R.C. Muchow, 1999. Radiation use efficiency,Advances of Agronomy, 65:215–265.
Spaeth, K.E., M. Pellant, and P. Shaver, 1999. Natural resource in-ventory on BLM lands in Colorado: An analysis of rangelandhealth, Proceedings of the VI International Rangeland Con-gress, People and Rangelands, Building the Future (D. El-dridge and D. Freudenberger, editors), 19-23 July, Townsville,Australia (VI International Rangeland Congress, Aitkenvale,Queensland, Australia), 2:801–802.
Sperry, O.E., J.W. Dollahite, G.O. Hoffman, and B.J. Camp, 1964.Texas Plants Poisonous to Livestock, Texas Agricultural Ex-periment Station Bulletin 1028, Texas A & M University, Col-lege Station, Texas, 59 p.
SRM (Society for Range Management Task Group on Unity in Con-cepts and Terminology Committee), 1995. New concepts forassessment of rangeland condition, Journal of Range Manage-ment, 48:271–282.
Starks, P.J., and T.J. Jackson, 2002. Estimating soil water contentin tallgrass prairie using remote sensing, Journal of RangeManagement, 55:474–481.
Strong, L.L., R.W. Dana, and L.H. Carpenter, 1985. Estimating phy-tomass of sagebrush habitat types from microdensitometer data,Photogrammetric Engineering & Remote Sensing, 51:467–474.
Tucker, C.J., L.D. Miller, and R.L. Pearson, 1975. Shortgrassprairie spectral measurements, Photogrammetric Engineering& Remote Sensing, 41:1157–1162.
IPC_Grams_03-906 4/12/03 5:04 AM Page 18
692 J u n e 2 0 0 3
P H O T O G R A M M E T R I C E N G I N E E R I N G & R E M O T E S E N S I N G
Tucker, C.J., C. Vanpraet, E. Boerwinkel, and A. Gaston, 1983.Satellite remote sensing of total dry matter production in theSenegalese sahel, Remote Sensing of Environment, 13:461–474.
Tueller, P.T., 1982. Remote sensing for range management, RemoteSensing for Resource Management (C.J. Johannsen and J.L.Sanders, editors), Soil Conservation Society of America,Ankeny, Iowa, pp. 125–140.
———, 1989. Remote sensing technology for rangeland manage-ment applications, Journal of Range Management, 42:442–453.
———, 1992. Overview of remote sensing for range management,Geocarto International, 1:5–10.
———, 1995. Remote sensing in the management of rangelands,Annals of the Arid Zone, 34:191–207.
Ustin, S.L., D. DiPietro, K. Olmstead, E. Underwood, and G.Scheer, 2002. Hyperspectral remote sensing for invasivespecies detection and mapping, Proceedings of IGARSS 2002:International Geoscience and Remote Sensing Symposium, 24-28 June, Toronto, Ontario, Canada (IEEE and the Canadian So-ciety for Remote Sensing), 3:1658–1660.
Vitousek, P.M., C.M. D’Antonio, L.L. Loope, and R. Westbrooks,1996. Biological invasions as global environmental change,American Scientist, 84:468–478.
Vogelmann, J.E., S.M. Howard, L. Yang, C.R. Larson, B.K. Wylie,and N. Van Driel, 2001. Completion of the 1990s NationalLand Cover Data Set for the conterminous United Statesfrom Landsat Thematic Mapper data and ancillary datasources, Photogrammetric Engineering & Remote Sensing,67:650–662.
Washington-Allen, R.A., N.E. West, R.D. Ramsey, and C.T. Hun-saker, 1999. Characterization of the ecological integrity ofcommercially grazed rangelands using remote sensing-basedecological indicators, Proceedings of the VI InternationalRangelands Congress: People and Rangelands, Building theFuture (D. Eldridge and D. Freudenberger, editors), 17-23 July,Townsville, Queensland, Australia (VI International Range-land Congress, Aitkenvale, Queensland, Australia), 2:778–780.
Weltz, M.A., J.C. Ritchie, and H.D. Fox, 1994. Comparison of laserand field measurements of vegetation heights and canopycover, Water Resources Research, 30(5):1311–1320.
West, N.E., and E.L. Smith, 1997. Improving the monitoring ofrangelands, Rangelands, 19(6):9–14.
Winslow, J.C., E.R. Hunt, Jr., and S.C. Piper, 2001. Models of solarirradiance based on daily humidity, precipitation and temper-ature data for various spatial scales and global-change appli-cations, Ecological Modelling, 143:227–243.
Yamaguchi, Y., A.B. Kahle, H. Tsu, T. Kawakami, and M. Pniel,1998. Overview of Advanced Spaceborne Thermal Emissionand Reflection Radiometer (ASTER), IEEE Transactions onGeoscience and Remote Sensing, 36:1062–1071.
Yang, L., B.K. Wylie, L.L. Tieszen, and B.C. Reed, 1998. An analy-sis of relationships among climate forcing and time-integratedNDVI of grasslands over the U.S. Northern and Central GreatPlains, Remote Sensing of Environment, 65:25–37.
Yokoya, N., K. Yamamoto, and N. Funakuro, 1989. Fractal-basedanalysis and interpolation of 3D natural surface shapes andtheir application to terrain modeling, Computer Vision,Graphics, and Image Processing, 46:284–302.
IPC_Grams_03-906 4/12/03 5:04 AM Page 19
J u n e 2 0 0 3 693


![[REMOTE SENSING] 3-PM Remote Sensing](https://img.pdfslide.us/doc/110x75/61f2bbb282fa78206228d9e2/remote-sensing-3-pm-remote-sensing.jpg)