Embed Size (px)
Citation preview
Houston-Galveston Area Council | Last Update:3/26/2018
1 ACE: Activity-Connectivity Explorer
Application User Guide
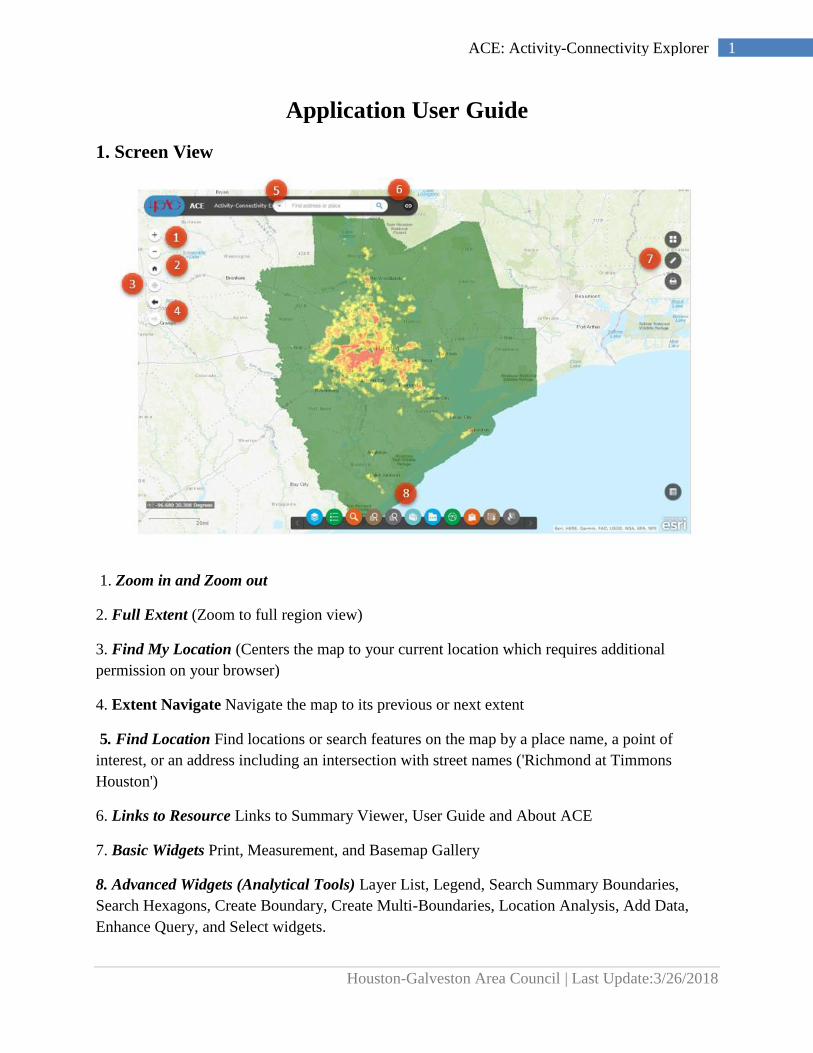
1. Screen View
1. Zoom in and Zoom out
2. Full Extent (Zoom to full region view)
3. Find My Location (Centers the map to your current location which requires additional
permission on your browser)
4. Extent Navigate Navigate the map to its previous or next extent
5. Find Location Find locations or search features on the map by a place name, a point of
interest, or an address including an intersection with street names ('Richmond at Timmons
Houston')
6. Links to Resource Links to Summary Viewer, User Guide and About ACE
7. Basic Widgets Print, Measurement, and Basemap Gallery
8. Advanced Widgets (Analytical Tools) Layer List, Legend, Search Summary Boundaries,
Search Hexagons, Create Boundary, Create Multi-Boundaries, Location Analysis, Add Data,
Enhance Query, and Select widgets.
Houston-Galveston Area Council | Last Update:3/26/2018
2 ACE: Activity-Connectivity Explorer
2. Basic Widgets
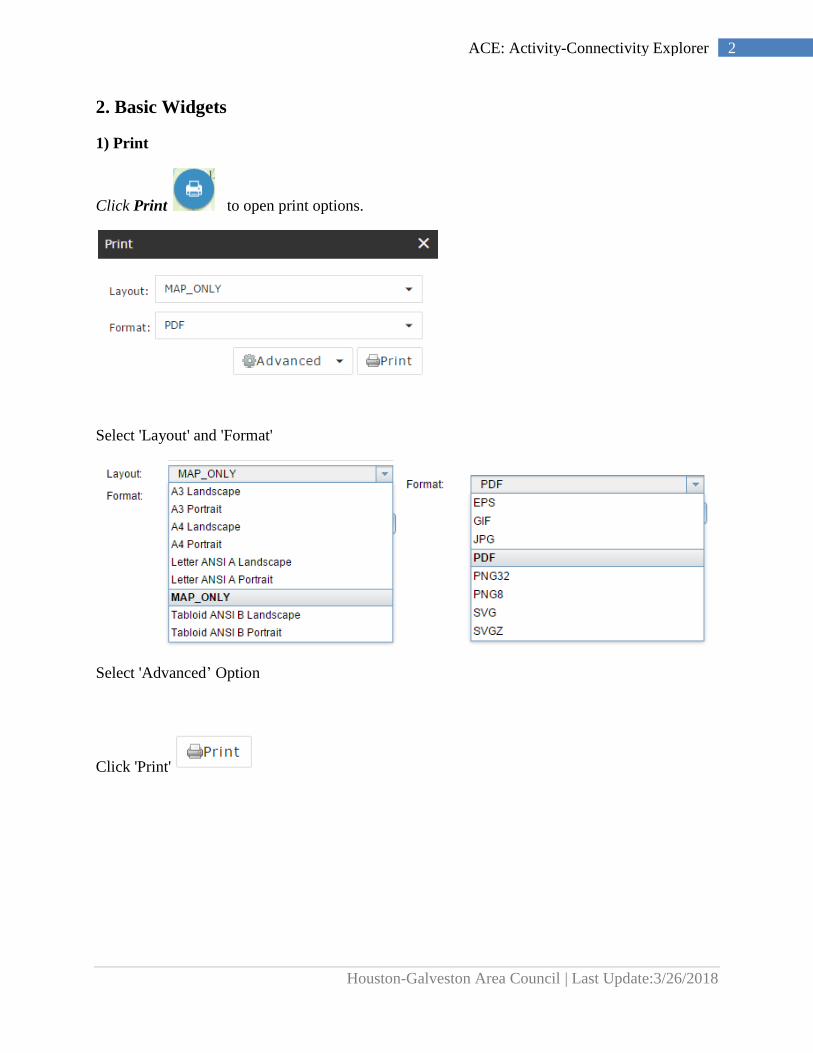
1) Print
Click Print to open print options.
Select 'Layout' and 'Format'
Select 'Advanced’ Option
Click 'Print'
Houston-Galveston Area Council | Last Update:3/26/2018
3 ACE: Activity-Connectivity Explorer
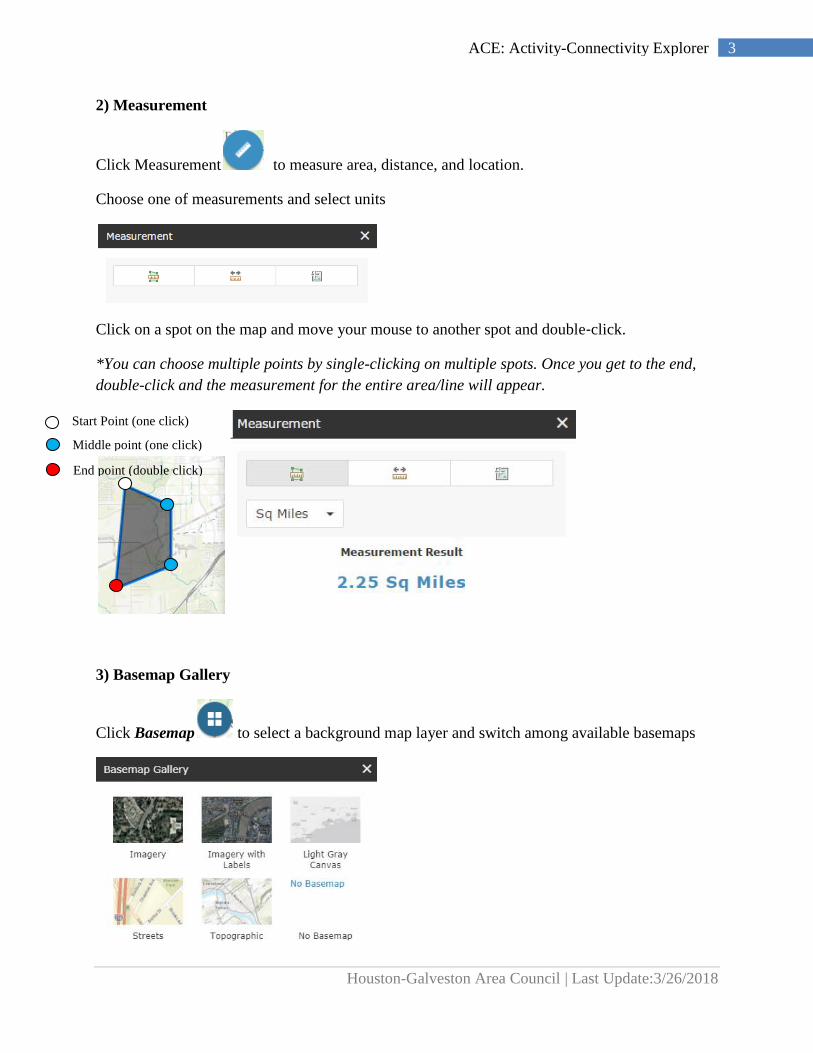
2) Measurement
Click Measurement to measure area, distance, and location.
Choose one of measurements and select units
Click on a spot on the map and move your mouse to another spot and double‐click.
*You can choose multiple points by single-clicking on multiple spots. Once you get to the end,
double-click and the measurement for the entire area/line will appear.
3) Basemap Gallery
Click Basemap to select a background map layer and switch among available basemaps
Start Point (one click)
Middle point (one click)
End point (double click)
Houston-Galveston Area Council | Last Update:3/26/2018
4 ACE: Activity-Connectivity Explorer
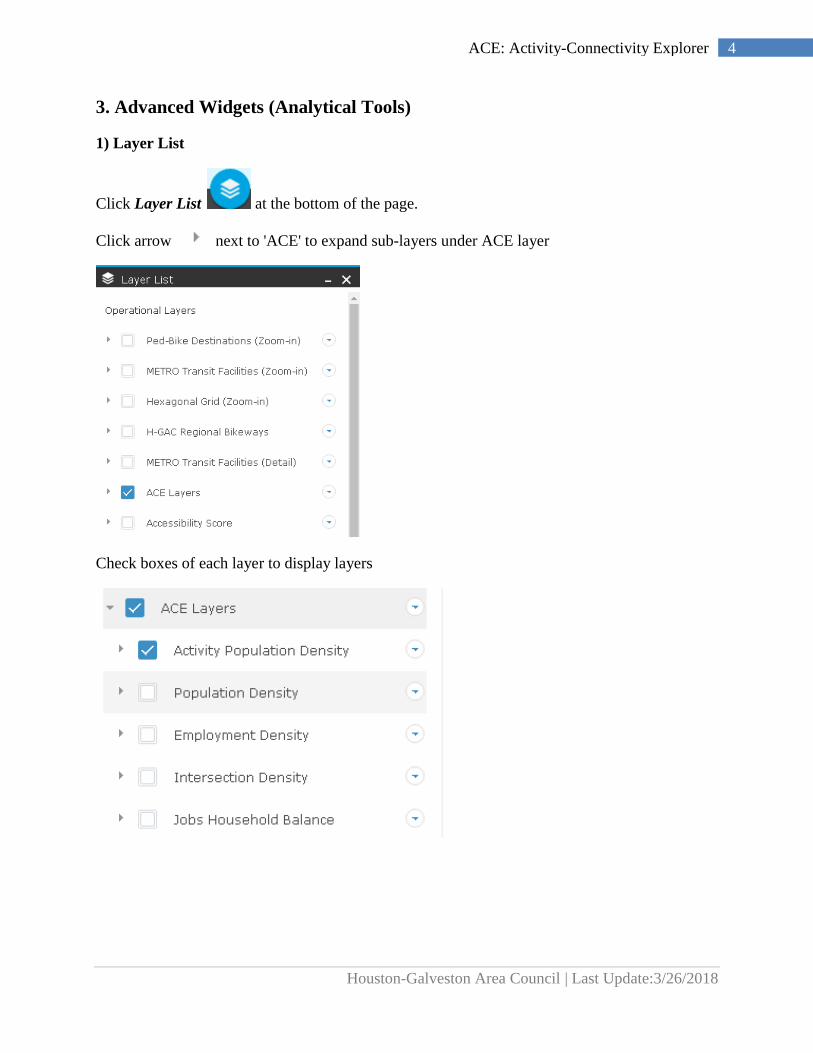
3. Advanced Widgets (Analytical Tools)
1) Layer List
Click Layer List at the bottom of the page.
Click arrow next to 'ACE' to expand sub-layers under ACE layer
Check boxes of each layer to display layers
Houston-Galveston Area Council | Last Update:3/26/2018
5 ACE: Activity-Connectivity Explorer
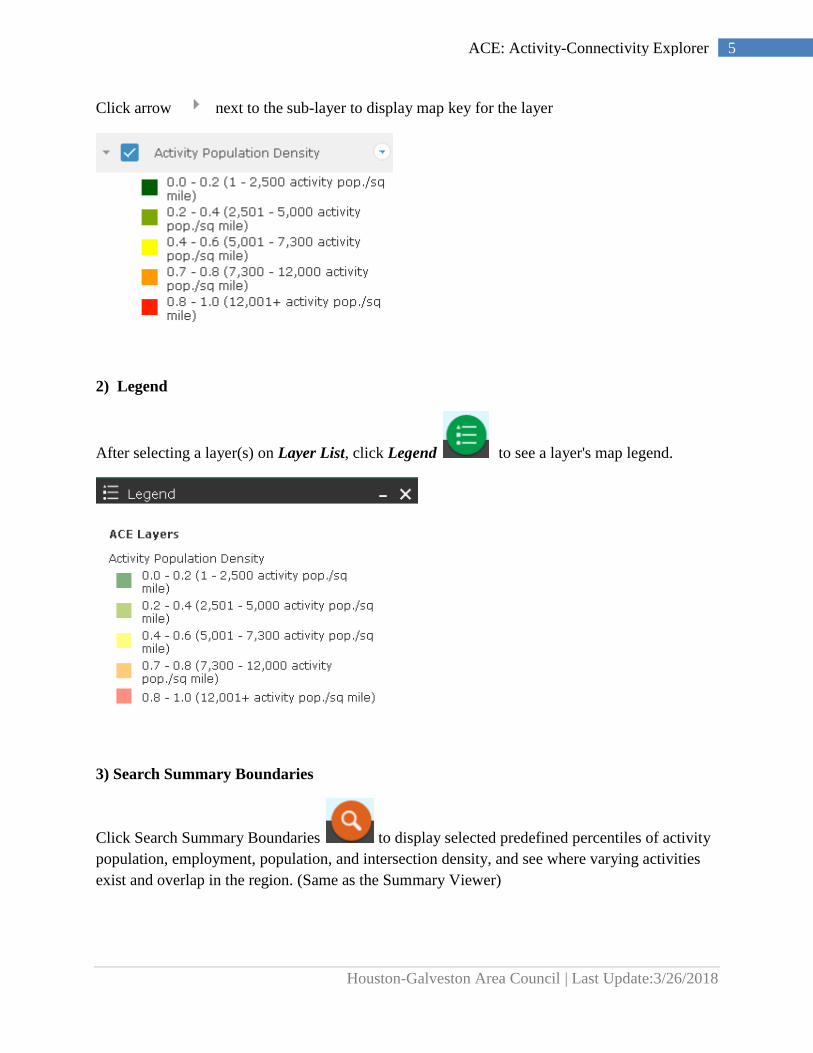
Click arrow next to the sub-layer to display map key for the layer
2) Legend
After selecting a layer(s) on Layer List, click Legend to see a layer's map legend.
3) Search Summary Boundaries
Click Search Summary Boundaries to display selected predefined percentiles of activity
population, employment, population, and intersection density, and see where varying activities
exist and overlap in the region. (Same as the Summary Viewer)
Houston-Galveston Area Council | Last Update:3/26/2018
6 ACE: Activity-Connectivity Explorer
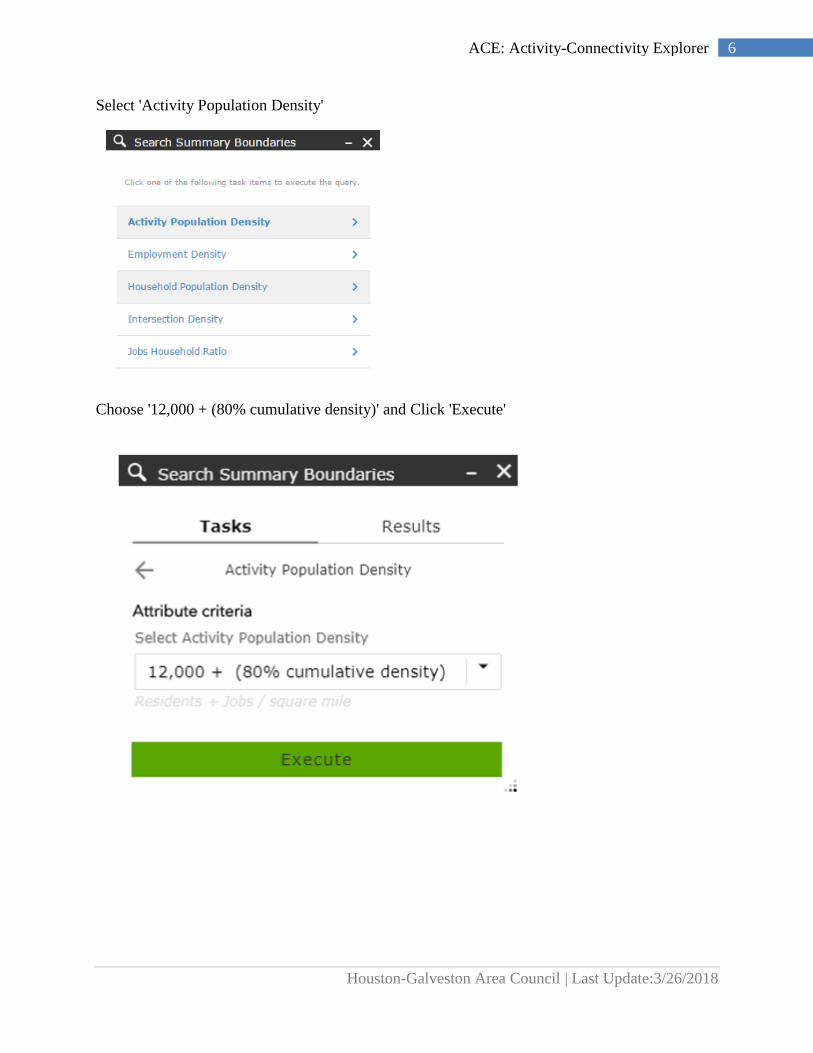
Select 'Activity Population Density'
Choose '12,000 + (80% cumulative density)' and Click 'Execute'

Houston-Galveston Area Council | Last Update:3/26/2018
7 ACE: Activity-Connectivity Explorer
Click 'Tasks' tab and click Back arrow to make another selection
Select 'Intersection Density' and choose '100 + (80% cumulative density)' and Click 'Execute'

Houston-Galveston Area Council | Last Update:3/26/2018
8 ACE: Activity-Connectivity Explorer
Click 'Layer List' and Check “Intersection Density_Query Result” and Activity
Population Density_Query Result”
Houston-Galveston Area Council | Last Update:3/26/2018
9 ACE: Activity-Connectivity Explorer
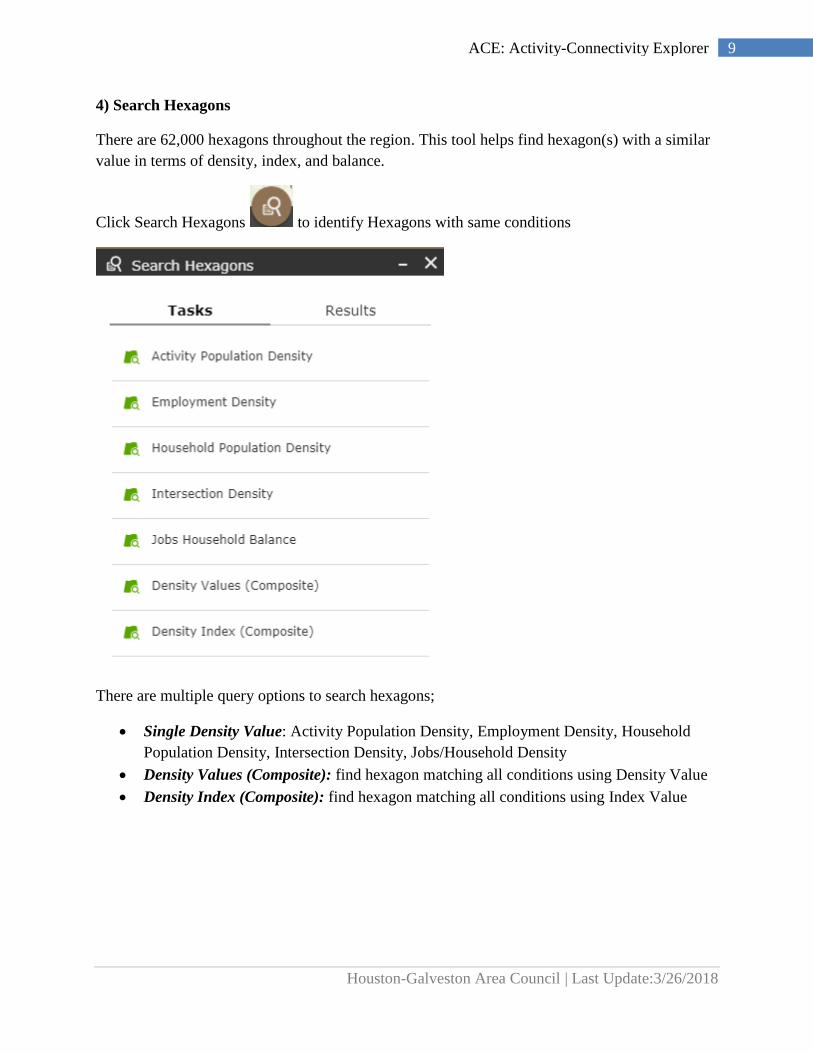
4) Search Hexagons
There are 62,000 hexagons throughout the region. This tool helps find hexagon(s) with a similar
value in terms of density, index, and balance.
Click Search Hexagons to identify Hexagons with same conditions
There are multiple query options to search hexagons;
• Single Density Value: Activity Population Density, Employment Density, Household
Population Density, Intersection Density, Jobs/Household Density
• Density Values (Composite): find hexagon matching all conditions using Density Value
• Density Index (Composite): find hexagon matching all conditions using Index Value
Houston-Galveston Area Council | Last Update:3/26/2018
10 ACE: Activity-Connectivity Explorer
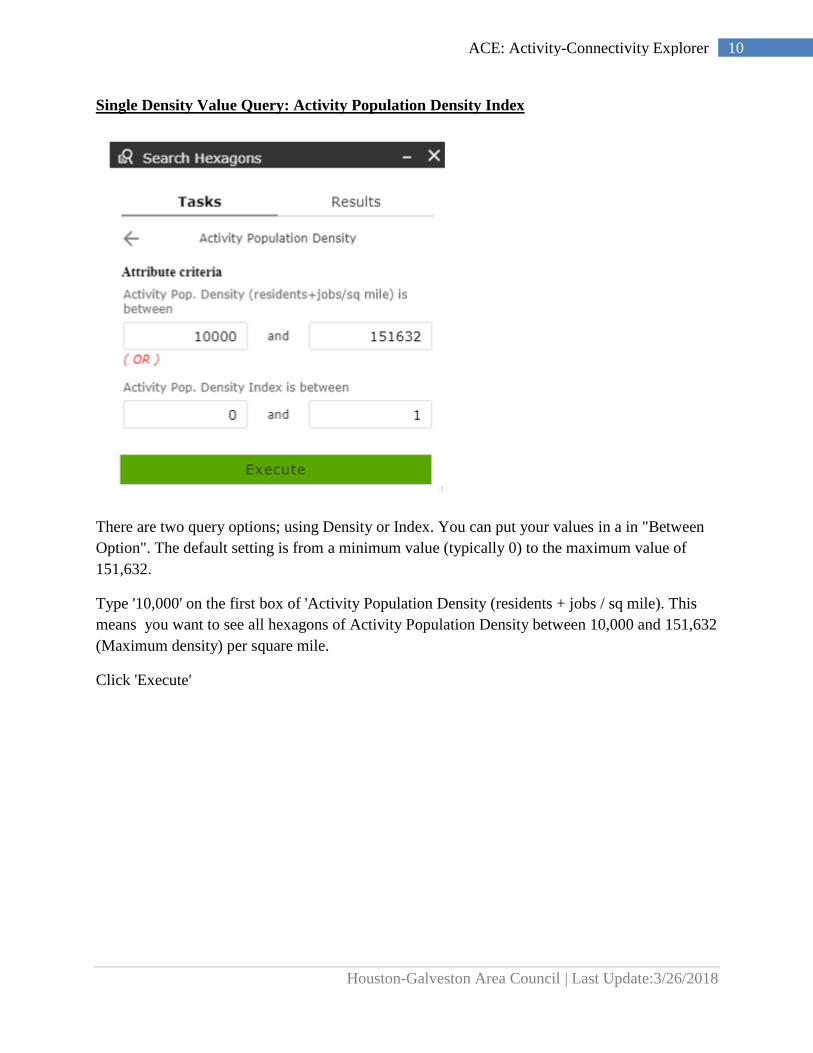
Single Density Value Query: Activity Population Density Index
There are two query options; using Density or Index. You can put your values in a in "Between
Option". The default setting is from a minimum value (typically 0) to the maximum value of
151,632.
Type '10,000' on the first box of 'Activity Population Density (residents + jobs / sq mile). This
means you want to see all hexagons of Activity Population Density between 10,000 and 151,632
(Maximum density) per square mile.
Click 'Execute'
Houston-Galveston Area Council | Last Update:3/26/2018
11 ACE: Activity-Connectivity Explorer
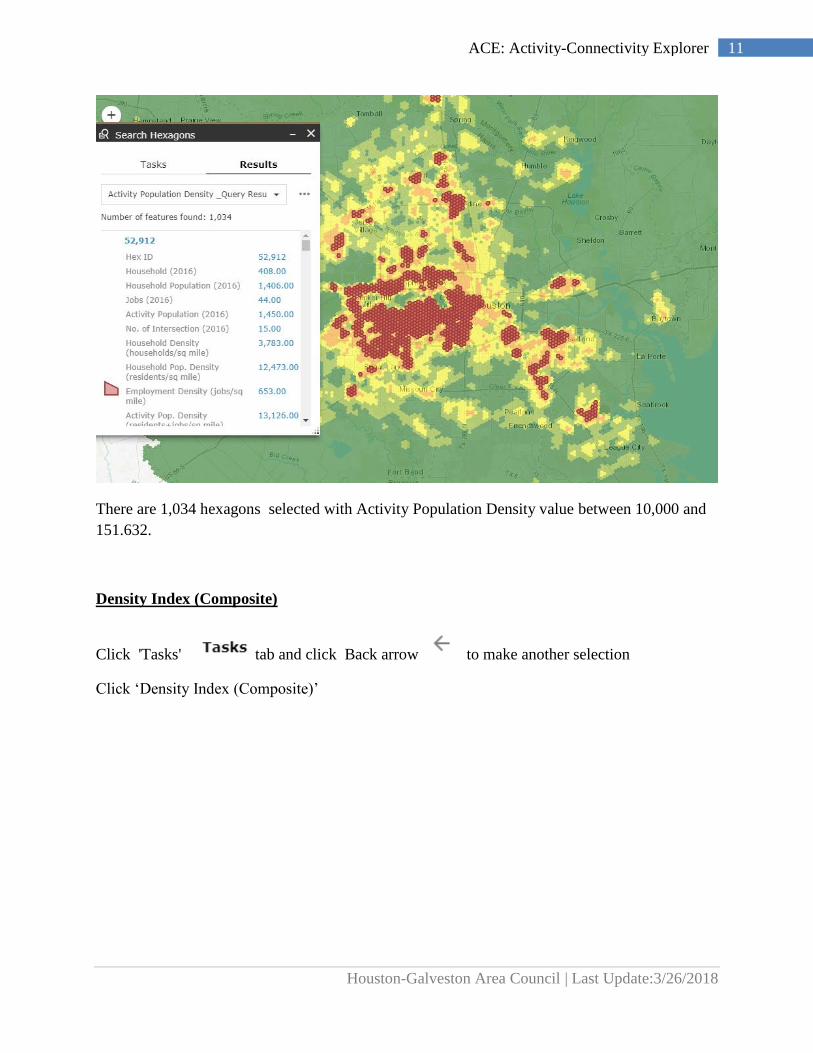
There are 1,034 hexagons selected with Activity Population Density value between 10,000 and
151.632.
Density Index (Composite)
Click 'Tasks' tab and click Back arrow to make another selection
Click ‘Density Index (Composite)’
Houston-Galveston Area Council | Last Update:3/26/2018
12 ACE: Activity-Connectivity Explorer
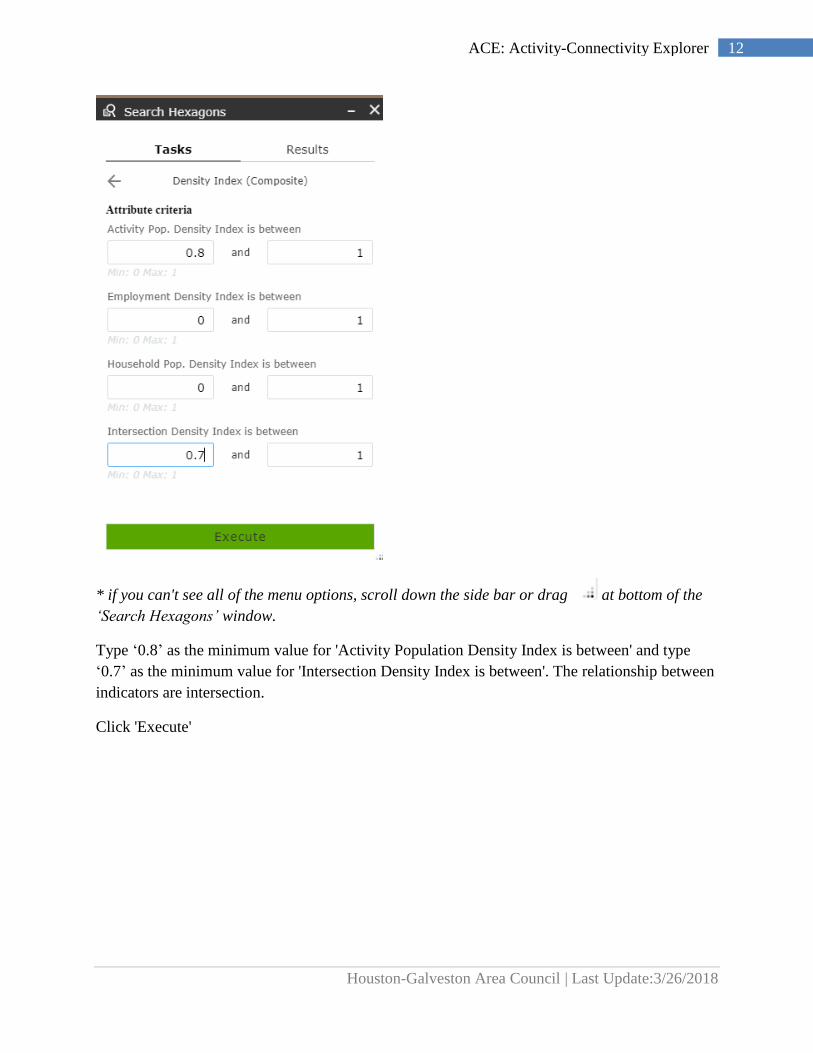
* if you can't see all of the menu options, scroll down the side bar or drag at bottom of the
‘Search Hexagons’ window.
Type ‘0.8’ as the minimum value for 'Activity Population Density Index is between' and type
‘0.7’ as the minimum value for 'Intersection Density Index is between'. The relationship between
indicators are intersection.
Click 'Execute'
Houston-Galveston Area Council | Last Update:3/26/2018
13 ACE: Activity-Connectivity Explorer
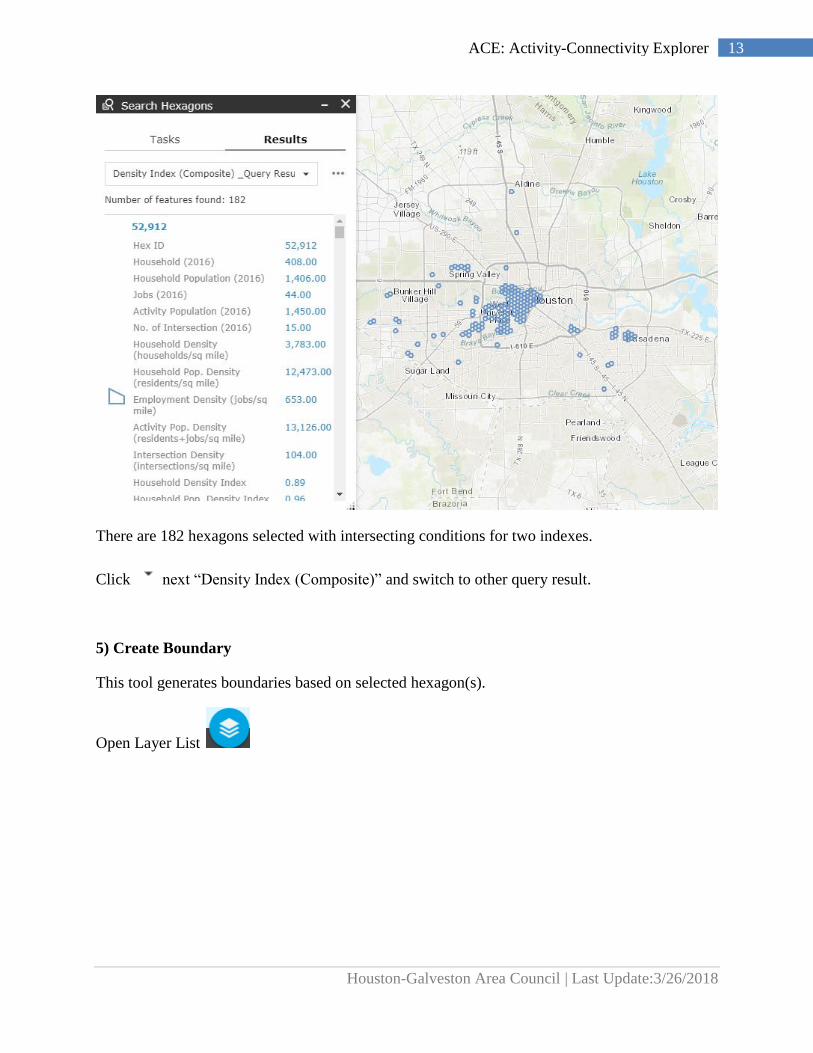
There are 182 hexagons selected with intersecting conditions for two indexes.
Click next “Density Index (Composite)” and switch to other query result.
5) Create Boundary
This tool generates boundaries based on selected hexagon(s).
Open Layer List
Houston-Galveston Area Council | Last Update:3/26/2018
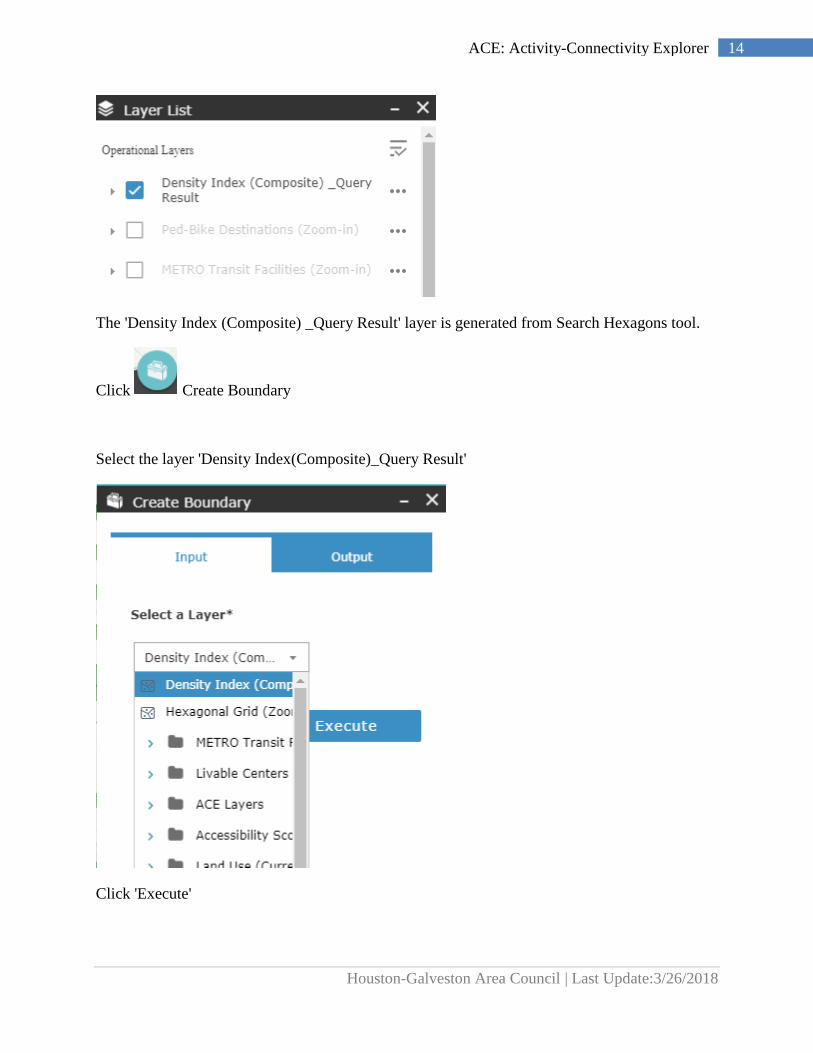
14 ACE: Activity-Connectivity Explorer
The 'Density Index (Composite) _Query Result' layer is generated from Search Hexagons tool.
Click Create Boundary
Select the layer 'Density Index(Composite)_Query Result'
Click 'Execute'
Houston-Galveston Area Council | Last Update:3/26/2018
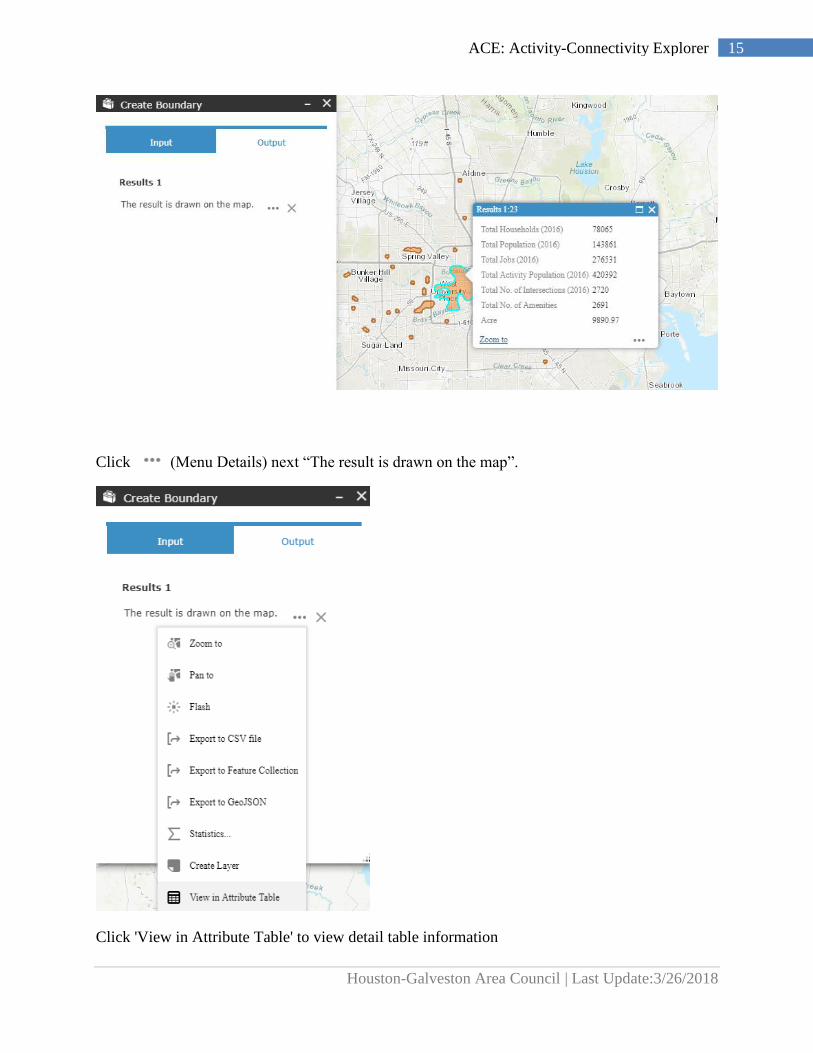
15 ACE: Activity-Connectivity Explorer
Click (Menu Details) next “The result is drawn on the map”.
Click 'View in Attribute Table' to view detail table information

Houston-Galveston Area Council | Last Update:3/26/2018
16 ACE: Activity-Connectivity Explorer
There are 29 areas to be identified as centers with combined values. (Turn off 'Filter by Map
Extent' on the menu, if it is turn on)
Click icon one more to collapse the attribute table.
Click (Menu Details) and click “Create Layer”
Type “Density Index Result”
Open Layer List and see “Density Index Result” layer
Click (Menu Details) and click “Export to GeoJSON”
Houston-Galveston Area Council | Last Update:3/26/2018
17 ACE: Activity-Connectivity Explorer
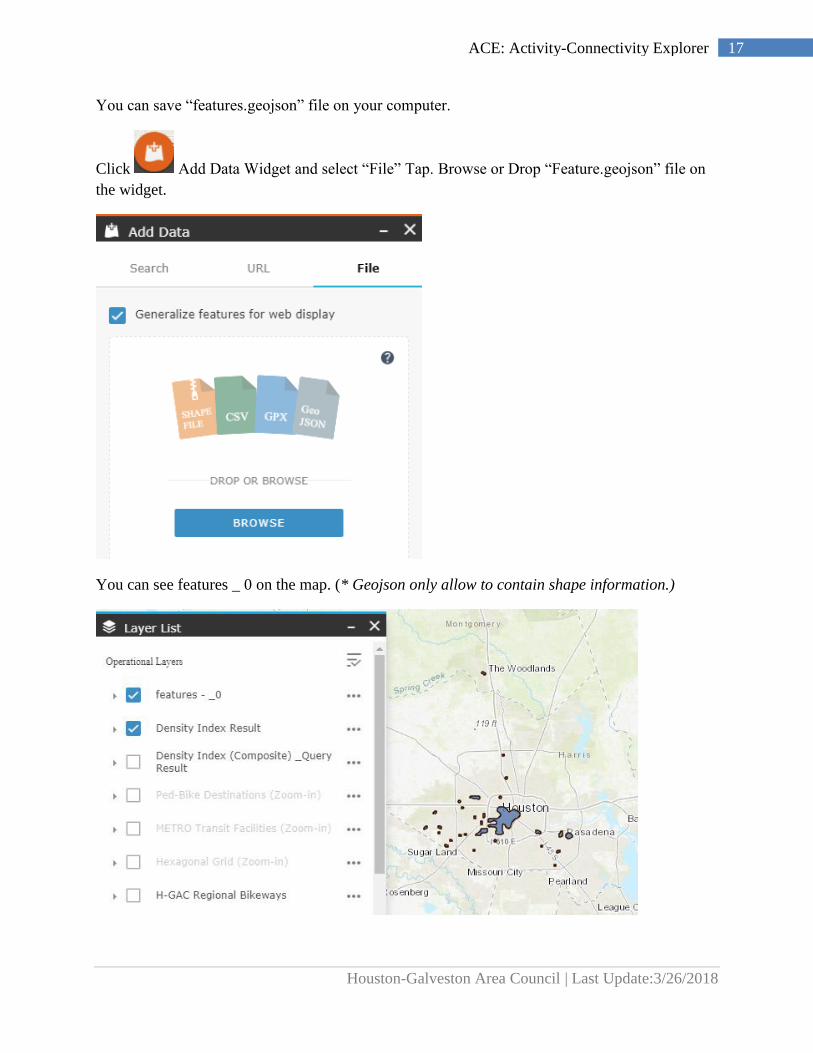
You can save “features.geojson” file on your computer.
Click Add Data Widget and select “File” Tap. Browse or Drop “Feature.geojson” file on
the widget.
You can see features _ 0 on the map. (* Geojson only allow to contain shape information.)

Houston-Galveston Area Council | Last Update:3/26/2018
18 ACE: Activity-Connectivity Explorer
3) Create Multi-Boundaries
This tool generates boundaries from multiple selected hexagon(s) layers to compare the results.
Open Layer List (for this task you need two query results; above 0.8 Activity Population
Density Index and above 0.8 Intersection Density Index)
There are two operational layers; 'Intersection Density _Query Result' and 'Activity Population
Density_Query Result' from Search Hexagons
Click 'Create Multi-Boundaries' icon and there are two Create Boundary
widgets.
click 'Create Boundary 2' and 'Create Boundary 3' menu
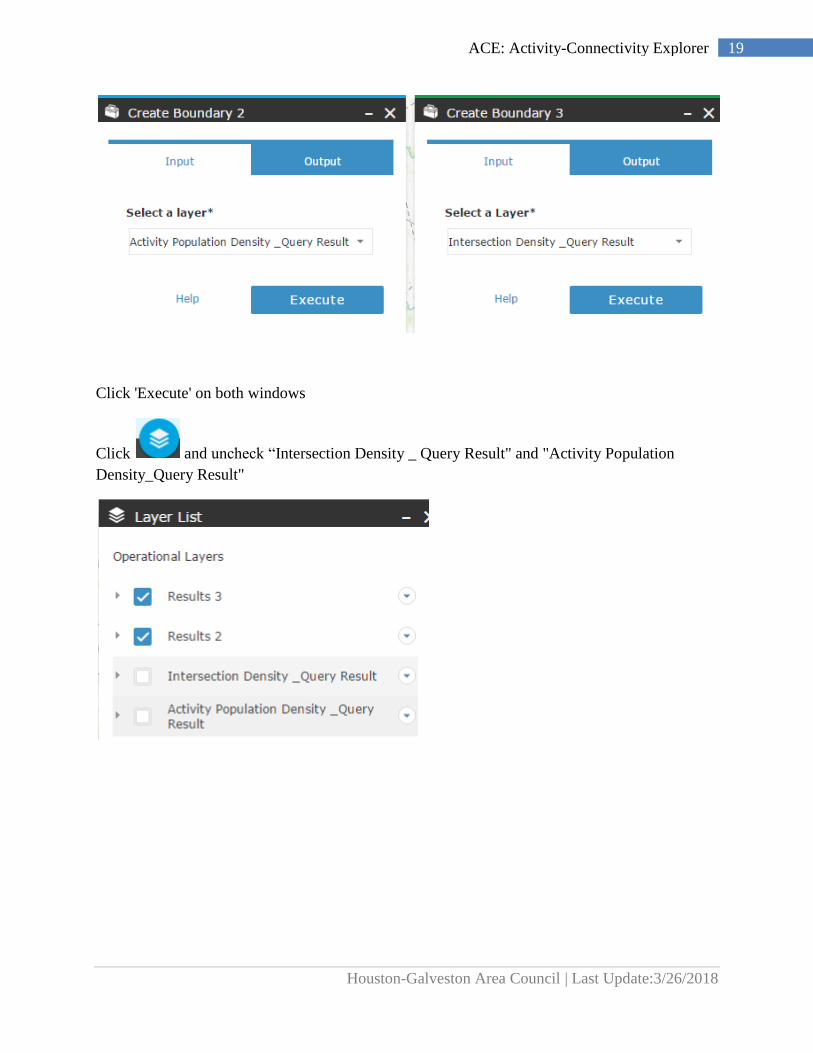
In 'Create Boundary 2' window, Select 'Activity Population Density_Query Result' Layer
In 'Create Boundary 3' window, Select 'Intersection Density_Query Result' Layer
Houston-Galveston Area Council | Last Update:3/26/2018
19 ACE: Activity-Connectivity Explorer
Click 'Execute' on both windows
Click and uncheck “Intersection Density _ Query Result" and "Activity Population
Density_Query Result"
Houston-Galveston Area Council | Last Update:3/26/2018
20 ACE: Activity-Connectivity Explorer
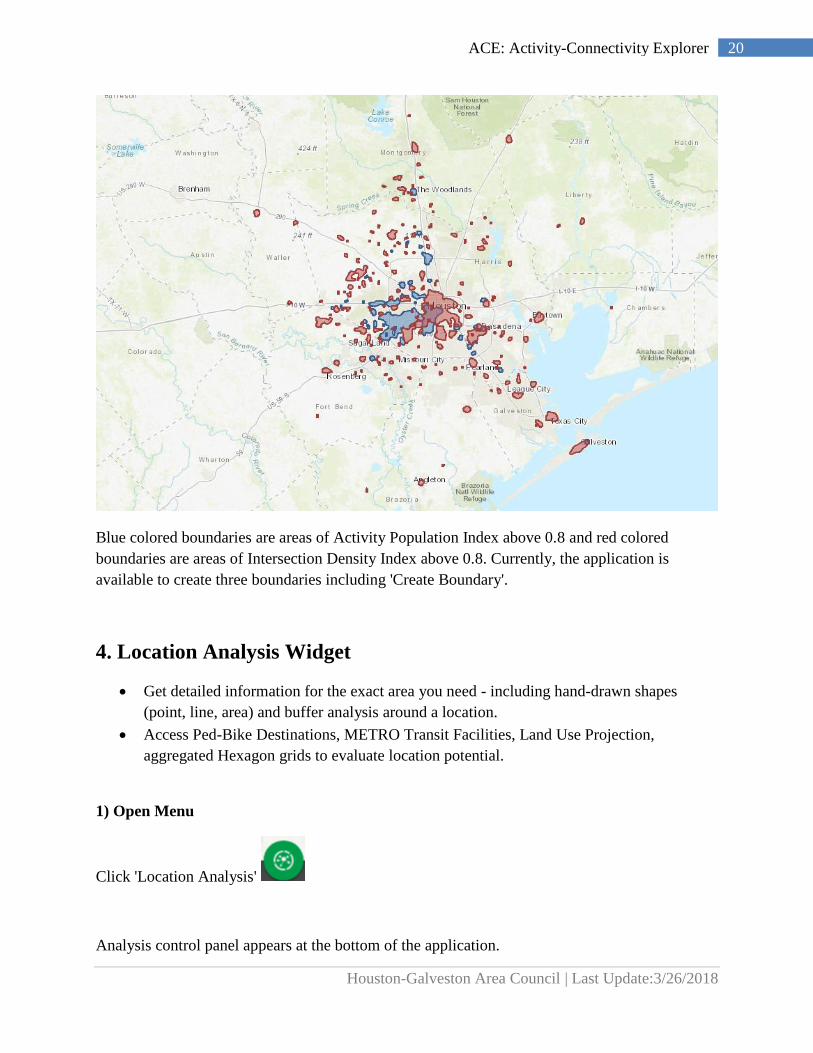
Blue colored boundaries are areas of Activity Population Index above 0.8 and red colored
boundaries are areas of Intersection Density Index above 0.8. Currently, the application is
available to create three boundaries including 'Create Boundary'.
4. Location Analysis Widget
• Get detailed information for the exact area you need - including hand-drawn shapes
(point, line, area) and buffer analysis around a location.
• Access Ped-Bike Destinations, METRO Transit Facilities, Land Use Projection,
aggregated Hexagon grids to evaluate location potential.
1) Open Menu
Click 'Location Analysis'
Analysis control panel appears at the bottom of the application.
Houston-Galveston Area Council | Last Update:3/26/2018
21 ACE: Activity-Connectivity Explorer
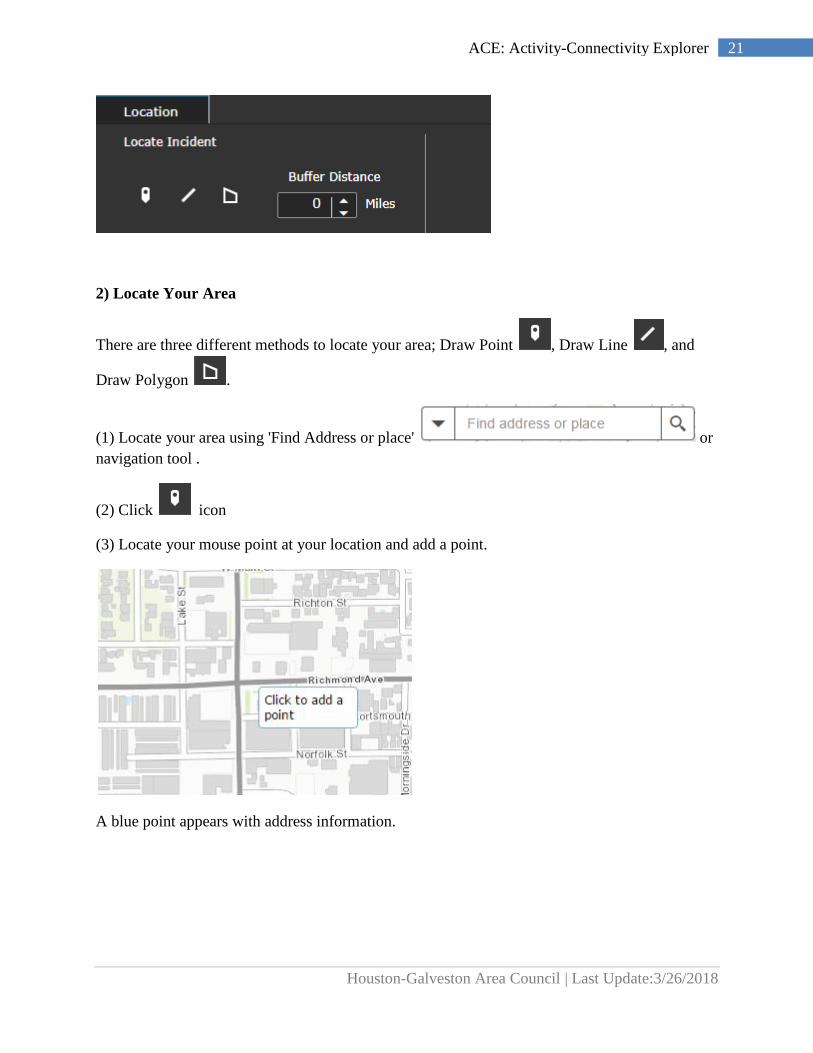
2) Locate Your Area
There are three different methods to locate your area; Draw Point , Draw Line , and
Draw Polygon .
(1) Locate your area using 'Find Address or place' or
navigation tool .
(2) Click icon
(3) Locate your mouse point at your location and add a point.
A blue point appears with address information.
Houston-Galveston Area Council | Last Update:3/26/2018
22 ACE: Activity-Connectivity Explorer
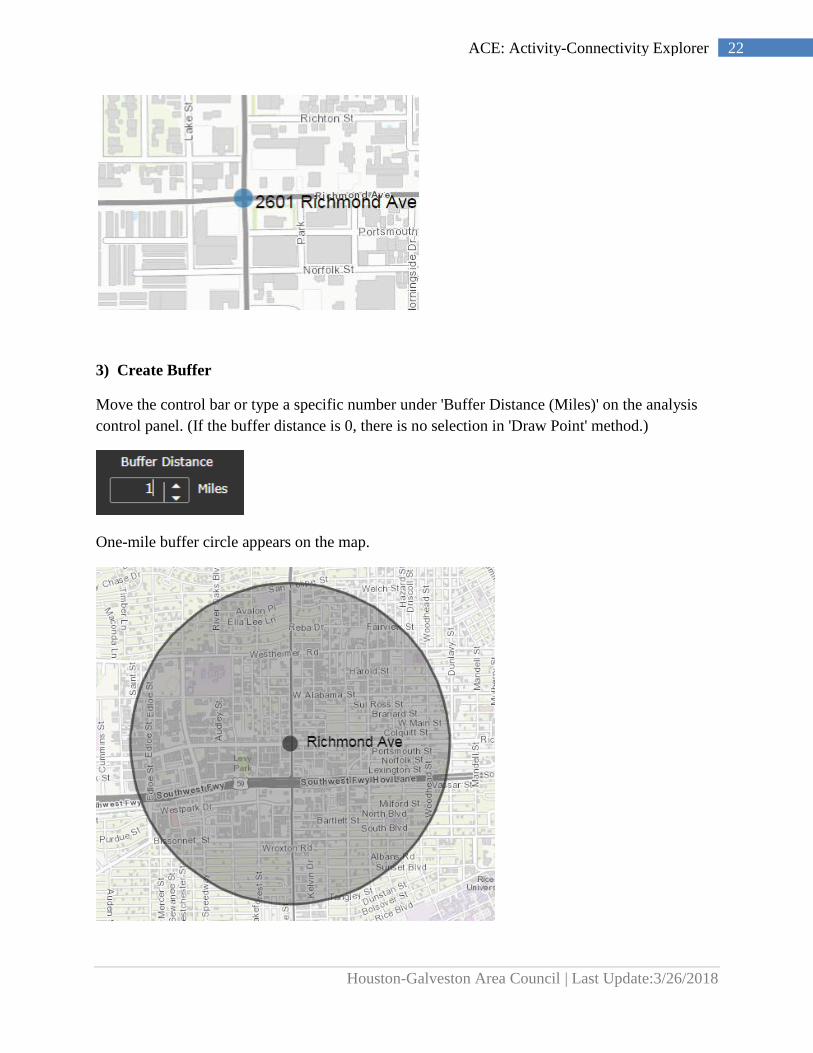
3) Create Buffer
Move the control bar or type a specific number under 'Buffer Distance (Miles)' on the analysis
control panel. (If the buffer distance is 0, there is no selection in 'Draw Point' method.)
One-mile buffer circle appears on the map.
Houston-Galveston Area Council | Last Update:3/26/2018
23 ACE: Activity-Connectivity Explorer
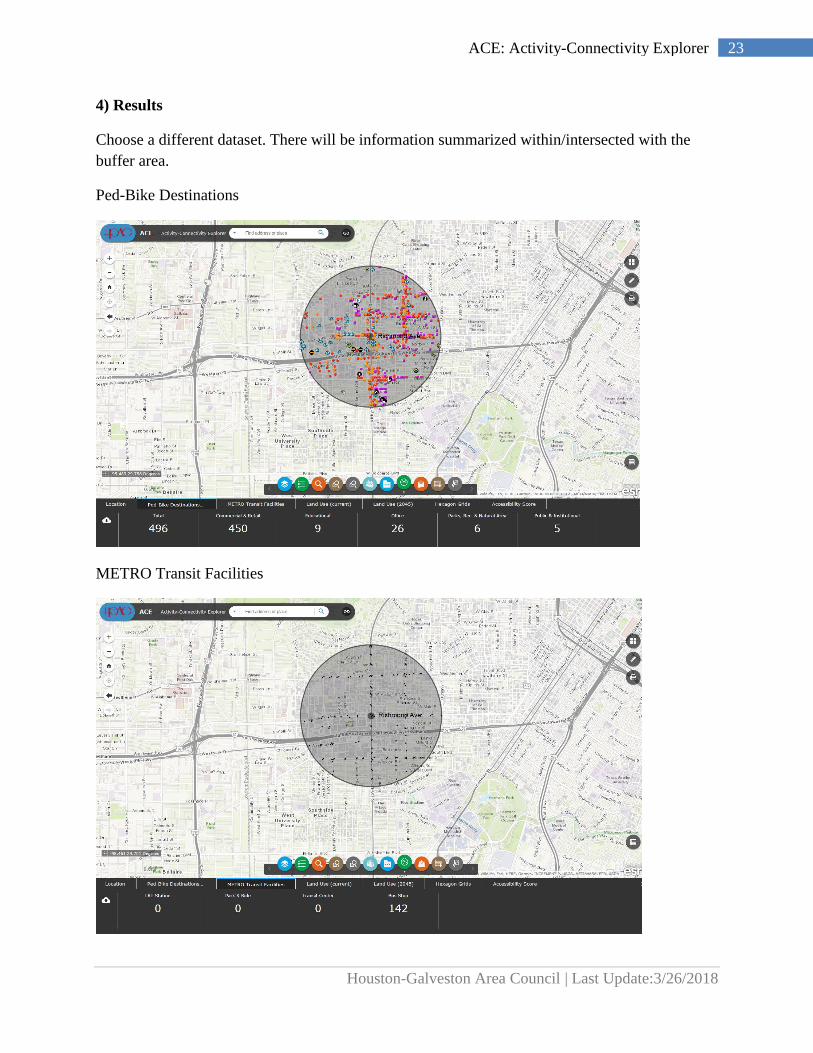
4) Results
Choose a different dataset. There will be information summarized within/intersected with the
buffer area.
Ped-Bike Destinations
METRO Transit Facilities
Houston-Galveston Area Council | Last Update:3/26/2018
24 ACE: Activity-Connectivity Explorer
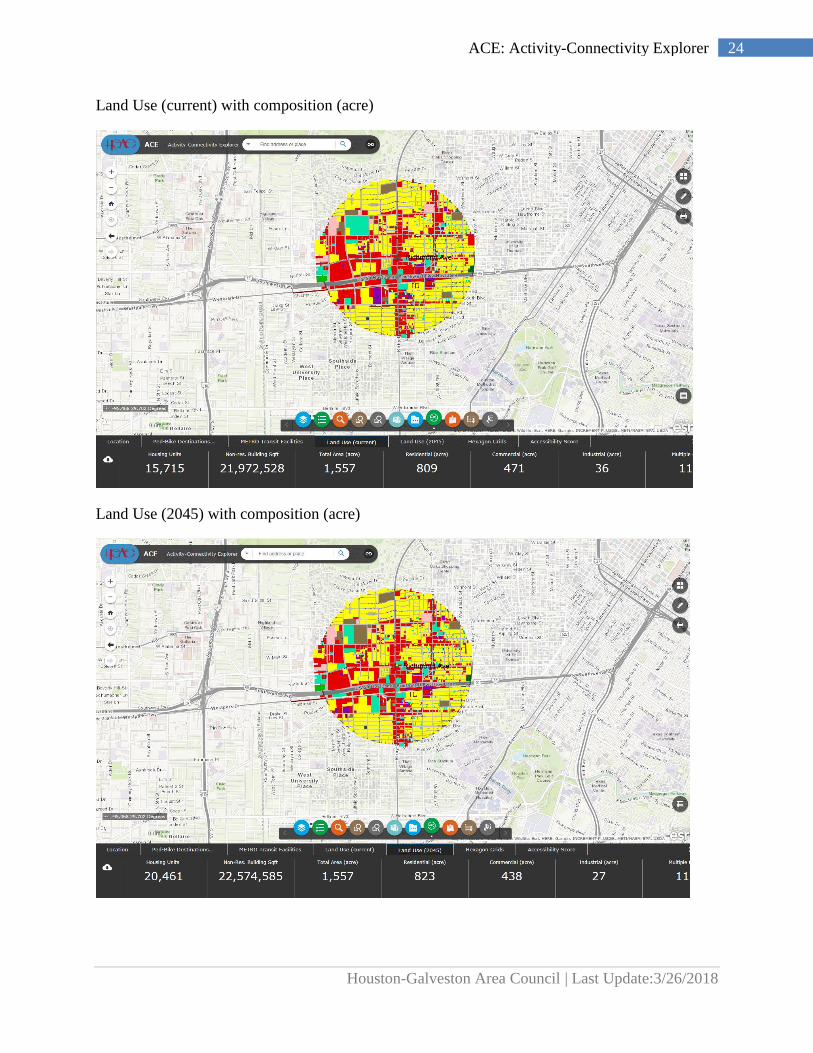
Land Use (current) with composition (acre)
Land Use (2045) with composition (acre)
Houston-Galveston Area Council | Last Update:3/26/2018
25 ACE: Activity-Connectivity Explorer
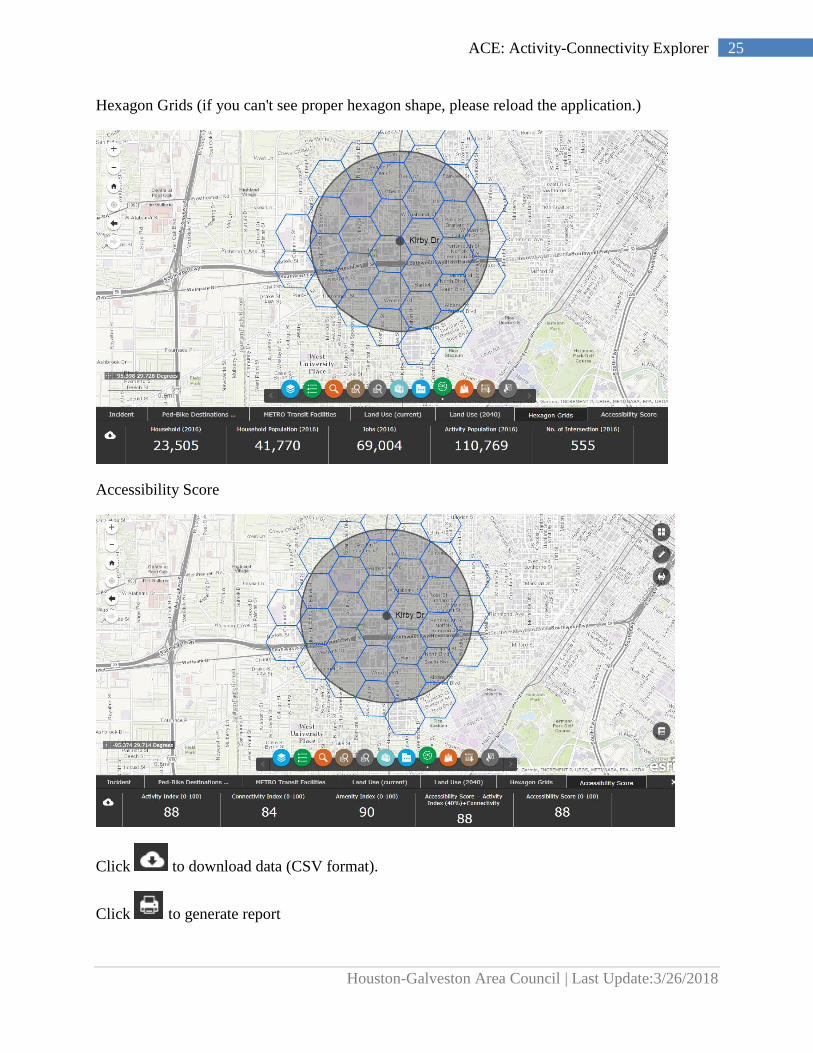
Hexagon Grids (if you can't see proper hexagon shape, please reload the application.)
Accessibility Score
Click to download data (CSV format).
Click to generate report
Houston-Galveston Area Council | Last Update:3/26/2018
26 ACE: Activity-Connectivity Explorer
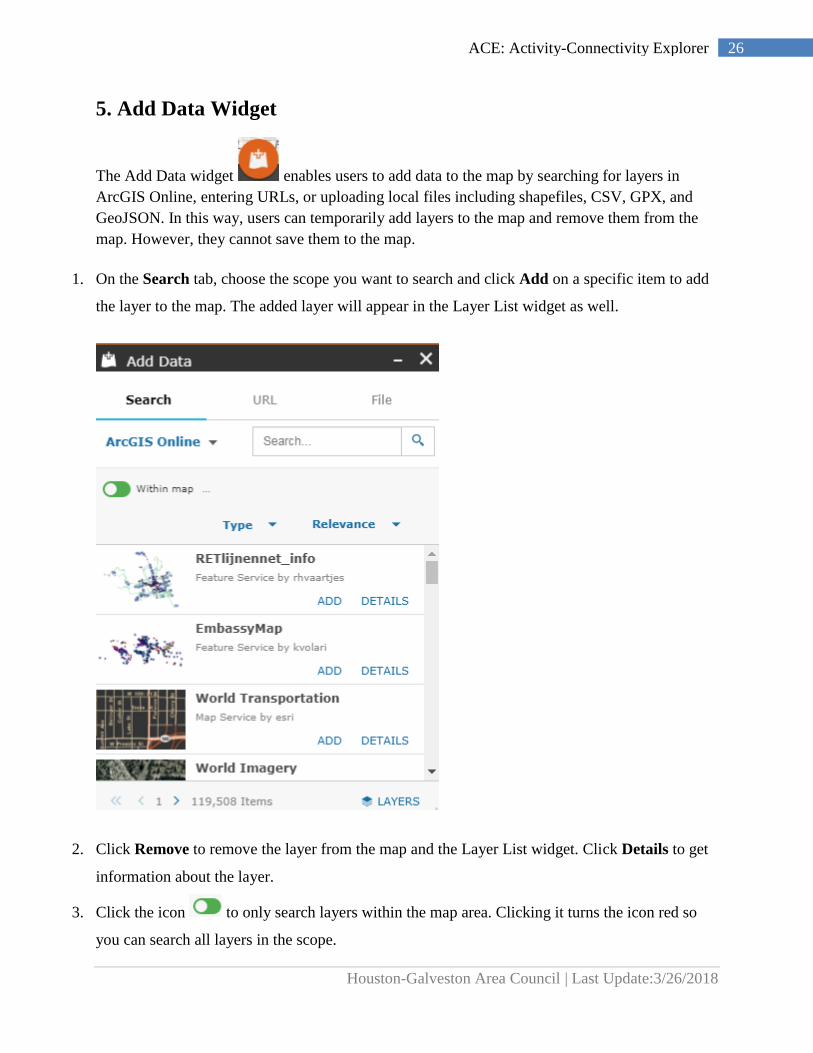
5. Add Data Widget
The Add Data widget enables users to add data to the map by searching for layers in
ArcGIS Online, entering URLs, or uploading local files including shapefiles, CSV, GPX, and
GeoJSON. In this way, users can temporarily add layers to the map and remove them from the
map. However, they cannot save them to the map.
1. On the Search tab, choose the scope you want to search and click Add on a specific item to add
the layer to the map. The added layer will appear in the Layer List widget as well.
2. Click Remove to remove the layer from the map and the Layer List widget. Click Details to get
information about the layer.
3. Click the icon to only search layers within the map area. Clicking it turns the icon red so
you can search all layers in the scope.

Houston-Galveston Area Council | Last Update:3/26/2018
27 ACE: Activity-Connectivity Explorer
o Click the Type drop-down list to search layers based on map service, feature service,
image service, vector tile service, KML, or WMS.
o Click the Sort By drop-down list to sort items by relevance, title, owner, rating, view, or
date.
4. To add layers by URL, click the URL tab next to the Search Tab. Choose a type and enter the
URL. Click Add to add the data to the map. The added layer will appear in the Layer List widget
as well. The following types are supported through the URL:
o ArcGIS Server web service
o WMS OGC web service
o KML
o GeoRSS
o CSV
For more information on CSV files, see CSV format information .
5. Click Sample URL(s) to see the URL format for each type.
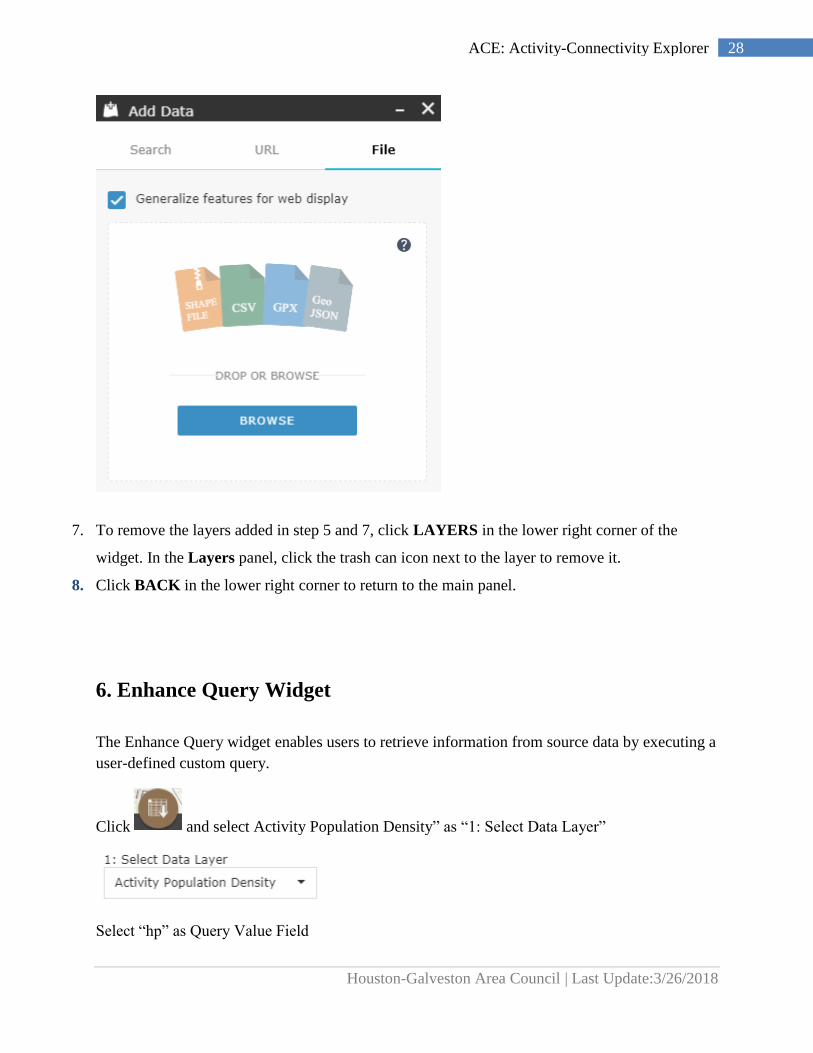
6. Click the File tab to upload files locally. You can either drag and drop the file or browse to it. It
supports shapefiles in Zip format, and CSV, GPX and GeoJSON files.
Houston-Galveston Area Council | Last Update:3/26/2018
28 ACE: Activity-Connectivity Explorer
7. To remove the layers added in step 5 and 7, click LAYERS in the lower right corner of the
widget. In the Layers panel, click the trash can icon next to the layer to remove it.
8. Click BACK in the lower right corner to return to the main panel.
6. Enhance Query Widget
The Enhance Query widget enables users to retrieve information from source data by executing a
user-defined custom query.
Click and select Activity Population Density” as “1: Select Data Layer”
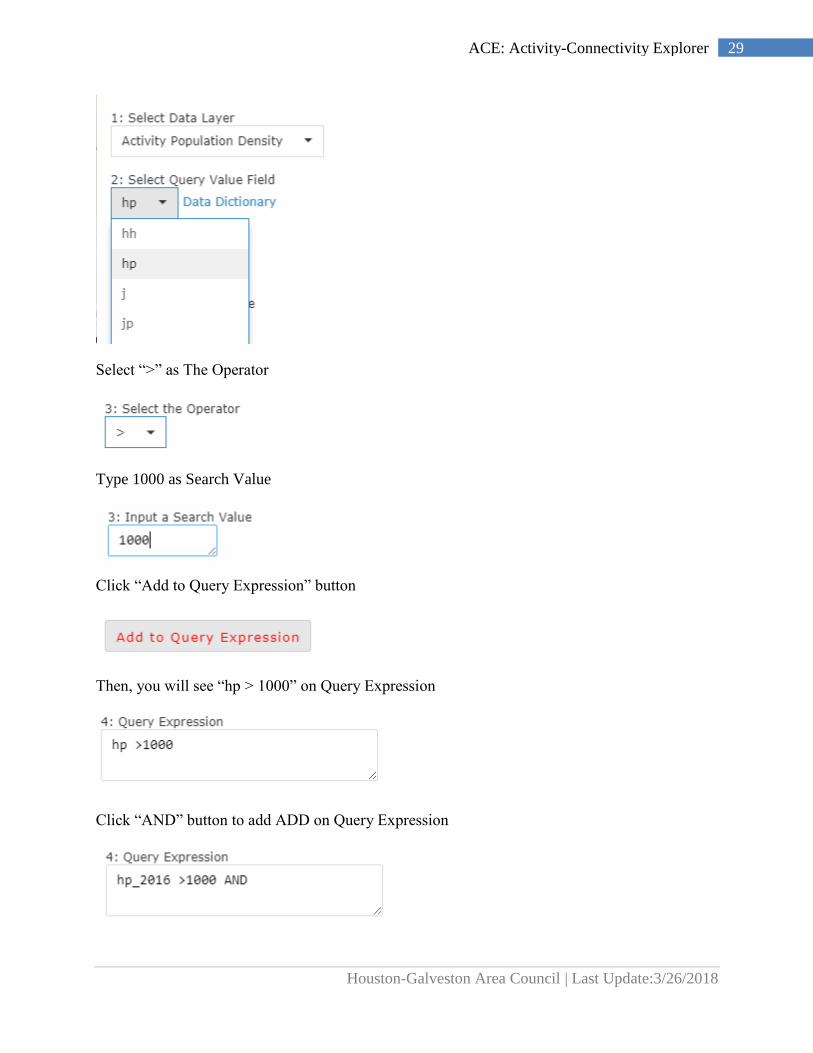
Select “hp” as Query Value Field
Houston-Galveston Area Council | Last Update:3/26/2018
29 ACE: Activity-Connectivity Explorer
Select “>” as The Operator
Type 1000 as Search Value
Click “Add to Query Expression” button
Then, you will see “hp > 1000” on Query Expression
Click “AND” button to add ADD on Query Expression
Houston-Galveston Area Council | Last Update:3/26/2018
30 ACE: Activity-Connectivity Explorer
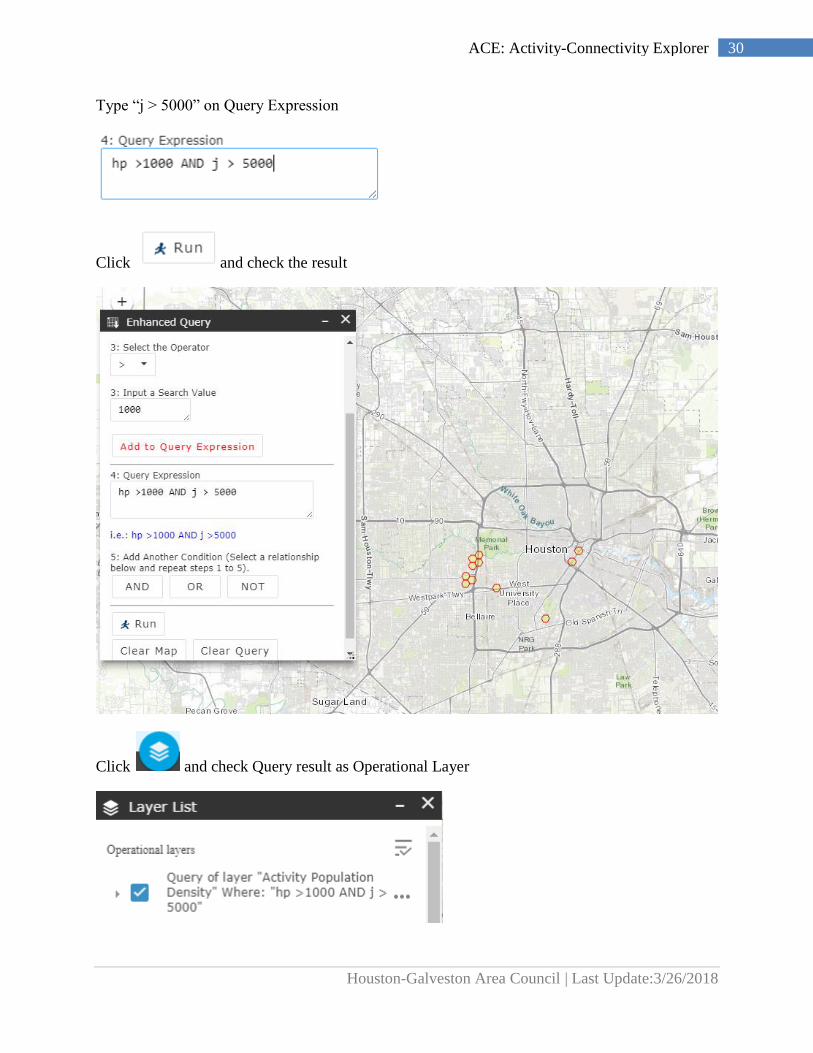
Type “j > 5000” on Query Expression
Click and check the result
Click and check Query result as Operational Layer

Houston-Galveston Area Council | Last Update:3/26/2018
31 ACE: Activity-Connectivity Explorer
7. Select Widget
The Select widget enables users to interactively select features on the map and take actions on
the selected features.
Click Layer List widget and turn on a desired layer (“Accessibility Score”) to select it.
Click and check “Accessibility Score” to be activated.
Houston-Galveston Area Council | Last Update:3/26/2018
32 ACE: Activity-Connectivity Explorer
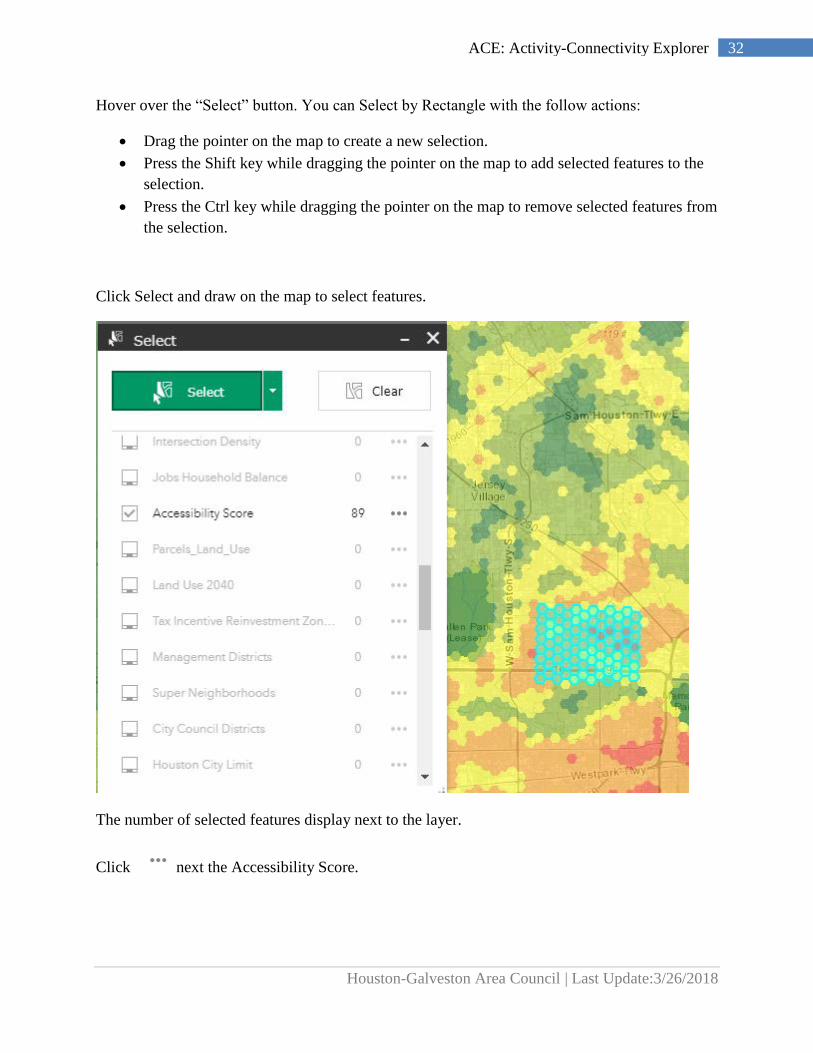
Hover over the “Select” button. You can Select by Rectangle with the follow actions:
• Drag the pointer on the map to create a new selection.
• Press the Shift key while dragging the pointer on the map to add selected features to the
selection.
• Press the Ctrl key while dragging the pointer on the map to remove selected features from
the selection.
Click Select and draw on the map to select features.
The number of selected features display next to the layer.
Click next the Accessibility Score.
Houston-Galveston Area Council | Last Update:3/26/2018
33 ACE: Activity-Connectivity Explorer
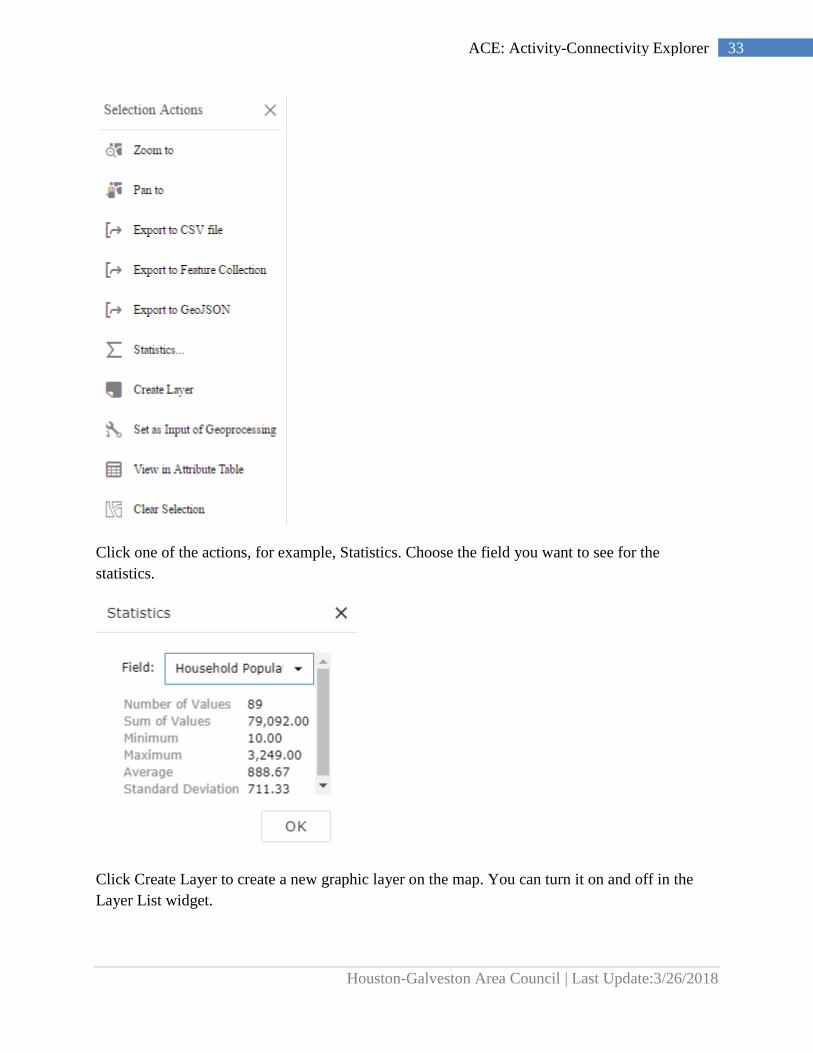
Click one of the actions, for example, Statistics. Choose the field you want to see for the
statistics.
Click Create Layer to create a new graphic layer on the map. You can turn it on and off in the
Layer List widget.

Houston-Galveston Area Council | Last Update:3/26/2018
34 ACE: Activity-Connectivity Explorer
Click Export to CSV file if you check the Allow to export selected features option during the
configuration. A CSV file is generated locally for the feature set.
Select ‘Export to GeoJSON’
Go to a link below.
http://mapshaper.org/ (It works properly with Google Chrome Brower.)
Drop or select a GeoJSON file to import the file to the app. Export it as a shape file.
Houston-Galveston Area Council | Last Update:3/26/2018
35 ACE: Activity-Connectivity Explorer
8. Data Dictionary
• ID: Hexagon ID
Raw Value
• hh: number of household in 2017
• hp: number of household population excluding Group-Quarter population in 2017
• j: number of jobs in 2017
• jp: number of activity population (household population + jobs) in 20167
• int: number of intersection in 2017
• Ped-Bike Destination in 2017
• Houston METRO facilities in 2017
Clustering Density
• hh_s1: clustering household density (household/square mile)
• hp_s1: clustering household population density (household population/square mile)
• j_s1: clustering employment density (jobs/square mile)
• jp_s1: clustering activity population density (activity population/square mile)
• int_s1: clustering intersection density (intersection/square mile)
Index
• hh_s1_cum: household index (cumulative percentage) between 0 - 1
• hp_s1_cum: household population index (cumulative percentage) between 0 -1
• j_s1_cum: job index (cumulative percentage) between 0 - 1
• jp_s1_cum: activity population index (cumulative percentage) between 0 - 1
• int_s1_cum: intersection index (cumulative percentage) between 0 - 1
Ratio
• jobs_hh_ratio_s1: clustering jobs density/clustering household density ratio
Accessibility Score
• Activity Index: Activity population index between 0 – 100
• Connectivity Index: Intersection index between 0 – 100
• Amenity Index: Access to Ped-Bike destinations between 0 – 100
• Accessibility Score = Activity Index (40%) + Connectivity (30%) + Amenity Index
(30%) between 0 - 100
For questions or concerns please contact [email protected]