Embed Size (px)
Citation preview
Oracle White Paper — Application Performance Management with Oracle Enterprise Manager 11g
An Oracle White Paper
April 2010
Application Performance Management with Oracle Enterprise Manager 11g
Oracle White Paper — Application Performance Management with Oracle Enterprise Manager 11g
Introduction ....................................................................................... 1
Top Challenges of Application Performance Management ................ 2
Oracle’s Application Performance Management solution................... 4
User Experience Management ...................................................... 4
Business Transaction Management............................................... 7
Component Diagnostics............................................................... 11
System Modeling ......................................................................... 14
APM Database ............................................................................ 17
Conclusion ...................................................................................... 18

Oracle White Paper — Application Performance Management with Oracle Enterprise Manager 11g
1
Introduction
Organizations have to be agile and cost-effective at the same time, to compete globally and adapt to changes in business & technology. They have responded by automating more of their business processes by IT supported applications. As a result, IT operations management has become increasingly application-centric. While most IT operations teams still regard the management of individual components and tiers (virtual servers, hardware machine, database, servers, application servers, networks, storage farms, etc.) as their core competency, they have increasingly come to understand that these elements deliver value to the business only in the context of the applications they support. Business decision makers also view the applications in terms of their ability to support critical business activity, such as the volume and response time on product quotes provided, orders executed, and payments processed. In other words, IT needs a business-driven way of managing applications. This white paper outlines some common challenges faced by IT administrators running enterprise applications and describes how Oracle Enterprise Manager provides the Application Performance Management (APM) capabilities to enable customers to maximize the performance and availability of applications and business transactions with the most cost-effective methods available.

Oracle White Paper — Application Performance Management with Oracle Enterprise Manager 11g
2
Top Challenges of Application Performance Management
In a recent survey of IT administrators the 3 biggest problems facing them today is slow response times, users experiencing errors, and application availability. More tellingly, they also agreed that the #1 method by which they find out about these problems is through calls from end-users. This clearly demonstrates that the investments to date in managing applications is no yielding results, since they are not only unable to address basic issues of response time, errors, and application availability, but they are also not able to provide early warning alerts to administrators to help resolve these problems. The end result is that IT operations are left reacting to user complaints, and they do not have any data or metrics about the problems being reported, so they must often resort to costly and time consuming “all hands” calls to try to triage the issue.
Current management techniques are not
effective
6%
14%
28%
23%
24%
52%
60%
85%
Other
Data was lost
Were kicked off
page
Were unable to
proceed to new page
Application was
difficult to navigate
Application was
down or unavailable
Received error
messages
Slow response times
5%
32%
36%
50%
80%
4%
22%
24%
50%
72%
10%
16%
17%
25%
71%
Other
Calls from Senior
Management
Service Level
Management
alers
System
Management
alers
Calls from
customers/ end-
users
How Companies Are Alerted to Application problems
Types of Problems Your End-Users Encounter
Applications are not meeting
end user expectations…
… and you don’t even know it
Source: Performance Under Pressure: 2009 OAUG ResearchLine Survey
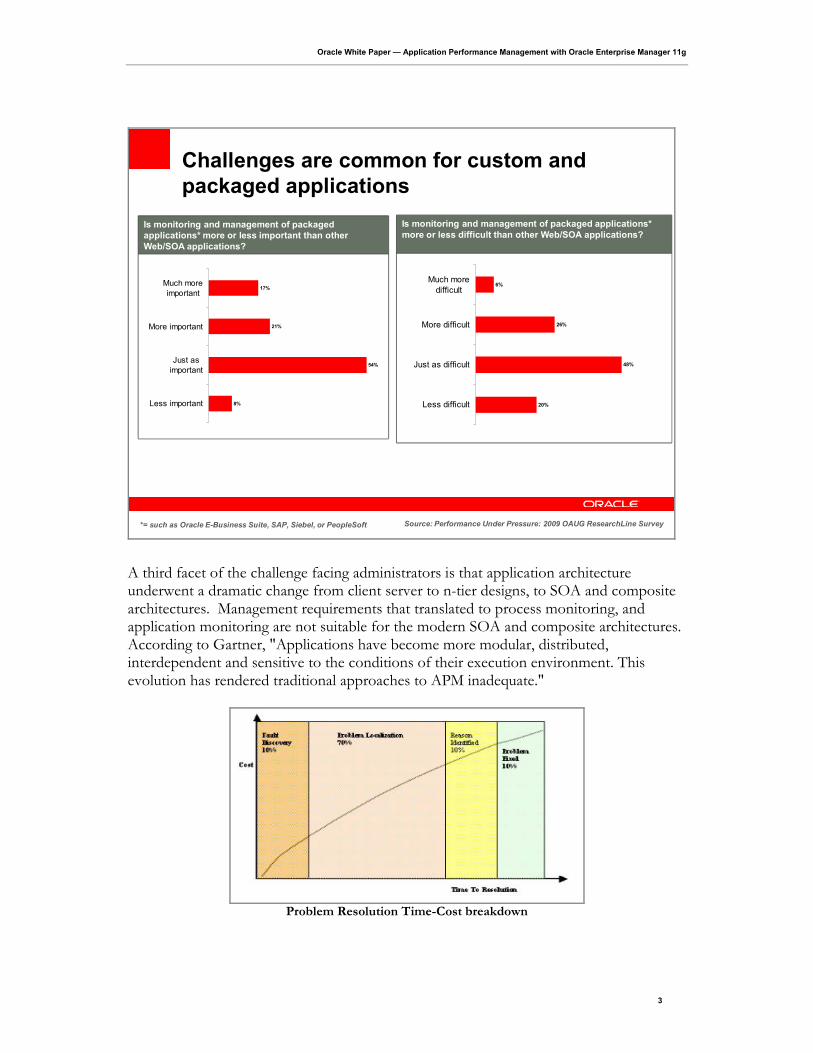
In the same survey the administrators also highlighted the fact that these issues are “just as important” and “just as difficult” to address between packaged and custom applications.
Oracle White Paper — Application Performance Management with Oracle Enterprise Manager 11g
3
Challenges are common for custom and
packaged applications
Is monitoring and management of packaged applications*
more or less difficult than other Web/SOA applications?Is monitoring and management of packaged
applications* more or less important than other
Web/SOA applications?
Source: Performance Under Pressure: 2009 OAUG ResearchLine Survey
20%
48%
26%
6%
Less difficult
Just as difficult
More difficult
Much more
difficult
8%
54%
21%
17%
Less important
Just as
important
More important
Much more
important
*= such as Oracle E-Business Suite, SAP, Siebel, or PeopleSoft
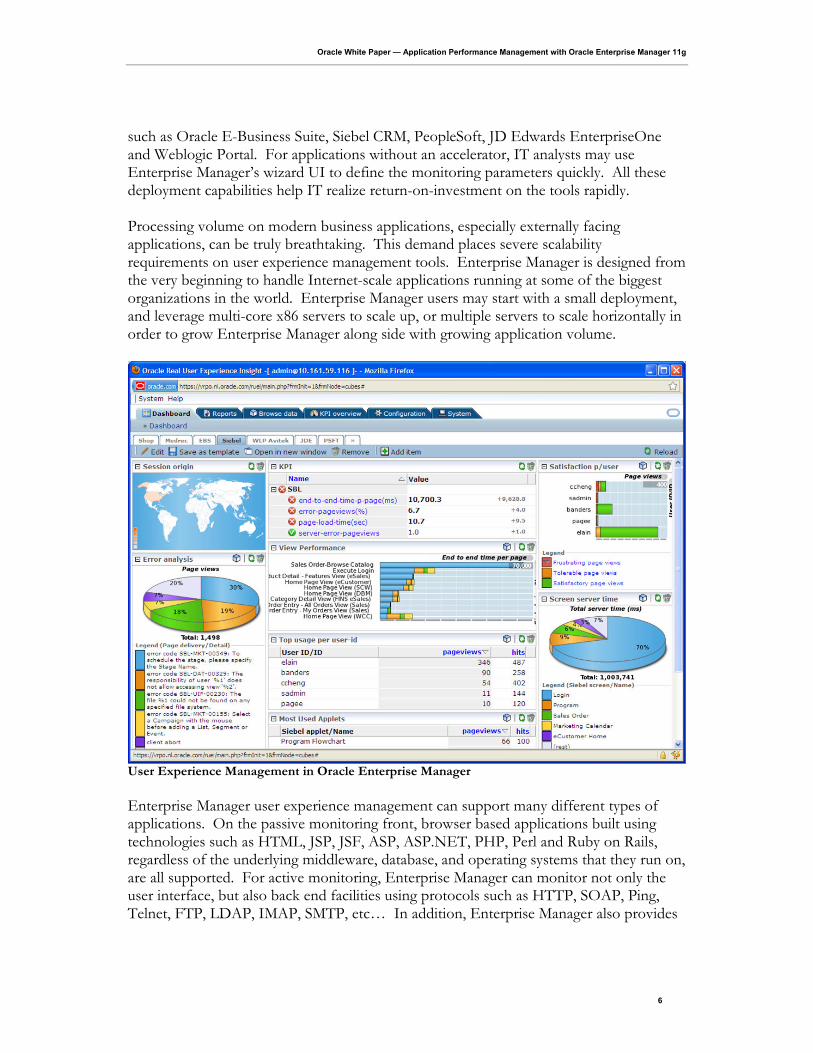
A third facet of the challenge facing administrators is that application architecture underwent a dramatic change from client server to n-tier designs, to SOA and composite architectures. Management requirements that translated to process monitoring, and application monitoring are not suitable for the modern SOA and composite architectures. According to Gartner, "Applications have become more modular, distributed, interdependent and sensitive to the conditions of their execution environment. This evolution has rendered traditional approaches to APM inadequate."
Problem Resolution Time-Cost breakdown

Oracle White Paper — Application Performance Management with Oracle Enterprise Manager 11g
4
Oracle’s Application Performance Management solution
To address the challenges out lined above, Oracle has developed a solution that encompasses 5 key aspects of managing application performance
1. User Experience Management – The ultimate measure of application performance, monitoring the user experience can provide insights not possible by server and application monitoring alone
2. Business Transaction Management – for transaction visibility, performance analysis, and exception management
3. Component Diagnostics – for visibility into component performance and resource utilization. To facilitate root cause analysis and remediation
4. System Modeling & Monitoring – for IT system dependency mapping, application component dependency mapping, transaction modeling, and monitoring of system components
5. APM Database – for a common view across all user, system, application component, and transaction metric data and dependencies
User Experience Management
End users rely on enterprise applications to accomplish specific business activities. These activities can range from a call center agent taking orders over the phone, a manufacturing planner scheduling production runs on a shop floor, to a consuming filing a service request to get assistance from an organization’s Internet website. Most of these users are not technical, and to them, the application is IT. In fact, in the case of external end users, the application is the company. A sub-optimal application can negatively impact not only the immediate business activities that the users try to perform, but also the brand image of an organization, revenue, and ultimately, profit. When something is not working in an application, application IT operations teams are immediately placed on the defensive. It doesn’t matter whether the root cause of the problem is in the underlying infrastructure such as server or network, or if it is even a user mistake. It is always the application’s fault, as it is the only thing that end users see. Therefore, it is critically important that IT operations manage applications from the end user perspective. The first step in doing this is to gain visibility of what goes on in applications. Oracle Enterprise Manager provides IT operations the ultimate in end user experience visibility. It helps application administrators answer critical questions, such as:
- Who are using the applications? - Where are the end users coming from? - When do they use the applications? - What parts of the applications are they using? - What kinds of error are they running into? - What sort of response time are they getting?

Oracle White Paper — Application Performance Management with Oracle Enterprise Manager 11g
5
In order to help IT answer the above questions, Enterprise Manager collects very detailed information about application usage. Having the capability to collect information is not enough. In order for the tool to be used in production deployment practically, Enterprise Manager also needs to be non-intrusive to the application and end users, easy to deploy, scalable to handle massive application activities, support a range of different application technologies and provide proactive warnings and flexible data analysis to maximize the benefit of having the data available. Enterprise Manager satisfies all these technical requirements.
Oracle Enterprise Manager’s end-to-end performance management capabilities provide full visibility both vertically and horizontally across the application infrastructure.
There are several ways that user experience management tools can be intrusive. First, the tool may require the application to be modified or software be deployed to end user clients. Second, the tool may add latency to application transactions. Third, the tool may compete with applications for resources. Enterprise Manager suffers none of these problems. Enterprise Manager supports both active and passive end user monitoring. Using network protocol analysis as the means to passively collect application usage data, and standalone synthetic transaction “beacons” for active monitoring, Enterprise Manager does not require any software to be installed on end user clients or on the servers that applications run on. As such, it does not require any change to be made on the applications, nor does it add any overhead because the tool runs separately from the applications. In addition to not requiring software to be installed on clients nor application servers, Enterprise Manager’s ease of deployment is enhanced through a set of Accelerator that automates many setup tasks commonly associated with user experience management tools. These accelerators provide out-of-box support for leading enterprise applications
Oracle White Paper — Application Performance Management with Oracle Enterprise Manager 11g
6
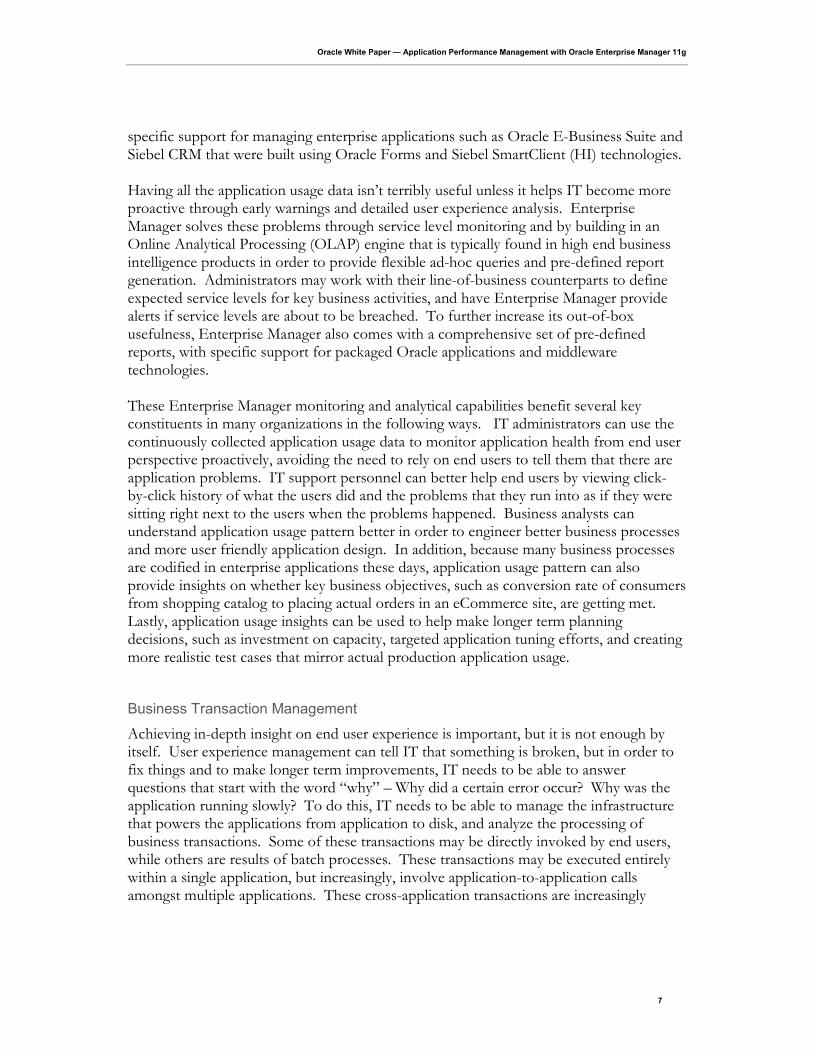
such as Oracle E-Business Suite, Siebel CRM, PeopleSoft, JD Edwards EnterpriseOne and Weblogic Portal. For applications without an accelerator, IT analysts may use Enterprise Manager’s wizard UI to define the monitoring parameters quickly. All these deployment capabilities help IT realize return-on-investment on the tools rapidly. Processing volume on modern business applications, especially externally facing applications, can be truly breathtaking. This demand places severe scalability requirements on user experience management tools. Enterprise Manager is designed from the very beginning to handle Internet-scale applications running at some of the biggest organizations in the world. Enterprise Manager users may start with a small deployment, and leverage multi-core x86 servers to scale up, or multiple servers to scale horizontally in order to grow Enterprise Manager along side with growing application volume.
User Experience Management in Oracle Enterprise Manager
Enterprise Manager user experience management can support many different types of applications. On the passive monitoring front, browser based applications built using technologies such as HTML, JSP, JSF, ASP, ASP.NET, PHP, Perl and Ruby on Rails, regardless of the underlying middleware, database, and operating systems that they run on, are all supported. For active monitoring, Enterprise Manager can monitor not only the user interface, but also back end facilities using protocols such as HTTP, SOAP, Ping, Telnet, FTP, LDAP, IMAP, SMTP, etc… In addition, Enterprise Manager also provides
Oracle White Paper — Application Performance Management with Oracle Enterprise Manager 11g
7
specific support for managing enterprise applications such as Oracle E-Business Suite and Siebel CRM that were built using Oracle Forms and Siebel SmartClient (HI) technologies. Having all the application usage data isn’t terribly useful unless it helps IT become more proactive through early warnings and detailed user experience analysis. Enterprise Manager solves these problems through service level monitoring and by building in an Online Analytical Processing (OLAP) engine that is typically found in high end business intelligence products in order to provide flexible ad-hoc queries and pre-defined report generation. Administrators may work with their line-of-business counterparts to define expected service levels for key business activities, and have Enterprise Manager provide alerts if service levels are about to be breached. To further increase its out-of-box usefulness, Enterprise Manager also comes with a comprehensive set of pre-defined reports, with specific support for packaged Oracle applications and middleware technologies. These Enterprise Manager monitoring and analytical capabilities benefit several key constituents in many organizations in the following ways. IT administrators can use the continuously collected application usage data to monitor application health from end user perspective proactively, avoiding the need to rely on end users to tell them that there are application problems. IT support personnel can better help end users by viewing click-by-click history of what the users did and the problems that they run into as if they were sitting right next to the users when the problems happened. Business analysts can understand application usage pattern better in order to engineer better business processes and more user friendly application design. In addition, because many business processes are codified in enterprise applications these days, application usage pattern can also provide insights on whether key business objectives, such as conversion rate of consumers from shopping catalog to placing actual orders in an eCommerce site, are getting met. Lastly, application usage insights can be used to help make longer term planning decisions, such as investment on capacity, targeted application tuning efforts, and creating more realistic test cases that mirror actual production application usage.
Business Transaction Management
Achieving in-depth insight on end user experience is important, but it is not enough by itself. User experience management can tell IT that something is broken, but in order to fix things and to make longer term improvements, IT needs to be able to answer questions that start with the word “why” – Why did a certain error occur? Why was the application running slowly? To do this, IT needs to be able to manage the infrastructure that powers the applications from application to disk, and analyze the processing of business transactions. Some of these transactions may be directly invoked by end users, while others are results of batch processes. These transactions may be executed entirely within a single application, but increasingly, involve application-to-application calls amongst multiple applications. These cross-application transactions are increasingly
Oracle White Paper — Application Performance Management with Oracle Enterprise Manager 11g
8
common for customers implementing Service Oriented Architecture (SOA) using leading edge blueprints such as Oracle Application Integration Architecture (AIA). Business transactions are often executed by arranging, or "orchestrating," existing applications and infrastructure to implement business processes. They incorporate a wide variety of technologies, deployed across many platforms and organizational boundaries. Common technologies include intermediaries such as ESBs, Process Engines, middleware, legacy and packaged applications. Composite applications incorporate a range of shared components, such as SOAP services, packaged applications, EJBs, POJOs, ESBs, databases and so on. However, despite the complexity of such processes, they must behave as single, seamless transactions from the point of view of the business user. IT operations staff responsible for these business systems therefore faces a variety of challenges. To overcome these challenges, they need to be able to answer questions such as:
- Which business transaction is servicing the most customers? - Which transaction is responsible for the most revenue? - Which transaction will incur the highest financial penalty for a failure? - What are the status these key transactions? - Which transactions are reporting errors? - If there are failures, which components are causing them?
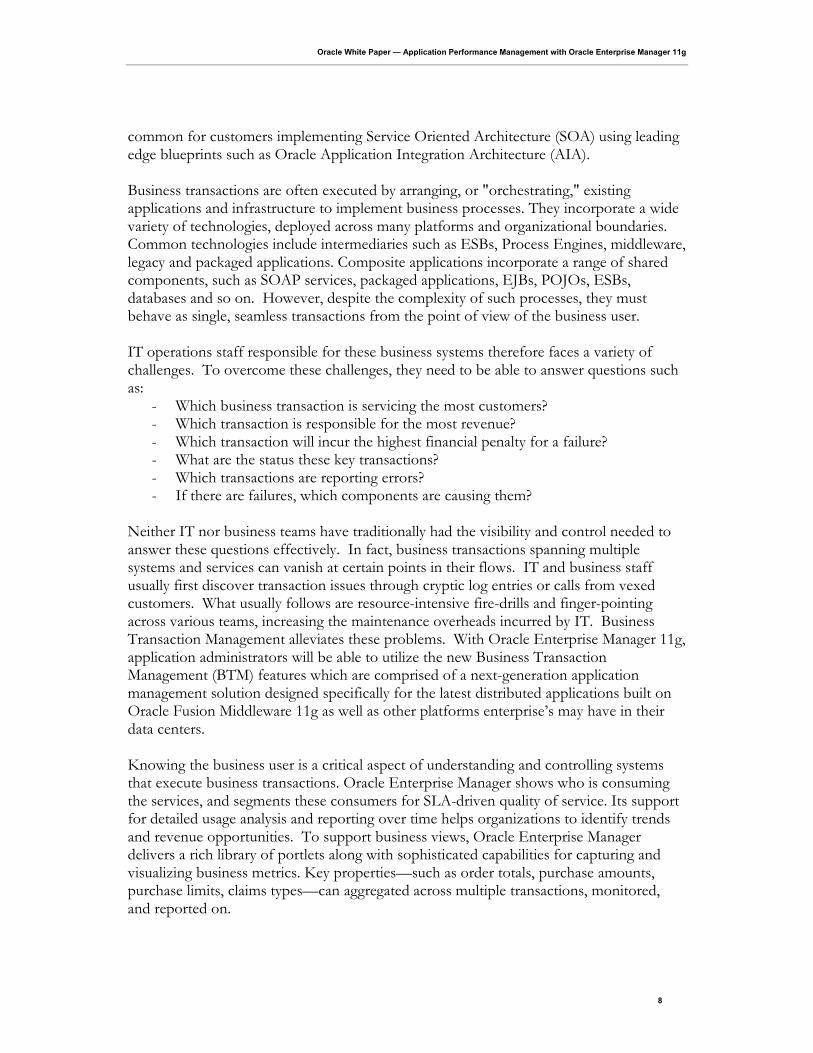
Neither IT nor business teams have traditionally had the visibility and control needed to answer these questions effectively. In fact, business transactions spanning multiple systems and services can vanish at certain points in their flows. IT and business staff usually first discover transaction issues through cryptic log entries or calls from vexed customers. What usually follows are resource-intensive fire-drills and finger-pointing across various teams, increasing the maintenance overheads incurred by IT. Business Transaction Management alleviates these problems. With Oracle Enterprise Manager 11g, application administrators will be able to utilize the new Business Transaction Management (BTM) features which are comprised of a next-generation application management solution designed specifically for the latest distributed applications built on Oracle Fusion Middleware 11g as well as other platforms enterprise’s may have in their data centers. Knowing the business user is a critical aspect of understanding and controlling systems that execute business transactions. Oracle Enterprise Manager shows who is consuming the services, and segments these consumers for SLA-driven quality of service. Its support for detailed usage analysis and reporting over time helps organizations to identify trends and revenue opportunities. To support business views, Oracle Enterprise Manager delivers a rich library of portlets along with sophisticated capabilities for capturing and visualizing business metrics. Key properties—such as order totals, purchase amounts, purchase limits, claims types—can aggregated across multiple transactions, monitored, and reported on.
Oracle White Paper — Application Performance Management with Oracle Enterprise Manager 11g
9
Business Transaction Management Performance Dashboard in Oracle Enterprise Manager
Oracle Enterprise Manager provides sophisticated instrumentation for real-time detection, alerting, and remediation of various types of unexpected technical exceptions or business conditions. Using Oracle Enterprise Manager, application support personnel can quickly search transactions based on message content and context—such as time of arrival, message type, customer ID, or part number—to locate the transaction in questions and rapidly nail down the root cause of a problem. They can examine the full set of messages or correlated application invocations to understand the full context of any anomaly. These capabilities mean that Oracle Enterprise Manager slashes the time it takes to diagnose runtime issues from hours to minutes. Users can quickly drill down to find the root cause of transaction failures and other unexpected conditions—significantly reducing mean time to repair. Oracle Enterprise Manager’s root-cause analysis capabilities address a range of issues common in business transactions, such stalled transactions, missing steps, faults, and application exceptions, as well as low-level issues such as incorrect data values, boundary conditions, and so on. It does this flexibly, enabling users to define the conditions of interest. Oracle Enterprise
Oracle White Paper — Application Performance Management with Oracle Enterprise Manager 11g
10
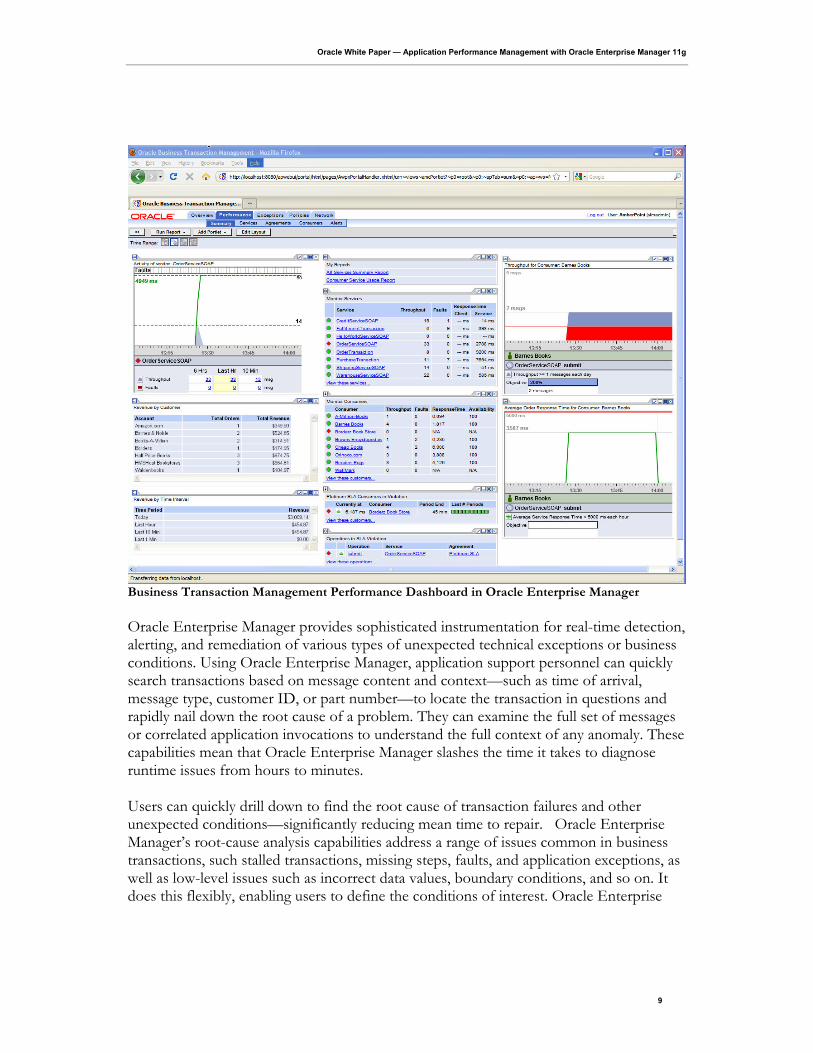
Manager then monitors all the traffic flowing across the system, waiting for the moment an exceptional event occurs. In complex transactions, such an exercise can be difficult. Usually, application teams have little choice but to cull information from widely dispersed log files. Oracle Enterprise Manager solves this problem by automatically aggregating and organizing messages from all participating components, while automatically tagging faults or exceptional conditions. This contextualized, real-time makes it easy for Operations personnel to rapidly locate offending components, while providing application support teams with detailed information useful for reproducing, analyzing, and repairing the problem, thus slashing mean time to repair.
Cross-Tier Diagnostics in Oracle Enterprise Manager
To support in-depth management of business transaction described above, Oracle Enterprise Manager inspects and monitor the content of messages and application invocations as they flow across applications and tiers. All metrics gathering and measurement are performed without requiring any alteration to the application code, service logic or message traffic. This non-invasive approach enables users to customize

Oracle White Paper — Application Performance Management with Oracle Enterprise Manager 11g
11
measurements on-the-fly, without interrupting the running system or any existing applications that might be sensitive to proprietary modification of messages. Oracle Enterprise Manager continuously monitors message exchange and application invocations—both synchronous and asynchronous--to collect data on the operational health of application components and to relate that behavior to the higher level construct of the associated business transactions. Enterprise Manager extends visibility to primary application services, such as SOAP and REST web services, to underlying implementation components such as EJBs, POJOs, and JMS queues components, right down to database queries. It provides a rich snapshot of vital runtime data—such as throughput, availability, response times and faults—across a range of time intervals and within the context of the business transaction and the business user. It monitors all flavors of application services, ranging from SOAP and XML services to virtually any application service or legacy component—such as EJBs, Plain Old Java Objects, etc. Enterprise Manager can instrument virtually any distributed application service.
Component Diagnostics
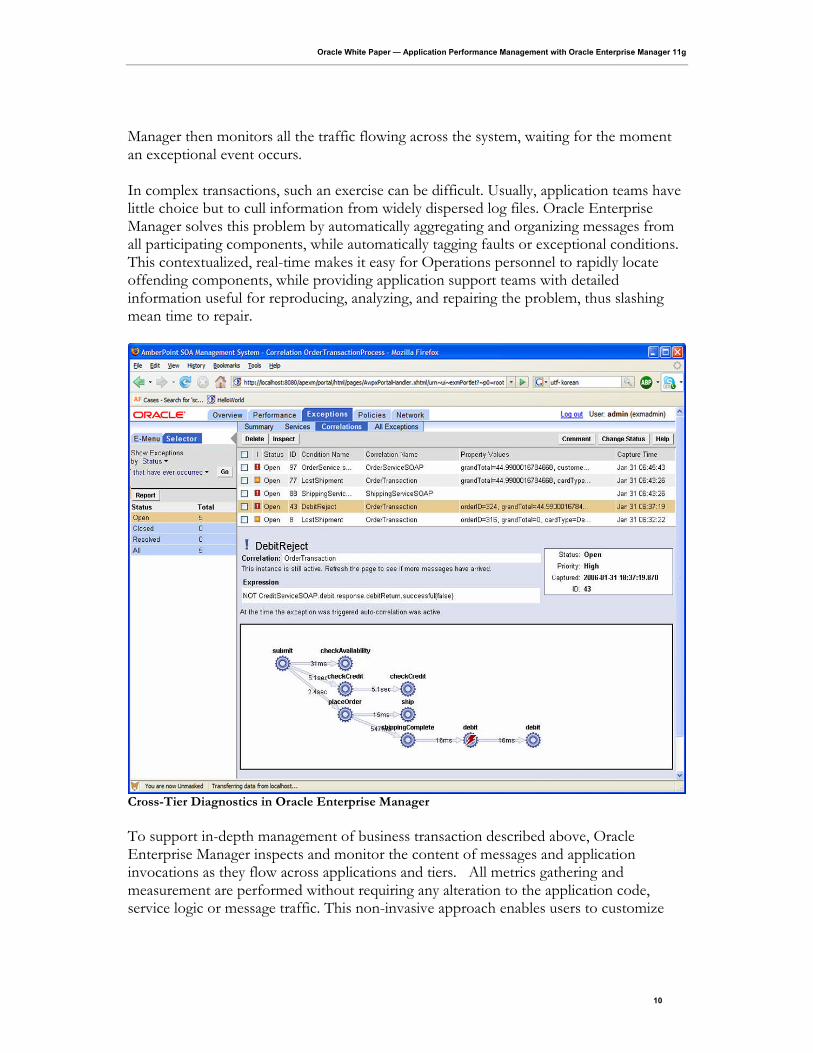
Once a problem is isolated to a particular component, IT needs to carry out in-depth diagnostic of that component. As numerous technologies are used in typical application environments, and each piece of technology presents its own idiosyncrasies, specialized tools built with in-depth knowledge of the component are needed to troubleshoot them. These tools are available both for Java applications running on Oracle Database, as well as major packaged Oracle Applications such as Siebel CRM. JVM Diagnostics Leveraging Oracle’s unparalleled expertise in Java technologies, Oracle Enterprise Manager provides deep diagnostics for any JVM within the application infrastructure providing immediate insight into actual thread stack or other common JVM issues. Enterprise Manager’s deep diagnostic tool operates at native level, which makes it possible to have extremely low performance overheads (<1%) making it perfectly suitable for 24/7 real-time production diagnostics. Using Oracle Enterprise Manager, administrators can take JVM heap dump and analyze the classes for memory consumption. User can easily perform differential heap analysis of heap dumps taken at two different times. Enterprise Manager quickly pinpoints the cause of memory leaks by showing the classes and their fields that have grown in size. Again, finding memory leaks may take several man-hours resulting in higher maintenance costs.
Oracle White Paper — Application Performance Management with Oracle Enterprise Manager 11g
12
JVM Diagnostics in Oracle Enterprise Manager
Oracle Enterprise Manager also correlates the Java session to that of a database session making it possible to do cross-tier analysis. The status and call stack of all active threads in a JVM are all easily accessible. The threads may be viewed in the context of a user request, and if a particular thread is waiting for a database lock, the tool can show the line of Java code that the thread is stuck in as well as the SQL statement responsible for the table lock. Using this insight, database administrators can take necessary steps to release the table lock so that the stuck thread will continue to run. Without such native monitoring tool it may take hours or days to figure out where exactly the problem is and by that time an administrator would loose the execution context. Database Diagnostics For applications running on Oracle Database, Oracle Enterprise Manager provides best-in-class diagnostics unavailability to other tools on the market. Built into Oracle Database is a self-diagnostic engine, called Automatic Database Diagnostic Monitoring (ADDM), that periodically examines the state of the database, automatically identifies potential database performance bottlenecks, and recommends corrective actions. Enterprise Manager presents ADDM’s findings and recommendations in a convenient and intuitive fashion, and guides administrators step-by-step to quickly resolve performance problems by implementing ADDM’s recommendations.
Oracle White Paper — Application Performance Management with Oracle Enterprise Manager 11g
13
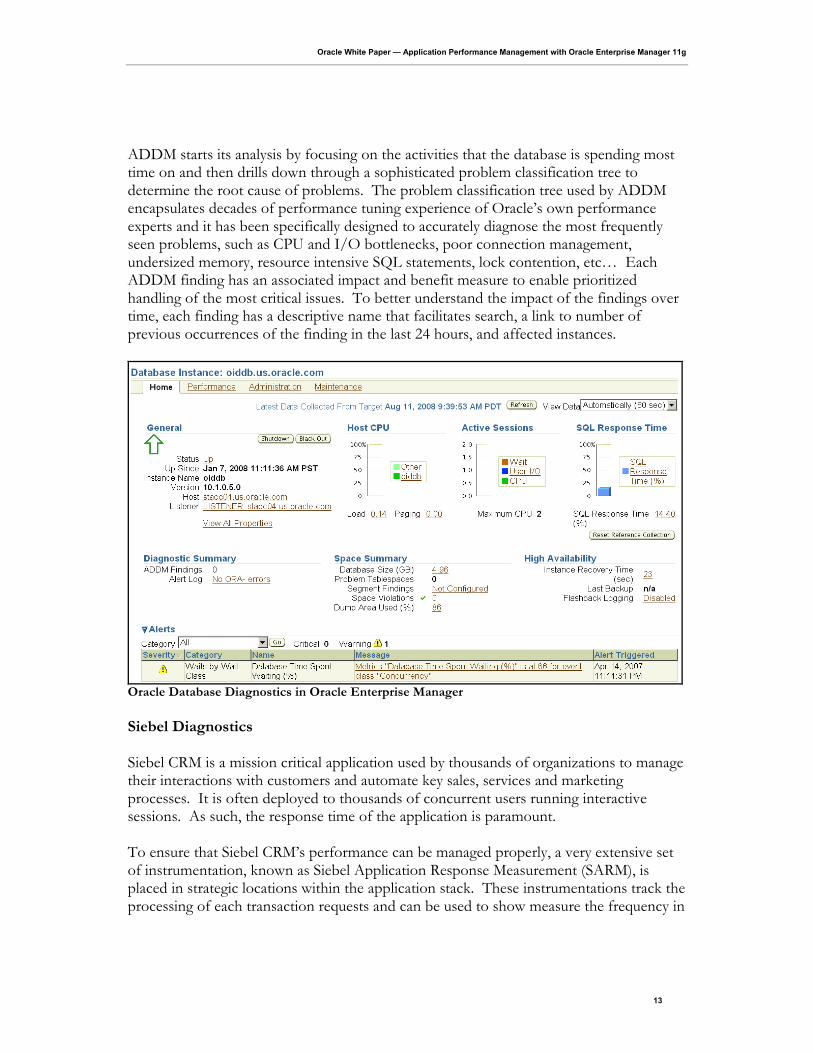
ADDM starts its analysis by focusing on the activities that the database is spending most time on and then drills down through a sophisticated problem classification tree to determine the root cause of problems. The problem classification tree used by ADDM encapsulates decades of performance tuning experience of Oracle’s own performance experts and it has been specifically designed to accurately diagnose the most frequently seen problems, such as CPU and I/O bottlenecks, poor connection management, undersized memory, resource intensive SQL statements, lock contention, etc… Each ADDM finding has an associated impact and benefit measure to enable prioritized handling of the most critical issues. To better understand the impact of the findings over time, each finding has a descriptive name that facilitates search, a link to number of previous occurrences of the finding in the last 24 hours, and affected instances.
Oracle Database Diagnostics in Oracle Enterprise Manager
Siebel Diagnostics Siebel CRM is a mission critical application used by thousands of organizations to manage their interactions with customers and automate key sales, services and marketing processes. It is often deployed to thousands of concurrent users running interactive sessions. As such, the response time of the application is paramount. To ensure that Siebel CRM’s performance can be managed properly, a very extensive set of instrumentation, known as Siebel Application Response Measurement (SARM), is placed in strategic locations within the application stack. These instrumentations track the processing of each transaction requests and can be used to show measure the frequency in
Oracle White Paper — Application Performance Management with Oracle Enterprise Manager 11g
14
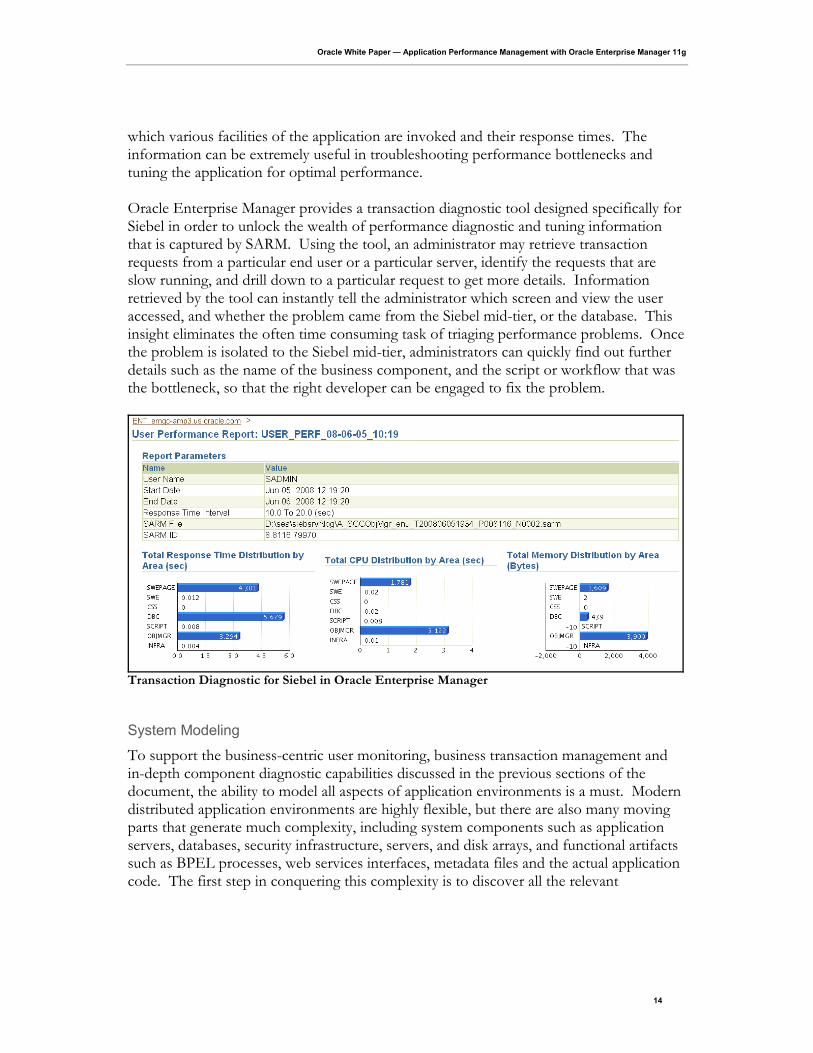
which various facilities of the application are invoked and their response times. The information can be extremely useful in troubleshooting performance bottlenecks and tuning the application for optimal performance. Oracle Enterprise Manager provides a transaction diagnostic tool designed specifically for Siebel in order to unlock the wealth of performance diagnostic and tuning information that is captured by SARM. Using the tool, an administrator may retrieve transaction requests from a particular end user or a particular server, identify the requests that are slow running, and drill down to a particular request to get more details. Information retrieved by the tool can instantly tell the administrator which screen and view the user accessed, and whether the problem came from the Siebel mid-tier, or the database. This insight eliminates the often time consuming task of triaging performance problems. Once the problem is isolated to the Siebel mid-tier, administrators can quickly find out further details such as the name of the business component, and the script or workflow that was the bottleneck, so that the right developer can be engaged to fix the problem.
Transaction Diagnostic for Siebel in Oracle Enterprise Manager
System Modeling
To support the business-centric user monitoring, business transaction management and in-depth component diagnostic capabilities discussed in the previous sections of the document, the ability to model all aspects of application environments is a must. Modern distributed application environments are highly flexible, but there are also many moving parts that generate much complexity, including system components such as application servers, databases, security infrastructure, servers, and disk arrays, and functional artifacts such as BPEL processes, web services interfaces, metadata files and the actual application code. The first step in conquering this complexity is to discover all the relevant
Oracle White Paper — Application Performance Management with Oracle Enterprise Manager 11g
15
application components and model their relationships. Using the model that is built, application administrators can answer questions such as:
- What are the components that an application is made up of? - How are these components related to each other? - How are they utilized?
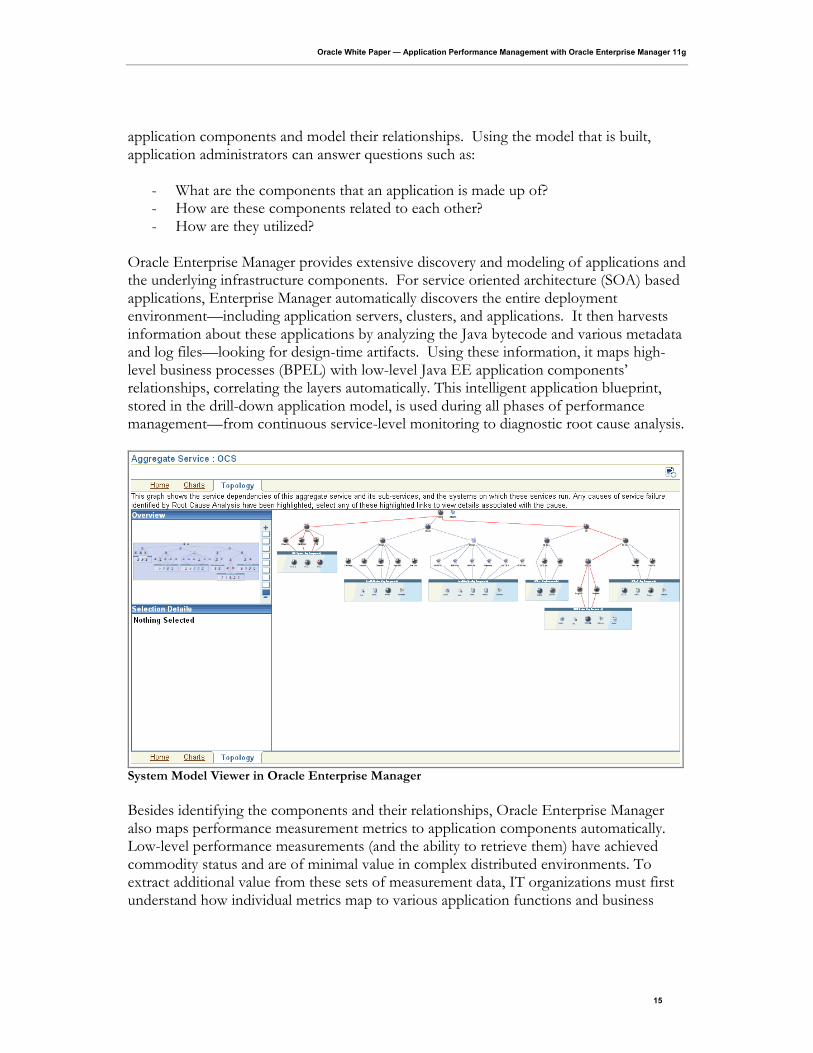
Oracle Enterprise Manager provides extensive discovery and modeling of applications and the underlying infrastructure components. For service oriented architecture (SOA) based applications, Enterprise Manager automatically discovers the entire deployment environment—including application servers, clusters, and applications. It then harvests information about these applications by analyzing the Java bytecode and various metadata and log files—looking for design-time artifacts. Using these information, it maps high-level business processes (BPEL) with low-level Java EE application components’ relationships, correlating the layers automatically. This intelligent application blueprint, stored in the drill-down application model, is used during all phases of performance management—from continuous service-level monitoring to diagnostic root cause analysis.
System Model Viewer in Oracle Enterprise Manager
Besides identifying the components and their relationships, Oracle Enterprise Manager also maps performance measurement metrics to application components automatically. Low-level performance measurements (and the ability to retrieve them) have achieved commodity status and are of minimal value in complex distributed environments. To extract additional value from these sets of measurement data, IT organizations must first understand how individual metrics map to various application functions and business
Oracle White Paper — Application Performance Management with Oracle Enterprise Manager 11g
16
processes, or to both. With traditional tools, the only way to get this correlation is to depend on application experts—application developers and architects—who can reverse-engineer the managed applications in hopes of identifying the business context for each low-level component and its associated metrics. As discussed above, though, the exponentially increasing complexity of distributed applications makes this approach untenable. Although it might be worth investing in a manual process of mapping measurements to a single application, repeating the process for multiple applications—and redoing the analysis when changes occur—is not scalable in enterprise environments. Oracle Enterprise Manager differs from conventional tools, because its model-driven approach automatically maps performance measurements to applications, enabling users to extract value from these measurements almost immediately. For each deployed and running application, Enterprise Manager uses the application model to automatically determine optimal locations in which to insert tracers—timers and counter probes for taking performance measurements. The specialized tracer data is combined with other low-level component metrics, Java Management Extensions (JMX) metrics, and system metrics—keeping all data within the context of business processes—to ensure complete visibility. Oracle Enterprise Manager also has the unique ability to visually represent the logical flow of BPEL processes. This capability gives those who lack detailed application knowledge the opportunity to explore, learn, and understand the design of these composite applications. Additionally, Enterprise Manager presents performance measurements alongside the workflow diagram. When users click on a specific process node (or group), the associated performance measurements is displayed. With these of discovery and modeling in place, Enterprise Manager users can identify and solve performance problems faster and easier than they can with conventional tools. For packaged Oracle Applications, Oracle Enterprise Manager uses native in-depth topology information that the applications maintain to build representative models for monitoring and management. Each instance of application-specific components such as PeopleSoft Application Server Domain and Siebel Gateway Server are discovered and modeled as a target within Enterprise Manager. In addition to identifying the entities, Enterprise Manager also collects configuration parameters of these components so that changes to their settings can be tracked automatically. Discovering the individual application components and collecting their configuration parameters is just the first step. A single instance of these mission critical packaged applications may be made up of dozens if not hundreds of these components, and it would be very tedious to manage them separately as individual entities. Oracle Enterprise Manager solves this problem by utilizing higher level abstractions, including system, service and group targets. A system target is used to represent the aggregation of all physical application components in a single application instance. This aggregation allows application administrators to monitor and manage the various application components
Oracle White Paper — Application Performance Management with Oracle Enterprise Manager 11g
17
together by providing summary metrics and graphical dashboards to help visualize the overall health of the application, and enable operations to be applied against the entire application. Sometimes, administrators desire greater control to manage specific subsystem within an application. This can be done via the group target. Group targets allow any arbitrary application components that are modeled as individual targets to be aggregated together. Similar to the system target, summary metrics, graphical dashboards and group operations may then be applied to targets within a group. Besides representing the physical entities using system and group targets, Oracle Enterprise Manager can be used to model the logical business view of applications using service targets. Each application instance may offer multiple services to the end users. For example, a single ERP application instance may include financial, manufacturing and human resources modules, and these modules are used by different end users. To these people, these modules are distinct services. In order for IT to serve the needs of the end users properly, IT needs to have visibility on the health of the services as end users see them. In this case, the three modules can each be modeled as one or more services. As services are defined, additional metrics, such as availability target, performance target, business calendar, etc… can be added to form a service level agreement for each service. Synthetic service test may also be defined to model the business processes that end users carry out in order to ensure that they can be supported successfully by the application.
APM Database
Besides extensive modeling capabilities, another key foundational component of a robust application management solution is the Application Performance Management database. This database serves as the repository for modeling the application and infrastructure components that are discovered and storing the various run-time telemetry data that is collected. A properly designed database maximizes the usefulness of the application performance data. Leveraging Oracle Database as the foundation, Oracle Enterprise Manager collects, organizes and publishes the rich set of data that is collected via its repository. Enterprise Manager’s repository is not just an APM database. It is part of a comprehensive repository that also implements a configuration management database (CMDB), a software library, and tracking of additional information for managing problems and incidents. This integrated approach in the Enterprise Manager repository enables integrated tools to be built, erasing the artificial boundaries between application performance management, configuration management and change management. In addition, because the repository is built on Oracle Database, technologies such as Data Guard and Real Application Cluster can be used to ensure that the database is highly availability and scalable.

Oracle White Paper — Application Performance Management with Oracle Enterprise Manager 11g
18
Having a data repository is not enough. The data needs to be made easily accessible so that its usefulness can be maximized. Oracle Enterprise Manager promotes open access to information that is gathered by allowing administrators to either query the data directly via published views, or by exporting the data using standard Oracle Database mechanisms. In addition, user experience management data is further organized into OLAP cubes, further easing access for performing various analysis of end user experience.
Conclusion
Today’s IT organizations are increasingly reliant on packaged applications and adopting SOA, BPM, and Java EE technologies that enable them to quickly connect disparate applications and fulfill ever-changing business needs. Although these applications offer unprecedented flexibility and complexity, they can be difficult to manage without the right tools. To effectively manage this new breed of applications, IT organizations need a new breed of application performance management solution. Oracle Enterprise Manager 11g is the solution. To learn more about its capabilities, please visit our website at http://www.oracle.com/technology/products/oem/mgmt_solutions/apm.html.
Application Performance Management with
Oracle Enterprise Manager 11g
April 2010
Author: Rajiv Taori, Chung Wu
Contributing Authors: Glen Hawkins
Oracle Corporation
World Headquarters
500 Oracle Parkway
Redwood Shores, CA 94065
U.S.A.
Worldwide Inquiries:
Phone: +1.650.506.7000
Fax: +1.650.506.7200
oracle.com
Copyright © 2010, Oracle and/or its affiliates. All rights reserved.
This document is provided for information purposes only and the contents hereof are subject to change without notice. This
document is not warranted to be error-free, nor subject to any other warranties or conditions, whether expressed orally or implied in
law, including implied warranties and conditions of merchantability or fitness for a particular purpose. We specifically disclaim any
liability with respect to this document and no contractual obligations are formed either directly or indirectly by this document. This
document may not be reproduced or transmitted in any form or by any means, electronic or mechanical, for any purpose, without our
prior written permission.
Oracle and Java are registered trademarks of Oracle and/or its affiliates. Other names may be trademarks of their respective
owners.
AMD, Opteron, the AMD logo, and the AMD Opteron logo are trademarks or registered trademarks of Advanced Micro Devices. Intel
and Intel Xeon are trademarks or registered trademarks of Intel Corporation. All SPARC trademarks are used under license and are
trademarks or registered trademarks of SPARC International, Inc. UNIX is a registered trademark licensed through X/Open
Company, Ltd. 0110