Embed Size (px)
Citation preview

The Definitive Guide ToThe Definitive Guide Totmtm
Greg Shields
Application Performance Management
Chapter 6
i
Ch apter 6: APM’s Service‐Centric Monitoring Approach ................................................................... 101
What Is the Service‐Centric Monitoring Approach .......................................................................... 102
But What Is Service “Quality?” .................................................................................................................. 104
Un derstanding the Service Model ........................................................................................................... 105
Component and Service Health ........................................................................................................... 107
The Service Model ..................................................................................................................................... 108
Service Quality ............................................................................................................................................ 111
Cr eating Your Service Model and Implementing APM ................................................................... 113
Step 1: Selection ......................................................................................................................................... 113
Step 2: Definition ....................................................................................................................................... 114
Step 3: Modeling ......................................................................................................................................... 115
Step 4: Measurement ............................................................................................................................... 115
Step 5: Data Analysis ................................................................................................................................ 116
Step 6: Improvement ................................................................................................................................ 116
Step 7: Reporting ....................................................................................................................................... 117
Us ing Your Service Model ........................................................................................................................... 117
Tuning Monitor States ............................................................................................................................. 118
Eliminating Rapid State Change .......................................................................................................... 119
The Service Calendar ................................................................................................................................ 119
The Service‐Centric Approach Quantifies Quality ............................................................................ 120
Chapter 6
ii
Copyright Statement © 2009 Realtime Publishers. All rights reserved. This site contains materials that have been created, developed, or commissioned by, and published with the permission of, Realtime Publishers (the “Materials”) and this site and any such Materials are protected by international copyright and trademark laws.
THE MATERIALS ARE PROVIDED “AS IS” WITHOUT WARRANTY OF ANY KIND, EITHER EXPRESS OR IMPLIED, INCLUDING BUT NOT LIMITED TO, THE IMPLIED WARRANTIES OF MERCHANTABILITY, FITNESS FOR A PARTICULAR PURPOSE, TITLE AND NON-INFRINGEMENT. The Materials are subject to change without notice and do not represent a commitment on the part of Realtime Publishers or its web site sponsors. In no event shall Realtime Publishers or its web site sponsors be held liable for technical or editorial errors or omissions contained in the Materials, including without limitation, for any direct, indirect, incidental, special, exemplary or consequential damages whatsoever resulting from the use of any information contained in the Materials.
The Materials (including but not limited to the text, images, audio, and/or video) may not be copied, reproduced, republished, uploaded, posted, transmitted, or distributed in any way, in whole or in part, except that one copy may be downloaded for your personal, non-commercial use on a single computer. In connection with such use, you may not modify or obscure any copyright or other proprietary notice.
The Materials may contain trademarks, services marks and logos that are the property of third parties. You are not permitted to use these trademarks, services marks or logos without prior written consent of such third parties.
Realtime Publishers and the Realtime Publishers logo are registered in the US Patent & Trademark Office. All other product or service names are the property of their respective owners.
If you have any questions about these terms, or if you would like information about licensing materials from Realtime Publishers, please contact us via e-mail at [email protected].
Chapter 6
101
[Editor's Note: This eBook was downloaded from Realtime Nexus—The Digital Library for IT Professionals. All leading technology eBooks and guides from Realtime Publishers can be ound at f http://nexus.realtimepublishers.com.]
Chapter 6: APM’s Service‐Centric Monitoring Approach
Its 7:30am on a Monday morning, and TicketsRus.com IT Director John Brown has called a staff meeting for his Help desk personnel. Operating as Help desk staff for internal operations as well as Web support for end customers, this group embodies the company’s first line of support for nearly every TicketsRus.com technical issue.
In fact, there aren’t many problems that don’t get initially triaged by John’s Help desk team. Back in the old days, internal problems were often discovered when a user called it into this phone line. It was this very Help desk who first found out about that major Web site problem during last year’s Finals. Painful in the extreme, John was determined to never see a day like that again.
“OK, everyone, settle down,” John asks of the room, “We’re about to get started.”
John called the meeting today to introduce the Help desk staff to his new monitoring system. A project he’s been working on for months, John and his implementation team were finally ready to bring it into full production. Part of that rollout involved creating dashboards that were specifically designed for this team. These dynamic visualizations brought highlevel information about each subsystem’s status to his eyes in the Help desk.
Although he’d admit this group isn’t his most technically adept, they were highly capable of handling phone calls and waiting for green lights on a dashboard to turn red. In fact, that simple capacity was one of their greatest benefits to the organization. With part of their job being triage of any technical problem, they could very quickly identify if a perceived problem was indeed “perceived” or actually real. By inserting this 24x7x365 group into the problem resolution process right at its start, John managed to keep his toplevel engineers on call without burning them out. In short, it was the job of this team to identify why a light went red, and subsequently alert the right people when necessary.
In John’s meeting today, he was ready to unveil his greatly improved set of lights.
“Everyone. We’re here today to unveil a project that’s going to improve how you identify problems,” John begins, “Our APM monitoring solution, which you see here, gives us a highlevel headsup display about each of our production systems. You can see in this graphic that each component is given a stoplight showing green or red. It’s ultimately your job to identify when something goes red, track it down, and alert the right personnel if necessary.
Chapter 6
102
“Everything you see in this visualization is clickable. You’ll notice that if I click on any of these links, I can drill down into even more detail about that item. If you want, you can even click right down into the specific details about the problem.
“Now, I recognize that that level of detail is probably too much for most of us, but the idea here is that everyone from Help desk to engineer to manager to code developer can access this same set of visualizations. This means that you can very quickly and easily walk an engineer or a developer through what you’ve learned once you engage them. Now, we’re all on the same page, and we’re all looking at the same data!
“Any questions?” asks John of the crowd. One hand shoots up.
“Mr. Brown, this is great information,” offers John’s newest employee, one whom John feels has real potential, “I understand that you’re collecting these metrics from essentially everywhere these days. But how are you crunching this data into something that makes sense?”
Real potential, John thinks. He smiles as he looks back to the audience, “Ahhh, great question. There’s the real magic with this system. You see, it’s all about the model…”
What Is the Service‐Centric Monitoring Approach This guide has spent a lot of time talking about monitoring and monitoring integrations. It discussed the history of monitoring. It explained where and how monitoring can be integrated into your existing environment. It outlined in great detail how end user experience (EUE) monitoring layers over the top of traditional monitoring approaches. Yet in all these discussions, there has been little talk so far about how that monitoring is actually manifested into an APM solution’s end result.
The new employee in this chapter’s episode of our ongoing TicketsRUs.com story asks a critical question about just those kinds of calculations. This individual recognizes that widespread monitoring integrations enable an IT infrastructure to view behaviors all across the environment. They understand that you have to plug into each component if you’re to gather a holistic set of data. But actually fitting those pieces together is something that remains cloudy.
It is this process that requires attention at this point in our discussion. In reading through the first five chapters of this guide, you’ve made yourself aware of where monitoring fits into your environment. The next step is in creating meaning out of its raw data. As John mentioned earlier and as you’ll discover shortly, the real magic in an APM solution comes through the creation and use of its Service Model.
Chapter 6
103
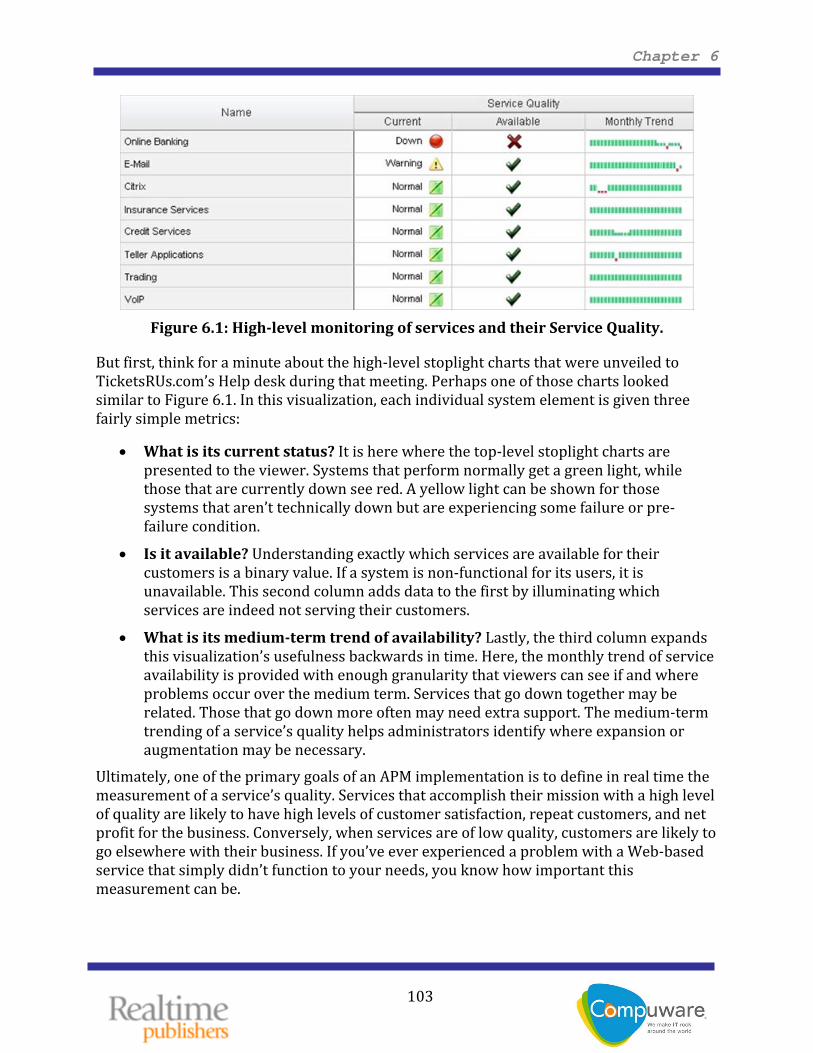
Figure 6.1: Highlevel monitoring of services and their Service Quality.
But first, think for a minute about the high‐level stoplight charts that were unveiled to TicketsRUs.com’s Help desk during that meeting. Perhaps one of those charts looked similar to Figure 6.1. In this visualization, each individual system element is given three fairly simple metrics:
• What is its current status? It is here where the top‐level stoplight charts are presented to the viewer. Systems that perform normally get a green light, while those that are currently down see red. A yellow light can be shown for those systems that aren’t technically down but are experiencing some failure or pre‐failure condition.
• Is it available? Understanding exactly which services are available for their customers is a binary value. If a system is non‐functional for its users, it is unavailable. This second column adds data to the first by illuminating which services are indeed not serving their customers.
• What is its mediumterm trend of availability? Lastly, the third column expands this visualization’s usefulness backwards in time. Here, the monthly trend of service availability is provided with enough granularity that viewers can see if and where problems occur over the medium term. Services that go down together may be related. Those that go down more often may need extra support. The medium‐term trending of a service’s quality helps administrators identify where expansion or augmentation may be necessary.
Ultimately, one of the primary goals of an APM implementation is to define in real time the measurement of a service’s quality. Services that accomplish their mission with a high level of quality are likely to have high levels of customer satisfaction, repeat customers, and net profit for the business. Conversely, when services are of low quality, customers are likely to go elsewhere with their business. If you’ve ever experienced a problem with a Web‐based service that simply didn’t function to your needs, you know how important this measurement can be.
Chapter 6
104
But What Is Service “Quality?” This concept of Service Quality has been touched upon a few times in this guide. For a monitoring solution whose reason for being is predicated on quantitative information, what is really meant by the term “Quality?” How does one apply an objective approach to what at first blush appears to be a subjective concept?
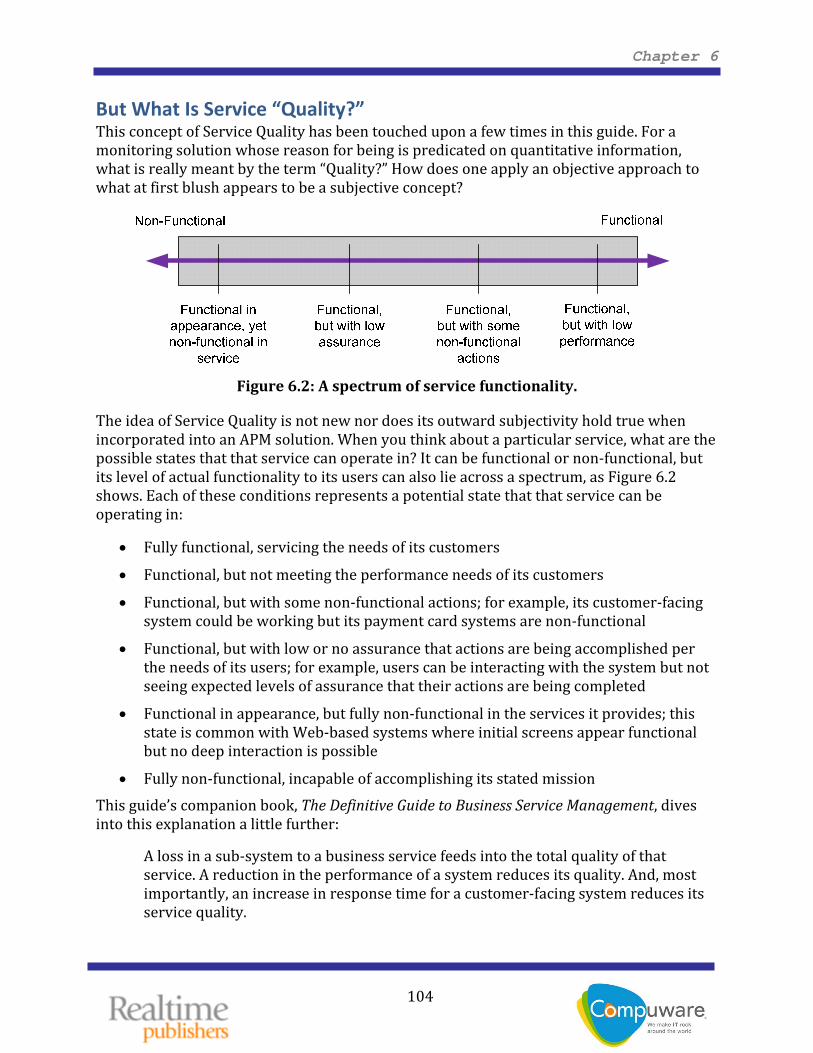
Figure 6.2: A spectrum of service functionality.
The idea of Service Quality is not new nor does its outward subjectivity hold true when incorporated into an APM solution. When you think about a particular service, what are the possible states that that service can operate in? It can be functional or non‐functional, but its level of actual functionality to its users can also lie across a spectrum, as Figure 6.2 shows. Each of these conditions represents a potential state that that service can be operating in:
• Fully functional, servicing the needs of its customers
• Functional, but not meeting the performance needs of its customers
• Functional, but with some non‐functional actions; for example, its customer‐facing system could be working but its payment card systems are non‐functional
• Functional, but with low or no assurance that actions are being accomplished per the needs of its users; for example, users can be interacting with the system but not seeing expected levels of assurance that their actions are being completed
• Functional in appearance, but fully non‐functional in the services it provides; this state is common with Web‐based systems where initial screens appear functional but no deep interaction is possible
capable of accomplishing its stated mission • Fully non‐functional, inThis guide’s companion book, The Definitive Guide to Business Service Management, dives into this explanation a little further:
A loss in a sub‐system to a business service feeds into the total quality of that service. A reduction in the performance of a system reduces its quality. And, most importantly, an increase in response time for a customer‐facing system reduces its service quality.
Chapter 6
105
Thus, it can be argued that any reduction in a service’s capacity to accomplish its stated mission represents a reduction in that service’s quality. This idea should make sense to the casual observer; lower service quality means a reduced user experience. Yet, this explanation still hasn’t answered the fundamental question of, “How does one apply an objective approach to defining quality?” The short answer is, “The right model, and a whole lot of math.”
Understanding the Service Model To fully understand the quantitative approach to Service Quality, one must understand how the different types of monitoring are aggregated into what is termed a Service Model. This Service Model is the logical representation of the business service, and is the structure and hierarchy into which each monitoring integration’s data resides. The Service Model is functionally little more than “boxes on a whiteboard,” with each box representing a component of the business service and each connection representing a dependency. It resides within your APM solution, with the sum total of its elements and interconnections representing the overall system that the solution is charged with monitoring.
But before actually delving into a conversation of the Service Model, it is important to first understand its components. Think about all the elements that can make up a business service. There are various networking elements. Numerous servers process data over that network. Installed to each server may be one or more applications that house the service’s business logic. All these reside atop name services, file services, directory services, and other infrastructure elements that provide core necessities to bind each component.
Take the concepts that surround each of these and abstract them to create an element on that proverbial whiteboard. This guide’s External Web Cluster becomes a box on a piece of paper marked “External Web Cluster.” The same happens with the Inventory Processing System and the Intranet Router, and eventually every other component.
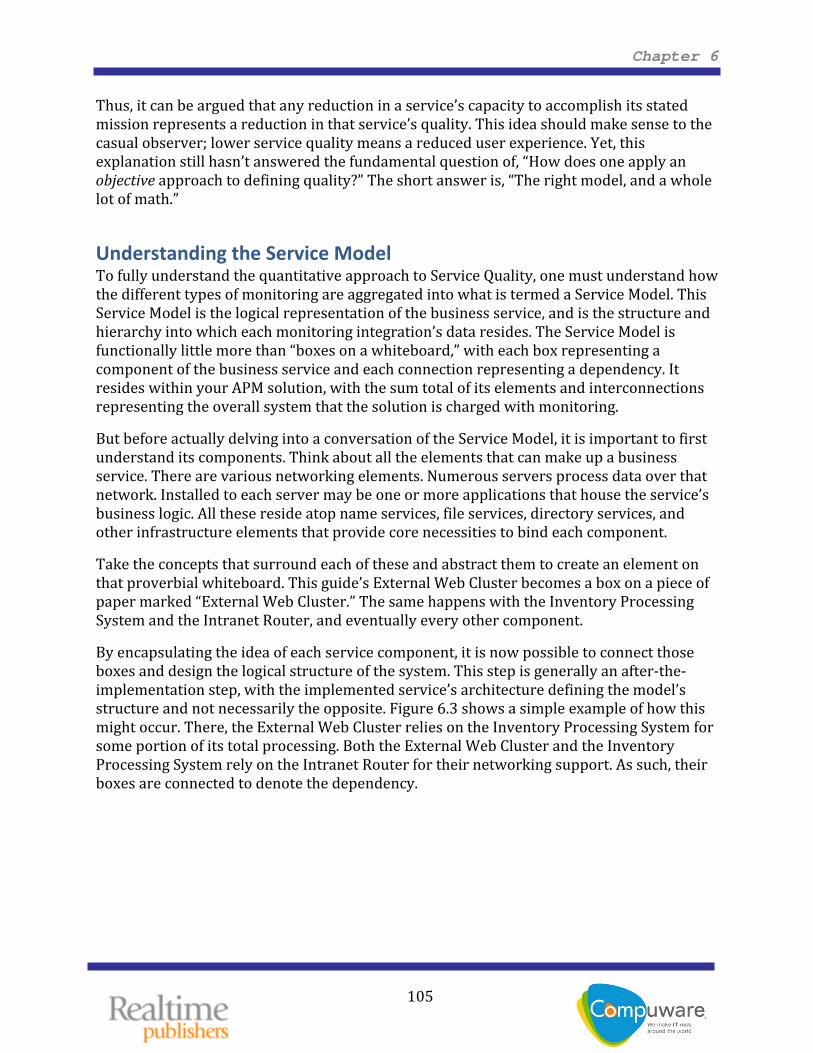
By encapsulating the idea of each service component, it is now possible to connect those boxes and design the logical structure of the system. This step is generally an after‐the‐implementation step, with the implemented service’s architecture defining the model’s structure and not necessarily the opposite. Figure 6.3 shows a simple example of how this might occur. There, the External Web Cluster relies on the Inventory Processing System for some portion of its total processing. Both the External Web Cluster and the Inventory Processing System rely on the Intranet Router for their networking support. As such, their boxes are connected to denote the dependency.
Chapter 6
106
ExternalWeb Cluster
Inventory ProcessingSystem
Intranet Router
External Web Cluster
Inventory Processing System
Intranet Router
Relies on
Relies on
Relies on
Figure 6.3: Abstracting each individual component to create connected elements on a
whiteboard.
Note Your APM solution will be equipped with a “designer” tool that enables this creation and connection of components directly within its management interface. You’ll also find that best‐in‐breed APM solutions arrive with support for the automatic discovery and creation of Service Models. This automation can dramatically speed the process of creating your initial Service Model’s structure over manual efforts alone.
This abstraction and encapsulation of components can grow as complex or as simple as your business service (and your level of monitoring granularity) requires. One simplistic system might have only a few boxes that connect. An exceptionally‐complex one that services numerous external customers—such as the one used by TicketsRUs.com—might require dozens or hundreds of individual elements. Each element relies on others and must work together for the success of the overall system.
Chapter 6
107
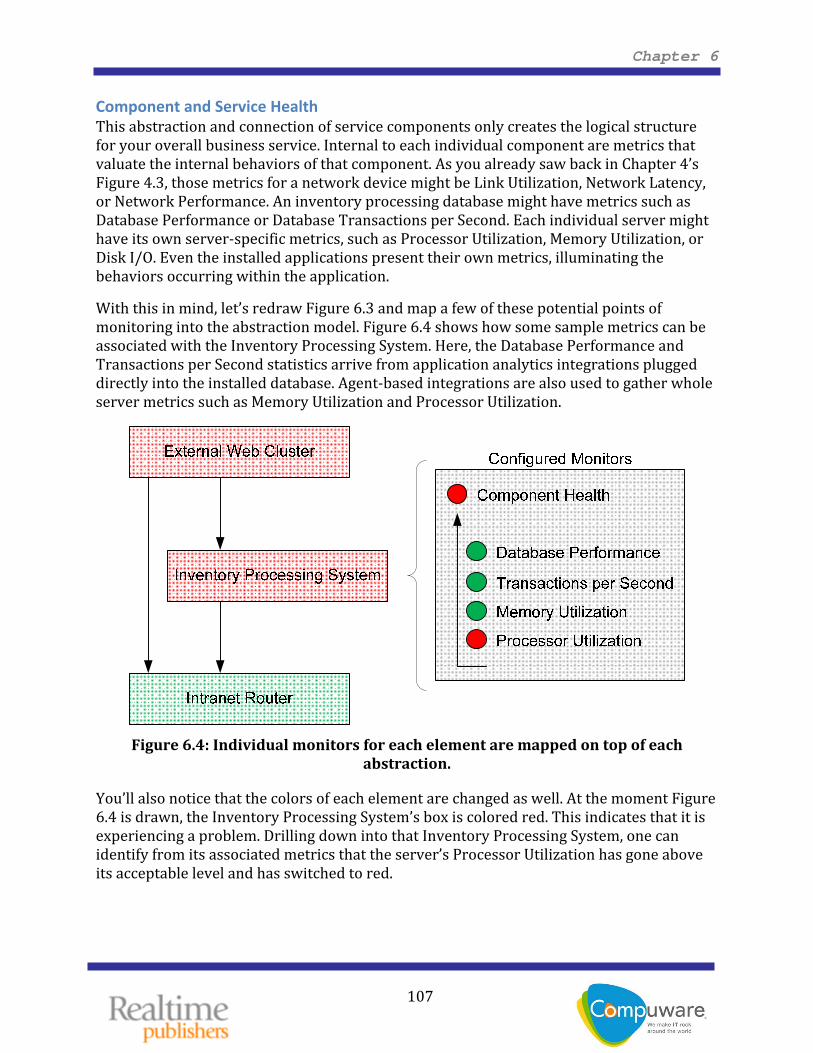
Component and Service Health This abstraction and connection of service components only creates the logical structure for your overall business service. Internal to each individual component are metrics that valuate the internal behaviors of that component. As you already saw back in Chapter 4’s Figure 4.3, those metrics for a network device might be Link Utilization, Network Latency, or Network Performance. An inventory processing database might have metrics such as Database Performance or Database Transactions per Second. Each individual server might have its own server‐specific metrics, such as Processor Utilization, Memory Utilization, or Disk I/O. Even the installed applications present their own metrics, illuminating the behaviors occurring within the application.
With this in mind, let’s redraw Figure 6.3 and map a few of these potential points of monitoring into the abstraction model. Figure 6.4 shows how some sample metrics can be associated with the Inventory Processing System. Here, the Database Performance and Transactions per Second statistics arrive from application analytics integrations plugged directly into the installed database. Agent‐based integrations are also used to gather whole server metrics such as Memory Utilization and Processor Utilization.
Figure 6.4: Individual monitors for each element are mapped on top of each
abstraction.
You’ll also notice that the colors of each element are changed as well. At the moment Figure 6.4 is drawn, the Inventory Processing System’s box is colored red. This indicates that it is experiencing a problem. Drilling down into that Inventory Processing System, one can identify from its associated metrics that the server’s Processor Utilization has gone above its acceptable level and has switched to red.
Chapter 6
108
Each of the metrics assigned to the Inventory Processing System’s box are themselves part of a hierarchy. The four assigned metrics fall under a fifth that represents the overall Component Health. This illustrates the concept of rolling up individual metrics to those that represent larger and less granular areas of the system. It enables the failure of a down‐level metric to quickly rise to the level of the entire system.
Drilling down in this model highlights the individual failure that is currently impacting the system, but that specific problem is only one piece of data found in this illustration. As you drill upwards from the individual metrics and back to the model as a whole, you’ll notice that the individual boxes associated with each component are also active participants in the model. Because the overall Component Health monitor associated with the Inventory Processing System has changed to red, so does the representation of the Inventory Processing System itself.
Going a step further, this model flows up individual failures to the greater system through its individual linkages between components that rely on each other. In this example, the External Web Cluster relies on the failed Inventory Processing System. Therefore, when the Inventory Processing System experiences a problem, it is also a problem for the External Web Cluster. The model as a whole is impacted by the singular problem associated with Processor Utilization in the Inventory Processing System.
The Service Model Chapter 1 of this guide first introduced these linkages when it suggested how a Mainframe problem could impact the entire system as a whole:
However, consider the situation in which the problem lies deeper within the application itself. In this example, the problem is not the loss of an entire server or device. Here, a much deeper problem exists. Rather than a simple server loss, the response time between the application server and the mainframe instead slows down. This occurs due to a problem within the mainframe. The decrease in performance between these two components eventually grows poor enough that it impacts the system’s ability to complete transactions with the mainframe. As a result, the upstream reliant servers such as the application server, database server, and Web server can no longer fulfill their missions.
During that explanation, it was suggested that a properly‐implemented APM solution could quickly identify the problem and trace troubleshooting administrators down to the correct solution. That process is realized through the implementation of abstractions such as that shown in Figure 6.4.
In the use case associated with Figure 6.4’s model, perhaps a Help desk employee notices that the system has switched from a healthy to an unhealthy state. Perhaps the stoplight for the system as a whole has changed from green to red or yellow. The Help desk employee now knows that something is amiss within the system.
Chapter 6
109
With this information in hand, that Help desk employee can then drill down within the APM solution’s interface to find the component that is experiencing the problem. Once the employee finds the offending component, they can drill down even further to discover which aspect of that problem component is the source of the problem. In this case, that
. source relates to a processor overuse condition within the Inventory Processing System
This information greatly improves the ability to initially triage system issues. With this information in hand, for example, the triaging Help desk employee knows that the server team is a likely candidate for resolving the problem. The problem probably doesn’t relate to a network issue. Its initial troubleshooting is likely not within the realm of the application’s development team. Determining the right resources to troubleshoot the problem reduces the level of effort required to solve the problem while improving the speed to resolution for the problem.
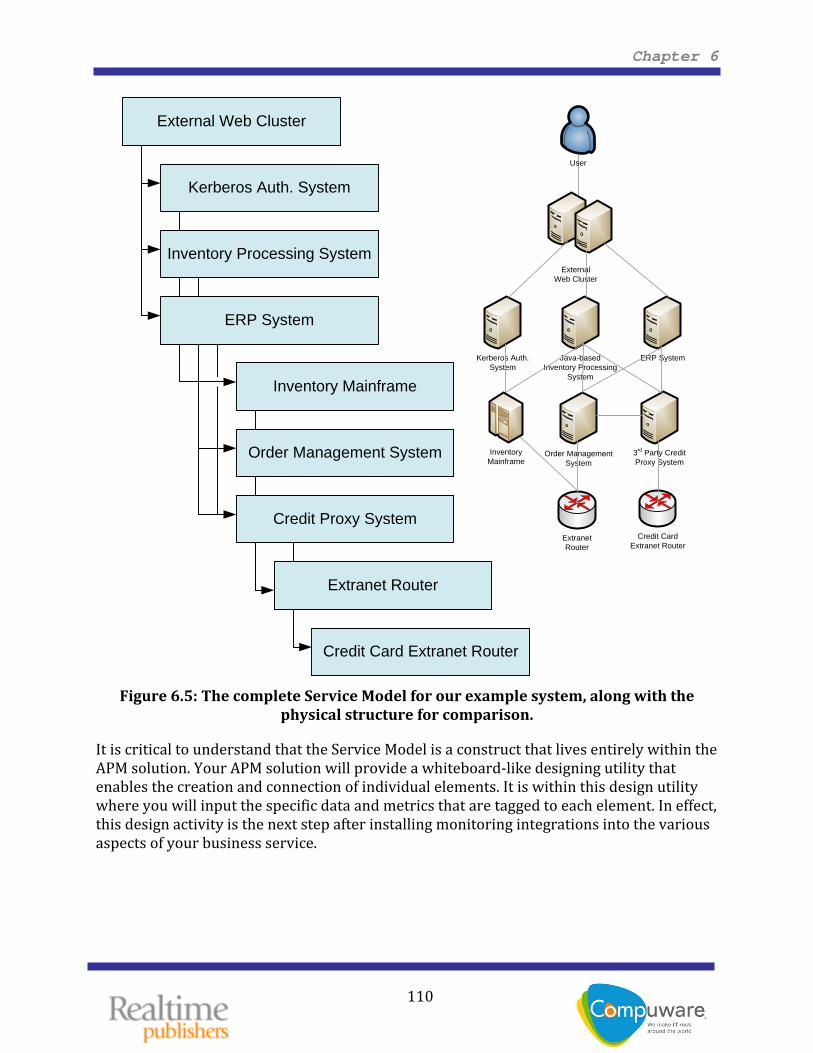
Obviously, Figure 6.4 is only one part of that overall Service Model. A completed Service Model for our example system is shown in Figure 6.5. Here, the previous three components are shown in relation to the rest of the model. Also present is the earlier physical structure for comparison. Arrows are also drawn to illustrate where dependencies might lie between each individual component.
Note In a fully‐realized Service Model implementation, an additional element titled “The E‐Commerce System” would be created at the top‐most level and connected with each individual component as a dependency. This connection ensures that the loss of any component has an impact on the functionality (and, thus, Service Quality) of the entire system. This element is not present in Figure 6.5 only for readability reasons, but is an important part of a full Service Model implementation
Chapter 6
110
ExternalWeb Cluster
Kerberos Auth.System
Java-basedInventory Processing
System
ERP System
Order ManagementSystem
3rd Party CreditProxy System
ExtranetRouter
Credit CardExtranet Router
InventoryMainframe
User
External Web Cluster
Kerberos Auth. System
Inventory Mainframe
Credit Card Extranet Router
Inventory Processing System
ERP System
Order Management System
Credit Proxy System
Extranet Router
Figure 6.5: The complete Service Model for our example system, along with the
physical structure for comparison.
It is critical to understand that the Service Model is a construct that lives entirely within the APM solution. Your APM solution will provide a whiteboard‐like designing utility that enables the creation and connection of individual elements. It is within this design utility where you will input the specific data and metrics that are tagged to each element. In effect, this design activity is the next step after installing monitoring integrations into the various aspects of your business service.
Chapter 6
111
Service Quality With this, the entire conversation swings back to the initial question of “How does one quantitatively represent Service “Quality?” At this point, the business service has been deconstructed into its disparate components. Each of those components has been laid out into a logical structure, with dependencies highlighted using connectors. Individual monitoring integrations have also been assigned into each component as they make sense (for example, network monitors into network components, server monitors into server components, and so on).
The final step in this process is the piecewise labeling of each component and its monitoring with the behaviors that are considered acceptable. This process effectively creates the mathematical model that the APM engine uses to define a service’s quality, and is another task that is commonly done within the APM solution’s designer utility.
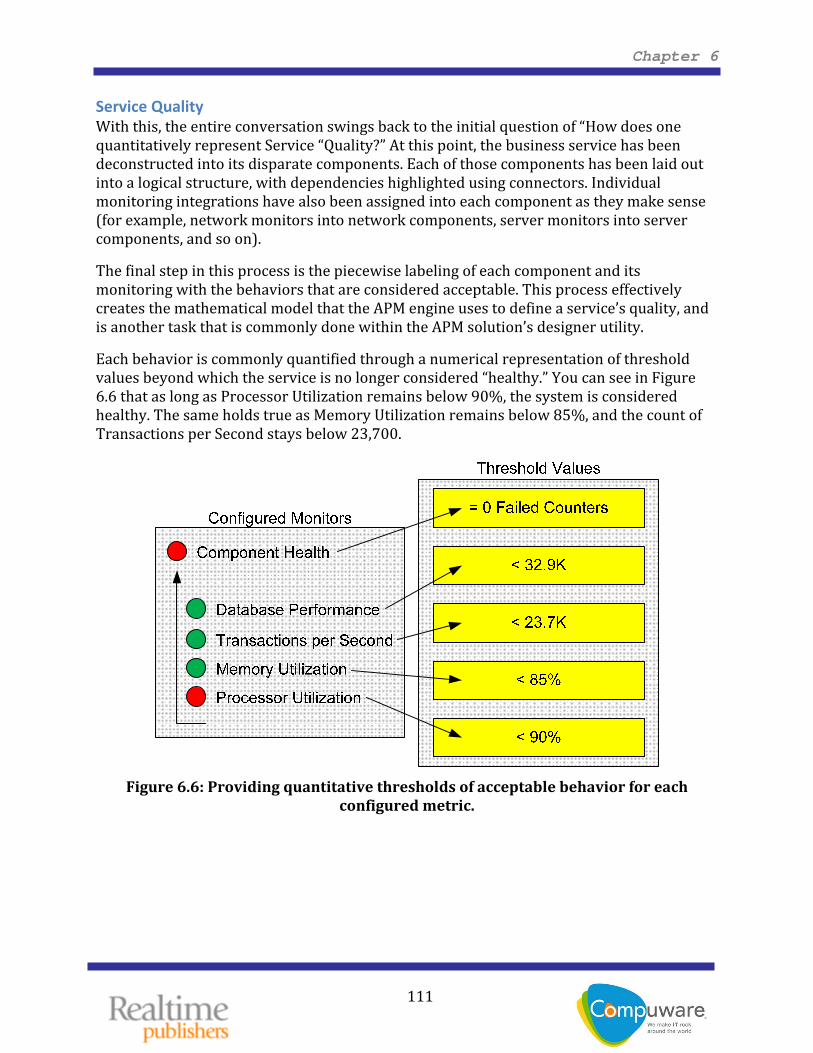
Each behavior is commonly quantified through a numerical representation of threshold values beyond which the service is no longer considered “healthy.” You can see in Figure 6.6 that as long as Processor Utilization remains below 90%, the system is considered healthy. The same holds true as Memory Utilization remains below 85%, and the count of Transactions per Second stays below 23,700.
Figure 6.6: Providing quantitative thresholds of acceptable behavior for each
configured metric.
Chapter 6
112
These metrics are part of a hierarchy, so there must be included a set of rollup values that identify when a higher‐level value crosses a threshold. In the case of Figure 6.6, the rollup value for Component Health remains green until one of its dependent monitors crosses into the Failed state. Although this is a simple example of such a service, it is easy to see how added logic and more layers of hierarchy enable administrators to add substantial levels of granularity into the system. For example, a rollup value can remain healthy as long as a percentage of its dependent values remain healthy. Or, that rollup value can change its state based on the moving average of individual dependent states. Enriching the data even further, individual values can be given time limits, whereby a healthy state will not switch to an unhealthy state unless the threshold behavior occurs over a predetermined period of time.
It is the summation of all these individual threshold values that ultimately drives the numerical determination of Service Quality. A business service operates with high quality when its configured thresholds remain in the green. That same service operates with low quality when certain values flip from green to red and is no longer available when other critical values become unhealthy. The levels of functionality between these states, as
roducts of each calculation. introduced in Figure 6.2’s spectrum, become mathematical p
In effect, one of APM’s greatest strengths is in its capacity to mathematically calculate the functionality of your service. Taking this approach one step further, IT organizations can add data to each element that describes the number of potential users of that component. Combining this user impact data with the level of Service Quality enables the system to report on which and how many users are impacted by any particular problem.
The Value in Templates You can see that a huge amount of data must be plugged into a Service Model before it becomes effective in valuating a service’s quality. Not only must the model be constructed and its elements interconnected, but the correct monitors must be linked into each element. Within each monitor, the right threshold values must be configured. Even a single incorrectly‐configured threshold value can cause an inappropriate representation of the system’s health. Actually knowing whether your database server should operate at 90% processor utilization versus 95%, or whether 24,000 transactions per second is bad while 23,000 is good obviously involves a period of trial and error. Your business service is quite different than anyone else’s, and the components that comprise it are much different than that of any other implementation. Thus, your thresholds are probably not the same as someone else’s. Yet it is handy to start out with a commonly‐accepted set of values.
Chapter 6
113
It is for this reason that many APM solutions include a set of templates for known server, network, and application types. If it is considered an industry standard for database servers to maintain an acceptable processor utilization of 90%, then having that as a starting value assists you with much more quickly swinging your Service Model into operations. You should also recognize that your Service Model is intended to be an organic construct. Over time, your service will change and evolve, and with it so will its Service Model. For example, you may find down the road that processor utilization over 80% actually causes a down‐level problem with your system, or that another service component needs to be added into the model to support a new business endeavor. An effective APM solution’s Service Model designer will allow you to reposition and reconfigure Service Model components and configurations at any time to mirror your ever‐changing infrastructure.
Creating Your Service Model and Implementing APM Going from an empty whiteboard to a completed Service Model is going to take effort. Isolating the right service components, identifying their expected behaviors, and getting them into a format that your APM solution’s designer will accept are all steps in a project that will involve no small amount of management. You’ll find as well that your first attempts at creating that model will usually require a measure of adjustment as you learn more about your services.
The process of actually creating that model and implementing your APM solution tends to require formal project planning with the appropriate stakeholders if it is to be successful. To assist, consider the following seven‐step process as a common methodology in creating a service model and ultimately implementing your APM infrastructure.
Step 1: Selection The first step in any APM implementation project is involved with identifying its ultimate outer boundary. Although an APM solution can monitor virtually everything in your IT environment, it may not make sense to do so. Monitoring of environments that aren’t in production can create alert storms as those environments go through development and testing. Integrating APM into unrelated IT infrastructure elements can create islands of monitoring that don’t mesh into your Service Model. And, you may find that some IT components just don’t have a measurable impact on your business’ bottom line.
When thinking about where you should place your outer boundary of monitoring, consider first those elements that you define as business services. A business service is one whose operation can be quantified in terms of dollars and cents. By limiting your APM solution (at least, in the beginning) to the revenue‐impacting portions of your IT infrastructure, you will have a much greater capability of getting your arms around its initial implementation. Once in place, you may consider adding services as necessary.
Chapter 6
114
Note It is crucial in the selection process to recognize that common infrastructure services such as name services, directory services, and the like can also be critical components of a business service. When a business service relies on these common infrastructure services for their support, they automatically become a part of your Service Model's hierarchy. Any outage of an infrastructure service can lead to an outage of the business service, which incurs a revenue impact.
Be aware also that the implementation of an APM solution is more than just a technology insertion. APM’s quantitative data has a tendency to change entire business processes. Thus, gathering the right stakeholders in your organization—those who can impact business process maturity—will ensure that your business ultimately recognizes the total benefit from an APM implementation.
Step 2: Definition Once the proper boundary has been selected and agreed upon for the initial APM rollout, the next step is involved with formally defining each of the components that make up that service. This process can be quite exhausting, as it requires a precise decomposition of each element that makes up the service. A number of data points must then be defined for each component that has been isolated. Consider the following data points as the minimal set that are critical to creating that component’s abstraction:
• Component Name and Description. For each isolated component, a unique name and description of that component is necessary for later tracking.
• Users. Understanding the type of users as well as the expected count of users that will make use of each isolated component is useful for identifying the level of affected users during an outage.
• Outage Impact. Valuating the revenue impact associated with a loss of this service helps derive data for executive dashboards.
• Baseline and Desired Behaviors. Technical metrics and their desired threshold levels are necessary. These metrics will link back to observed behaviors through an APM solution’s monitoring integrations. It is likely that the definition of these behaviors will consume the largest part of your definition activity.
• Dependencies. Lastly, identifying the dependency chain among components helps to later draw the interconnections between elements in the Service Model. Remember that dependencies needn’t necessarily be limited to directly required services. Dotted‐line dependencies are also important towards capturing the impact associated with any loss of service.
Chapter 6
115
Data gathered during this phase is most often captured into an external spreadsheet or database. That external document can be used by the project team in the next phase as the Service Model itself is built. It is worth mentioning here that this definition phase also has the benefit of documenting a system in ways that may not have been previously accomplished. Thus, your level of process maturity naturally increases as a function of completing this documentation activity.
Step 3: Modeling Once finished with the formal definition of each component, your next step will be to use this data to construct the model itself. This process translates the externally‐captured information in your spreadsheet into a form that works within your APM solution’s design tool.
The process of actually creating the model should be relatively trivial if the right level of effort was placed into the previous step. With the right level of detail in your definition spreadsheet, you should already know which elements should be entered as well as their dependencies and initial metric thresholds. The net result of this activity will be a completed Service Model that is ready to accept monitoring data once integrations are in place.
Step 4: Measurement The fourth task in this process begins with the installation of monitors into your environment. This process ties the Service Model’s empty framework into the actual data that it will use in generating its calculations. The actual installation of monitors can take an extended period of time, as the sheer magnitude of change control required to implement APM’s wide swath of monitors hooks into every part of your environment.
Properly managing this installation will require the support of change control as well as configuration control stakeholders in your environment. It will also require the technical support of each technology’s administrators, an activity that can involve personnel and project management. Further, achieving the buy‐in of each component’s administrative stakeholder can require assistance from business management due to the politics of systems administration.
Note For this reason, be aware that this step can be disruptive to your business service if not completed with care. The installation of agents, incorporation of agentless monitoring, and initial rollout of EUE monitoring can impact the normal production of the environment for an initial period until monitors are correctly tuned.
Once implemented, your APM environment will need a period of steady state to allow those incorporated monitors to gather their data and begin filling out the picture of service behavior. This period can be relatively short or rather extended as you ensure your onitors are gathering the right kinds and volumes of data. m
Chapter 6
116
APM and ThirdParty Monitoring Solutions In implementing APM’s monitoring integrations, you do not need to duplicate the effort of existing third‐party monitoring solutions—nor is it necessary to rip existing solutions from the environment to replace them with those native to an APM solution. The types of data gathered through an APM solution are often very similar to those collected by others. Effective APM solutions will include the ability to tie into existing monitoring infrastructures. As these infrastructures are already in place, this process can significantly reduce the amount of time and effort necessary to complete step four. When implementing a monitor‐of‐monitors configuration, care must be taken to tie in the third‐party monitoring solution as a dependency for the entire environment. Thus, ensuring the continued functionality of the external monitoring platform is a critical success factor in maintaining the functionality of your APM solution.
Step 5: Data Analysis Environments that implement an APM solution must be cautious not to roll that solution into production until a period of evaluation is completed. It is not uncommon for the initial abstraction of the business service to include errors in its design or development. Further, the actual monitor thresholds may not be properly tuned for production use. Rolling such a system into production too early can result in alert storms, which tend to have a negative effect on users’ opinions of the system.
During the data analysis phase, installed monitors should be evaluated for their effectiveness in gathering the right data to fill out the Service Model. As with the previous phase, this phase tends to require the involvement of each component’s administrative stakeholders. Those stakeholders can assist in quantitatively identifying the behaviors that should be captured as well as tuning the appropriate monitoring thresholds. Even with APM solutions that leverage templates, those common settings must be correctly re‐tuned for each particular environment.
Step 6: Improvement Through any data analysis phase, you will find errors in Service Model development or inconsistencies in the data being gathered. The sixth step in this process needn’t necessarily be an isolated step that occurs after step five. This improvement process of retuning settings can occur in parallel with data analysis, iteratively identifying and resolving areas of improvement in the overall implementation.
Chapter 6
117
Step 7: Reporting Lastly is the reporting phase. This final step in an APM installation concerns itself with the development of visualizations for the rendering of data. This process in and of itself can require its own project plan, as multiple types and classes of visualizations are likely to be desired by the different users of the system:
• Triage. Help desk individuals are often the first line of defense in identifying and isolating problems within IT systems. For this reason, visualizations that enable this team to recognize that a problem is occurring and provide initial triage support are necessary. These visualizations tend to be of low data resolution, providing just enough information to help team esolution. s identify which resources to engage for r
• Administrative and Developer. Administrators require their own set of visualizations for understanding the behaviors of their systems under management. This set commonly deals with low‐level behaviors that can be managed by administrators as well as visualizations that assist with deep troubleshooting. Developers need their own capabilities as well; however, these tend to lean towards detailed information about code operations and performance. Developer visualizations are commonly used in finding and resolving areas of non‐optimization in custom code.
• Management. Technically‐minded individuals needn’t be the only consumers of an APM solution’s data. Those in management as well can leverage an APM solution for identifying long‐term trends in service usage, revenue impacts from both outages and successes, and high‐level project status.
• End User. An APM solution’s visualizations can also provide benefit for a service’s end users. End users appreciate when they’re given useful information about the functionality (or non‐functionality) of the systems they’re working with. Users who are given actionable information about system status can make their own decisions about working with the system or delaying attempts until full functionality is restored. Cross Reference A much larger discussion on the creation and use of APM visualizations will occur in Chapter 7.
Using Your Service Model Although much of the deep discussion on actually using your APM solution is left for Chapter 8, there are a few items associated with the Service Model itself that warrant review once your Service Model is in place and ready for production. Actually making use of your APM implementation is an activity that will be quite different based on the role of the individual in the organization.
Chapter 6
118
Tuning Monitor States During the initial production use of your APM solution, you are likely to find a large number of false positives as the monitor tuning process is incrementally completed. This process can consume a large amount of time, as the threshold values for individual monitors are adjusted. During this process, you will likely find yourself watching the model in real time to identify when certain behaviors occur within your system.
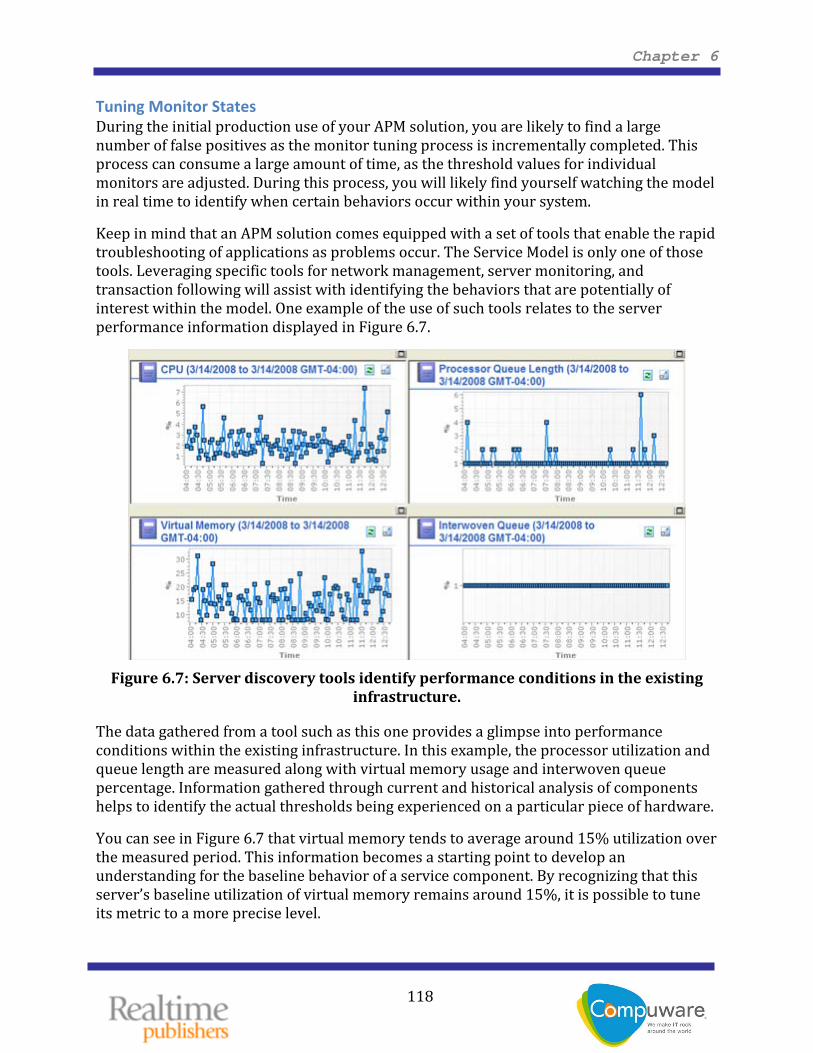
Keep in mind that an APM solution comes equipped with a set of tools that enable the rapid troubleshooting of applications as problems occur. The Service Model is only one of those tools. Leveraging specific tools for network management, server monitoring, and transaction following will assist with identifying the behaviors that are potentially of interest within the model. One example of the use of such tools relates to the server performance information displayed in Figure 6.7.
Figure 6.7: Server discovery tools identify performance conditions in the existing
infrastructure.
The data gathered from a tool such as this one provides a glimpse into performance conditions within the existing infrastructure. In this example, the processor utilization and queue length are measured along with virtual memory usage and interwoven queue percentage. Information gathered through current and historical analysis of components helps to identify the actual thresholds being experienced on a particular piece of hardware.
You can see in Figure 6.7 that virtual memory tends to average around 15% utilization over the measured period. This information becomes a starting point to develop an understanding for the baseline behavior of a service component. By recognizing that this server’s baseline utilization of virtual memory remains around 15%, it is possible to tune its metric to a more precise level.
Chapter 6
119
This example shows how the tuning process requires effort to both tune as well as de‐tune configured counters. Finding the correct setting for a metric that is experiencing too many false positives is relatively easy: Simply dial down the metric’s threshold value until it no longer turns red during a period of acceptable performance.
However, this is only one half of the necessary tuning activity needed for counters. The other half is involved with watching for false negatives. In this case, metrics are de‐tuned to a level that is too far, and as such aren’t providing value in alerting on system behaviors. In these cases, it is often necessary to look back at current and historical performance to identify when counters aren’t tuned enough.
Eliminating Rapid State Change Monitors by nature always reside in one state, based on the metrics information being fed to them. Thus, a monitor can either be alerting on an impacting condition or reporting an “all clear.” Critical is recognizing not only that a configured monitor has changed state but also the time period when that monitor has changed state.
This is particularly important for situations when a monitor may be rapidly shifting between states due to a problem with a component or when its threshold is tuned to a level between existing states on a system. Monitors in a rapid state change condition can be exceptionally difficult to track when historical analysis capabilities are not present in the APM solution. Your APM solution should include the ability to look into the short‐term past for identifying when a monitor’s state has changed. Situations where rapid state changes are occurring with a particular monitor threshold should be resolved through retuning.
The Service Calendar Lastly is the addition of Service Calendar data into the APM solution, for further refining the level of impact associated with service quality reductions. Consider an organization that has a US‐based business service that is used by customers worldwide. It is commonly expected that there will be periods of high usage along with other periods of low usage. Perhaps this application is used by customers during the normal work day. In this case, assuming that the normal workday occurs between the hours of 8:00am and 5:00pm, it can be expected that a period of high usage will be between the hours of 5:00am and 8:00pm for users in the continental United States. These extra hours take into account the four different time zones that split the United States.
A business that expects use of its system by only users in the United States can assume that the remaining period of the day corresponds to their application’s period of low use. Outages during that period are likely to impact relatively few users compared with an outage occurring during peak hours. Maintenance activities are also commonly scheduled during these low‐usage hours.
Chapter 6
120
The timing calculations for applications across only a few time zones are relatively easy. But consider the complexity that occurs when that same application is used by applications in the EMEA and Asia‐Pacific areas as well. The multiple‐hour differences in time zones between the continental United States, EMEA, and Asia‐Pacific regions mean that some traditionally low‐usage periods actually correspond to times when other regions are beginning their workday.
Service Calendar information aids an APM solution by identifying when the high‐usage and low‐usage patterns exist for the monitored application. Based on the source for expected users, an APM’s Service Calendar can assist triage teams with identifying the true level of impact to global users. It further assists administrators with finding the best time of day to schedule outages for updates and fixes. When completing your Service Model, consider including Service Calendar information into its calculations to ensure that a true level of impact is recognized.
The Service‐Centric Approach Quantifies Quality The goal of this chapter has been to bring a quantitative understanding of how an APM solution defines the quality of a particular service. This understanding is necessary because the data on quality is used by an APM solution for identifying many key factors to include the user impact of outages, the revenue impact when users cannot connect, and the overall representation of performance. As you can see through this chapter’s discussion, quality
Model. can be quantified through the hierarchal calculation of an APM solution’s Service
Yet the Service Model is not a construct that is designed to be used by APM’s end consumers. That Service Model exists in the background, to be used by APM’s calculations engine. For users, a set of visualizations or “dashboards” are commonly constructed that provide the right level of information. Chapter 7 discusses how those dashboards are created and used while presenting a run‐down on common dashboard elements you’ll find n an effective APM solution. i
Download Additional eBooks from Realtime Nexus! Realtime Nexus—The Digital Library provides world‐class expert resources that IT professionals depend on to learn about the newest technologies. If you found this eBook to be informative, we encourage you to download more of our industry‐leading technology eBooks and video guides at Realtime Nexus. Please visit ttp://nexus.realtimepublishers.comh .