Embed Size (px)
Citation preview

Application of X-Ray. Diffraction to Routine Mineralogical Analysis of Portland Cement R. L. BERGER, G. J. C. FROHNSDORFF, P. H. HARRIS and P. D. JOHNSON
American Cement Corporation Research and Development Laboratory, Crestmore, California
A technique for the application of quantitative X-ray diffrac-tion analysis (QXDA) to the routine mineralogical analysis of portland cements is described. Important features of the technique are the use, with the X-ray diffraction unit, of an automatic sample changer and a digital data collection sys - tern. Equally important is the use of a computer to analyze the results recorded on punched paper tape. The analytical procedure involves the fitting of computer - synthesized curves to experimental X-ray diffraction patterns so that the shapes of the patterns are taken into account in the analyses. The computer has been programmed to draw attention to diffi-culties in curve-fitting so that unusual features of diffraction patterns may be recognized. Calibration of the QXDA method has been based on the diffraction patterns of a wide rangeof carefully analyzed cements provided by the Portland Cement Association (PCA), but the calibration is entirely independent of the PCA's X-ray analyses. Also, in contrast to previous X-ray methods, the new method does not use synthetic com-pounds at any stage of the calibration. Analytical results obtained by QXDA provide independent confirmation that po-tential compound composition calculations tend to overesti-mate C3 A. Advantages of the method for the routine mineral-ogical analysis of portland cements are (a) simplicity of op-erations, (b) low cost for each analysis, (c) high speed (1 to 2 hours), (d) precision comparable to potential compound determinations, and (e) sensitivity to differences in the crys-tals of the cement compounds.
SIT IS now generally realized that the "potential compound compositions" of portland cements, as calculated from the simple Bogue formulas Cl), can only give a rough guide to their true mineralogical compositions (2). True mineralogical composition depends not only on chemical composition in terms of the ma)or oxides present, but also on minor oxides and on the conditions under which the cement clinker was burned and cooled (3). Since the mineralogical composition of a cement has an important bearing on its properties, the development of a reliable and convenient method of direct min-eralogical analysis is likely to be an important step in the advance of cement and con-crete technology. Obvious applications of such a method would be in studies of cement hydration, studies of cement clinker formation, cement quality control, and cement plant process control.
The only experimental method which is applicable to the direct determination of the mineralogical composition of a finely-powdered material, such as cement, is X-ray diffraction. The feasibility of using X-ray diffraction in the analysis. of cements for research purposes has been demonstrated by Copeland, Brunauer, Kantro, and their colleagues at the Portland Cement Association (2) and by workers in a small number of laboratories in other parts of the world (4,5,6). In our laboratory, as part of a
234

235
broad research program aimed at improving the accuracy and precision with which cements can be described, we have developed X-ray diffraction techniques which, in conjunction with the use of digital computers, make possible low-cost routine miner-alogical analysis. Important stages in the development have been:
The attachment of a digital data collection system to our X-ray diffractometer so that X-ray data may be obtained in a form suitable for immediate processing by computer;
The attachment of an automatic sample changer to the X-ray diffractometer so that it may run unattended overnight and on weekends; and
The development of the computer programs which are essential for the analysis of the data.
The equipment and the method of analysis which we now use are described in this paper. They include refinements of the QXDA (quantitative X-ray diffraction analysis) method described in previous papers (7,8). In the present paper, the use of the method is illustrated by results obtained in its application to the most carefully analyzed and intensively studied cements which could be provided by the Portland Cement Associa-tion (PCA).
Apparently anomalous results are discussed to draw attention to the advantages and difficulties which are associated with the method. Finally, the relative costs of the determination of mineralogical (or "compound")compositions by QXDA and by wet chemical analysis are compared.
EXPERIMENTAL
Equipment
The X-ray diffractometer. —A standard Norelco X-ray diffractometer fitted with an automatic sample changer is used. The copper target X-ray tube is operated at 35 ma and 45 kv. A 0.0006-in, nickel filter is used and slit widths are: divergence, 2 deg; scatter, 2 deg; receiving, 0.006 in. In normal operation, the goniometer oscillates between 26. 5 deg (2 9) and 37.0 deg (28) at 1/4 deg (2 8)/mm. The high voltage for the xenon-filled, side-window, proportional counting tube is provided by a Hamner high voltage supply, and the output pulses from the tube are fed into a Baird Atomic pulse height analyzer before entering the digital data collection system. The PHA window width is 0.5 volts.
The digital data collection system. —Pulses from the pulse height analyzer enter a CMC electronic counter (Model No. 2707A) where they are totaled until a signal from an electronic interval timer causes the accumulated total to be transferred to a buffer memory and the counter to be re-set to zero in less than a millisecond. The timing signal also triggers the CMC coupler (Model No. 402AD), which controls the Tally paper tape punch (Model No. 420 PR-24-6), to cause the number stored in the buffer memory to be punched out. The timer can be set to give pulses at fixed intervals varying between 1 and 120 sec, but it is normally set at 15 sec so that the number of counts accumulated in scanning consecutive 1/18 deg (28) intervals are punched out.
The automatic sample changer (Fig. 1). —This was designed by the D and 0 Machine Company, 9704 E. Firestone Blvd., Downey, Calif. Although the first of its kind, it has proved to be trouble-free in operation. Up to 44 samples contained in individual holders can be attached to a drive-chain enclosed in a 6-in, diameter cylindrical housing which is coaxial with the goniometer and rotates with it. Changing of samples is initiated by a pulse which sets in train the unclamping of the sample in the goniometer, the very smooth movement of the chain for a short distance around its closed path to bring the next sample into place, and the clamping of the new sample to the goniometer. The sample changer housing has a removable Mylar window and a tight-fitting lid which makes it possible to maintain a controlled atmosphere or a reduced pressure within the chamber. Gas inlets and outlets to the chamber are provided.
The digital computer. —An IBM 1620 Model I computer with 40, 000 positions of core storage was used for all calculations.
236
Figure 1. View of the automatic sample changer with lid removed. Sample No. 3 is clamped in place in the X-ray goniometer; the lid, not shown, is an essential part of the shielding.
Materials
Twenty-six cements from their LTS (Long Time Study) and SBR (Special Basic Re-search) series were provided by the PCA. The designations of the cements are given in the left-hand column of Table 1. Comprehensive information about the chemical and mineralogical compositions of most of these cements have been published by the PCA staff (9,10,11). The potential compound compositions of the cements have been cal-culated in various ways, the method adopted in the most recent publication (11) being to consider Mn203 to be equivalent to Fe2O3, and P205 and Ti02 to be equivalent to A1203, and then to apply the simple Bogue potential compound composition calculations. The resulting values are the potential compound compositions referred to in the fol-lowing pages. They tend to differ from the results obtained by ignoring the minor oxides Mn203, P 5 and Ti02 by being, on the average, about 1. 5 percent higher in C3S and about 0.3 percent lower in C3A. (Cement industry nomenclature is used throughout this paper, i.e., C = CaO, S = SiO2, A = A1203, F = Fe203. The use of the symbols C3S. C2S, C3A and C4AF is a convenient way of denoting minerals which have compositions close to those represented by these formulas.)
Rutile used as an internal standard was obtained from the Titanium Pigments Cor-poration, New York, under the name Titanox RA.
Sample Preparation
A 3. 00-g sample of each cement was interground with 0.300 g of rutile in a Spex mill capsule containing 25 stainless steel balls ('/4-in, diameter) and 5 ml of 1, 1, 1-trichioroethane. The grinding time was 10 minutes. After grinding, the liquid from the slurry containing the finely-ground cement and rutile was evaporated in an oven at 100 C. For X-ray diffraction, each sample was sprinkled into the back of one of the numbered sample holders (Fig. 1) which was firmly held with its face against a clean glass plate. When the cavity was full to overflowing, the powder was tamped down and the excess scraped off with a razor blade. The sample holder was then carefully removed from the glass plate and set in the sample changer so that the face which had been in contact with the glass would be presented to the X-ray beam.
METHOD OF ANALYSIS
The main features of our method of analysis were described in a previous paper (8),

237
c3s
C3A
CAF
- I
29 30 31 32 33 34 35
- deg. (2e)
Figure 2. Portion of conventional X-ray diffraction chart for cement LTS 12. Radiation: CuK cnick- el filter; Scanning rate, 1/8 deg 2 0 per mm. Phases contributing to the main peaks are indicated in ce- ment industry nomenclature: C = CaO, S = Si02, A = A1203, F = Fe2O3. The broken line represents
background radiation intensity.
but they will be reviewed here with attention being drawn to an important statistical test which has since been introduced into the QXDA program.
A portion of a conventional X-ray diffraction pattern of a cement is shown in Fig-ure 2. The vertical scale represents X-ray intensity, and the intensity at any diffrac-tion angle (2 &) can be considered to be the sum of the background intensity and the intensities of the diffracted radiation from each of the individual compounds present in the cement; in Figure 2, the background is represented by the broken line. In the case of the digital data collection system, numbers, x, representing areas in narrow ver-tical strips of equal width under the X-ray diffraction curve are recorded sequentially on the paper tape. Thus, an X-ray diffraction pattern is represented (12) by a vector
where 3 is the recorded sequence of numbers:
= [x1 . . .xi, . . .x] (1)
The individual numbers are the elements of the vector. In our standard procedure, each vector has 120 elements. In vector notation, the X-ray diffraction vector, x, of a suitably prepared mixture of minerals (e.g., a portland cement) can be written as the sum of several other vectors:
= K(D+P.a+V) (2)

238
K in Eq. 2 is a constant, which takes into account variations in the intensity of the X-ray source and the average mass absorption coefficient of the sample, and the three terms inside the parentheses indicate that 31 has additive contributions from background (b), counting errors (i'), and from w different compounds; the contribution from each compound is considered to be proportional to the product of the weight fraction, p, of the compound in the mixture and a standard vector, ., for the compound. (The standard vector will normally be similar to the diffraction vector of the compound but will have zero background.) The exact value of K is not evaluated but, for samples prepared under reproducible conditions and containing a fixed quantity of internal standard, vari-ations in K can be detected from the intensity of the internal standard peak and can be corrected for (2).
In our system for the application of QXDA to portland cement, equations such as Eq. 2 are employed in two ways:
Standard vectors, TLi, for each of the cement compounds can be evaluated, ele-ment-by-element, from a knowledge of the pt's and 's for a sufficiently large number of cements. In the calculations, which would be impossible without a computer, an additional vector, 9, is evaluated; the elements of 9 represent the standard errors of estimate (SEE's) in predicting the elements of 3 (for an arbitrarily chosen constant value of K) from the pt's and the corresponding elements of the b's. The smaller the elements of , the more closely do the Pi'S and ä's account for the diffraction vectors of the cements.
Using standard vectors, ai, for the cement compounds, the Pj'S (i.e., compound contents) can be calculated from the experimental diffraction vector, R. The procedure is to fit (5i - Kb) with a computer -synthesized vector, 3, which is the linear combina-tion of the standard vectors which minimize the sum of the squares of the elements of
- ( - K.b)J. If the fit were perfect, every element of this difference vector would be zero but, in practice, we assess the "goodness of fit" by comparing the absolute values of the elements of - ( - Kb)1, corrected for changes in K, with the elements of the SEE vectors, 9, and determining the number which exceed 1.5 SEE. This is an important new feature of our method.
In calculations using equations such as Eq. 2 to determine standard vectors from data for a large number of cements, any systematic errors in the pt's for a given compound will be reflected in the elements of the standard vector for that compound being consistently high or low. A. check on the correctness of the pi's and of the stan-dard vectors can be provided if the sums, Xpi, of the compound contents can be deter-mined independently of the X-ray method. In this case, the difference between the Epils determined by the X-ray and independent methods can be related to the individual j'5 by a multiple linear regression analysis (13) to provide correction (or calibration)
factors to be applied to the X-ray Pi'S. Finally, it must be mentioned that all mathematical manipulations on the vectors
require that each element always apply to the same 20 range. For this reason, the rutile internal standard peak at 27.4 deg (2 e) is used to check that the alignment is correct. If it is not, the computer program is used to make corrections intended to improve the alignment.
RESULTS
Determination of Standard Vectors
X-ray diffraction vectors for three or more independent replicate preparations of each of the 26 portland cements were obtained. Altogether, over 100 diffraction vectors were available for the determination of the standard vectors and for the analyses which are to be described.
Using data from the PCA's most recent paper (11) on the compound compositions of the LTS and SBR cements, we have made three different sets of calculations of the standard vectors for the four major cement compounds—C3S, C2S, C3A, and C4AF. The calculations were based, in turn, on (a) the PCA's "recalculated" combined chemi-cal and X-ray (CCX) values; (b) the PCA's X-ray (XR) values; and (c) the potential

239
compound compositions (in which Mn203, P205 and Ti02 are taken into account as described earlier).
The derived vectors were termed the CCX, the XR, and the potential compound standard vectors, respectively. The assumptions made in the calculations were (a) only the four major cement compounds made significant contributions to the diffraction vectors in the range considered; (b) the diffraction vector of each compound does not vary significantly from one cement to another; and (c) contributions of individual com-pounds to the diffraction vector of a mixture obey Eq. 2. The calibrations were set up so that only elements of high statistical significance would be retained as non-zero values in the standard vectors.
From a comparison of the sizes of the elements of the SEE vectors derived in the standard vector calculations, it was apparent that the X-ray diffraction vectors of the 26 cements could be more closely accounted for in terms of the potential compound compositions than in terms of the CCX and XR compositions. For this reason, the potential compound standard vectors were chosen for use in subsequent analyses. The potential compound standard vectors for the four major cement compounds are shown plotted on slightly different scales in Figure 3; the factors by which the heights of the plots should be multiplied to make them directly comparable are indicated. For comparison, Figure 3 also includes the standard vectors for C3A as determined from the CCX and XR values (though 11 negative points which lie below the lower boundary of the XR plot and seven which lie below the boundary of the CCX plot have been omitted). The fact that neither the CCX nor the XR standard vectors gave as good a representation of the known X-ray diffraction pattern of C3A as the potential com-pound standard vector supports the choice of the potential compound compositions for the calculation of the standard vectors, though it does not prove either that the potential compound compositions are exactly correct or that they do not have systematic errors.
In order to uncover any systematic errors in the potential compound compositions, and to insure that the X-ray analyses gave reasonable compound sums, the calibration procedure outlined earlier was used. It was found that the compound sums, as deter-mined by QXDA, would be brought most closely into agreement with the values (100 percent - percent free lime - percent CaSO4 - percent loss on ignition - percent MgO - percent insoluble*), which are probably a good approximation of the true sums, if the potential compound compositions used in the standard vector calculation were multi-plied by the f ollowing f actor s: C3S, 1.03; C2S, 1.03; C3A, 0.84; C4AF, 0.94. There-fore, these calibration factors were used to correct all analyses made with the po-tential compound standard vectors. The significance of the calibration factors is dis-cussed later.
Analytical Results and Reproducibility of Analyses
The standard vectors derived from the potential compound compositions were used to analyze average X-ray diffraction vectors for the 26 cements. (The average vectors were obtained by averaging the vectors, corrected for changes in K, for replicate runs for each cement.) The results are given in Tables 1 and 2. The potential silicate contents of the cements are listed in Table 1 with the X-ray values and the differences,
, between potential and X-ray silicate contents. Similar data for C3A and C4AF are given in Table 2. The potential compound and X-ray results are in general agreement, though there are some unusually large differences which will be discussed later. As explained earlier, the number of elements of the difference vector obtained by sub-tracting the computer-fitted curve from the experimental X-ray diffraction vector which lay outside the 1. 5 SEE range was calculated in each analysis. These numbers are given in both Tables 1 and 2. They provide a measure of the success of the X-ray analyses, while a visual indication is provided by the plots in Figures 4, 5, and 6. In
*That MgO should be included in this expression is indicated by the petrographic data (10); the omission of the generally small quantities of alkali sulfates is unlikely to have had a significant effect on the results.

240
I I I_•l I. II
C35 (pontt.1)
ic.1. fwtm. 0.55 . -.
- %TI. ...
I
I I I I .
-. C3A (pot.nti41)
csi. £tor, 0.92
.- . .
I I. .!.._I I Ii
C35 (potantial) .
I I I I.•I I
C3A (ccx)
wals fwtw. 0.43 .C1 £tar, 154
?.......... ....- .—. --.— -..-.- ......... --
C4M (pt.I.l)
I
C39 ()
........................... ........... .— ............................
Scala £Sc• 1.01 .
-•--•— 11
.--..--- ...._ .._ ........- I I I
30 32 34 30 32 34.
deg. (2)
Figure 3. Standard vectors for the four malor cement compounds derived from potential compound
compositions; additional standard vectors for C3A shown for comparison were derived from the PCAs CCX and XR compound compositions.
these plots, experimental values are represented by X's, .and computer-fitted values by 0's. Where the values are identical, only the X is plotted. (The fact that the distinction between X's and 0's is not always clear in the figures does not prevent divergences between the curves from being apparent.)
The individual X-ray diffraction vectors from the independent replicate preparations of each cement were also analyzed separately so that standard deviations for the deter - mination of each compound in each cement from a single scan could be calculated. The results are summarized in Table 3 under the heading "Internal Standardization— Single Scan." The corresponding figures for the average of three scans (obtained by dividing the single scan values byV3)1,inthcate the precision to be expected for analyses based on. such averages; these figures are applicable to the X-ray data in Tables 1 and 2.
Examination of the results for the individual analyses showed that the compound sum for a cement sometimes varied by as much as 10 percent between replicate determina-tions. However, improved reproducibility was obtained if the replicate analyses for the cement were adjusted to a fixed compound sum by multiplying the compound contents

I I: I I JI
53% C38 - - 19% C8 - -
I 12% 03?. . • :
: • -: -
- : - - _:i;-• -
-
I I I I I
I I I I I Ii
46% C39
27% 028 - -
12% C3?. . - - - 0% 048? - - - -
- - _ :-. _.'_
_-_ .r ..... • '.---.--
I I I I I• I
I I I.
51% C35 26% 028 - 10% C3?.
7% 048?
: -
- :-
• ..-.-- --
:1 .1
-.
I
..
I I I I I
46% c - 67% C39 -• .. 54% C 8 28% C8 - -- 7% C25 - 21% CS
8% C3?. - - 12% C3?. 7% CA : 10% 048? - - 8% 04?.? 11% cz
- -• - -.. . - ...• - .
.............
___i__ ITiiTIiIi L17 LTS
53%C38 - 46% 039 - 50% 038 22% C28 - 26% 028 - - 21% C28 - - 10% C3?. 12% 03?. 11% 03?.
:- 10% 0447 . .1 9% 0497 - . - % CM
-. - - -. a • - ••• _r- - I I r - . • .•_ . _
- : -- -... . I - r •. - __ - - •
— r - -
g - - :,____z -. I I l__• I I Ii
- --____-_. -_
I I I- Ii
_• - ,__,•__• I
30 32 34 30 32 34 30 32 34
deg. (2e)
Figure 4. X-ray diffraction patterns (X) for nine Type I cements from the LTS series with the superimposed computer-fitted curves (0); the potential corn- pound compositions are indicated. -
LTS L9%22 .:
42% C3S 43% C38 ...' — . 53% C3 S - - 37% CS . 32% C23 - 21% C2S -.
6% C3A - . 6% C39 - . - 4% C3A - - - 10% C442 I - 12% C4AP : .:
— r U-
I I I i •ii I I 1_Ull
- -: - -. LTS
43%c3s - 36% C38 I _ 58% C33 27% c2s 38% C2S C2S
5% C3 6 - - 5% : . 11% 16% c4o I 3 15% C492 7% c492
-
- ,-
LTS 34 1T541
61% C3S - . 65% C3S 22% C3S 11% c2s - 10% C2S 49% C3S 10% 39 C3A 4% C3 A U
8% c4AP - 11% 4AP - 16% C4AF
jU Ut ..t
—
I I I I •I I I I I I I I I I I I I I
30 32 34 30 32 34 30 32 34
deg. (20)
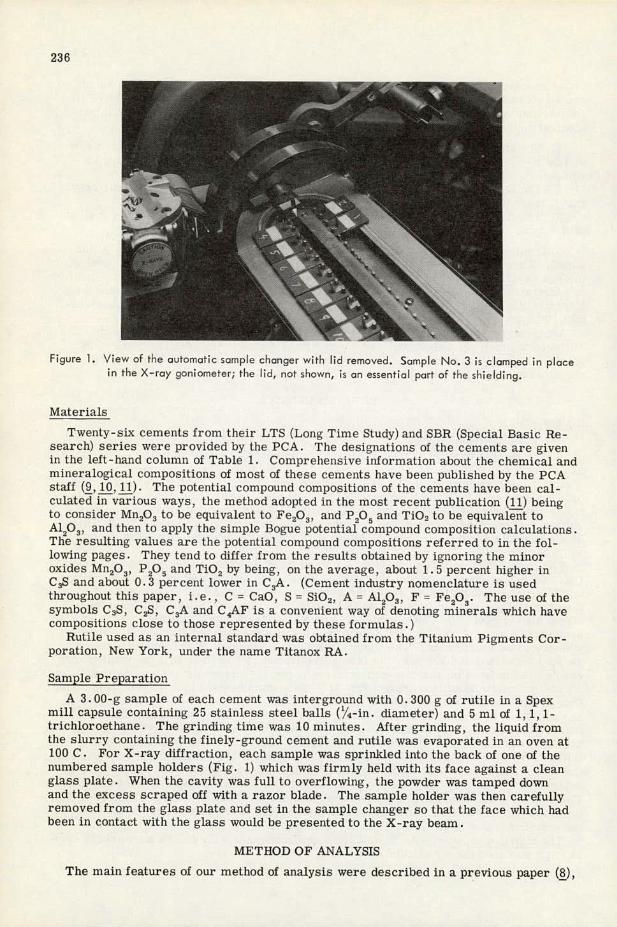
Figure 5. X-ray dffraction patterns (X) for five Type II, three Type III and one Type IV cements from the LTS series shown with the superimposed com-puter-fitted curves (0); the potential compound compositions are indicated.

I I I I II
LT542 - - 29% C38
53% C $ . 3% 9%C48,
r. •
Yii IT
I I I_ I I I
LT843 . 26% C38 . 47% C2 8 .
6% C3A - . - 14SC48 ..
: •_
I I I I I I
L?8 43k
30% C38 49% C2S
5% C3A
10%C487 -
-- :. -
-.'• • -
ii
197 -: - 43%CS . 38% cs - . ;. 62%C1$
. 10% C21 - - 29%C3 ..
10% CAF : . 10% C38 - . . 8% C4M
2% C2 6 : 6% C4 A •
: -
. . •. : I_. •• . 9
: _ - :'
I I II I
899 15698 :.
II I I
15754 .
I
46SC35 -: - 47%C39 - 28% C28 24% C28 - 1Q%C3 A .- .- 12%C3A
8% C887 . 8% C481
.. : - - • _: • : •, --
- ,_: _
. r •
-9..-.
30 1 32 34 30 32 34 30 32 34
deg. (26)
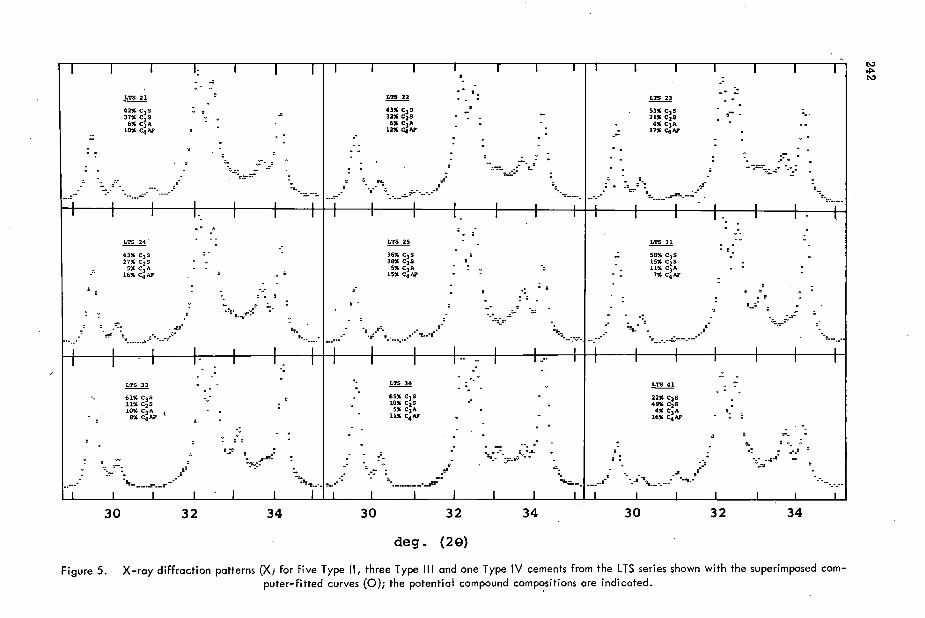
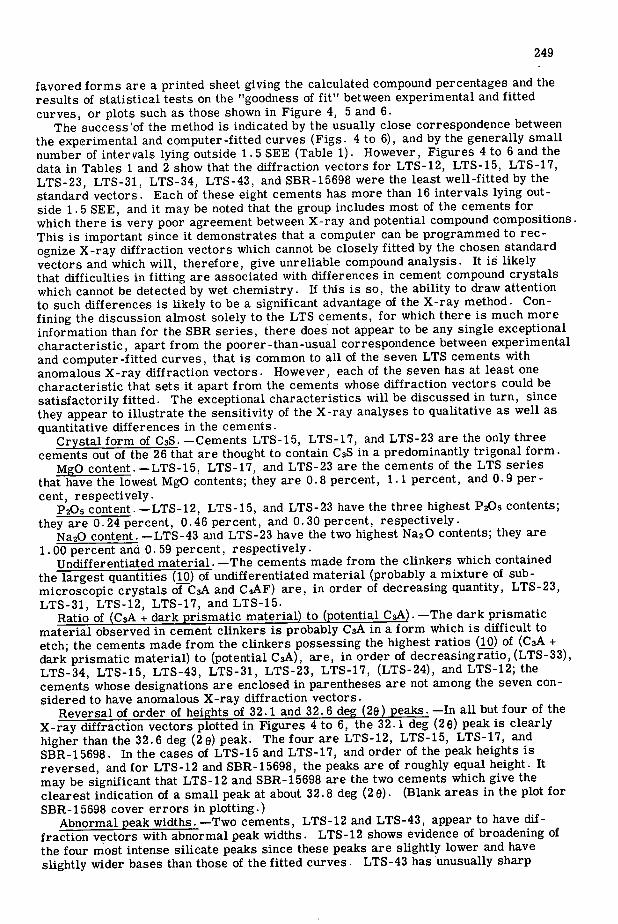
Figure 6. X-ray diffraction patterns (X) for three Type IV and one Type V cements from the LTS series and four cements from the SBR series shown with the
superimposed computer-fitted curves (0); the potential compound compositions are indicated.

TABLE 1
COMPARISON OF X-RAY AND POTENTIAL SILICATE CONTENTS
Crystal Form Percent C3 S of Alite
(tentative Difference Predicted Difference Predicted assgnment) Potential X-ray (C3 s) CSS Potential X-ray (C2S) i
Cement No.
No. of Intervals
Lying Outside 1.5 SEE
Percent C2 S
LTS11 8 monoclinic 53.0 56.8. - 3.8 - 2.4 19.4 17.5 1.9 1.2
.12 25* . monoclinic 46.0 42.1 3.9 0.3 26.7 29.1 - 2.4 - 2.4 13 2 tricinic 50.6 47.1 . 3.5 0.7 25.5 28.3 - 2.8 - 1.2
14 12 monoclinic 46.3 46.8 - 0.5 - 1.1 28.4 28.7 1.3 0.1
15 48* trigonal 67.4 49.6 17.8 13.5 7.1 27.0 -19.9 -12.8 16 f3 monoclinic 53.7 52.5 1.2 - 2.1 20.8 24.4 - 3.6 - 0.3 17 17* trigonal . 52.5 51.9 0.6 3.9 21.7 28.7 - 7.0 - 5.0
18 . 6 monoclinic 46.1 53.3 - 7.2 - 4.2 26.3 26.3 0.0 2.1
19C 8 monoclinic 50.0 56.5 - 6.5 - 20.5 15.2 5.3 21 8 monoclinic 41.7 43.7 - 2.0 2.4 37.1 38.0 - 0.9 - 4.5 22 5 monoclinic 42.6 44.3 - 1.7 - 3.2 32.1 32.2 - 0.1 0.8 23 17* trigonal 53.1 47.9 5.2 4.2 21.3 27.7 - 6.4 - 8.7
24 13 monoclinic 42.7 45.6 - 2.9 - 2.9 27.4 23.2 4.2 2.5
25 14 monoclinic 35.8 334 . . 2.4 0.0 37.8 39.7 - 1.9 - 1.8 31 19* monoclinic 57.8 66.2 - 8.4 - 4.7 14.6 9.8 4.8 3.3
33 14 monoclinic 61.0 68.2 - 7.2 . - 3.7 11.4 7.2 4.2 1.6
34 43* monoclinic 64.8 77.9 -13.1 - 8.0 9.6 0.4 9.2 5.6 41 14 monoclinic 21.6 20.6 1.0 - 1.0 49.4 50.6 - 1.2 0.3 42 7 monoclinic 28.9 30.2 - 1.3 . - 1.1 53.3 54.5 - 1.2 - 1.6
43 . 25* monocinic 26.4 33.7 - 7.3 - 6.1 46.6 49.2 - 2.6 - 3.3 43A 7 monoclinic 30.2 29.3 0.9 - 0.3 49.4 49.7 - 0.3 - 4.0 51 4 - monoclinic 42.8 41.0 1.8 3.2 37.7 41.6 - 3.9 - 4.2
SBR15497 5 monoclinic 62.1 64.5 - 2.4 - 6.6 10.0 8.2 1.8 4.3
15669 4 monoclinic 28.6 28.3 0.3 - 1.2 57.3 60.5 -- 3.2 - 1.6 15698 19* monoclinic 46.3 47.0 - 0.7 - 27.6 20.4 7.2 - 15754 14 monoclinic 46.5 53.4 - 6.9 - 5.5 24.3 19.6 4.7 3.3
Avg and std dev for 18 best-fitted cements . - 1.7±3.3 0.2±2.9
*I ndicotes poor correspondence between X-ray diffraction vector and fitted curve.

TABLE 2
COMPARISON OF X-RAY AND POTENTIAL ALUMINATE AND FERRITE CONTENTS
Cement No.
No. of
Lying Outside 1.5 SEE
Potential
Intervals Percent C3 A
Difference X-ray (C3A) Predicted
C3 A Potential
Percent C4 AF
Difference X-ray (C4 AF) Predicted
C 4 AF
LTS11 8 11.8 9.7 2.1 -1.1 7.5 6.5 1.0 0.8 12 25* 12.4 12.7 -0.3 0.6 7.6 6.7 0.9 1.3 13 2 9.9 6.2 3.7 2.5 6.7 8.1 -1.4 -0.5 14 12 8.0 7.6 0.4 0.0 9.5 8.6 0.9. 0.2 15 48* 11.9 11.4 0.5 -2.9 7.8 8.5 -0.7 3.1 16 13 7.3 5.4 1.9 2.0 11.0 12.3 -1.3 0.2 17 17* 10.0 8.8 1.2 1.5 9.9 11.7 -1.8 0.8 18 6 12.1 7.7 4.4 2.4 8.6 7.7 0.9 0.3 19C 8 11.2 7.8 3.4 - 9.2 7.8 1.4 - 21 8 6.1 3.5 2.6 0.3 10.0 10.8 -0.8 0.7 22 5 6.3 5.3 1.0 1.2 12.1 10.6 1.5 06 23 17* 3.7 5.9 . -2.2 -1.4 16.6 14.0 2.6 2.1 24 13 5.0 2.9 2.1 1.6 15.5 14.8 0.7 0.3 25 14 4.7 2.5 2.2 1.6 151 14.1 1.0 0.3 31 19* 10.6 9.7 0.9 1.6 6.7 5.8 0.9 -0.1 33 14 . 10.4 8.7 1.7 1.9 7.8 7.6 0.2 -0.2 34 43* 5.2 2.8 2.4 2.1 10.7 9.5 1.2 -0.8 41 14 4.1 4.8 -0.7 1.2 16.2 14.8 1.4 . 0.6 42 7 3.1 3.8 -0.7 1.4 8.7 9.3 -0.6 -0.2 43 25* 6.1 4.7 1.4 2.2 14.0 14.3 -0.3 0.6 43A 7 5.1 3.1 2.0 1.8 9.8 9.2 0.6 0.1 51 . 4 3.5 2.4 1.1 -0.1 10.3 9.7 0.6 0.4
5BR15497 5 10.2 9.2 1.0 3.8 8.1 7.7 0.4 -1.6 15669 4 2.3 1.8 0.5 2.3 6.1 5.0 1.1 -0.6 15698 19* 9.6 11.0 -1.4 - 7.9 3.1 4.8 - 15754 14 12.4 8.9 3.5 2.7 8.2 6.8 1.4 1.9
Avg and std devfor 18 best-fitted cements -1.8±1.3 0.5±0.9
*1 ndicates poor correspondence between X-ray diffraction vector and fitted curve.

246
TABLE 3
REPRODUCIBILITY OF X-RAY AND POTENTIAL COMPOUND DETERMINATIONS—STANDARD DEVIATIONS FOR INDEPENDENT
REPLICATE DETERMINATIONS
Category Average Standard Deviation, Percent
C3 S C2 S C3 A C4 AF
X-ray Analysis (QXDA)
Internal standardization
For single scan 2.40 1.78 0.92 0.83 For average of three scans 1.39 1.03 0.53 0.48
Self - standardization
For single scan 1.56 1.55 0.71 0.73 For average of three scans 0.90 0.90 0.41 0.42
Potential compound determination
For single determination based on conventional chemical analysis (18) 1.09 0.91 0.36 0.04
by an appropriate factor Standard deviations obtained after setting the compound sums to (100 percent - percent MgO - percent free CaO - percent CaSO4 - percent loss on ignition - percent insoluble) are given in Table 3 under the heading "Self -standardiza-tion." It may be noted that, like the PCA's CCX method (11), self-standardization uses independent information to adjust the compound sums, thereby limiting the error which can occur. However, if the compound sums are known with sufficient certainty, self-standardization has the advantage that weighed quantities of internal standard are not required in the samples.
Statistical Analysis of Differences
On the assumption that the deviations of X-ray values from the best straight lines relating X-ray to potential compound compositions might be attributable to unaccounted-f or effects of minor oxides, or associated with manufacturing conditions, two sets of multiple regression analyses (MRA's) were carried out. In the first, an attempt was made to relate the deviations to a linear combination of the following variables: percent s03 in clinker, percent Na2O, percent 1(30, percent P205, percent Mn2031 per-cent insoluble, percent free lime, percent FeO, percent Ti021 percent MgO, percent water-soluble alkali, average kiln temperature (deg F), and liter weight of clinker (in g).
These MBA's included data for all of the LTS. cements listed in Table 1 except LTS 15 and LTS 19C. LTS 15 was excluded because of a doubt about the correctness of its X-ray compound analysis, and LTS 19C could not be used because no complete set of data was available. (SBR series cements were excluded from the MBA's because no data on average kiln temperature and liter weight were available.) The analyses showed that, for each compound, the deviations from a linear relationship between potential and X-ray values could, in large measure, be accounted for by the chosen variables. The equations which best accounted for the deviations were
Deviation (C3S) = - 0.6 + [9. 6(% Na2O) + 3.1 (% free lime)
+ 2.0 (% MgO) + 24.6 (% FeO)] - [19.3 (% P205)
+ 23.3 (% Ti02)] (3)

247
TABLE 4
ABILITY OF EQUATIONS TO ACCOUNT FOR DIFFERENCES BETWEEN X-RAY AND POTENTIAL COMPOUND COMPOSITIONS
Deviations, Percent Equations
CS C2S C3A C4 AF
(3) to (6)
Percent of variance accounted for 75 83 68 74 Standard error of estimate of deviation 2.6 1.6 1.3 0.9 Standard deviation of deviation 4.2 3.3 1.9 1.4
(7) to (10)
Percent of variance accounted for 75 80 62 43 Standard error of estimate of deviation 2.9 2.2 1.5 1.3 Standard deviation of deviation 5.1 4.5 2.2 1.5
Deviation (CaS) = - 1.3 + [13.3 (P2O5) + 27.2 (% Ti02)]
-[ 28.O(%Na20)+3.2(% free lime)
+ 2.0 (% MgO)] (4)
Deviation (C3A) = 5.3 +[18.6 (% P205) + 11.8 (% insoluble)]
- [1.3 (% free lime) + 2.6 ( water-soluble alkali)
+ 0.00313 (average kiln temperature)] (5)
Deviation (C4AF) = - 8.3 + [4. 4 (% Mn203) + 1. 0 ( free lime)
+ 0.00227 (average kiln temperature)
+ 0.00326 (liter weight)] -[9.3 (% P05)
+ 17.2 (% FeO) + 0.6 (% MgO)] (6)
A positive deviation implies that, the X-ray value is higher than would be expected. The,degree of success ofthese equations is indicated in Table 4. Thus, for C3S, the fact that the standard error of estimate using Eq. 3 is significantly less than the standard deviation of "Deviation (C3S)" shows the equation to' be effective in correlating "Deviation (C3S)" with the minor oxides..
The second set of MHA's was carried out using the variables which, on the basis of the T-test (13), the first MRA's had shown to have the highest statistical significance. Data for all cements listed in Table 1 except LTS 19C were used. The derived equa- tions were: .
Deviation (C3S) = - 4.3 + 8.4 (% Na20) + 1.8 (% free lime)
+ 2.4 (% MgO) - 30.4 (% P205) . (7)

248
Deviation (C2S) = 3.8 + 24.3 (% P205) - 2.2 (% free lime) - 2.6 ( MgO) (8)
Deviation (C3A) = - 2.9 + 15.3 (% P205) + 10.1 (% insoluble) - 0.6 (% free lime) (9)
Deviation (C4AF) = 1.1 + 0.6 (% free lime) - 8.2 (% P205) - 4.7 (% FeO) (10)
Measures of the success of these equations in accounting for the deviations are given in Table 4.
Determination of the Crystal Form of the C3S
It was pointed out earlier that it had been assumed that the X-ray diffraction patterns of the four major cement compounds were independent of the cements in which they occurred. For the C3S, this assumption was checked by examining the 1.77 A (51.7 deg (28) CuK a) peaks of the cements. Tentative assignments of the C3S crystal forms, based on the apparent number of overlapping peaks, are given in Table 1. The inter-pretation is made difficult by the lack of resolution of the peaks.
DISCUSSION
The Standard Vectors
The fact that plots of the potential compound standard. vectors (Fig. 3) resemble the X-ray diffraction patterns (5, 14) of synthetic preparations of C3S, $ -C2S, C3A, and C4AF provides evidence of the essential correctness of the calculations. However, that the potential compound compositions used in the calculations have systematic errors is indicated by the departure from unity of the calibration factors. The 0.84 factor for C3A suggests that the potential compound calculation tends to give about a 20 percent overestimate for C3A. This is in qualitative agreement with the findings of Brunauer et al. (2,11) and Takashima et al. (15) that the potential C3A contents of commercial cements are generally higher than the Ca/i contents determined by the more direct X-ray diffraction method. The importance of our conclusion is that it is based on an analytical method which is entirely independent of synthetic standards which could conceivably be much different from the compounds present in commercial cements.
Considering the calibration factors as a group, they suggest that both C3S and C2S tend to be slightly underestimated in the potential compound calculations, while C4AF and, particularly, C3A are overestimated. The explanation of these relationships is probably that (a) the average A to F ratio of the C4AF in the cements is less than 1, causing potential compound calculations based on the ratio 1 to overestimate C4AF, and (b) a substantial quantity of A1203 may be in solid solution inthe silicates, thereby leaving less for C3A formation while increasing the quantities of the silicates. These points have been discussed by Kantro, Copeland, Weise, and Brunauer (11).
While the standard vectors were generally able to account for forms of the dif-fraction vectors of the wide range of cements in the LTS and SBR series, there were a few cements whose diffraction vectors could not be satisfactorily accounted for. These special cases will be. discussed with the results of the analyses, though it may be pointed out immediately that the anomalies probably reflect the presence of (a) unusual crystal forms of one or more of the cement compounds, (b) unusual compo-sitions of the cement compounds, or (c) free lime, calcium hydroxide, or other minor constituents not considered in deriving the standard vectors.
In considering further developments of our QXDA method, it is significant that standard vectors may be easily recalculated as new or improved data become available.
The QXDA Results
An important feature of the method of analysis is that, depending on the application, results can be obtained from the computer in one or more forms. The presently
249
favored forms are a printed sheet giving the calculated compound percentages and the results of statistical tests on the "goodness of fit" between experimental and fitted curves, or plots such as those shown in Figure 4, 5 and 6.
The success of the method is indicated by the usually close correspondence between the experimental and computer -fitted curves (Figs. 4 to 6), and by the generally small number of intervals lying outside 1.5 SEE (Table 1). However, Figures 4 to 6 and the data in Tables 1 and 2 show that the diffraction vectors for LTS-12, LTS-15, LTS-17, LTS-23, LTS-31, LTS-34, LTS-43, and SBR-15698 were the least well-fitted by the standard vectors. Each of these eight cements has more than 16 intervals lying out-side 1.5 SEE, and it may be noted that the group includes most of the cements for which there is very poor agreement between X-ray and potential compound compositions. This is important since it demonstrates that a computer can be programmed to rec-ognize X-ray diffraction vectors which cannot be closely fitted by the chosen standard vectors and which will, therefore, give unreliable compound analysis. It is likely that difficulties in fitting are associated with differences in cement compound crystals which cannot be detected by wet chemistry. If this is so, the ability to draw attention to such differences is likely to be a significant advantage of the X-ray method. Con-fining the discussion almost solely to the LTS cements, for which there is much more information than for the SBR series, there does not appear to be any single exceptional characteristic, apart from the poorer -than-usual correspondence between experimental and computer-fitted curves, that is common to all of the seven LTS cements with anomalous X-ray diffraction vectors. However, each of the seven has at least one characteristic that sets it apart from the cements whose diffraction vectors could be satisfactorily fitted. The exceptional characteristics will be discussed in turn, since they appear to illustrate the sensitivity of the X-ray analyses to qualitative as well as quantitative differences in the cements.
Crystal form of CsS. —Cements LTS-15, LTS-17, and LTS-23 are the only three cements out of the 26 that are thought to contain C3S in a predominantly trigonal form.
MgO content.—LTS-15, LTS-17, and LTS-23 are the cements of the LTS series that have the lowest MgO contents; they are 0.8 percent, 1.1 percent, and 0.9 per-cent, respectively.
P205 content.—LTS-12, LTS-15, and LTS-23 have the three highest P205 contents; they are 0.24 percent, 0.46 percent, and 0.30 percent, respectively.
Na20 content. —LTS-43 and LTS-23 have the two highest Na2 0 contents; they are 1.00 percent and 0. 59 percent, respectively.
Undifferentiated material. —The cements made from the clinkers which contained the largest quantities (10) of undifferentiated material (probably a mixture of sub-microscopic crystals of C3A and C4AF) are, in order of decreasing quantity, LTS-23, LTS-31, LTS-12, LTS-17, and LTS-15.
Ratio of (C3A + dark prismatic material) to (potential C3A). —The dark prismatic material observed in cement clinkers is probably C3A in a form which is difficult to etch; the cements made from the clinkers possessing the highest ratios (10) of (C3A + dark prismatic material) to (potential C3A), are, in order of decreasingratio, (LTS-33), LTS-34, LTS-15, LTS-43, LTS-31, LTS-23, LTS-17, (LTS-24), and LTS-12; the cements whose designations are enclosed in parentheses are not among the seven con-sidered to have anomalous X-ray diffraction vectors.
Reversal of order of heights of 32.1 and 32.6 deg (28) peaks. —In all but four of the X-ray diffraction vectors plotted in Figures 4 to 6, the 32.1 deg (28) peak is clearly higher than the 32.6 deg (28) peak. The four are LTS-12, LTS-15, LTS-17, and SBR-15698. In the cases of LTS-15 and LTS-17, and order of the peak heights is reversed, and for LTS-12 and SBR-15698, the peaks are of roughly equal height. It may be significant that LTS-12 and SBR-15698 are the two cements which give the clearest indication of a small peak at about 32.8 deg (2 e). (Blank areas in the plot for
SBR-15698 cover errors in plotting.) Abnormal peak widths. —Two cements, LTS-12 and LTS-43, appear to have dif-
fraction vectors with abnormal peak widths. LTS-12 shows evidence of broadening of the four most intense silicate peaks since these peaks are slightly lower and have slightly wider bases than those of the fitted curves. LTS-43 has unusually sharp

250
peaks; this can be seen from the deep valley between the 32.1 and 32.6 deg (20) peaks and by the narrow bases of the peaks.
Shifts in C4AF peak positions. —The three cements with the lowest diffraction angles for the main C4AF peak, approximately 33.8 deg (28), are SBR-15698, LTS-23, and LTS- 17 (11). The low angles have been attributed to low A/F ratios in the C4AF phase.
Apparent shifts in silicate peak positions. —LTS-15, LTS-17, and LTS-23 all show evidence of the intense silicate peaks being shifted to lower 28 values, while LTS-34 appears to show peaks shifted to higher 28 values. The particularly large effect ex-hibited by LTS-15 is believed to be the result of a small peak, peculiar to this cement, lying under the internal standard peak at 27.4 deg (28) and causing an apparent dis-placement of it. For this reason, little reliance can be placed on the QXDA results for LTS-15. However, since LTS-15, LTS-17, and LTS-23 may each contain trigonal C3S, the similarity of the directions of shift may not be fortuitous. Further work will be needed to establish the reasons for the shifts, whether real or apparent.
From the discussion it appears that (a) the QXDA method can automatically draw attention to differences between the compound crystals represented by the standard vectors and the actual crystals of compounds in a cement, and (b) differences between crystals of the same compound in different cements may be associated with chemical factors.
It follows that QXDA should be reliable, provided that it is not applied to cements whose diffraction vectors cannot be satisfactorily fitted by a linear combination of suitably chosen standard vectors. This statement is supported by the X-ray analyses of the 18 cements for which the fits were satisfactory. Thus, for these cements, the average of the differences () between the potential and X-ray compound contents shown in Tables 1 and 2 were: 'C3S, -1.7 ± 3.3 percent; C2S, 0.2 ± 2.9 percent; C3A, 1.8±1.3 percent; C4AF, 0. 5 ± 0.9 percent. The indicated standard deviations of the averages are only about twice as large as would be expected from the standard deviations of determinations by the wet chemical (18) and X-ray methods (Table 3) if there were a perfect linear relationship between potential and X-ray compound values. However, because Eqs. 7 to 10 indicate that the correlation between potential and X-ray.compound values can be improved by taking minor oxides into account, it does not appear that there is a perfect linear relationship. While Eqs. 7 to 10 were derived from data for all 26 cements listed in Table 1, it may be noted that, using the equations to correct the data for the 18 well-fitted cements for chemical factors, the standard deviation of the difference between predicted and experimental C3S contents is reduced from 3.3 to 2. 5 percent, and the standard deviation for C2S from 2.9 to 2.0 percent. No im-provement was obtained for C3A and C4AF. It is likely that the differences between potential and X-ray compound values for the 18 cements could be more nearly accounted for in terms of Eqs. 7 to 10 if the coefficients were re-evaluated after excluding data for the eight anomalous cements.
The remarkable success of Eqs. 7 to 10 in accounting for the scatter of the differ-ences, A, for the complete set of cements can be seen by comparing the 's with the "predicted h's" (Tables 1 and 2). This, suggests that the differences - between the eight anomalous cements and the eighteen others may be correlated, either directly dr indirectly, with the variables in the equations. Possible interpretations of the signifi - cance of the variables in the equations are discussed below.
P205 . —The qccurrence of P205 in all four equations shows that this oxide affects the a-values for each compound. This could be due to an error in the way in which P205
is included in the potential compound calculations or to changes that it causes in the diffraction vectors of cement compounds in which it is taken up. (It may be noted that the presence of a minor oxide in a cement compound may affect analyses for the other compounds if it causes a change in the diffraction pattern of the compound; this will generally be the case if the oxide causes changes in the compound's contribution to areas where there are overlapping peaks.) In view of the findings of Lea and, Nurse (16) that P205 tends to form an extensive series of solid solutions between C3P and C2S, it is probably a poor assumption to consider P205 to be equivalent to A1203 in potential compound calculations (as was done in the present case). It is thought likely that the appearance of P205 in Eqs. 7 to 10 is due both to errors in the potential

TABLE 5
COMPARISON OF COSTS OF X-RAY AND POTENTIAL COMPOUND COMPOSITION DETERMINATIONS
251
Item
Labor Depreciation of equipment (10 years) Operating costs and maintenance Chemicals Computer and associated costs
Total
Cost (dollars) per Analysis
Potentialc X-Ray Analysisa Compound De-
termination
335b 10•75b
0.50 0.25 0.75 0.20 0.05 0.50 1.20 0.00
5.85 11.70
aFigures are for analyses based on a single scan at a rate of 4 deg (28)/mm, with 20
independent analyses being carried out each day. blhese costs are based on a figure of $900/month for salary and overhead. cBased on conventional wet chemicai methods of analysis.
compound calculations and to changes in either, or both, of the C3S and C2S diffraction vectors in the presence of P205 .
Na20. —The presence of Na2O in a cement mix increases the total quantity of basic oxides present. If Na20 can substitute for CaO in any compound, the effective quantity of CaO available for C3S formation will be increased. This effect, which was not taken into account in the present potential compound calculations, is believed to account for the occurrence of Na2O in Eq. 7.
. —Since the petrographic evidence (10) suggests that little MgO could be in any of the four major cement compounds in any of the LTS cements, its lack of inclusion in the potential compound calculation is justifiable. The selection of MgO as a variable in Eqs. 7 and 8 therefore seems to indicate either that small quantities of MgO can cause significant changes in the X-ray diffraction patterns of one or more of the cement compounds, or that there is a (possibly fortuitous) correlation of MgO with a variable not represented in the equations. It has already been pointed out that the three cements believed to contain trigonal alite were the three lowest in MgO content, and it may be noted that these cements all had X-ray C3S values which were lower than the potential
C3S values, while the X-ray C2S values were higher. Whether or not there are genuine physical correlations between MgO content and factors affecting the X-ray analytical results, it is believed that the data for these three cements caused MgO to be included in Eqs. 7 and 8.
Free lime. —If systematic errors in free lime measurement can be neglected, the correlation between the C3S content and free lime is probably attributable to a CaO peak at 32.1 deg (2e) (Fig. 2), or a Ca (OH)2 peak at about 34.2 deg (2e), both of which would lie under silicate peaks. Free lime determinations and thermally evolved gas analysis (TEGA) (19) on four of the LTS cements which had been chosen to represent a wide range of free lime indicated that the free lime contents had not changed signif i-cantly since the first measurements were published (10) but that, within experimental error, all the free lime in each cement appeared to be in the form of Ca (OH)2. The presence of a small quantity of free lime in the form of Ca (OH)2 would almost certainly cause C3S to be slightly overestimated and C2S to be slightly underestimated as indicated by Eqs. 7 and 8.
FeO. —'Phe presence of FeO in Eq. 10 is in accord with the idea that FeO in cements can substitute for CaO (17). Its presence would cause the quantity of Fe203 available for C4AF formation to be less than that assumed in the potential compound calculations. This may be the reason for the appearance of FeO in the equation.
Insoluble. —This is an unexpected variable in Eq. 9 since "insoluble" is usually quartz. No plausible explanation-for its appearance can be offered.

252
Summing up, it appears that much of the scatter of the differences between the po-tential and X-ray compound compositions listed in Tables 1 and 2 can be explained in terms of chemical factors. Neither the potential nor the X-ray compound values are likely to be free from errors, though the X-ray method has the advantages of directness and ability to detect abnormalities which might lead to errors.
The Use of QXDA for Routine Analysis
Until now, QXDA has been considered to be solely a research tool. With the methods outlined in this paper, its use for routine compound analysis of cements becomes practical and economical. An X-ray diffractometer can be run for 24 hours a day by a single technician, and the diffraction patterns generated can be rapidly analyzed by computer to provide information which is not attainable in any other way.
A comparison of the costs of compound composition determinations by X-ray diffrac-tion and conventional wet chemical methods is given in Table 5. The corresponding figures for precision are given in Table 3. Even if replicate determinations must be made and averaged to bring the precision of the X-ray method up to the precision of the potential compound determinations, the X-ray method may still be competitive. Substantial reductions in the cost of the X-ray method should result from improvements which are planned. Most important of the planned changes are (a) elimination of the use of weighed quantities of internal standard whenever sufficiently precise information about the compound sum is available from an independent source; (b) reduction of the range scanned; and (c) use of a higher speed computer. It is estimated that these steps will at least halve the cost of each routine X-ray analysis.
SUMMARY
The main points made in the preceding sections may be summarized as follows:
A method for the low-cost, routine quantitative X-ray diffraction analysis (QXDA) of mixtures of crystalline compounds has been developed. Depending on the need, the method can be set up to give either rapid analyses or analyses of high precision. Un-like previous X-ray methods, the new method does not use synthetic cement compounds for its calibration.
The QXDA method has been demonstrated by analyses of a wide range of portland cements from the PCA's LTS and SBR series. The method should be equally applicable to almost any mineral mixture, e.g., slag cement, provided that diffraction patterns of the individual constituents can be obtained.
Through the use of statistical methods, and from a knowledge of their potential compound compositions, the X-ray diffraction patterns of the LTS and SBR cements were analyzed as a group to obtain information about the most representative shapes of the X-ray diffraction patterns of the individual cement compounds in the cements. The derived shapes were used in the curve-fitting procedure which is the basis of the QXDA method.
The generally close correlation between X-ray and potential compound values suggests that the X-ray diffraction patterns of the major cement compounds do not vary much from one cement to another. It appears that the exceptions can be recognized by the QXDA method.
Comparison of compound sums obtained from QXDA and from independent analy-ses suggests strongly that the potential compound composition calculation tends to overestimate C3A. The evidence is entirely independent of calibrations based on syn-thetic compounds.
Statistical analyses suggest that some of the differences between X-ray and po-tential compound compositions may be correlated with minor oxides such as PO5, Na20, and FeO.
It is realized that the work described in this paper leaves many unanswered ques-tions. However, it demonstrates the potential power of the QXDA method to aid the recognition of both quantitative and qualitative differences between portland cements—differences which could not be detected routinely by any previous method.

253
ACKNOWLEDGMENTS
The authors wish to thankJ. P. Giles, president of the American Cement Corpora-tion for granting permission to publish the paper. They also wish to acknowledge their gratitude to S. Brunauer, L. Copeland and D. Kantro of the Portland Cement Associa-tion, and to J. H. Snyder of this Department, for comments which have helped the pro-gress of this research.
REFERENCES
Bogue. Inch Eng. Chem., Anal. Ed., Vol. 1, p. 192, 1929. Copeland, Brunauer, Kantro, Schulz, and Weise. Anal. Chem., Vol. 31, p.1521,
1959. Lea and Parker. Building Res. Tech. Paper No. 16. H. M. Stationery Office,
London,. 1935. Von Euw. Silicates Industr., Vol. 23, p. 643, 1958. Smolczyk. Zement-Kalk-Gips, Vol. 14, p. 558, 1961. Midgley, Rosaman, and Fletcher. Fourth Internat. Symposium on Chem. of
Cement, Washington, 1960. Proc., Vol. 1, p. 69, 1962. Frohnsdorff and Harris. Analysis of Calcareous Materials. S. C. I. Monograph
No. 18, p. 320. Society of Chemical Industry, London, 1964. Frohnsdorff and Harris. Developments in Applied Spectroscopy. Vol. 3, p. 58.
Plenum, New York, 1964. Powers and Brownyard. Jour. ACI (Proc.), Vol. 43, p. 249, 1946. McMillan, Tyler, Hansen, Lerch, Ford, and Brown. Jour. ACI (Proc.), Vol. 44,
pp. 441, 553, 743, 877, 1948; also, PCA Bull. 26, 1948. Kantro, Copeland, Weise, and Brunauer. Quantitative Determination of the
Major Phases in Portland Cements by X-Ray DiffractionMethods. PCA Bull. 166, 1964.
Aitken. Determinants and Matrices. Oliver and Boyd, Edinburgh, 1948, p. 4. Crow, Davis, and Maxfield. Statistics Manual. Dover, New York, 1960. Yamaguchi, Tanaka, and Kajii. Rev. 13th General Meeting, Japan Cement
Engineering Assoc., p. 2, 1959. Takashima and Amano. Rev. 13th General Meeting, Japan Cement Engineering
Assoc., p. 7, 1959. Lea and Nurse. Monograph, Ministry of Supply, Vol. 11, p.70, 1951. Cirilli and Burdese. Proc. Symposiumon Reactivity of Solids, Gothenburg,
Sweden, p. 867, 1952. Forester, Lees, and Moore. Analysis of Calcareous Materials. S. C. I.
Monograph No. 18, p. 447, Society of Chemical Industry, London., 1964. Frohnsdorff. Analysis of Calcareous Materials, S. C. I. Monograph No. 18,
p. 444, Society of Chemical Industry, London, 1964.