Embed Size (px)
Citation preview
Abstract—Due to climate change, in recent years, each
typhoon has easily brought thousands millimeters of rainfall which is too much for the short and narrow rivers in Taiwan to undertake, thus has led to serious disasters. As the wireless network techniques are well developed, we applied such techniques to the monitoring of bridges. It allows managers to get the information of bridge scouring in a short time, and there would be no necessary for managers to visit site in person. Therefore in this research, the research team has developed a wireless network system. Then we’ve conducted some experimental tests in the hydraulic test station to simulate the condition on site. And the experimental pier scouring data could be transmitted to the computer to do further analysis.
Index Terms—Wireless sensor network, scour monitoring system, bridge.
I. INTRODUCTION Due to climate change, the dramatic heavy rain hit
Taiwan’s twenty thousands of bridges with the association of floods. As the turbulent water rush to the bridge piers, the bottom will be scoured and lead to inadequate bearing capacity of soil. And then cause bridges to rupture or collapse, so that the road users’ life and property safety are in danger. As a result, a reliable early warning system is required for bridge management, which can ensure the safety of bridges. Moreover, several events of bridge rupture and collapse in recent years have given rise to the discussion of bridge safety early warning. Monitoring systems have been unceasing improved in many research about bridge scouring monitoring, so that the systems can monitor the bridge but also reduce the damage of equipment after disasters.
In the newsletter of National Center for Research on Earthquake Engineering NO.69 [1], it has mentioned that diagnosing the structure by measuring its vibration reaction has become a thriving field in structural health diagnosis Micro-vibration measurement is to obtain the dynamic characteristics of the structure, such as natural frequency and damping ratio, through system identification method as the structure vibrates by external forces. In the research report of Taiwan Construction Research Institute, it is said that as the structure encounter external force vibration or seismic vibration, the response of the structure will be nonlinear steady state. After measuring the vibration time history of the
Manuscript received March 4, 2013; revised June 6, 2013. Hui-Ping Tserng, Yung-Jui Chang, and You-Ren Lin are with the
Department of Civil Engineering of National Taiwan University, Taiwan (e-mail: [email protected], [email protected], [email protected]).
Shen-Haw Ju and Chung-Wei Feng are with the Department of Civil Engineering of National Cheng Kung University, Taiwan (e-mail: [email protected], [email protected]).
structure, data could be transformed to frequency domain or three-dimensional response spectrum of time, frequency and amplitude by Fast Fourier Transform; in order to obtain the spectrum reaction due to vehicle traveling. And then the frequency variation of piers encountered vibrations could be studied. The main objective is to realize the relationship between pier’s natural frequency and pier’s scour depth. In the view of bridge monitoring, it’s easier to measure the vibration than the scouring condition since the sensor is easier to install and is hard to be destroyed or washed away by water.
In the structural vibration monitoring system, the sensor signals are transmitted to analog-to-digital converter (ADC) mainly through signal lines. The continuous analog data would be converted to discrete data and would be saved and recorded in the monitoring computer. For bridges that are hundreds meters long, signal attenuation would happen. Thus there must be a signal conditioner to amplify the sensor signal and to improve the signal resolution.
II. LITERATURE REVIEW
A. Failure Modes of Bridges Subjected to Flood Scouring The abundant rainfall that entrained by typhoons is getting
more and more intensive. Such short but intensive rainfall could rain more than a thousand millimeters in 24 hours. The narrow rivers in Taiwan could definitely not undertake such rainfall. Water rushes down with rocks and sediment, striking the bridge seriously, and causes the offset or settlement of caisson foundation, piers skew, hollowed-out abutment or bridge collapse. Table I has listed some of the bridge disasters in Taiwan caused by intense rainfall.
TABLE I: BRIDGE DISASTER
Disaster Event
Typhoon Morakot,
2009
Disaster Event
Typhoon Morakot,
2009
Disaster Event
Typhoon Morakot,
2009
Bridge Name
Shuang-yuan
Bridge
Bridge Name
Da-jin Bridge
Bridge Name
Da-zhou Bridge
Photo Photo Photo
B. Existing Bridge Monitoring Techniques Bridge is an important lifeline. Once it’s damaged, it may
have significant impact on relief supplies delivery, injured people evacuation or reconstruction. Therefore, many
Application of Wireless Sensor Network to the Scour Monitoring System of Remote Bridges
Hui-Ping Tserng, Shen-Haw Ju, Chung-Wei Feng, Yung-Jui Chang, and You-Ren Lin
IACSIT International Journal of Engineering and Technology, Vol. 5, No. 5, October 2013
641DOI: 10.7763/IJET.2013.V5.633
techniques to monitor different bridges are developed. Table II is the comparison between existing bridge monitoring techniques in Taiwan [2].
TABLE II: COMPARISON BETWEEN EXISTING BRIDGE MONITORING TECHNIQUES
Monitoring
Domain Techniques
Apply Wireless Network
Forced Deformation Monitoring
Scour Monitoring
Displacement Monitoring
Close Range Photogrammetry[3] ★ ★
Steel Cable Monitoring for Stayed Bridges[4]
★ ★
Bridge Strain Monitoring[5] ★ ★
Scour Warning Monitoring [6]
★ ★ ★ ★
Safety Caution-Notifying of the Monitoring System for Railroad Bridge[7]
★ ★
Forced Deformation Monitoring for Bridges[8]
★
This Research[9] ★ ★ ★ ★
III. BRIDGE MONITORING DEVICES
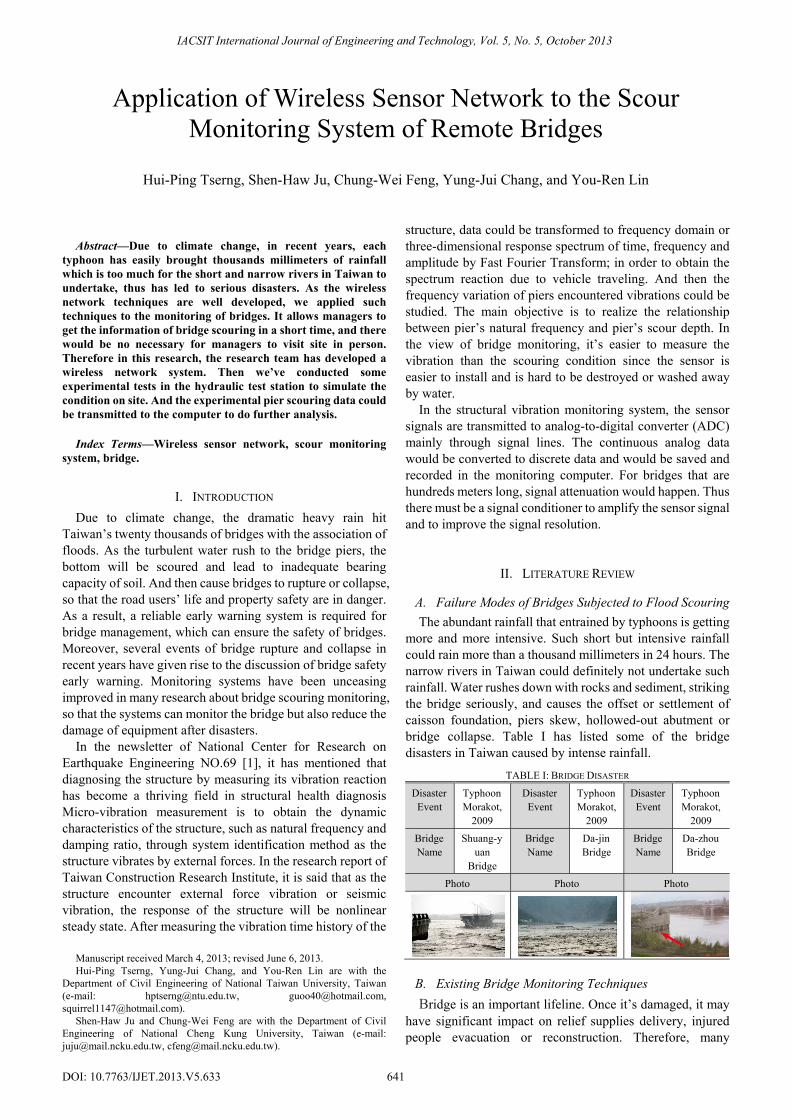
A. Development of the Wireless Network System In this research, first the hardware, including
accelerometer, GPS, sensor circuit board and the wireless sensor network (WSN), would be selected. Next, we examine and select the measurement range and network topology according to the monitoring requirement. Finally, after the hardware is linked together, the program of data receiving would be developed. The development process is shown in Fig. 1.
Fig. 1. Development flowchart of the wireless monitoring system in this
research
The star network topology, which is the simpler transmission pattern, is adopted in this research. The hardware architecture includes two end devices and one coordinator, as shown in the Fig. 2. Each end device is connected to two accelerometers, one for X-axis and the other for Y-axis, and one GPS chip. Accelerometer would measure the vibration frequency of the structure and then GPS would provide accurate standard time for each data packet. Finally, the coordinator would collect data and transmit it in the form of RS232 or USB output to the computer.
Fig. 2. The hardware architecture
B. Wireless Sensor Node The wireless sensor node used in this research contains
two parts, transmission module and sensor circuit board. The sensor would output a continuous change in voltage when it encounters perturbation. Through the analog-to-digital converter (ADC) on the sensor circuit board, this continuous analog signal could be converted to discrete digital data. Then the radio frequency chip on the transmission module would transmit data through the network transmission route that have already been established. After the coordinator in the receiving end receives data also through the radio frequency chip, data could be output through wire such as USB or RS232. The transmission flowchart is shown as Fig. 3 [10].
Fig. 3. The flowchart of data transmission
For the transmission module, we use the Supernode Wireless Sensor Network (WSN) platform developed by Department of Engineering Science and Ocean Science, National Taiwan University, as shown in the Fig. 4. The platform is equipped with the UZ2400 wireless radio frequency chip developed by Uniband Electronic Corporation (UBEC) and uses the communication protocol of IEEE 802.15.4, which is suitable for establishing large-scale sensor network [11].
IACSIT International Journal of Engineering and Technology, Vol. 5, No. 5, October 2013
642
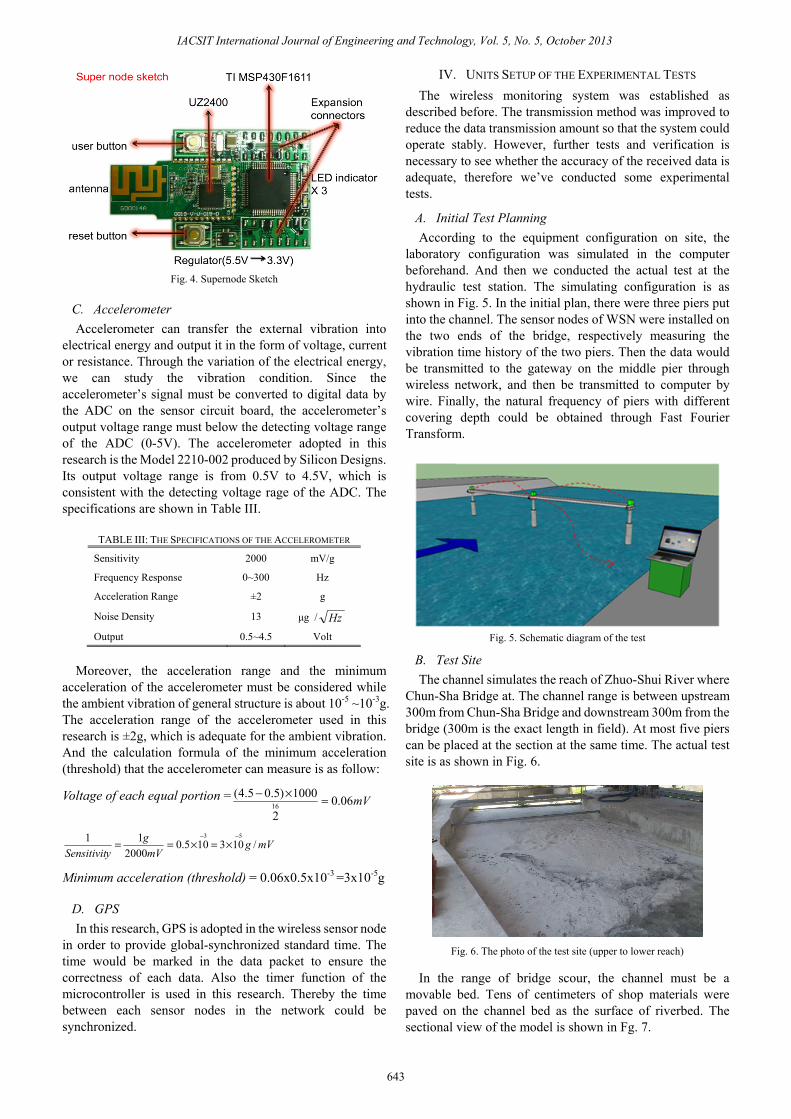
Fig. 4. Supernode Sketch
C. Accelerometer Accelerometer can transfer the external vibration into
electrical energy and output it in the form of voltage, current or resistance. Through the variation of the electrical energy, we can study the vibration condition. Since the accelerometer’s signal must be converted to digital data by the ADC on the sensor circuit board, the accelerometer’s output voltage range must below the detecting voltage range of the ADC (0-5V). The accelerometer adopted in this research is the Model 2210-002 produced by Silicon Designs. Its output voltage range is from 0.5V to 4.5V, which is consistent with the detecting voltage rage of the ADC. The specifications are shown in Table III.
TABLE III: THE SPECIFICATIONS OF THE ACCELEROMETER
Sensitivity 2000 mV/g
Frequency Response 0~300 Hz
Acceleration Range ±2 g
Noise Density 13 μg / Hz
Output 0.5~4.5 Volt
Moreover, the acceleration range and the minimum
acceleration of the accelerometer must be considered while the ambient vibration of general structure is about 10-5 ~10-3g. The acceleration range of the accelerometer used in this research is ±2g, which is adequate for the ambient vibration. And the calculation formula of the minimum acceleration (threshold) that the accelerometer can measure is as follow:
Voltage of each equal portion = mV06.02
1000)5.05.4(16 =×−
mVgmV
gySensitivit
/103105.02000
11 53 −−×=×==
Minimum acceleration (threshold) = 0.06x0.5x10-3 =3x10⁻⁵g
D. GPS In this research, GPS is adopted in the wireless sensor node
in order to provide global-synchronized standard time. The time would be marked in the data packet to ensure the correctness of each data. Also the timer function of the microcontroller is used in this research. Thereby the time between each sensor nodes in the network could be synchronized.
IV. UNITS SETUP OF THE EXPERIMENTAL TESTS The wireless monitoring system was established as
described before. The transmission method was improved to reduce the data transmission amount so that the system could operate stably. However, further tests and verification is necessary to see whether the accuracy of the received data is adequate, therefore we’ve conducted some experimental tests.
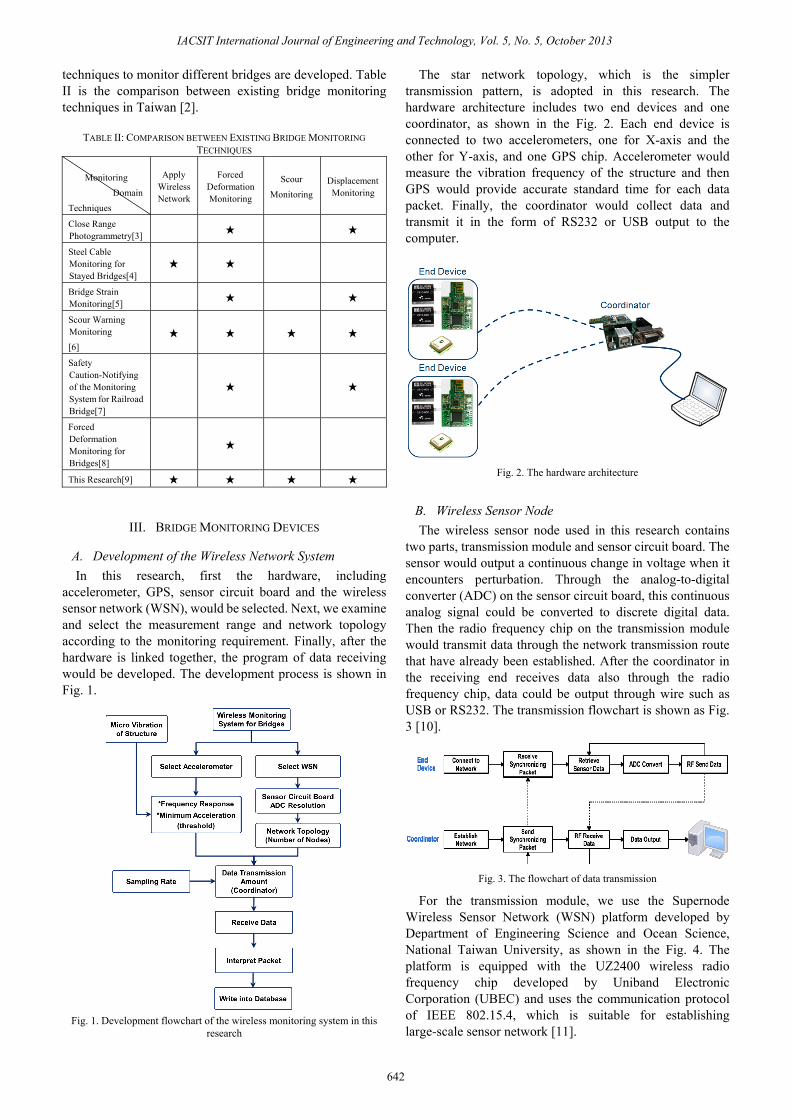
A. Initial Test Planning According to the equipment configuration on site, the
laboratory configuration was simulated in the computer beforehand. And then we conducted the actual test at the hydraulic test station. The simulating configuration is as shown in Fig. 5. In the initial plan, there were three piers put into the channel. The sensor nodes of WSN were installed on the two ends of the bridge, respectively measuring the vibration time history of the two piers. Then the data would be transmitted to the gateway on the middle pier through wireless network, and then be transmitted to computer by wire. Finally, the natural frequency of piers with different covering depth could be obtained through Fast Fourier Transform.
Fig. 5. Schematic diagram of the test
B. Test Site The channel simulates the reach of Zhuo-Shui River where
Chun-Sha Bridge at. The channel range is between upstream 300m from Chun-Sha Bridge and downstream 300m from the bridge (300m is the exact length in field). At most five piers can be placed at the section at the same time. The actual test site is as shown in Fig. 6.
Fig. 6. The photo of the test site (upper to lower reach)
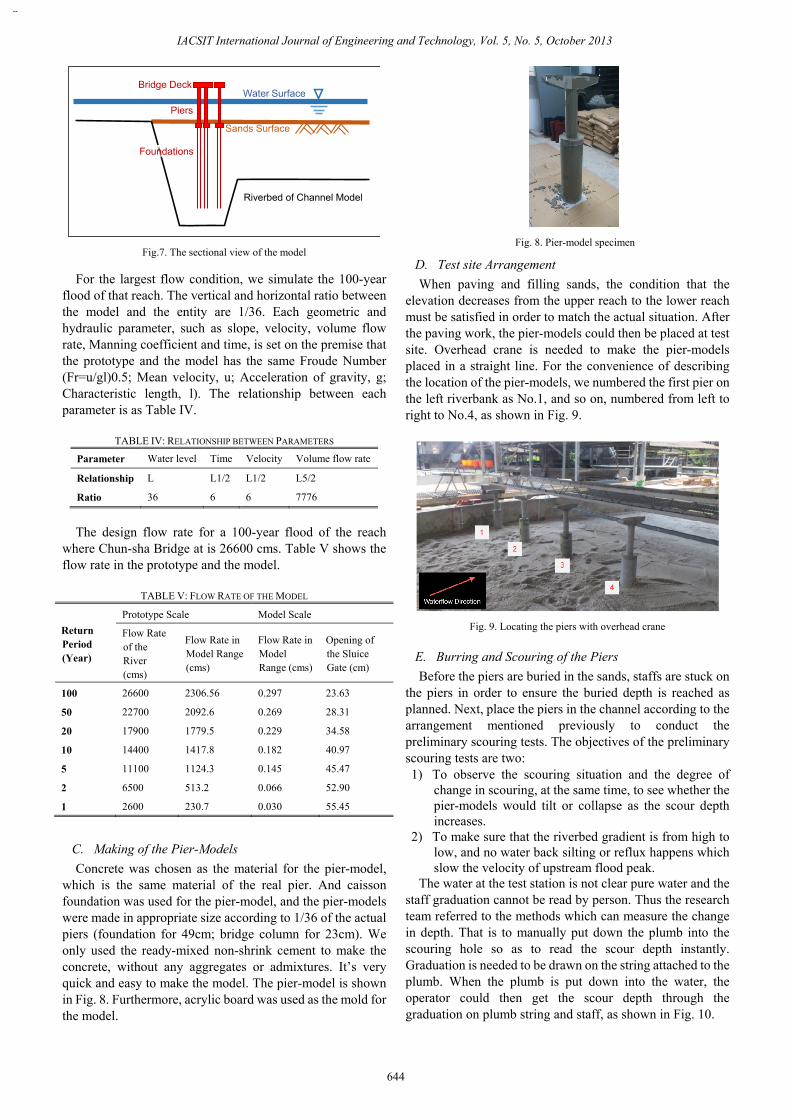
In the range of bridge scour, the channel must be a
movable bed. Tens of centimeters of shop materials were paved on the channel bed as the surface of riverbed. The sectional view of the model is shown in Fg. 7.
IACSIT International Journal of Engineering and Technology, Vol. 5, No. 5, October 2013
643
IACSIT International Journal of Engineering and Technology, Vol. 5, No. 5, October 2013
644
Riverbed of Channel Model
Sands Surface
Foundations
Bridge Deck
Piers
Water Surface
Fig.7. The sectional view of the model
For the largest flow condition, we simulate the 100-year flood of that reach. The vertical and horizontal ratio between the model and the entity are 1/36. Each geometric and hydraulic parameter, such as slope, velocity, volume flow rate, Manning coefficient and time, is set on the premise that the prototype and the model has the same Froude Number (Fr=u/gl)0.5; Mean velocity, u; Acceleration of gravity, g; Characteristic length, l). The relationship between each parameter is as Table IV.
TABLE IV: RELATIONSHIP BETWEEN PARAMETERS
Parameter Water level Time Velocity Volume flow rate
Relationship L L1/2 L1/2 L5/2
Ratio 36 6 6 7776
The design flow rate for a 100-year flood of the reach where Chun-sha Bridge at is 26600 cms. Table V shows the flow rate in the prototype and the model.
TABLE V: FLOW RATE OF THE MODEL
Return Period (Year)
Prototype Scale Model Scale
Flow Rate of the River (cms)
Flow Rate in Model Range (cms)
Flow Rate in Model Range (cms)
Opening of the Sluice Gate (cm)
100 26600 2306.56 0.297 23.63
50 22700 2092.6 0.269 28.31
20 17900 1779.5 0.229 34.58
10 14400 1417.8 0.182 40.97
5 11100 1124.3 0.145 45.47
2 6500 513.2 0.066 52.90
1 2600 230.7 0.030 55.45
C. Making of the Pier-Models Concrete was chosen as the material for the pier-model,
which is the same material of the real pier. And caisson foundation was used for the pier-model, and the pier-models were made in appropriate size according to 1/36 of the actual piers (foundation for 49cm; bridge column for 23cm). We only used the ready-mixed non-shrink cement to make the concrete, without any aggregates or admixtures. It’s very quick and easy to make the model. The pier-model is shown in Fig. 8. Furthermore, acrylic board was used as the mold for the model.
Fig. 8. Pier-model specimen
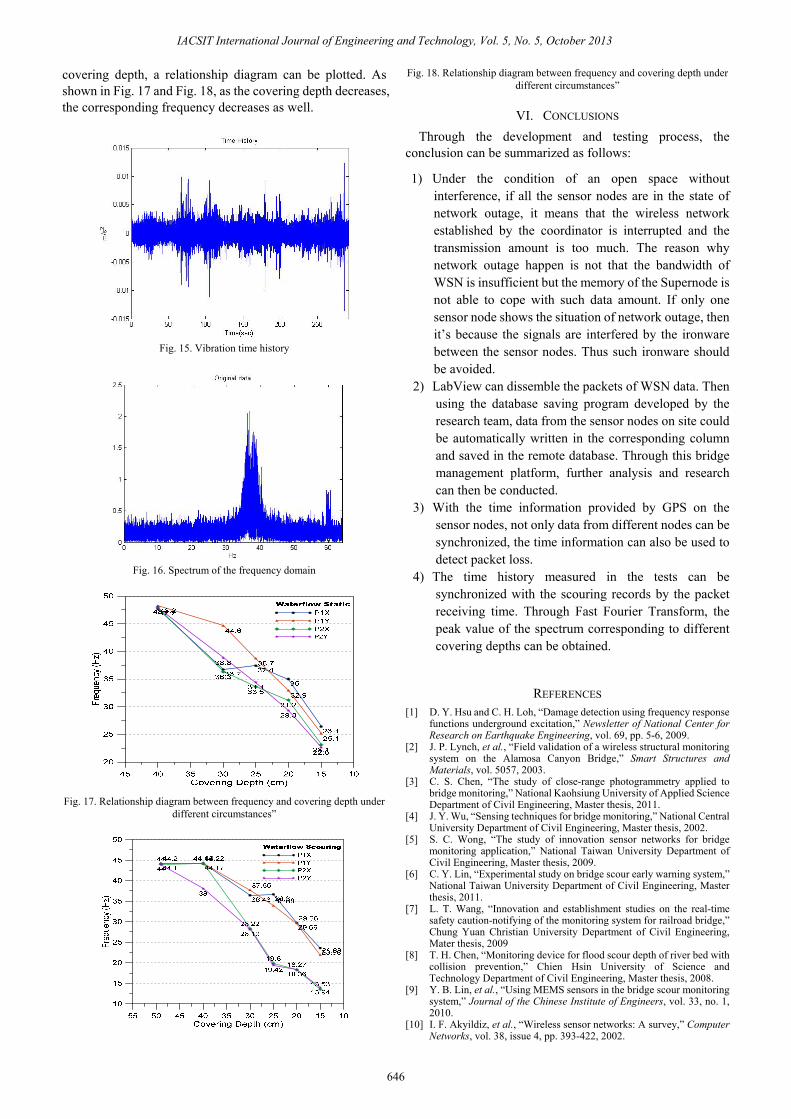
D. Test site Arrangement When paving and filling sands, the condition that the
elevation decreases from the upper reach to the lower reach must be satisfied in order to match the actual situation. After the paving work, the pier-models could then be placed at test site. Overhead crane is needed to make the pier-models placed in a straight line. For the convenience of describing the location of the pier-models, we numbered the first pier on the left riverbank as No.1, and so on, numbered from left to right to No.4, as shown in Fig. 9.
Fig. 9. Locating the piers with overhead crane
E. Burring and Scouring of the Piers Before the piers are buried in the sands, staffs are stuck on
the piers in order to ensure the buried depth is reached as planned. Next, place the piers in the channel according to the arrangement mentioned previously to conduct the preliminary scouring tests. The objectives of the preliminary scouring tests are two: 1) To observe the scouring situation and the degree of
change in scouring, at the same time, to see whether the pier-models would tilt or collapse as the scour depth increases.
2) To make sure that the riverbed gradient is from high to low, and no water back silting or reflux happens which slow the velocity of upstream flood peak.
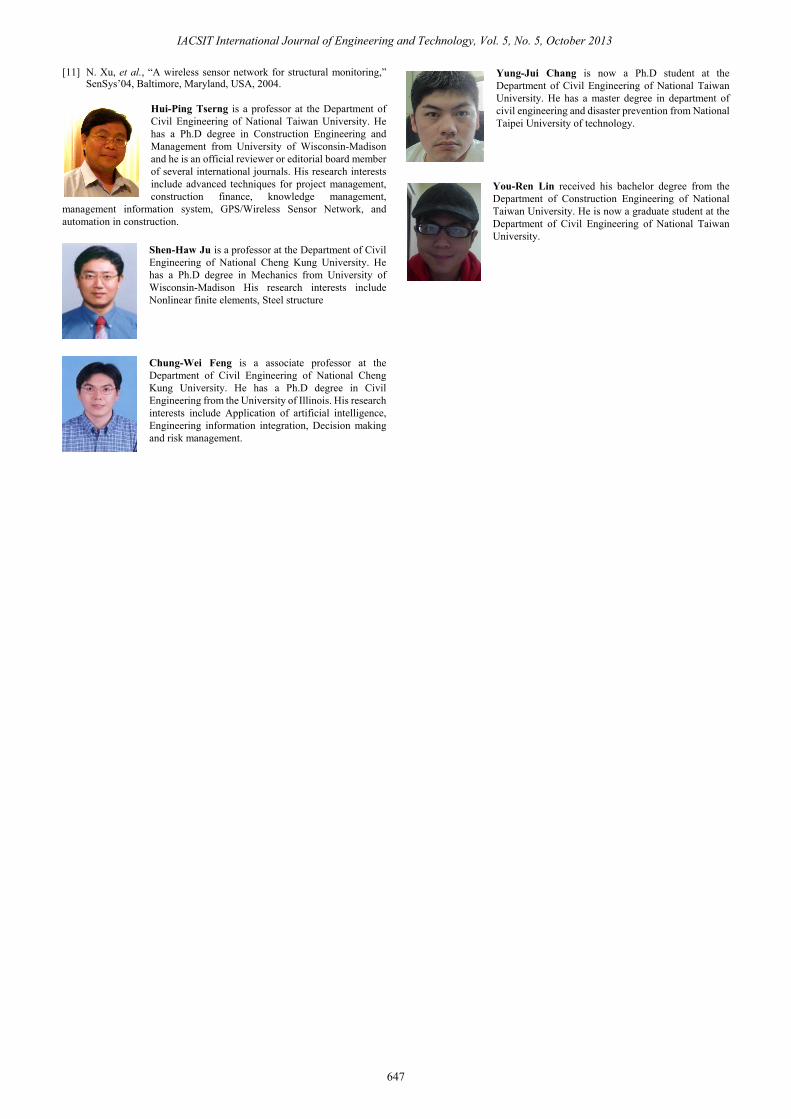
The water at the test station is not clear pure water and the staff graduation cannot be read by person. Thus the research team referred to the methods which can measure the change in depth. That is to manually put down the plumb into the scouring hole so as to read the scour depth instantly. Graduation is needed to be drawn on the string attached to the plumb. When the plumb is put down into the water, the operator could then get the scour depth through the graduation on plumb string and staff, as shown in Fig. 10.
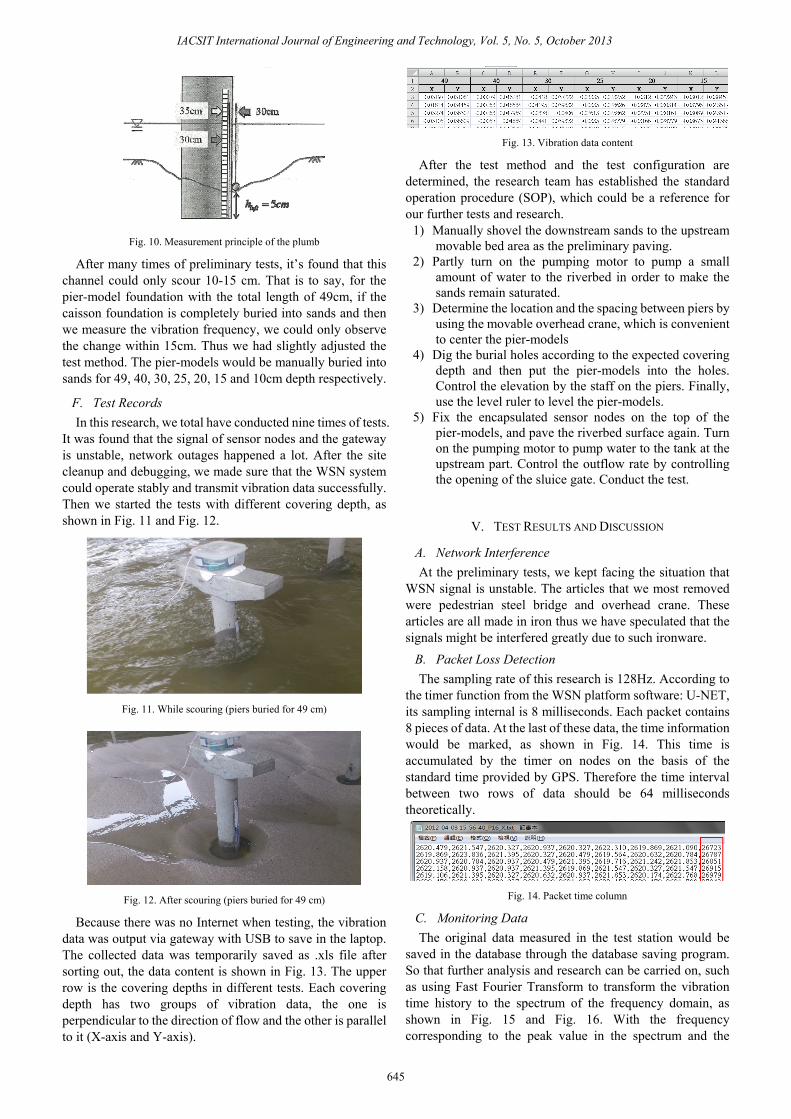
Fig. 10. Measurement principle of the plumb
After many times of preliminary tests, it’s found that this channel could only scour 10-15 cm. That is to say, for the pier-model foundation with the total length of 49cm, if the caisson foundation is completely buried into sands and then we measure the vibration frequency, we could only observe the change within 15cm. Thus we had slightly adjusted the test method. The pier-models would be manually buried into sands for 49, 40, 30, 25, 20, 15 and 10cm depth respectively.
F. Test Records In this research, we total have conducted nine times of tests.
It was found that the signal of sensor nodes and the gateway is unstable, network outages happened a lot. After the site cleanup and debugging, we made sure that the WSN system could operate stably and transmit vibration data successfully. Then we started the tests with different covering depth, as shown in Fig. 11 and Fig. 12.
Fig. 11. While scouring (piers buried for 49 cm)
Fig. 12. After scouring (piers buried for 49 cm)
Because there was no Internet when testing, the vibration data was output via gateway with USB to save in the laptop. The collected data was temporarily saved as .xls file after sorting out, the data content is shown in Fig. 13. The upper row is the covering depths in different tests. Each covering depth has two groups of vibration data, the one is perpendicular to the direction of flow and the other is parallel to it (X-axis and Y-axis).
Fig. 13. Vibration data content
After the test method and the test configuration are determined, the research team has established the standard operation procedure (SOP), which could be a reference for our further tests and research.
1) Manually shovel the downstream sands to the upstream movable bed area as the preliminary paving.
2) Partly turn on the pumping motor to pump a small amount of water to the riverbed in order to make the sands remain saturated.
3) Determine the location and the spacing between piers by using the movable overhead crane, which is convenient to center the pier-models
4) Dig the burial holes according to the expected covering depth and then put the pier-models into the holes. Control the elevation by the staff on the piers. Finally, use the level ruler to level the pier-models.
5) Fix the encapsulated sensor nodes on the top of the pier-models, and pave the riverbed surface again. Turn on the pumping motor to pump water to the tank at the upstream part. Control the outflow rate by controlling the opening of the sluice gate. Conduct the test.
V. TEST RESULTS AND DISCUSSION
A. Network Interference At the preliminary tests, we kept facing the situation that
WSN signal is unstable. The articles that we most removed were pedestrian steel bridge and overhead crane. These articles are all made in iron thus we have speculated that the signals might be interfered greatly due to such ironware.
B. Packet Loss Detection The sampling rate of this research is 128Hz. According to
the timer function from the WSN platform software: U-NET, its sampling internal is 8 milliseconds. Each packet contains 8 pieces of data. At the last of these data, the time information would be marked, as shown in Fig. 14. This time is accumulated by the timer on nodes on the basis of the standard time provided by GPS. Therefore the time interval between two rows of data should be 64 milliseconds theoretically.
Fig. 14. Packet time column
C. Monitoring Data The original data measured in the test station would be
saved in the database through the database saving program. So that further analysis and research can be carried on, such as using Fast Fourier Transform to transform the vibration time history to the spectrum of the frequency domain, as shown in Fig. 15 and Fig. 16. With the frequency corresponding to the peak value in the spectrum and the
IACSIT International Journal of Engineering and Technology, Vol. 5, No. 5, October 2013
645
covering depth, a relationship diagram can be plotted. As shown in Fig. 17 and Fig. 18, as the covering depth decreases, the corresponding frequency decreases as well.
Fig. 15. Vibration time history
Fig. 16. Spectrum of the frequency domain
Fig. 17. Relationship diagram between frequency and covering depth under different circumstances”
Fig. 18. Relationship diagram between frequency and covering depth under different circumstances”
VI. CONCLUSIONS Through the development and testing process, the
conclusion can be summarized as follows:
1) Under the condition of an open space without interference, if all the sensor nodes are in the state of network outage, it means that the wireless network established by the coordinator is interrupted and the transmission amount is too much. The reason why network outage happen is not that the bandwidth of WSN is insufficient but the memory of the Supernode is not able to cope with such data amount. If only one sensor node shows the situation of network outage, then it’s because the signals are interfered by the ironware between the sensor nodes. Thus such ironware should be avoided.
2) LabView can dissemble the packets of WSN data. Then using the database saving program developed by the research team, data from the sensor nodes on site could be automatically written in the corresponding column and saved in the remote database. Through this bridge management platform, further analysis and research can then be conducted.
3) With the time information provided by GPS on the sensor nodes, not only data from different nodes can be synchronized, the time information can also be used to detect packet loss.
4) The time history measured in the tests can be synchronized with the scouring records by the packet receiving time. Through Fast Fourier Transform, the peak value of the spectrum corresponding to different covering depths can be obtained.
REFERENCES [1] D. Y. Hsu and C. H. Loh, “Damage detection using frequency response
functions underground excitation,” Newsletter of National Center for Research on Earthquake Engineering, vol. 69, pp. 5-6, 2009.
[2] J. P. Lynch, et al., “Field validation of a wireless structural monitoring system on the Alamosa Canyon Bridge,” Smart Structures and Materials, vol. 5057, 2003.
[3] C. S. Chen, “The study of close-range photogrammetry applied to bridge monitoring,” National Kaohsiung University of Applied Science Department of Civil Engineering, Master thesis, 2011.
[4] J. Y. Wu, “Sensing techniques for bridge monitoring,” National Central University Department of Civil Engineering, Master thesis, 2002.
[5] S. C. Wong, “The study of innovation sensor networks for bridge monitoring application,” National Taiwan University Department of Civil Engineering, Master thesis, 2009.
[6] C. Y. Lin, “Experimental study on bridge scour early warning system,” National Taiwan University Department of Civil Engineering, Master thesis, 2011.
[7] L. T. Wang, “Innovation and establishment studies on the real-time safety caution-notifying of the monitoring system for railroad bridge,” Chung Yuan Christian University Department of Civil Engineering, Mater thesis, 2009
[8] T. H. Chen, “Monitoring device for flood scour depth of river bed with collision prevention,” Chien Hsin University of Science and Technology Department of Civil Engineering, Master thesis, 2008.
[9] Y. B. Lin, et al., “Using MEMS sensors in the bridge scour monitoring system,” Journal of the Chinese Institute of Engineers, vol. 33, no. 1, 2010.
[10] I. F. Akyildiz, et al., “Wireless sensor networks: A survey,” Computer Networks, vol. 38, issue 4, pp. 393-422, 2002.
IACSIT International Journal of Engineering and Technology, Vol. 5, No. 5, October 2013
646
[11] N. Xu, et al., “A wireless sensor network for structural monitoring,” SenSys’04, Baltimore, Maryland, USA, 2004.
Hui-Ping Tserng is a professor at the Department of Civil Engineering of National Taiwan University. He has a Ph.D degree in Construction Engineering and Management from University of Wisconsin-Madison and he is an official reviewer or editorial board member of several international journals. His research interests include advanced techniques for project management, construction finance, knowledge management,
management information system, GPS/Wireless Sensor Network, and automation in construction.
Shen-Haw Ju is a professor at the Department of Civil Engineering of National Cheng Kung University. He has a Ph.D degree in Mechanics from University of Wisconsin-Madison His research interests include Nonlinear finite elements, Steel structure
Chung-Wei Feng is a associate professor at the Department of Civil Engineering of National Cheng Kung University. He has a Ph.D degree in Civil Engineering from the University of Illinois. His research interests include Application of artificial intelligence, Engineering information integration, Decision making and risk management.
Yung-Jui Chang is now a Ph.D student at the Department of Civil Engineering of National Taiwan University. He has a master degree in department of civil engineering and disaster prevention from National Taipei University of technology.
You-Ren Lin received his bachelor degree from the Department of Construction Engineering of National Taiwan University. He is now a graduate student at the Department of Civil Engineering of National Taiwan University.
IACSIT International Journal of Engineering and Technology, Vol. 5, No. 5, October 2013
647